turkey - arena faktoring · factoring *affirmed by japan credit rating ... institutions’ that is...
TRANSCRIPT

TURKEY
Publication Date: July 3, 2017 “Global Knowledge supported by Local Experience” Copyright © 2007 by JCR Eurasia Rating. 19 Mayıs Mah., 19 Mayıs Cad., Nova Baran Plaza No:4 Kat: 12 Şişli-İSTANBUL Telephone: +90(212)352.56.73 Fax: +90 (212)
352.56.75 Reproduction is prohibited except by permission. All rights reserved. All information has been obtained from sources JCR Eurasia Rating believes to be reliable.
However, JCR Eurasia Rating does not guarantee the truth, accuracy and adequacy of this information. JCR Eurasia Rating ratings are objective and independent opinions as to
the creditworthiness of a security and issuer and not to be considered a recommendation to buy, hold or sell any security or to issue a loan. This rating report has been composed
within the methodologies registered with and certified by the SPK (CMB-Capital Markets Board of Turkey), BDDK (BRSA-Banking Regulation and Supervision Agency) and
internationally accepted rating principles and guidelines but is not covered by NRSRO regulations. http://www.jcrer.com.tr
Corporate Credit & Issue Rating
Non-Banking Financial Institution Factoring
*Affirmed by Japan Credit Rating Agency, JCR on October 7, 2016
Analyst: Utku KARAGÜLLE/ +90 212 352 56 73 [email protected]
Long Term
Short Term
Inte
rnational
Foreign Currency BBB- A-3
Local Currency BBB- A-3
Outlook FC Stable Stable
LC Stable Stable
Issue Rating N/A N/A
National Local Rating BBB- (Trk) A–3 (Trk)
Outlook Stable Stable
Issue Rating BBB- (Trk) A–3 (Trk)
Sponsor Support 3 -
Stand Alone B -
Sovere
ign*
Foreign currency BBB- -
Local currency BBB- -
Outlook FC Stable -
LC Stable -
ARENA FAKTORİNG A.Ş.
F i n a n c i a l D a t a 2017Q1 2016* 2015* 2014* 2013*
Total Assets (000 USD) 29.186 52.304 13.908 31.625 28.908
Total Assets (000 TRY) 106.125 184.068 40.438 73.334 61.586
Equity (000 TRY) 15.934 16.372 14.603 17.186 17.154
Net Profit (000 TRY) -437 1.764 -5.677 32 1.398
Market Share (%) N/A 0,56 0,15 0,28 0,28
ROAA (%) N/A 1,96 -10,55 0,08 3,19
ROAE (%) N/A 14,17 -37,77 0,33 9,92
Equity/Assets (%) 15,01 8,89 36,11 23,43 27,85
NPL (%) 4,77 2,51 20,49 10,97 9,66
Growth Rate (%) -42,35 355,18 -44,86 19,08 47,41
*End of year
Company Overview
Arena Faktoring Anonim Şirketi (hereinafter referred to as ‘Arena Faktoring’, or ‘the Company’) was founded in 2009, by Hitay Holding, one of the famous investment group in Turkey rooting back to 1980. After 6 years of operations, Hitay Group exited from Arena Faktoring and the shares are bought by the shareholders of Tera Menkul Degerler A.Ş. (Tera Yatırım), widely-known brokerage firm in Turkey. Arena Faktoring had paused its operations during the exchange of shares in 2015, which lasted 7 months. The Company operates through its headquarters located in Istanbul and one branch in capital, Ankara. Arena Faktoring promises and carries out factoring operations, receivable and cash management services. The Company is a member of ‘Association of Financial Institutions’ that is a professional organization of factoring, leasing and financing companies of Turkey. The activities of the Company are regulated and supervised by the Banking Regulation and Supervision Agency (BRSA). The Company had a total asset size of TRY184mn, and a 0.56% asset share in the factoring sector worth a total of TRY 33.09bn in FYE2016. As of December 31, 2016, the Company employed an average workforce of 29 (December 31, 2015: 27).
Strengths
• Strong asset growth in 2016
• Grabbing more market share compared to the previous
years
• Decline in NPL ratio and good performance over the sector
average
• Increased level of loss reserves to decrease the burden of
overdue receivables on the equity.
• Successful track record of new shareholders in financial
markets and experienced management team
• Diversified funding mix with bond issuances
Constraints
• High level of indebtedness due to financing the assets
primarily with debt points out need for capital injection
• Single-counterparty credit risk threatening the stability of
performance
• High level of operational costs which floats above the sector
averages
• Small scale of business that present an obstacle for economies
of scale
• Macroeconomic uncertainties arising from the tensions &
conflicts in the local political environment
• Intensive competitive environment dominated by bank-owned
companies which have comparative advantage with wide
branch network and low borrowing costs
0,56
0,150,280,280,23
0,00
1,00
Market Share (%)
355
-451947-18
-500
0
500
Growth Rate (%)
1,96-
10,55
0,083,196,74
-20,00
0,00
20,00
ROAA (%)
14
-3801021
-100
0
100
ROAE (%)
9
36
232838
0
50
20162015201420132012
Equity/Assets (%)
2,5
20,511,09,714,6
0,00
50,00
20162015201420132012
NPL (%)

Factoring
ARENA FAKTORİNG A.Ş. 2
1. Rating Rationale The Turkish Factoring Sector has been regulated and supervised by the Banking Regulation and Supervision Agency (BRSA) since 2006. The Financial Leasing, Factoring and Financing Companies Law No. 6361 came into effect on December 13, 2012. Moreover, a regulation regarding organization and operating principals of financial leasing, factoring and financing companies entered into force on April 24, 2013. As of FYE 2016, the total asset size of the Turkish Factoring Sector was TRY 33.09bn and includes 61 factoring companies, three of which were publicly traded on the
Borsa İstanbul (BIST) national market.
This analysis is based on the Company’s consolidated independent audit report prepared in conformity with BRSA regulations, statistical data on the sector produced by BRSA and updated by JCR Eurasia Rating according to own studies and records. Furthermore, clarifications by the management and their projections were also incorporated into the report. The ratings assigned by JCR Eurasia Rating for Arena Faktoring are a reflection of the Company’s independent audit reports prepared in conformity with Turkish Financial Reporting Standards (TFRS), on and off-balance sheet figures, general market conditions in its fields of activity, information and clarifications provided by the Company, and non-financial figures. The performance of the Turkish factoring system is directly related to domestic macroeconomic conditions. The recent political turmoil and public unrest have clearly demonstrated that political risk is very significant and a key component of financial market analysis. The factoring sector in Turkey boasts solid credit metrics. Arena Faktoring’s balance sheet composition, liquidity profile, solvency indicators, the capitalization level and cash capital injections, asset quality, risk management policies, the management and ownership profile have been taken into consideration for assigning the long term national and international local and foreign currency grades. Fundamental rating considerations are as below; Strong Asset Growth in 2016 Arena Faktoring’s growth rate for 2016 was 355.18%, almost quadrupling its total assets. Main reason behind the skyrocketing of yearly based asset size was the fact that during the 2015, Arena Faktoring operated 5 out of 12 months. Thus, the Company’s total assets displayed a sharp decline in 2015 by 44.86% and the assets boosted in 2016 after the completion of acquisition process. Nevertheless, the skyrocketing in asset size is a clear
demonstration of the desire of new shareholders to enhance the business and operations. Grabbing More Market Share Compared to the Previous
Years
Market share of Arena Faktoring, calculated based on asset size, increased from 0.15% to 0.56% in 2016. Obviously, the increase was emanated from the solid asset growth achieved in 2016 and the poor performance in 2015. However, the Company’s market share was floating around 0.28% in the years before 2015. So that the Company’s growth in market share outperformed the results of previous years and is an indicator of the target of the Company to be an important player in the sector. Diversified Funding Structure Through Bond Issuances Arena Faktoring’s borrowing structure has been diversified through capital market instruments such as bonds. The bond issuances, particularly in financial sector, present the advantages of agility in financing, lowering the exposure of foreign exchange losses, reducing funding costs and relief from the burden of collaterals on bank loans. Bond issuances helps the Company to enjoy an effective liquidity management. Decline in NPL Ratio and Good Performance Over the Sector Average Following the change in shareholder structure, the Company’s NPL ratio dropped from 20.49% to 2.51% as of FYE2016. The decline is mainly driven by the write off via selling receivables to Sumer Varlık Yönetim A.Ş.. On the other hand, strong growth in asset size helped the ratio to be decreased. All in all, the ratio went down quite below the sector average improvement in NPL ratio helped the Company to maintain a strong asset quality. Relief on Equity by Higher Loss Reserves for Non-Performing Loans The Company’s allowances for overdue receivables was at the level of 81.27% in 2015. This figure increased to 90.07% in 2016 and surpassed the sector average by 5%. The incline of the loss reserves helped the Company to decrease the pressure on the equity and enhanced the asset quality.
Successful Track Record of New Shareholders in Financial
Markets and Experienced Management Team
Current shareholders bought the stocks from former owner of the Company, a private equity firm named Hitay Group. New shareholders are owner of Tera Menkul Degerler A.Ş. which has long-lasting successful operations in financial markets and is one of the pioneers in the field of investment market in Turkey. The experience and the enthusiasm new shareholders have is expected to have a positive contribution to the Company. In addition, the Company’s new CEO and the top

Factoring
ARENA FAKTORİNG A.Ş. 3
management have a strong experience in the financial markets and factoring sector. High Indebtedness Level that Points out Need for Capital Injection Once the redistribution of the shares is completed in late 2015, new strategy of Arena Faktoring has been put in place that the growth become primary issue in the agenda. In 2016, the Company rapidly increased its factoring receivables base with an increase around 4 times of the previous year’s. On the other hand, the Company’s paid-in capital stayed same as 2015. Therefore, Arena Faktoring’s equity to total assets ratio declined to 8.89% as of FYE2016 that indicates a low level of capital compared to the sector average. So that the Company achieved high growth rate by financing its assets primarily with debt. The low level of equity over total resources indicates a fragility on the balance sheet. Although the Company’s paid-in capital is adequate in terms of minimum required level forced by regulators, the equity is below the threshold due to the retained losses. Therefore, the Company needs a capital injection in the following periods. High Level of Single-Counterparty Credit Risk The customer base of the Company has been restructured amid the change in shareholding structure in 2015. Since the Company paused its operations for 7 months in the aforementioned year, new customer base has rebuilt in 2016. In 2016, Arena Faktoring has reached to total number of active customers of 437 as of May 2017. However, as of FYE2016, the 39.2% of the total receivables is carried by one company, which operates in automotive sector. Although the Company’s exposure to single-party risk is high, there is no sign of a realization of single-party default risk, based on the solvency of the clientele. On the other hand, the high portion of one-company in the portfolio causes Arena Faktoring to have an instability in balance sheet and growth projections High Level of Operational Costs Compared to the Sector Although Arena Faktoring declined its operational costs, the figures continued to float above the sector average in 2016. Operational inefficiency is mainly caused by the restructuring process after the change in shareholder structure. As long as the Company achieves more sales and income per employee, ratio of operational costs is expected to be declined in the future. Small Scale of Business that Present an Obstacle for Economies of Scale As stated above, the Company’s operational efficiency is below the expected level due to the fact that total turnover and asset size is small to utilize the operational resources proficiently. Considering the fact that the Arena Faktoring was restructured after the acquisition by new shareholders, small scale of the Company for the year of 2016 is within acceptable level. On the other
hand, Arena Faktoring should increase its base to achieve operational efficiency to increase profitability. Macroeconomic indicators and slowdown in growth rates Deterioration in inflation and current account deficit, unrest in the Middle East, tension of constitutional referendum held in April 16th of 2017, possible increases in the future cost of borrowing due to rate hikes by the Federal Reserve, and subsequent reduction of inflows into emerging economies as well as rising levels of unemployment and regional tensions are expected to lead to a slowdown in economic growth throughout 2017. Such developments are expected to negatively affect the demand for factoring services and potentially raise the share of non-performing loans. Besides, the financing costs are also expected to be increased due to the market conditions. Intensive Competitive Environment As of FYE2016, there were 61 companies operating in the sector according to BRSA data while the domination of bank affiliated companies persisted due to their competitive advantage in easy access to a large clientele of banks in a large geographical area, funding sources and lower borrowing cost. The bank-owned factoring companies hold a competitive advantage against non-bank-owned ones, such as Arena Faktoring. With respect to the factors mentioned above, JCR Eurasia Rating has assigned the Long Term International Foreign Currency and Local Currency Ratings of Arena Faktoring as ‘BBB-’ and the Long Term National Local Rating as ‘BBB- (Trk)’ in JCR Eurasia Rating’s notation system. As it is not expected to be provided additional legal and/or financial collateral guarantees for the bonds to be issued by the Company, the note assigned for the TRY dominated bond issuance has been assigned as the same as the Company's Long and Short Term National Local Ratings. The Company’s ratings are summarized in the chart below.
BBB-
BBB-
BBB- (Trk)
BBB- (Trk)BBB-
BBB-
A-3
A-3
A–3 (Trk)
A–3 (Trk)
International FC
International LC
National CreditRating
National IssueRating
Sovereign FC
Sovereign LC
Long Term Short Term

Factoring
ARENA FAKTORİNG A.Ş. 4
2. Outlook JCR Eurasia Rating has assigned a ‘Stable’ outlook on the National Long Term Rating perspectives of Arena Faktoring A.Ş. based on the macroeconomic prospects of Turkey, volatilities in the FX markets and the sector’s growth projections. The existing and planned debt instruments and currency and composition of financial resources are also evaluated in the assignment of the outlook. The rating methodology employed in this report evaluates the deterioration of profitability indicators and net working capital and the main shareholder’s debt structure to the Company, coupled with aggravated political risks in the local and global markets as negative signals for the outlook. JCR Eurasia Rating will continue to monitor developments in regard to the proposed projection and will evaluate Arena Faktoring’s growth strategy, profitability indicators, and debt-level. Additionally, as JCR Eurasia Rating, we have assigned ‘Stable’ outlooks on the international long and short term local currency rating perspectives of Arena Faktoring, which are the sovereign ratings’ outlooks of the Republic of Turkey.
3. Sponsor Support and Stand-Alone Assessment The financial strength and expected support of the Company’s shareholders lay the foundation of its Sponsor Support assessment. Following the first years of foundation, Arena Faktoring enjoyed the strong capital support as a start-up company backed by Hitay Holding, capital venture investment group. When Hitay Holding exited the Company, shareholders of Tera Menkul Degerler A.Ş. get in business. Shareholders of Tera Menkul Degerler A.S., primarily Oguz Tezmen and Emre Tezmen, has a long-lasting experience in the financial sector starting from brokerage services. Tera Menkul’s successful operations in financial sector, experience in management of financial portfolios and deep knowledge in derivative products may produce a strong base of resource management for Arena Faktoring. Considering the acquisition of the Company is conducted in near past, 2015, the shareholders are expecting to profit from the operations of Arena Faktoring and will continue to support if needed. Together with the shareholders’ long history in financial sector, JCR Eurasia Rating has assigned the Sponsored Support Rating as (3), reflecting adequate external support capacity by the shareholders. The Company’s Stand Alone grade has been constituted with respect to the Company’s market shares, growth
rates, asset quality, equity structure, risk management practices, and the development of existing risks in the markets and business environment. When the factors above are considered, our opinion is that Arena Faktoring has reached a level of adequate experience and facilities to manage the occurring risks in its balance sheet through internal means without any assistance by its shareholders, provided that it maintains the current customer level and efficiency in the market. Within this context, the Stand Alone Rating of the Company has been assigned as (B) in JCR Eurasia’s notation system, which denotes a strong company and no serious issue in this regard.
4. Company Profile
a) History & Activities Arena Faktoring, founded in 2009, offers factoring operations to its clients in terms of cash management and receivable solutions. The Company has been acquired by Tera Menkul Degerler A.S. (by its shareholders) in 2015. During the exchange of the shares, in 2015, the Company paused its operations for 7 months. After the date when the acquisition was completed, the Company rapidly increased its business scale and as of FYE2016, the total assets reached to TRY 184mn (2015: TRY 40mn, 2014: TRY 73mn). Today, Arena Faktoring operates in headquarters in Istanbul and one branch in Ankara opened in July 2016. Main operations of the Company include revocable factoring services, guaranteeing, intermediating to collection and consulting by purchase, sale, assignment or acquisition of the customer receivables based on invoices or other certifying documents representing the domestic or international commercial sales of goods and services.
b) Organization & Employees The management of the Company is composed of a chief executive officer and the departments of marketing, operations, administrative affairs, loans, and credit intelligence. Independent internal audit unit reports directly to the Board of Directors, while others are reporting to the Chief Executive Officer. The Board of Directors of Arena Faktoring is composed of 5 members, including the CEO. The lack of independent member in the Board is deemed as a negative factor in terms of alignment with the corporate governance principles. However, the Company is not listed in Borsa Istanbul and shares are not traded publicly, therefore Arena Faktoring is not subject to the regulations of Capital Markets Board of Turkey in terms of corporate governance.

Factoring
ARENA FAKTORİNG A.Ş. 5
Board of Directors as of April 2017
Name Position
Oguz Tezmen Chairman
Emre Tezmen Vice Chairman
Gül Ayşe Çolak Member
In the latest general assembly held in April 2017, Nurcan Taşdelenler is appointed as the new CEO of Arena Faktoring. The average total number of employees of the Company was 29 for the year of 2016. According to the résumés, the Board members and top management have adequate level of education and background in terms of the necessities of the job they hold.
c) Shareholders, Subsidiaries & Affiliates Main shareholders of Arena Faktoring are Oguz Tezmen and Emre Tezmen with 37% of stakes each. The shareholders of the Company are almost same with the shareholders of Tera Yatırım Menkul Degerler A.S. Shareholder structure is as follows, as of FYE2016. As there is no consolidation between two companies, the shareholder structure of Tera Yatırım is provided below for informative purposes only.
Arena Faktoring A.Ş.
Shareholders Share % Paid-in Capital
(TRY)
Oguz Tezmen 37.00 7,400,000
Emre Tezmen 37.00 7,400,000
Gül Ayşe Çolak 9.99 1,998,000
Taner Eray 9.99 1,998,000
Süleyman Yıldırım 6.02 1,204,000
Total 100.00 20,000,000
Tera Yatırım Menkul Degerler A.Ş.
Shareholders Share % Paid-in Capital
(TRY)
Oguz Tezmen 45.84 11,459,633
Emre Tezmen 32.42 8,105,219
Gül Ayşe Çolak 12.42 3,104,751
Süleyman Yıldırım 6.57 1,643,245
Myra Araç Kiralama A.Ş. 2.75 687,152
Total 100.00 25,000,000
Arena Faktoring’s paid-in capital was TRY 20mn as of FYE2016, which is aligned with the minimum capital requirement of factoring companies that the limit is TRY 20mn. As of the reporting date, there is no a subsidiary or affiliates of the Company.
d) Corporate Governance
The factoring sector in Turkey is regulated by The Banking Regulation and Supervision Agency (BRSA). Under BRSA regulations factoring companies are expected to approach a certain level of standard in transparency, accountability and corporate governance structure. Arena Faktoring is not listed on the Borsa Istanbul and therefore is not subject to Capital Market Board requirements. The Company prepares its financial statements in line with the standards pointed out by the BRSA. The objective of BRSA’s regulations are to maintain principles and procedures concerning the running of factoring market. Arena Faktoring has successfully adjusted its practices to align with BRSA regulations. Moreover, the Company implements procedures to ensure transparency considering its bond issuances in the Turkish bond market. Financial records and governance practices are in line with the international standards and are audited by independent entities. The audited financial statements are disclosed to public through the Company website and the e-Company platform on Central Securities Depository (MKK) online. Information technology systems are built and running to make daily factoring operations and are consistent with the size of the business, activities and level of complexity. Information security exercises are in place to ensure the secure storage of company and customer data. Both senior management and board members have sufficient and appropriate professional and managerial experience depending on their position. The Board of Directors identifies the vision and mission of the Company and are published on the website.
e) The Company & Its Group Strategies After the placement of shares to new owners, new management targeted a rapid growth in 2016, due to the slowdown in operations during the acquisition of stakes. In 2016, the Company exhibited 166% growth in asset size and ranked 1st among all factoring companies in terms of growth speed. In contrast, the Company set new targets as modest instead of aggressive growth, since the macroeconomic conjuncture depict indeterminant economic environment. Therefore, the Company actively monitors and adjust its strategies according to the needs of the day.
5. Sector Overview & Operational Environment The Turkish factoring sector is comprised of 61 companies with different ownership and management structures, customer bases, scope of services, operational business

Factoring
ARENA FAKTORİNG A.Ş. 6
models and strategies, profitability and risk preferences, branching facilities, access opportunities to customers and markets, funding sufficiency and operational capacities on a local and/or international scale. As of FYE2016, the sector reached a total asset size of TRY 33bn and an equity of TRY 5bn. Providing guarantees, financing and collection services faster than banks in return for the assignment of spot and deferred receivables arising from the sale of products and services domestically and overseas, the sector continued its institutionalization, branching and extension of customer base activities in 2016. However, a significant number of companies operating in the sector do not possess the necessary capabilities to provide ‘collection’ services and export factoring. The certification of part of the assignment claims via postdated checks has transformed the business model of some factoring companies into one which is predominantly occupied with the discount of small volume checks. The practice of selling non-performing receivables to asset management companies is increasingly utilized by factoring companies in a similar fashion to that of banks. The Factoring Sector displays a higher level of sensitivity to changes in economic conjecture in comparison to banks, while regulatory pressures from the Banking Regulation and Supervision Agency (BRSA) continues to create difficulties in management policies across the sector. Demand for Factoring Sector services result from the predominance of Small and Medium Sized Enterprises (SME) in production activities. The sector mainly concentrates on transportation, energy, textile, main metal and machinery industries. Although the energy sector, covering nuclear fuel, petroleum and coal products, dominated the factoring sector in 2015, the energy sector’s share fell to second place and transportation sector took the pole position in 2016. Although the non-performing loans, collections and diminishing returns created a handicap for Factoring Sector, agile and fast-responsive structure of factoring companies is expected them to adapt to the current conjuncture. Growth in both customer numbers and operational volume is expected to continue at an increased pace in 2017. A significant number of factoring companies operate as subsidiaries of banks or bank affiliated firms. The principal feature of such factoring companies is their ability to carry out operations with lower equity, higher external resources, access to large loans and customers, large asset levels and possession of risks with lower profile and lower levels of profitability. On the other hand, non-bank subsidiary factoring companies are characterized by low asset and high NPL levels, high interest margins, low external financing and high equity
and profitability levels along with narrow opportunities for access to loans and customers. The establishment and working conditions of factoring companies are regulated by the BRSA and are organized under the Financial Institutions Union. The employment of managers with good education and sufficient vocational experience, establishment of sound information systems and the identification and evaluation of risks remain legal requirements of the sector. Following the adoption of a centralized billing system, the duplicate assignment of receivables arising from the sale of products and services have been prevented and thus transparency increased. A law introducing the establishment of a Centralized Billing Recording System under the ‘Financial Institutions Union’ and enhanced opportunities to gather data from the Risk Center under the Turkish Banking Union is expected to improve the sector’s ability to access higher quality data, contributing to its asset quality. In line with the undertaken reforms, the sector’s legal infrastructure has been improved with regards to effective surveillance and control. As such, the mandatory installation of information, risk measurement and internal control systems made a positive contribution to the improvement of the sector’s institutional set-up, and the quality, standardization and transparency of financial reporting practices and facilitated fair competition. Greater progress than the current achievements regarding the sector’s effectiveness and standardization will be in line with the performance expected from the ‘Financial Institutions Union’. The Turkish bond market has provided Turkish factoring companies with opportunities to diversify their funding streams since 2010. However, the principal sources of funding for non-banking financial institutions are external and are provided through the Turkish Banking System, while the trend to access funds from capital markets via debt instruments remains rather weak. Turkey is currently ranked 13th in the world and 8th in Europe in terms of the size of its factoring sector. Turkey is also ranked 2nd on a global basis in export factoring transactions after China. The shareholder structure and management teams of factoring companies are subject to rapid changes due to a comparatively large market entry and exits derived from the intensely competitive environment in which they operate. The Factoring Sector exhibits one of the highest levels of vulnerability to fluctuations in macroeconomic circumstances and instability. Management policies in the sector become more difficult mainly due to changes in economic conjuncture and regulatory pressures from the BRSA.

Factoring
ARENA FAKTORİNG A.Ş. 7
THE KEY INDICATORS OF TURKISH FACTORING SECTOR
(000,000) 2016 2015 2014 2013 2012
Asset Size-TRY 33,089 26,716 26,515 21,790 18,146
Asset Size-USD 9,402 9,155 11,395 10,228 10,208
Equity-TRY 5,084 4,627 4,442 4,015 3,856
P/L-TRY 665 395 598 495 581
ROAA % 2.81 1.93 3.12 2.97 4.50
ROAE % 17.33 11.34 17.82 15.08 21.00
NPL Ratio% 4.66 5.49 4.83 4.70 4.69
Equity / T. Sources 15.37 17.32 16.75 18.42 21.25
The Factoring Sector has a relatively low free floating rate and enjoys a small share across the wider Turkish financial services sector. 60 of the companies are located in Istanbul while only 1 is based in the capital, Ankara. Funds obtained by the Factoring Sector largely belong to companies that are subsidiaries of banks or ones that have banks among the wider group, making it more difficult for non-bank affiliated factoring companies to carry out their intermediary function. As of FYE2016, the total asset size of Turkish factoring companies was TRY 33,089mn, with an equity of TRY 5,084mn. Throughout its 27-year history, the Turkish Factoring Sector has maintained a consistent growth trend with the exception of 1994 and 2001 during which the sector underwent contractions of 10.31% and 40.23%, respectively. Between 2006 and 2016, the Factoring Sector exhibited a cumulative growth rate of 524.3%. The growth rate for the last financial year was 23.85%. Factoring receivables constitute the largest item among the sector’s assets with a share of 94.64%, whilst loans enjoyed the largest share among its resources with a 71.03% share. The sector primarily utilizes short-term bank loans in order to meet its funding requirements and its inability to diversify its resource base remains an inherent feature of the sector. However, bond issues began to slowly gather momentum since 2008 and accelerated in 2012, but experienced a slowdown in 2016. As a result, bond issuances comprised 10.27% of the sector’s total resources in 2016. The share of equity among total resources of the sector stood at 15.37% and displayed a downward trend within total liabilities. In line with the new regulations, factoring companies are obliged to have a standard ratio which dictates that the share of equity to total assets shall not fall below 3%. In 2016, the risk concentration of factoring companies primarily focused on the manufacturing industry with a share of 47.33%, the largest sectors being nuclear fuel, oil and coal products, textile and textile products, metal industry, processed material products and transportation vehicles. Across the services sector, the largest levels of
concentration were observed in the sectors of wholesale and retail trade, motor vehicle services, construction, logistics, storage and communications. The sector’s non-performing receivables to total receivables ratio decreased from 5.49% in 2015 to 4.66% in 2016. However, speculation in the market exists regarding the level of additional non-performing receivables that have not yet been recorded to the balance sheets of the sector. The ratio of non-performing receivables to equity of the sector declined to 29.92% from 31.5% in 2016. Provisions made regarding the non-performing receivables increased from 80.46% in 2015 to 85.36% in 2016. Factoring sector profitability indicators were below the Banking Industry in 2015. However, the performance of the factoring sector accelerated in 2016, compared to the Banking Industry. ROAA (Return on Average Assets) and ROAE (Return on Average Equity) indicators attained values of 1.86% and 16.81%, respectively, for the Banking Sector in comparison to the Factoring Sector’s ratios of 2.81% and 17.33%, respectively. When the share of equity to total assets is taken into consideration, the Factoring Sector has a higher level of equity compared to the Banking Sector. As such, the Equity/Total Assets ratio for the Factoring Sector in 2016 attained a value of 18.16% in comparison to the Banking Sector’s value of 10.99%. The provision rates for the non-performing loans across the factoring sector outpaced that of the Banking Sector from 2012 onward. Bank affiliated factoring companies carry a competitive advantage in comparison to non-bank affiliated firms with regards to competition, access to funding, scale of service provision and alternative distribution channels, resulting in competitive distortion. The return on loans and assets across the sector underwent significant changes throughout 2016 and as the increases in asset returns could not cope with the increases in interest rate sensitive resources, the break-even interest rate settled at 12.12%. The most important outcome was the rapid increase in the net interest rate margin from 0.20% to 1.68%.
RETURNS - COST RATIOS ANALYSIS FOR FACTORING INDUSTRY
ASSET RETURN 2016 2015 2014
Loans Interest Yield 13.86% 11.70% 10.43%
Return the Commission 1.11% 1.05% 0.96%
FX Return or cost 0.61% 0.19% -0.03%
Return/Cost of other operations 1.69% 1.42% 1.76%
Loans Total Return 17.27% 14.36% 13.12%
Cost of Non-Earning Asset -0.59% -0.49% -0.45%
Asset Return 16.68% 13.87% 12.68%

Factoring
ARENA FAKTORİNG A.Ş. 8
COST OF LIABILITIES 2016 2015 2014
Interest Cost for Cost Bearing resources 9.81% 8.36% 6.86%
Commission Cost for Cost Bearing sources 0.00% 0.00% 0.00%
Return on Non cost Bearing resources -0.59% 0.05% 0.66%
Cost of Liabilities 9.22% 8.41% 7.51%
NET PROFIT MARGIN 2016 2015 2014
Interest and Commission Margin 7.46% 5.46% 5.16%
The cost of provisioning expenses -1.38% -1.75% -1.22%
The cost of Activities Expenses -4.40% -3.51% -3.29%
Net Profit Margin 1.68% 0.20% 0.66%
BREAK-EVEN 2016 2015 2014
Break-even point in Terms of Interest 12.12% 12.87% 12.03%
Break-even point in Terms of Loan size-TRY
25,265 25,276 21,514
Growth of the factoring sector in 2017 will be strictly related with macroeconomic conjuncture, new regulations, technological advances, better collection services, and the success in export factoring subsector. In particular, the ‘decline in transaction costs of investment environment’ and ‘removal of unparalleled practices between different financial institutions’ will positively affect the performance of the sector.
6. Financial Foundation
a) Financial Indicators & Performance i. Indices relating to size
2016 was a year in which the political uncertainties and macroeconomic slowdown affected the Turkish economy. Especially the second half of the year started with coup attempt in July 15, 2016 followed by state of emergency and the wide-range operations against terrorist groups within the country. During the last quarter of the year, economic turbulence has come on the scene and the Turkish Lira began to lose value against USD and EUR. As per the dependency on foreign currency affected real sector companies of the country resulting with contraction in economic growth. Turkish economy is contracted about 2% in the three quarter of 2016. In this picture, factoring sector exhibited a growth in 2016 by 23.86%. Especially the slowdown in economy led to a narrowing in the money circulation where the factoring operations become a solution for cheques to be monetarized. On the other hand, the macroeconomic problems were an obstacle for factoring companies to face with deterioration in solvency of their customers that led some of them to be cautious and put on brake on the sales side. While the sector has exhibiting 23.86% growth, Arena Faktoring’s growth rate for the same year was 355.18%, almost quadrupled its total assets. Main
reason behind the skyrocketing of yearly based asset size was the fact that during the 2015, Arena Faktoring operated 5 out of 12 months. Thus, the Company’s total assets displayed a sharp decline in 2015 by 44.86% and the assets boosted in 2016 after the completion of acquisition process.
Market share, calculated by asset size of the companies, was a positively affected indicator for Arena Faktoring in 2016. Following the acquisition of the shares by new shareholders, the Company rapidly expanded its operations and asset size. As a consequence, the Company’s market share increased to 0.56% in 2016, doubled compared to the 2013 and 2014 when the Company is owned by former shareholders. Arena Faktoring’s rapid growth strategy drops a reflection to the market share figures. The jump in the market share displays a positive outlook for potential increase in bottom line profit by increasing assets and revenues. As parallel to the outstanding annual growth rate of the Company in 2016, cumulative growth rate between the years of 2012 and 2016 was also dramatically increased. The compounded annual growth rate of Arena Faktoring between 2012 and 2016 was 262.47% while the sector recorded the figure at 111.89%. The increase in cumulative growth rate is backed up by the growth in 2016 in which the new shareholders focused on rapid expansion strategy.
23,86 1,16
21,14
20,14
16,20
355,18
-44,86
19,08
47,41
-17,73 -100
0
100
200
300
400
20162015201420132012
Annual Asset Growth Rates %
TURKISH FACTORING SECTOR ARENA FAKTORİNG A.Ş.
0,56
0,15
0,280,280,23
0,00
0,10
0,20
0,30
0,40
0,50
0,60
20162015201420132012
Market Share % trendline

Factoring
ARENA FAKTORİNG A.Ş. 9
ii. Indices relating to profitability Arena Faktoring paused its operations during the 7 months of 2015 due to the negotiations for the acquisition of the Company by new shareholders. Obviously, the slowdown in operations is reflected in bottom line profit and the Company closed the year of 2015 TRY 5.7mn of net loss. In 2016, Arena Faktoring rapidly covered the time lost in 2015 and recorded net profit of TRY 1.7mn as of FYE2016. Parallel to the bottom line figures, ROAA and ROAE indicators also shown a decline in 2015 and jump in 2016. Although the year of 2016 was a coverage for the previous year’s operations, ROAA and ROAE continued to underperform the sector averages. ROAE stood at 14.17%, significantly below the sector average of 17.32% and the ROAA is calculated as 1.96% while the sector’s figure was 2.81%.
Arena Faktoring’s interest margins continued to be above the sector average. For the year of 2016, the Company’s average interest margin was 5.19% while the sector enjoyed only 4.35%. In 2016, both the sector margins and the Company’s one lifted up. The larger interest margin indicates that the Company’s revenue generation for unit-loan is higher than the average of its competitors. On another approach the high level of margins may be hazardous for the Company. While at first glance a higher margin seems to be positive, customers willing to pay higher interest rates may also be the ones seeking emergency withdrawal. It can be inferred that the aforementioned customers are potentially risky and have relatively low liquidity ratios and bargaining power. In this view, interest margin is a double-sided indicator for both profitability and asset quality. Therefore, the solvency of the Customers and the interest rates for those must be delicately analysed by the Company.
The Company’s operational efficiency is measured by the operating expenses to average assets so as to eliminate the impact of the volatility of profitability. Arena Faktoring’s operating expenses over income ratio was above the sector in 2016. The ratio was far above in 2015 and the increase in operations will decrease the ratio due to the fact that fixed overhead costs in operations will be distributed per unit-revenue. Although the Company’s ratio went down in the year of 2016, the sector’s performance was better that resulted with negatively divergence for Arena Faktoring.
111,89
71,07 69,11 39,60
16,20
262,47
-20,37
44,41 21,28 -17,73
-50
0
50
100
150
200
250
300
20162015201420132012
Cumulative Asset Growth Rates %
TURKISH FACTORING SECTOR ARENA FAKTORİNG A.Ş.
1,96
-10,55
0,08
3,196,74
2,811,94
3,31
3,08
4,50
-12-10-8-6-4-202468
20162015201420132012
ROAA ARENA FAKTORİNG A.Ş.
ROAA TURKISH FACTORING SECTOR
14,17
-37,77
0,339,92
21,17 17,3211,36
18,9115,61
21,00
-50
-40
-30
-20
-10
0
10
20
30
20162015201420132012
ROAE ARENA FAKTORİNG A.Ş.
ROAE TURKISH FACTORING SECTOR
10,67
7,02
12,33
9,56
16,53 15,87 11,42
21,34 19,26
30,67
5,19 4,41
9,01
9,70
14,14
4,35 3,93 4,41 5,01 6,02
0
5
10
15
20
25
30
35
20162015201420132012
Interest Margin %
Interest Rate for Costly Liabilities (avg.) %
Interest Rate for Earning Assets (avg.) %
Margin %
Sector Margin %
40,6743,5540,9438,2533,92
66,76
133,06
71,8268,10
46,66
0
20
40
60
80
100
120
140
20162015201420132012
Total Operating Expenses/Total Income %
TURKISH FACTORING SECTOR ARENA FAKTORİNG A.Ş.

Factoring
ARENA FAKTORİNG A.Ş. 10
b) Asset quality Factoring receivables continued to be the primary asset of Arena Faktoring’s balance sheet in 2016 with a ratio over 95%, similar to previous years. As the quality of receivables is the most important part of total assets, the quality of receivables is examined to assess asset quality of the Company.
The non-performing loans ratio is considered to be the main indicator of receivables’ quality within the financial sector. In the table below, NPL ratio is calculated by Gross Over Due Loans divided by Total Receivables including Allowances for Over Due Loans. The Company’s gross overdue receivables decreased from TRY 9.5mn to TRY 4.6 as of FYE2016. While the overdue loans reduced by half, the total receivables skyrocketed from TRY 38.6mn to TRY 177.4mn in the same time period. As a result, the NPL ratio of the Company dramatically decreased from 20.49% to 2.51% as of FYE2016. In the same time, the sector average of NPL declined to 4.67%. Arena Faktoring overperformed against the sector average in 2016. The sharp decline in NPL is emanated from both nominator and denominator of the ratio. In denominator side, increase in total receivables helped the ratio to be lowered. In nominator side, gross overdue receivables declined from TRY 9.5mn to TRY 4.6, mainly driven from sales of receivables to Sümer Varlık Yönetim A.Ş. in 2016. Sale of overdue receivables reduced the NPL ratio and improved the asset quality.
The loss reserve coverage ratio of the Company has grown in years and reached over 90% as of FYE2016, the sector’s average was 85.36% though. The remarkable amount of loss reserves compensates the pressure of NPL ratio on equity and increases the health of balance sheet.
The decline in overdue receivables also reflected in the ratio of impaired receivables over equity ratio. With the decline in NPL mentioned above, pressure of overdue loans on equity is relieved so that the Arena Faktoring’s figure was below the sector average as of FYE2016.
c) Funding & Adequacy of Capital The majority of the Company’s funding sources were comprised of bank loans and issued bonds, accounting for
96,37%95,39%
98,27%98,32%
96,70%
0,59%
0,30%
0,03%0,09%
1,10%
3,04%4,31%
1,70%1,59%2,20%
93%
94%
95%
96%
97%
98%
99%
100%
20162015201420132012
Asset Distribution
Other Assets Banks and Other Earnings Assets
Loans and Receivables
4,67 5,51
4,29 4,65 4,69
2,51
20,49
10,97 9,66
14,62
0
5
10
15
20
25
20162015201420132012
NPL %
TURKISH FACTORING SECTOR ARENA FAKTORİNG A.Ş.
85,36 80,46 81,17
84,97 82,36 90,07
81,27
37,63
60,57 52,31
0
20
40
60
80
100
20162015201420132012
Loss Reserves / Impaired Receivables %
TURKISH FACTORING SECTOR ARENA FAKTORİNG A.Ş.
29,91 31,50 25,06 24,44 20,82
27,86
64,92
47,99
36,21 39,86
0
10
20
30
40
50
60
70
20162015201420132012
Impaired Receivables / Equity %
TURKISH FACTORING SECTOR ARENA FAKTORİNG A.Ş.
Factoring
ARENA FAKTORİNG A.Ş. 11
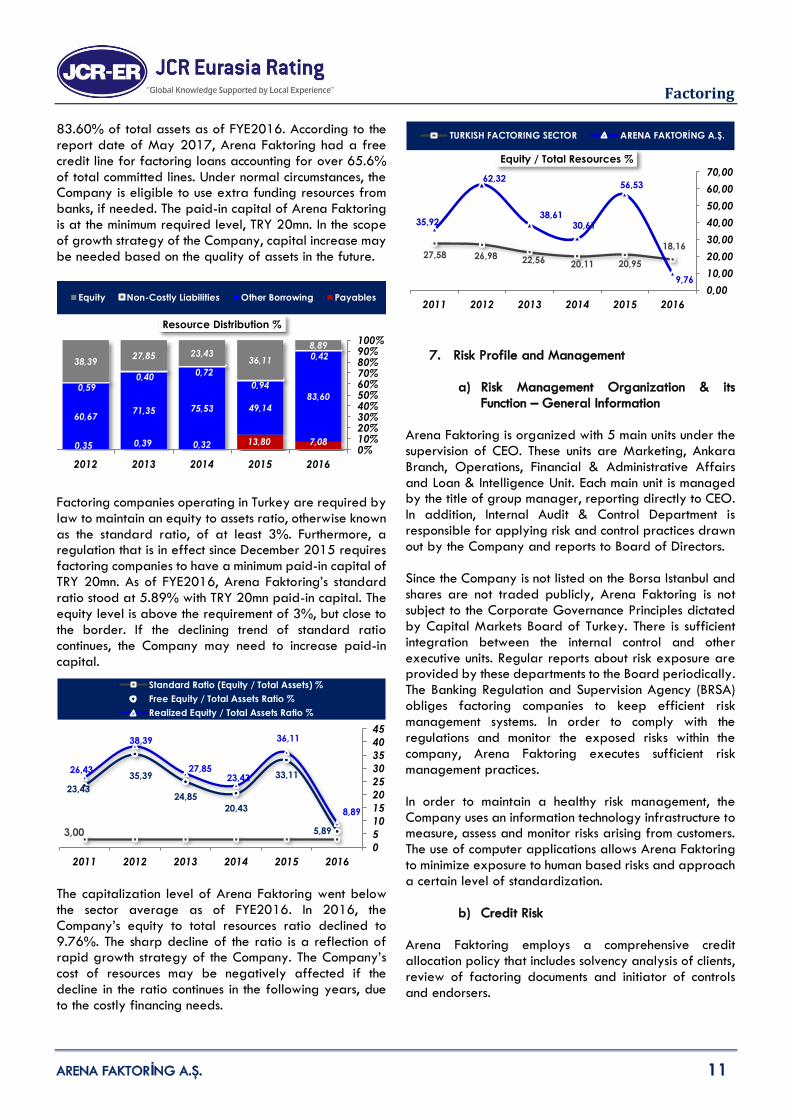
83.60% of total assets as of FYE2016. According to the report date of May 2017, Arena Faktoring had a free credit line for factoring loans accounting for over 65.6% of total committed lines. Under normal circumstances, the Company is eligible to use extra funding resources from banks, if needed. The paid-in capital of Arena Faktoring is at the minimum required level, TRY 20mn. In the scope of growth strategy of the Company, capital increase may be needed based on the quality of assets in the future.
Factoring companies operating in Turkey are required by law to maintain an equity to assets ratio, otherwise known as the standard ratio, of at least 3%. Furthermore, a regulation that is in effect since December 2015 requires factoring companies to have a minimum paid-in capital of TRY 20mn. As of FYE2016, Arena Faktoring’s standard ratio stood at 5.89% with TRY 20mn paid-in capital. The equity level is above the requirement of 3%, but close to the border. If the declining trend of standard ratio continues, the Company may need to increase paid-in capital.
The capitalization level of Arena Faktoring went below the sector average as of FYE2016. In 2016, the Company’s equity to total resources ratio declined to 9.76%. The sharp decline of the ratio is a reflection of rapid growth strategy of the Company. The Company’s cost of resources may be negatively affected if the decline in the ratio continues in the following years, due to the costly financing needs.
7. Risk Profile and Management
a) Risk Management Organization & its Function – General Information
Arena Faktoring is organized with 5 main units under the supervision of CEO. These units are Marketing, Ankara Branch, Operations, Financial & Administrative Affairs and Loan & Intelligence Unit. Each main unit is managed by the title of group manager, reporting directly to CEO. In addition, Internal Audit & Control Department is responsible for applying risk and control practices drawn out by the Company and reports to Board of Directors. Since the Company is not listed on the Borsa Istanbul and shares are not traded publicly, Arena Faktoring is not subject to the Corporate Governance Principles dictated by Capital Markets Board of Turkey. There is sufficient integration between the internal control and other executive units. Regular reports about risk exposure are provided by these departments to the Board periodically. The Banking Regulation and Supervision Agency (BRSA) obliges factoring companies to keep efficient risk management systems. In order to comply with the regulations and monitor the exposed risks within the company, Arena Faktoring executes sufficient risk management practices. In order to maintain a healthy risk management, the Company uses an information technology infrastructure to measure, assess and monitor risks arising from customers. The use of computer applications allows Arena Faktoring to minimize exposure to human based risks and approach a certain level of standardization.
b) Credit Risk Arena Faktoring employs a comprehensive credit allocation policy that includes solvency analysis of clients, review of factoring documents and initiator of controls and endorsers.
7,0813,800,320,390,35
83,60
49,1475,5371,3560,67
0,42
0,94
0,720,40
0,59
8,89
36,1123,4327,85
38,39
0%10%20%30%40%50%60%70%80%90%100%
20162015201420132012
Resource Distribution %
Equity Non-Costly Liabilities Other Borrowing Payables
3,00 5,89
33,11
20,43
24,85
35,39
23,43
8,89
36,11
23,43 27,85
38,39
26,43
0
5
10
15
20
25
30
35
40
45
201620152014201320122011
Standard Ratio (Equity / Total Assets) %
Free Equity / Total Assets Ratio %
Realized Equity / Total Assets Ratio %
18,16
20,95 20,11 22,56 26,98 27,58
9,76
56,53
30,61 38,61
62,32
35,92
0,00
10,00
20,00
30,00
40,00
50,00
60,00
70,00
201620152014201320122011
Equity / Total Resources %
TURKISH FACTORING SECTOR ARENA FAKTORİNG A.Ş.

Factoring
ARENA FAKTORİNG A.Ş. 12
The total number of active customers of Arena Faktoring is 437 as of May 2017. The concentration levels as of are reported as 67%, 74% and 83% for the top 10, 20 and 50 customers. The 67% is dominated by one company, which operates in automotive sector and carries %39.2 of total receivables. Although the Company’s exposure to single-party risk is high, there is no sign of a realization of single-party default risk, based on the solvency of the clientele. Parallel to the single-party risk mentioned above, sector distribution has concentrated on one side, automotive industry. Construction continued to be one of the main sectors as a reflection of Turkish economy.
Sector Distribution of Receivables 2016 (%) 2015 (%)
Transportation Vehicles Industry 42.54 0.00
Construction 11.75 7.14
Textile 7.68 5.55
Machinery and Equipment 5.62 1.33
Mining 5.10 20.16
Vehicle Services 4.54 9.71
Food, Beverages & Tobacco 4.07 7.32
Production 3.28 11.78
Metal Industry 2.86 20.68
Transportation, Storage & Telco 2.52 4.09
Electricity, Gas & Water Supplies 1.57 0.23
Chemicals & Synthetics 1.53 0.35
Paper 0.60 2.26
Plastics 0.55 1.43
Society Services 0.54 2.11
Leather & Leather Products 0.34 0.08
Wood & Wood Products 0.10 0.78
Tourism 0.09 0.00
Healthcare 0.08 4.43
Agriculture 0.06 0.00
Other 0.05 0.00
Total 100 100
Together with the sectoral and customer-specific concentration levels, receivables of the Company create an obstacle for Arena Faktoring to achieve risk diversification. On the other hand, current single-party risk exposure doesn’t carry an important risk on the balance sheet and other financials and it is found within the acceptable level.
c) Market Risk Arena Faktoring’s market risk can be classified under the two headings, currency risk and interest rate risk.
Currency Risk As of FYE2016, the Company holds short position in foreign exchange balance amounted TRY 70k. The nominal value is quite small compared to the total size of the Company. Nevertheless, the Company is using derivatives to hedge any risk associated with fluctuations in foreign exchange parity. All in all, it is inferred that the Company carries no short FX position as of FYE2016 and Q12017. Interest Rate Risk Volatility in market interest rates is an important factor on the profitability level of the Company. Arena Factoring is subject to interest rates applied on bank loans issued bonds and factoring payables. The table below displays the weighted average interest rate on both assets and liabilities of the Company for the last two years.
Average Effective TRY Interest Rates for Arena Faktoring
2016 2015
Assets % %
Bank Deposits - -
Factoring Receivables 22.77 23.58
Other Receivables - -
Liabilities % %
Loans 13.13 14.54
Factoring Payables 17.15 -
Bond Issuances 13.90 14.64
On the asset side, the average effective interest rate of Turkish Lira factoring receivables has shown a downward trend by 0.81% in 2016 which has a negative effect on revenues. In liabilities, interest rate applied to bank loans and issued bonds decreased, too. Considering the decision taken by Central Bank of Turkey, market interest rates in a trend of increase so that the cost of financing of the Company may be rise up in 2017. Nevertheless, the Company may adjust its margins by changing the rates applied to receivables to preserve profitability.
d) Liquidity Risk Arena Faktoring is exposed to liquidity risk during funding of its operations and manages it through regularly monitoring forecasted and actual cash flows, matching the maturity profiles of financial assets and liabilities and providing the continuation of adequate funding sources as well as maintaining the adequate credit lines. The Company meets its funding needs through its own equity, bond issuances, loans from financial institutions and continuously analyses the liquidity risk by monitoring the changes in funding sources the collection and payment schedule. According to the report date of May 2017, Arena Faktoring has cash loan limits in banking system

Factoring
ARENA FAKTORİNG A.Ş. 13
amounting TRY 151mn while the total risk was TRY 52.1mn. Arena Faktoring has enough credit line in the banking system in terms of fulfilling liquidity needs. The Company’s ‘short term borrowing/total assets’ ratio was around 70% for the last 4 years, excluding 2015. Generally speaking, the trend of the ratio is parallel to the sector average.
In order to minimize idle cash and allocate funds to higher interest yielding factoring loans, the Company maintained a minimum level of liquid assets. The Company’s liquid assets ratio was below the sector average of 2.28% in FYE2016. On the other hand, the ratio was increased from 0.47% to 0.65% in 2016. Although the low liquidity indicator appears to pressure liquidity management, the availability of committed credit limits and the rapid cash turnover structure of the sector alleviated the immediate cash requirements.
e) Operational, Legal Regulatory & Other Risks
Arena Faktoring has sufficient level of operational risk and control environment in terms of risk management practices. Internal control unit and risk management practices are in place. Both the computerized and manual controls are effective to mitigate operational risks and minimizes unexpected losses within the Company.
8. Budget & Debt Issue Arena Faktoring forecasts a noticeable contraction in asset size in 2017. The Company’s total assets, which is primarily compromised of factoring receivables, is exposed to single-party risk where the 67% of total receivables are from one company. Therefore, the fluctuations in the receivables from large customers, may lead to instability in total asset size.
The Company’s projections for the following years has been summarized below.
Projected Balance Sheet
(TRY 000) 2017F 2016
Earning Assets 102,396 178,469
Loan and Receivable (net) 102,310 177,377
Factoring Receivables 100,891 176,924
Overdue Loans (net) 1,419 453
Banks/Other Earning Assets 86 1,092
Banks 86 1,092
Non-Earning Assets 6,222 5,598
Cash and Cash Equivalents 0 0
Asset Held for Sale (net) 0 0
Other 6,222 5,598
Property and Equipment 4,433 4,157
Other 1,789 1,441
Total Assets 108,618 184,068
Projected Figures
(TRY 000) 2017F 2016
Net Profit 1,058 1,764
Asset Size 108,618 184,068
Equity 17,430 16,372
The Company projects a net profit of TRY 1.76k in 2017. The projected profitability depends on the stability in Turkish economy and increase in factoring operations volume in the next years. Therefore, the Company’s sales, non-performing loans, and composition of financial resources will be monitored together with the macroeconomic indicators. Arena Faktoring’s borrowings are diversified with bond issuances. The Company uses bonds to adjust its financial and cash needs. As of reporting date, the Company’s standing balance for issued bonds is TRY 30mn. Moreover, an extra TRY 19mn of bonds are planned to be issued in 2017. Details of the active bonds are presented below.
72,94
69,26
71,0772,71
72,21 74,01
37,72
75,8571,74
61,02
0
10
20
30
40
50
60
70
80
90
20162015201420132012
Short Term Borrowings / Total Assets (%)
TURKISH FACTORING SECTOR ARENA FAKTORİNG A.Ş.
2,282,01
2,464,18
7,53
0,650,470,030,13
1,79
-1,000,001,002,003,004,005,006,007,008,00
20162015201420132012
Liquid Assets + Marketable Securities / Total Liabilities %
TURKISH FACTORING SECTOR ARENA FAKTORİNG A.Ş.

Factoring
ARENA FAKTORİNG A.Ş. 14
BOND ISSUANCE
Issue Date Amount (TRY) Maturity Date Type Status
13.11.2015 10,000,000 10.11.2017 Coupon On
Track
08.02.2016 10,000,000 05.02.2018 Coupon On
Track
15.04.2016 10,000,000 13.04.2018 Coupon On
Track
Total 30,000,000
As there are no additional legal or financial collateral guarantees provided separately for the repayment of the bond issued by Arena Faktoring, the note assigned for the TRY dominated bond issuance has been assigned as the same as the Company's Long and Short Term National Local Ratings which are ‘BBB- (Trk)’ and ‘A-3 (Trk)’.
Factoring
ARENA FAKTORİNG A.Ş. 15
(Year end) (Year end) (Year end) (Year end) (Year end) (Year end) (Year end) (Year end) As % of As % of As % of
ARENA FAKTORİNG A.Ş. 2016 2016 2016 2015 2015 2014 2014 2013 2016 2015 2014 2016 2015 2014
BALANCE SHEET - ASSET USD TRY TRY TRY TRY TRY TRY TRY Assets Assets Assets Growth Growth Growth
TRY (000) (Converted) (Original) (Average) (Original) (Average) (Original) (Average) (Original) (Original) (Original) (Original) Rate Rate Rate
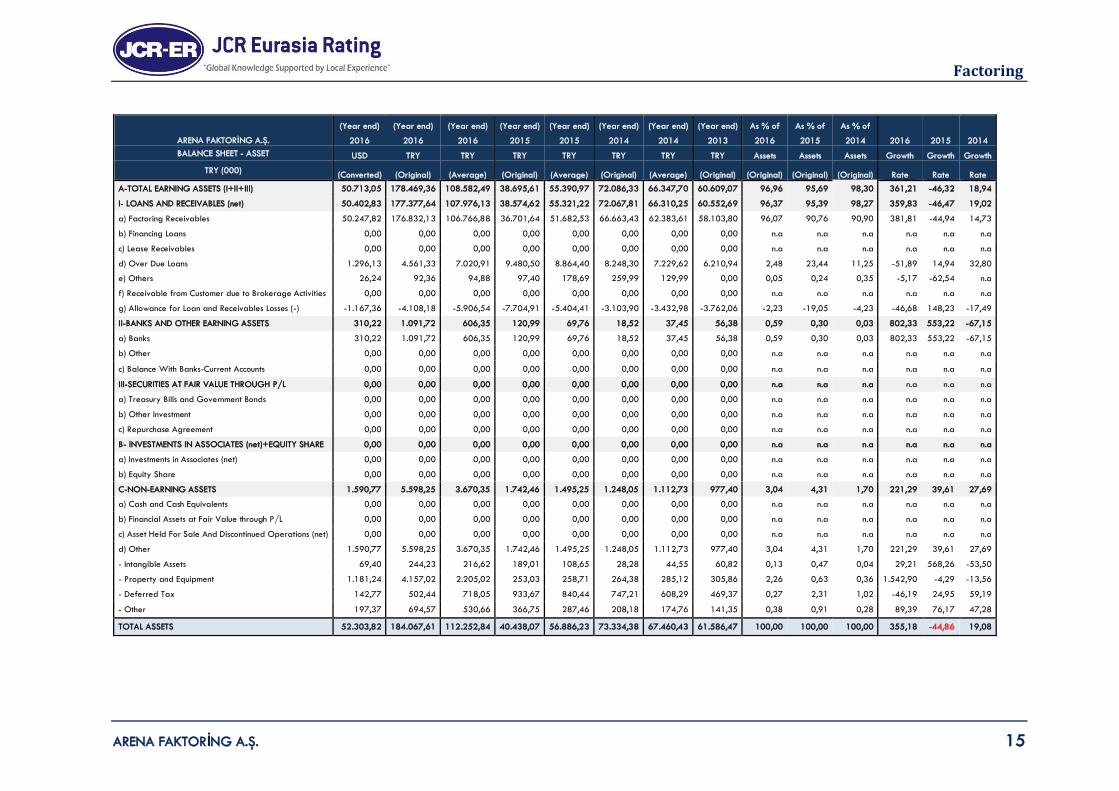
A-TOTAL EARNING ASSETS (I+II+III) 50.713,05 178.469,36 108.582,49 38.695,61 55.390,97 72.086,33 66.347,70 60.609,07 96,96 95,69 98,30 361,21 -46,32 18,94
I- LOANS AND RECEIVABLES (net) 50.402,83 177.377,64 107.976,13 38.574,62 55.321,22 72.067,81 66.310,25 60.552,69 96,37 95,39 98,27 359,83 -46,47 19,02
a) Factoring Receivables 50.247,82 176.832,13 106.766,88 36.701,64 51.682,53 66.663,43 62.383,61 58.103,80 96,07 90,76 90,90 381,81 -44,94 14,73
b) Financing Loans 0,00 0,00 0,00 0,00 0,00 0,00 0,00 0,00 n.a n.a n.a n.a n.a n.a
c) Lease Receivables 0,00 0,00 0,00 0,00 0,00 0,00 0,00 0,00 n.a n.a n.a n.a n.a n.a
d) Over Due Loans 1.296,13 4.561,33 7.020,91 9.480,50 8.864,40 8.248,30 7.229,62 6.210,94 2,48 23,44 11,25 -51,89 14,94 32,80
e) Others 26,24 92,36 94,88 97,40 178,69 259,99 129,99 0,00 0,05 0,24 0,35 -5,17 -62,54 n.a
f) Receivable from Customer due to Brokerage Activities 0,00 0,00 0,00 0,00 0,00 0,00 0,00 0,00 n.a n.a n.a n.a n.a n.a
g) Allowance for Loan and Receivables Losses (-) -1.167,36 -4.108,18 -5.906,54 -7.704,91 -5.404,41 -3.103,90 -3.432,98 -3.762,06 -2,23 -19,05 -4,23 -46,68 148,23 -17,49
II-BANKS AND OTHER EARNING ASSETS 310,22 1.091,72 606,35 120,99 69,76 18,52 37,45 56,38 0,59 0,30 0,03 802,33 553,22 -67,15
a) Banks 310,22 1.091,72 606,35 120,99 69,76 18,52 37,45 56,38 0,59 0,30 0,03 802,33 553,22 -67,15
b) Other 0,00 0,00 0,00 0,00 0,00 0,00 0,00 0,00 n.a n.a n.a n.a n.a n.a
c) Balance With Banks-Current Accounts 0,00 0,00 0,00 0,00 0,00 0,00 0,00 0,00 n.a n.a n.a n.a n.a n.a
III-SECURITIES AT FAIR VALUE THROUGH P/L 0,00 0,00 0,00 0,00 0,00 0,00 0,00 0,00 n.a n.a n.a n.a n.a n.a
a) Treasury Bills and Government Bonds 0,00 0,00 0,00 0,00 0,00 0,00 0,00 0,00 n.a n.a n.a n.a n.a n.a
b) Other Investment 0,00 0,00 0,00 0,00 0,00 0,00 0,00 0,00 n.a n.a n.a n.a n.a n.a
c) Repurchase Agreement 0,00 0,00 0,00 0,00 0,00 0,00 0,00 0,00 n.a n.a n.a n.a n.a n.a
B- INVESTMENTS IN ASSOCIATES (net)+EQUITY SHARE 0,00 0,00 0,00 0,00 0,00 0,00 0,00 0,00 n.a n.a n.a n.a n.a n.a
a) Investments in Associates (net) 0,00 0,00 0,00 0,00 0,00 0,00 0,00 0,00 n.a n.a n.a n.a n.a n.a
b) Equity Share 0,00 0,00 0,00 0,00 0,00 0,00 0,00 0,00 n.a n.a n.a n.a n.a n.a
C-NON-EARNING ASSETS 1.590,77 5.598,25 3.670,35 1.742,46 1.495,25 1.248,05 1.112,73 977,40 3,04 4,31 1,70 221,29 39,61 27,69
a) Cash and Cash Equivalents 0,00 0,00 0,00 0,00 0,00 0,00 0,00 0,00 n.a n.a n.a n.a n.a n.a
b) Financial Assets at Fair Value through P/L 0,00 0,00 0,00 0,00 0,00 0,00 0,00 0,00 n.a n.a n.a n.a n.a n.a
c) Asset Held For Sale And Discontinued Operations (net) 0,00 0,00 0,00 0,00 0,00 0,00 0,00 0,00 n.a n.a n.a n.a n.a n.a
d) Other 1.590,77 5.598,25 3.670,35 1.742,46 1.495,25 1.248,05 1.112,73 977,40 3,04 4,31 1,70 221,29 39,61 27,69
- Intangible Assets 69,40 244,23 216,62 189,01 108,65 28,28 44,55 60,82 0,13 0,47 0,04 29,21 568,26 -53,50
- Property and Equipment 1.181,24 4.157,02 2.205,02 253,03 258,71 264,38 285,12 305,86 2,26 0,63 0,36 1.542,90 -4,29 -13,56
- Deferred Tax 142,77 502,44 718,05 933,67 840,44 747,21 608,29 469,37 0,27 2,31 1,02 -46,19 24,95 59,19
- Other 197,37 694,57 530,66 366,75 287,46 208,18 174,76 141,35 0,38 0,91 0,28 89,39 76,17 47,28
TOTAL ASSETS 52.303,82 184.067,61 112.252,84 40.438,07 56.886,23 73.334,38 67.460,43 61.586,47 100,00 100,00 100,00 355,18 -44,86 19,08

Factoring
ARENA FAKTORİNG A.Ş. 16
(Year end) (Year end) (Year end) (Year end) (Year end) (Year end) (Year end) (Year end) As % of As % of As % of
ARENA FAKTORİNG A.Ş. 2016 2016 2016 2015 2015 2014 2014 2013 2016 2015 2014 2016 2015 2014
BALANCE SHEET-LIABILITIES+EQUITY USD TRY TRY TRY TRY TRY TRY TRY Assets Assets Assets Growth Growth Growth
TRY (000) (Converted) (Original) (Average) (Original) (Average) (Original) (Average) (Original) (Original) (Original) (Original) Rate Rate Rate
C- COST BEARING RESOURCES (I+II) 47.431,52 166.920,99 96.186,91 25.452,83 40.537,04 55.621,25 49.902,07 44.182,89 90,68 62,94 75,85 555,81 -54,24 25,89
I-PAYABLES 3.703,62 13.033,77 9.307,89 5.582,01 2.907,77 233,53 237,50 241,47 7,08 13,80 0,32 133,50 2.290,26 -3,29
a) Factoring Payables 3.522,74 12.397,21 8.882,18 5.367,14 2.744,83 122,51 133,33 144,15 6,74 13,27 0,17 130,98 4.280,98 -15,01
b) Lease Payables 0,00 0,00 0,00 0,00 0,00 0,00 0,00 0,00 n.a n.a n.a n.a n.a n.a
c) Other 180,88 636,55 425,71 214,86 162,94 111,02 104,17 97,32 0,35 0,53 0,15 196,26 93,53 14,08
II-BORROWING FUNDING LOANS & OTHER 43.727,90 153.887,23 86.879,03 19.870,83 37.629,28 55.387,72 49.664,57 43.941,42 83,60 49,14 75,53 674,44 -64,12 26,05
a) Fund Borrowed-Short Term 35.004,39 123.187,44 66.429,29 9.671,15 32.529,44 55.387,72 49.664,57 43.941,42 66,93 23,92 75,53 1.173,76 -82,54 26,05
b) Fund Borrowed-Long Term 0,00 0,00 0,00 0,00 0,00 0,00 0,00 0,00 n.a n.a n.a n.a n.a n.a
c ) Marketable Securities For Issued (net) 8.723,51 30.699,79 20.449,73 10.199,68 5.099,84 0,00 0,00 0,00 16,68 25,22 n.a 200,99 n.a n.a
d) Securities Sold Under Repurchase Agreements 0,00 0,00 0,00 0,00 0,00 0,00 0,00 0,00 n.a n.a n.a n.a n.a n.a
e) Subordinated Loans 0,00 0,00 0,00 0,00 0,00 0,00 0,00 0,00 n.a n.a n.a n.a n.a n.a
D- NON COST BEARING RESOURCES 220,18 774,87 578,39 381,90 454,58 527,26 388,31 249,36 0,42 0,94 0,72 102,90 -27,57 111,44
a) Provisions 36,26 127,61 99,39 71,16 100,28 129,41 101,96 74,51 0,07 0,18 0,18 79,33 -45,01 73,67
b) Current & Deferred Tax Liabilities 112,37 395,45 283,36 171,28 185,65 200,02 184,20 168,38 0,21 0,42 0,27 130,88 -14,37 18,79
c) Trading Liabilities (Derivatives) 0,00 0,00 0,00 0,00 0,00 0,00 3,24 6,47 n.a n.a n.a n.a n.a -
100,00
d) Other Liabilities 71,55 251,81 195,64 139,46 168,65 197,83 98,92 0,00 0,14 0,34 0,27 80,56 -29,51 n.a
E- TOTAL LIABILITIES 47.651,70 167.695,87 96.765,30 25.834,74 40.991,63 56.148,51 50.290,38 44.432,25 91,11 63,89 76,57 549,11 -53,99 26,37
F- MINORITY INTEREST 0,00 0,00 0,00 0,00 n.a n.a n.a n.a n.a n.a
F- EQUITY 4.652,12 16.371,74 15.487,54 14.603,33 15.894,60 17.185,87 17.170,05 17.154,22 8,89 36,11 23,43 12,11 -15,03 0,18
a) Prior Year's Equity 4.149,62 14.603,33 15.894,60 17.185,87 17.170,05 17.154,22 16.455,97 15.757,72 7,93 42,50 23,39 -15,03 0,18 8,86
b) Equity (Internal & external resources added during the
year) 1,16 4,07 1.549,40 3.094,73 1.547,00 -0,73 -1,03 -1,32 0,00 7,65 -0,00 -99,87
-
422.300,14 -44,39
c) Minority Interest 0,00 0,00 0,00 0,00 0,00 0,00 0,00 0,00 n.a n.a n.a n.a n.a n.a
d) Profit & Loss 501,35 1.764,35 -1.956,46 -5.677,27 -2.822,44 32,38 715,10 1.397,82 0,96 -14,04 0,04 -131,08 -17.633,25 -97,68
TOTAL LIABILITY+EQUITY 52.303,82 184.067,61 112.252,84 40.438,07 56.886,23 73.334,38 67.460,43 61.586,47 100,00 100,00 100,00 355,18 -44,86 19,08
USD 1 = TRY 3,5192 2,9076 2,3189 2,1304

Factoring
ARENA FAKTORİNG A.Ş. 17
ARENA FAKTORİNG A.Ş. 2016 2015 2014 2013 2012 INCOME STATEMENT
TRY (000)
Net Interest Income 6.963,05 3.483,77 8.005,48 6.440,39 8.705,47
A) Interest income 17.228,28 6.327,68 14.160,24 9.770,41 13.822,00
a) Factoring Interest Income 17.228,28 6.327,68 14.160,24 9.770,41 13.822,00
b) Financing Loans Interest Income 0,00 0,00 0,00 0,00 0,00
c) Lease Income 0,00 0,00 0,00 0,00 0,00
d) Banks 0,00 0,00 0,00 0,00 0,00
B) Fınancial Expense 10.265,23 2.843,91 6.154,76 3.330,02 5.116,53
Net Fee and Commission Income 2.814,44 420,01 875,42 603,32 696,69
a) Fee and Commission Income 2.898,26 528,07 946,18 701,55 807,75
b) Fee and Commission Expense 83,82 108,06 70,75 98,24 111,06
Total Operating Income 193,02 336,74 576,60 821,01 295,40
Interest Income from Other Operating Field 128,08 37,35 0,40 1,36 0,00
Foreign Exchange Gain or Loss (net) (+/-) -4,83 50,68 19,64 38,65 12,83
Gross Profit from Retail Business 0,00 0,00 0,00 0,00 0,00
Gains or Loss on Derivative Instruments (+/-) 0,00 0,00 0,00 -6,47 0,00
Income on Sale of Equity Participations and Consolidated Affiliates 0,00 0,00 0,00 0,00 0,00
Gains from Investment Securities (net) 0,00 0,00 0,00 0,00 0,00
Other Operating Income 69,78 248,71 556,57 787,47 282,57
Taxes other than Income Tax 0,00 0,00 0,00 0,00 0,00
Dividend 0,00 0,00 0,00 0,00 0,00
Provisions 1.116,05 4.601,01 2.607,60 858,07 2.054,30
Provision for Impairment of Loan and Trade Receivables 1.397,99 4.760,30 2.734,31 858,07 2.054,30
Other Provision -281,95 -159,29 -126,71 0,00 0,00
Total Operating Expense 6.659,91 5.642,53 6.792,84 5.360,08 4.524,92
Salaries and Employee Benefits 4.346,60 3.587,72 4.324,11 3.323,67 2.963,83
Depreciation and Amortization 0,00 0,00 0,00 0,00 0,00
Other Expenses 2.313,31 2.054,81 2.468,74 2.036,41 1.561,09
Profit from Operating Activities before Income Tax 2.194,56 -6.003,01 57,06 1.646,57 3.118,33
Income Tax – Current 0,00 0,00 254,36 334,22 771,91
Income Tax – Deferred 430,22 -325,75 -229,67 -85,47 -0,60
Net Profit for the Period 1.764,35 -5.677,27 32,38 1.397,82 2.347,03

Factoring
ARENA FAKTORİNG A.Ş. 18
ARENA FAKTORİNG A.Ş.
2016 2015 2014 FINANCIAL RATIO %
I. PROFITABILITY & PERFORMANCE
1. ROA - Pretax Profit / Total Assets (avg.) 1,96 -10,55 0,08
2. ROE - Pretax Profit / Equity (avg.) 14,17 -37,77 0,33
3. Total Income / Equity (avg.) 64,41 26,68 55,08
4. Total income / Total Assets (avg.) 8,89 7,45 14,02
5. Provisions / Total Income 11,19 108,50 27,57
6. Total Expense / Total Resources (avg.) 6,89 13,77 13,51
7. Net Profit for the Period / Total Assets (avg.) 1,57 -9,98 0,05
8. Total Income / Total Expenses 149,67 75,15 139,23
9. Non Cost Bearing Liabilities + Equity- Non Earning Assets /
Assets 6,27 32,75 22,45
10. Non Cost Bearing Liabilities - Non Earning Assets / Assets -2,62 -3,36 -0,98
11. Total Operating Expenses / Total Income 66,76 133,06 71,82
12. Interest Margin 6,41 6,29 12,07
13. Operating ROAA = Operating Net Incomes / Assets (avg.) 11,10 -5,55 9,21
14. Operating ROAE = Operating Net Incomes / Equity Capital (avg.)
80,45 -19,88 36,18
15. Interest Coverage – EBIT / Interest Expenses 121,38 -111,08 100,93
16. Net Profit Margin 17,69 -133,88 0,34
17. Gross Profit Margin 22,00 -141,56 0,60
18. Market Share 0,56 0,15 0,28
19. Growth Rate 355,18 -44,86 19,08
II. CAPITAL ADEQUACY (year end)
1. Equity Generation / Prior Year’s Equity 0,03 18,01 -0,00
2. Internal Equity Generation / Previous Year’s Equity 12,08 -33,03 0,19
3. Equity / Total Assets (Standard Ratio) 8,89 36,11 23,43
4. Equity / Total Liabilities 9,76 56,53 30,61
5. Free Equity / Total Receivables Ratio 6,75 36,71 23,44
6. Tangible Assets / Total Assets 2,26 0,63 0,36
7. Intangible Assets / Total Assets 0,13 0,47 0,04
8. Equity / Total Guarantees and Commitments + Equity 100,00 100,00 100,00
III. LIQUIDITY (year end)
1. Liquid Assets + Marketable Securities / Total Assets 0,59 0,30 0,03
2. Liquid Assets + Marketable Securities / Total Liabilities 0,65 0,47 0,03
3. Short Term Borrowings / Total Assets 74,01 37,72 75,85
4. Net Interest and Commission / Total Assets 5,31 9,65 12,11
5. Liquid Assets + Marketable Securities / Equity 6,67 0,83 0,11
IV. ASSET QUALITY
1. Loan and Receivable’s Loss Provisions / Total Loans and
Receivables 2,26 16,65 4,13
2. Total Provisions / Profit Before Provision and Tax 33,71 -328,17 97,86
3. Impaired Receivables / Gross Receivables 2,51 20,49 10,97
4. Impaired Receivables / Equity 27,86 64,92 47,99
5. Loss Reserves for Receivables / Impaired Receivables 90,07 81,27 37,63
6. Collaterals / Total Receivables 817,69 1.665,21 130,34
7. Total FX Position / Total Assets 0,04 0,00 0,02
8. Total FX Position / Equity 0,43 0,00 0,07
9. Assets / Total Guarantees and Commitments + Assets 100,00 100,00 100,00