turbo method development system - perkinelmer method development system ... pumps, totalchrom now...
TRANSCRIPT

automated optimizationtools
for developing HPLC methods.
L iqu id Chromatography
Turbo Method DevelopmentSystem
Life Sciences Optoelectronics Instruments Fluid Sciences
PerkinElmer is the pioneer in automated methoddevelopment — and has continued to build on thatreputation and expertise. Today, by combining theproven performance of our HPLC instruments, thecomprehensive and award-winning power of ourTotalChrom chromatography data system AND ourintuitive Turbo Method Development (TMD) software,only PerkinElmer is fully prepared to meet all yourmethod development needs with a unified HPLC sys-tem solution! While others may claim to offer toolsthat “validate” methods statistically — no othermethod validation solution actually automates theentire process of generating methods, collecting dataand assessing method effectiveness all with a mini-mum of user intervention!
Everyone develops methods...All chromatographers develop, optimize or validate
methods. Whether it’s refining a method transferredbetween labs, adapting a working method to a differ-ent sample matrix, or the extreme case of developingof an entirely new method to separate a new sample,there are usually similar chromatographic goals andrequirements.
Those working in a regulated environment — in order tocomply with ICH or similar guidelines — must performall of these activities. These experiments have tradition-ally been performed one-by-one, manually and weretherefore very labor intensive and time consuming.
Today, with the ever increasing need to shorten develop-ment cycles and minimize labor costs — all whileensuring regulatory compliance — this type of solventoptimization and method validation can be done faster,easier and under greater process control with a total,automated solution from PerkinElmer.
Method development and validation MADE EASY...
PerkinElmer’s UNIQUE TMD system
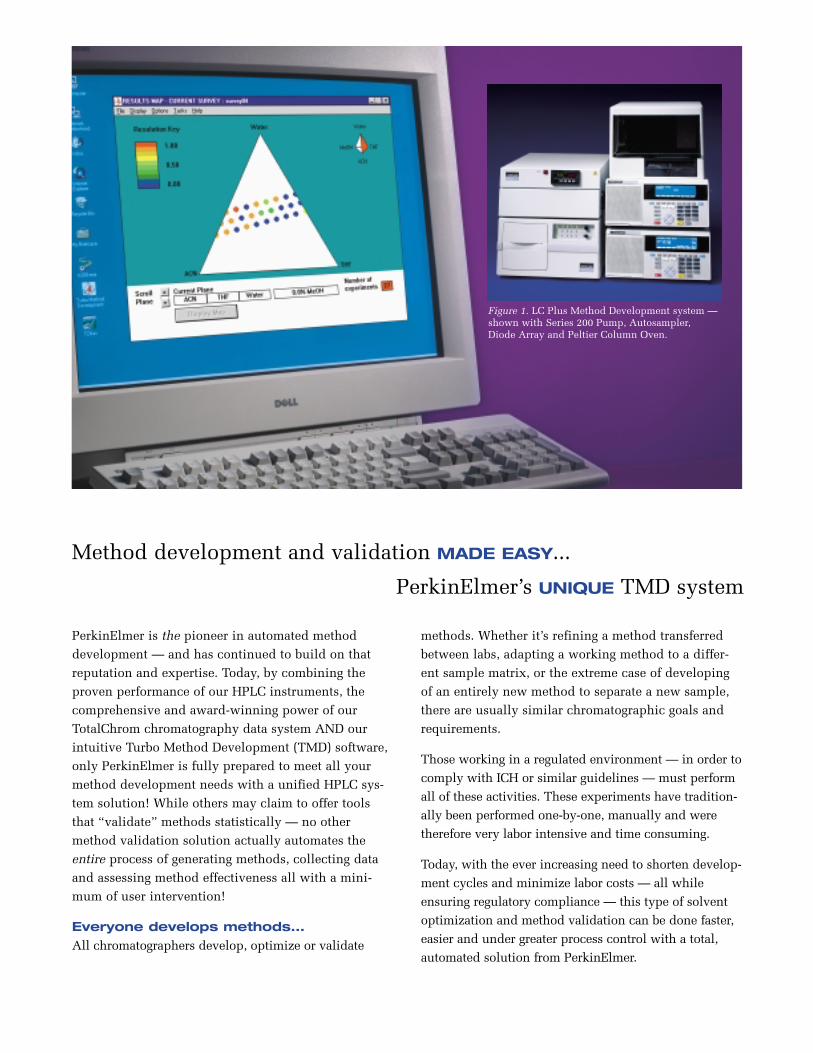
Figure 1. LC Plus Method Development system — shown with Series 200 Pump, Autosampler,Diode Array and Peltier Column Oven.

HPLC instruments you can count on forquality, performance and reliably
During every step in the method development processit’s critical to utilize instrumentation that deliversaccurate and precise results day after day, week afterweek. After all, the ultimate effectiveness of themethod is predicated on it being built on a solid foun-dation. Therefore, it’s only natural to demand thehighest levels of performance from the HPLC systembeing employed. PerkinElmer’s HPLC instrumentswere designed to meet the unique demands of methoddevelopment as well as meeting the rigors of routine,high throughput usage.
Series 200 Quaternary Gradient Pump
■ The only HPLC pump that provides accuratemethod reproducibility and transferability withresults identical to those obtained via premixed(mixed by hand) mobile phases.
■ The Series 200 is the only pump available todaythat automatically and continuously compensatesfor solvent compressibility — no matter the dura-tion of the run or the complexity of the gradient!
■ No other pump is capable of meeting that challenge!
Series 200 Autosampler
■ Ensures accuracy and repeatability using a rapidand rugged all gear-driven XYZ sampling mecha-nism — never any belts to slip or wear out or noneof the risk and wasted time inherent with movingsample vials via a robotic arm.
■ In addition to its reliability, the Series 200 is thefastest and most flexible HPLC autosampler avail-able — supporting many different vial andmicrotiter plate formats — including several peltierheated/cooled versions for kinetic studies or tem-perature labile samples.
■ The Series 200 also minimizes carryover and vial-to-vial contamination concerns by washing both theinside and the outside of the sampling needle witha fresh flush solvent after each and every run!
Series 200 Diode Array Detector
■ Provides you with true UV/Vis performance andhigh-resolution spectral data to verify peak homo-geneity, track component RT changes vs. solventcomposition, and to assist with the identification ofunknown components.
■ Simultaneous deuterium and tungsten sourcesensure performance and high sensitivity across theentire 190 to 700nm wavelength range.
■ Peak purity, lambda max, and component ID confir-mation values can automatically be calculated andinserted right in to your chromatographic report.
F A S T F A C T S
Method Development Checklist➞ Develop an HPLC method to perform the separation
in the minimum analysis time while retainingspecificity, precision and accuracy.
➞ Confirm the specificity of the method; purity and identification of component peaks, and eliminateco-elution concerns via spectral techniques.
➞ Ensure that the method is fully optimized and thatit’s robust enough to resist the effects of smallchanges in mobile phase composition.
➞ Evaluate how variations in the brand, type, lot andage of the HPLC column can effect the performanceof the method.
➞ Ensure that all methods and data are developed andstored in compliance with all applicable regulatoryrequirements.
“PerkinElmer is COMMITTED to providing you with the
highest QUALITY instrumentation available anywhere. We’re very
proud to have been awarded the “Readers’ Choice 2000” Award
as the NUMBER ONE instrument manufacturer in quality
by Today’s Chemist at Work magazine.”
TotalChrom Workstation
TotalChrom is the next stage in the evolution of chro-matography software — building upon Turbochrom,the industry-standard, most respected name in PC-based chromatography data handling software. Aproven solution that’s won the “Readers Choice”Award from Scientific Computing & Automation maga-zine for the eighth consecutive year!
In addition to aiding in the development, optimizationand validation of methods, your laboratory needs acomputing strategy to adequately handle the growingvolume of chromatographic data quickly and efficiently.A strategy that can easily be implemented and that cangrow and adapt to your changing needs. A strategy thatsatisfies regulatory requirements such as 21 CFR part 11and the need to archive and recall data — all whilemaintaining ease of use. TotalChrom is the answer.
TotalChrom uses Microsoft Windows standard inter-faces and graphics — allowing you to quickly and easi-ly build instrument control and data handling meth-ods. By combining the power of TotalChrom withPerkinElmer’s HPLC instrumentation — several newand valuable capabilities have been added. In additionto control of our isocratic, binary and quaternarypumps, TotalChrom now controls the PerkinElmerSeries 200 Micro Pumps — offering for the first time aunified HPLC system capable of scaling from micro-bore analysis up to traditional analytical flows. In com-bination with the Series 200 AutoSampler, TotalChromallows you to quickly and easily perform automatedserial dilution routines and derivation studies —
freeing you from having to manually dilute samples orprepare several standards of varying concentration.TotalChrom also fully controls the Series 200 UV/Visvariable wavelength detector and the Series 200 DiodeArray detector — providing the quantitative and quali-tative information you need for method development.This same level of automation and sophistication isavailable for building lengthy sequences of multipleruns quickly and easily via TotalChrom’s template dri-ven Sequence Editor — featuring that spreadsheet lookand feel you’re familiar with.
Then there’s the unique Graphic Method Editor (GME)that builds the best data handling method based onyour particular chromatographic results. Identifyingthe proper peak detection thresholds is critical whenevaluating such items as limits of detection and limitsof quantitation.
Perhaps most important, once your data is collected,our new TC Publisher raises the bar on data reportingby providing a custom report generator using industry-standard tools. Unique features let you graphically for-mat the exact report you want, control the layout andappearance of your chromatograms, and even use“if/then” conditional logic — all without extensivetraining. TC Publisher even lets you do calculationsbetween samples and do automatic statistics for repli-cate injections — with full control over the format ofthe output. In fact, TC Publisher will often replacethose special custom applications written for your cur-rent system — thus minimizing costs, efforts and vali-dation concerns.
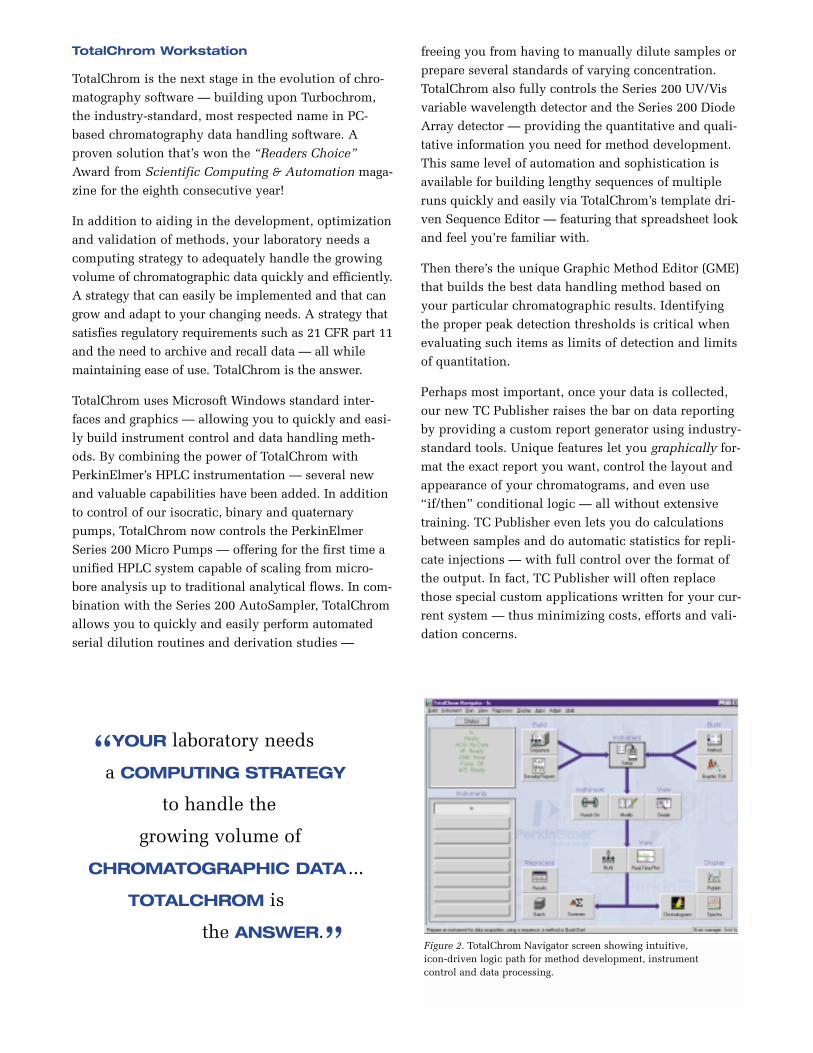
Figure 2. TotalChrom Navigator screen showing intuitive, icon-driven logic path for method development, instrument control and data processing.
“YOUR laboratory needs
a COMPUTING STRATEGY
to handle the
growing volume of
CHROMATOGRAPHIC DATA ...
TOTALCHROM is
the ANSWER.”
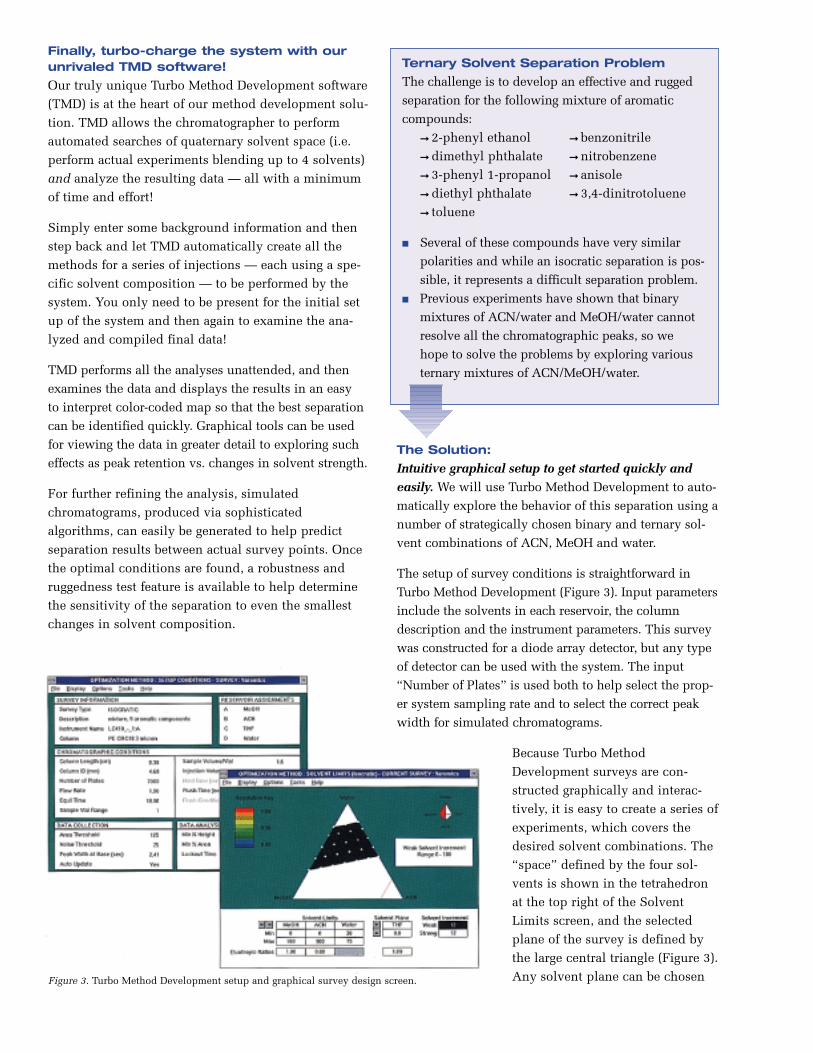
Figure 3. Turbo Method Development setup and graphical survey design screen.
Finally, turbo-charge the system with ourunrivaled TMD software!
Our truly unique Turbo Method Development software(TMD) is at the heart of our method development solu-tion. TMD allows the chromatographer to performautomated searches of quaternary solvent space (i.e.perform actual experiments blending up to 4 solvents)and analyze the resulting data — all with a minimumof time and effort!
Simply enter some background information and thenstep back and let TMD automatically create all themethods for a series of injections — each using a spe-cific solvent composition — to be performed by thesystem. You only need to be present for the initial setup of the system and then again to examine the ana-lyzed and compiled final data!
TMD performs all the analyses unattended, and thenexamines the data and displays the results in an easy to interpret color-coded map so that the best separationcan be identified quickly. Graphical tools can be usedfor viewing the data in greater detail to exploring sucheffects as peak retention vs. changes in solvent strength.
For further refining the analysis, simulated chromatograms, produced via sophisticated algorithms, can easily be generated to help predictseparation results between actual survey points. Oncethe optimal conditions are found, a robustness andruggedness test feature is available to help determinethe sensitivity of the separation to even the smallestchanges in solvent composition.
The Solution:
Intuitive graphical setup to get started quickly andeasily. We will use Turbo Method Development to auto-matically explore the behavior of this separation using anumber of strategically chosen binary and ternary sol-vent combinations of ACN, MeOH and water.
The setup of survey conditions is straightforward inTurbo Method Development (Figure 3). Input parametersinclude the solvents in each reservoir, the columndescription and the instrument parameters. This surveywas constructed for a diode array detector, but any typeof detector can be used with the system. The input“Number of Plates” is used both to help select the prop-er system sampling rate and to select the correct peakwidth for simulated chromatograms.
Because Turbo MethodDevelopment surveys are con-structed graphically and interac-tively, it is easy to create a series ofexperiments, which covers thedesired solvent combinations. The“space” defined by the four sol-vents is shown in the tetrahedronat the top right of the SolventLimits screen, and the selectedplane of the survey is defined bythe large central triangle (Figure 3).Any solvent plane can be chosen
Ternary Solvent Separation Problem
The challenge is to develop an effective and ruggedseparation for the following mixture of aromaticcompounds:
➞ 2-phenyl ethanol ➞ benzonitrile➞ dimethyl phthalate ➞ nitrobenzene➞ 3-phenyl 1-propanol ➞ anisole➞ diethyl phthalate ➞ 3,4-dinitrotoluene➞ toluene
■ Several of these compounds have very similarpolarities and while an isocratic separation is pos-sible, it represents a difficult separation problem.
■ Previous experiments have shown that binarymixtures of ACN/water and MeOH/water cannotresolve all the chromatographic peaks, so wehope to solve the problems by exploring variousternary mixtures of ACN/MeOH/water.
for an experiment (three solvents are varied, one heldconstant). You use the solvent limits and incrementsprecisely define range and number of survey experi-ments to be performed (white points). This surveyincludes “eluotropic ratios” which correct the solventmixtures for the relative elution strength of eachstrong solvent. We want to use them in the case, sothat changes in solvent strength do not overcomedesired changes in selectivity as we change solventsfrom MeOH to ACN.
Before the survey is run, a list of experiments can begenerated to show the exact solvent composition andrun time for each injection (Figure 4). The “calculateusage” function gives information about the total num-ber of experiments, survey duration, and exact solventusage from each reservoir. The nine-aromatic surveywill take 23 hours for 26 experiments. Therefore, youknow how much solvent you will need to preparebefore the analysis starts.
Full automation — multitasking system to maximizeefficiency. The collection and processing of surveydata in Turbo Method Development is completely auto-matic so that survey injection sequences can be collect-ed overnight or at any time without an operator. SinceTurbo Method Development and TotalChrom are fullymultitasking, the workstation may be used for a varietyof other tasks — even operating other chromatographson the system or reprocessing TotalChrom data while asurvey is in progress.
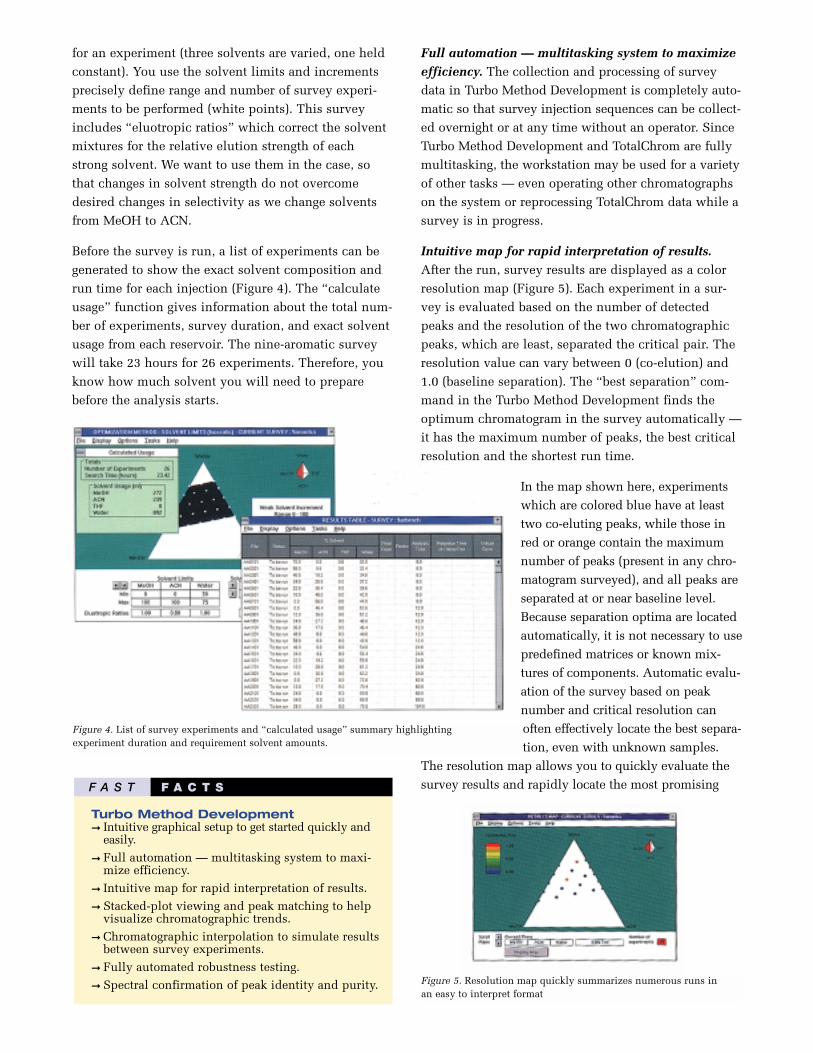
Intuitive map for rapid interpretation of results.After the run, survey results are displayed as a colorresolution map (Figure 5). Each experiment in a sur-vey is evaluated based on the number of detectedpeaks and the resolution of the two chromatographicpeaks, which are least, separated the critical pair. Theresolution value can vary between 0 (co-elution) and1.0 (baseline separation). The “best separation” com-mand in the Turbo Method Development finds theoptimum chromatogram in the survey automatically —it has the maximum number of peaks, the best criticalresolution and the shortest run time.
In the map shown here, experimentswhich are colored blue have at leasttwo co-eluting peaks, while those inred or orange contain the maximumnumber of peaks (present in any chro-matogram surveyed), and all peaks areseparated at or near baseline level.Because separation optima are locatedautomatically, it is not necessary to usepredefined matrices or known mix-tures of components. Automatic evalu-ation of the survey based on peaknumber and critical resolution canoften effectively locate the best separa-tion, even with unknown samples.
The resolution map allows you to quickly evaluate thesurvey results and rapidly locate the most promising
Figure 5. Resolution map quickly summarizes numerous runs in an easy to interpret format
Figure 4. List of survey experiments and “calculated usage” summary highlighting experiment duration and requirement solvent amounts.
Turbo Method Development➞ Intuitive graphical setup to get started quickly and
easily.
➞ Full automation — multitasking system to maxi-mize efficiency.
➞ Intuitive map for rapid interpretation of results.
➞ Stacked-plot viewing and peak matching to helpvisualize chromatographic trends.
➞ Chromatographic interpolation to simulate resultsbetween survey experiments.
➞ Fully automated robustness testing.
➞ Spectral confirmation of peak identity and purity.
F A S T F A C T S
regions and studied “solvent space.” In our case, themap shows some potentially useful regions, but moreinformation would be helpful. Turbo MethodDevelopment also provides a convenient way to lookat the movement of chromatographic peaks and tohelp predict chromatographic results in regions notsurveyed using computer simulation.
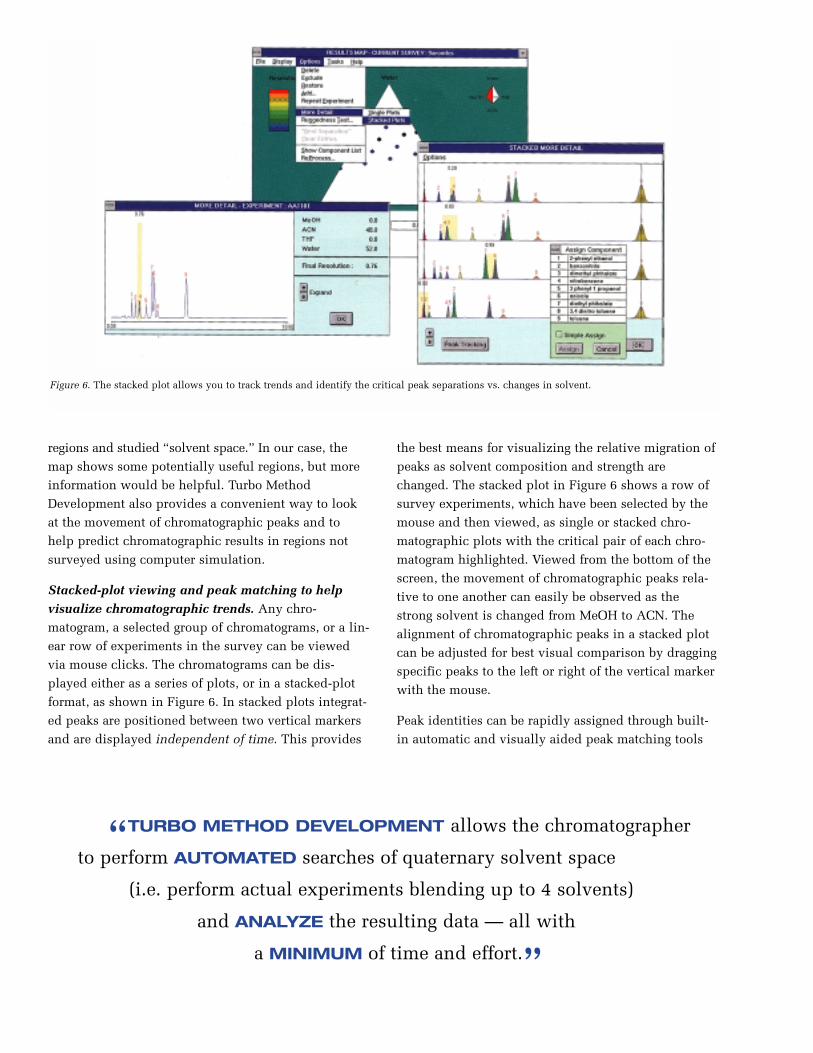
Stacked-plot viewing and peak matching to helpvisualize chromatographic trends. Any chro-matogram, a selected group of chromatograms, or a lin-ear row of experiments in the survey can be viewedvia mouse clicks. The chromatograms can be dis-played either as a series of plots, or in a stacked-plotformat, as shown in Figure 6. In stacked plots integrat-ed peaks are positioned between two vertical markersand are displayed independent of time. This provides
the best means for visualizing the relative migration ofpeaks as solvent composition and strength arechanged. The stacked plot in Figure 6 shows a row ofsurvey experiments, which have been selected by themouse and then viewed, as single or stacked chro-matographic plots with the critical pair of each chro-matogram highlighted. Viewed from the bottom of thescreen, the movement of chromatographic peaks rela-tive to one another can easily be observed as thestrong solvent is changed from MeOH to ACN. Thealignment of chromatographic peaks in a stacked plotcan be adjusted for best visual comparison by draggingspecific peaks to the left or right of the vertical markerwith the mouse.
Peak identities can be rapidly assigned through built-in automatic and visually aided peak matching tools
Figure 6. The stacked plot allows you to track trends and identify the critical peak separations vs. changes in solvent.
“TURBO METHOD DEVELOPMENT allows the chromatographer
to perform AUTOMATED searches of quaternary solvent space
(i.e. perform actual experiments blending up to 4 solvents)
and ANALYZE the resulting data — all with
a MINIMUM of time and effort.”

so that you can track components through variousregions of the survey and also so that you can performchromatographic interpolation experiments. Peaks canbe matched visually by using the mouse, or automati-cally through the “Peak Tracking” button, whichassigns numbers to each chromatographic componentin a stacked plot based upon relative peak area.
Chromatographic interpolation to simulate resultsbetween survey experiments. As shown in Figure 7,you can use the interpolation capabilities of TurboMethod Development to easily generate simulatedchromatograms in regions of the survey between actu-al experiments, helping to uncover new areas wherebetter separations might be possible. The simulatedchromatograms for this survey, shown as hollow hexa-gons, predict that baseline separations are possible inseveral places not performed in the original survey.All of the simulated chromatograms become a part ofthe survey and are shown in red in the results table.Simulation is an excellent predictive tool. Forinstance, there are two areas in this survey which arepredicted by interpolation to yield baseline separa-tions — but the simulations at the top of the map (65-70% water) have a 20-25 minute run time while those
in the middle of the survey (50% water) have a morepractical run time of ten minutes or less. Confirmingany simulation can be done automatically through the“Repeat Experiment” command.
Fully automated robustness testing. Now that a viablesurvey region has been located (50% H2O, 40% MeOH,10% ACN), the sensitivity of the separation to smallmobile phase changes must be determined. Methodrobustness testing is required in the pharmaceuticalindustry and in other regulated HPLC laboratories. InTurbo Method Development it’s referred to as a“ruggedness test”. The test can be designed aroundany survey point (actual or simulated) and the range ofthe test and the number of experiments can be set inaccordance with the intended usage of the method. Inthe nine-aromatic example we have executed a“ruggedness test” around the located survey optimum(Figure 8). Because the optimum was found in a regiondefined by simulated data, we will both confirm thesimulations and test for robustness in the same experi-ment. “Ruggedness tests” and all additional surveyinjections become integrated into the survey, and allsurvey data are reevaluated after the new data havebeen processed.
Figure 7. TMD can generate interpolated chromatograms (represented on the map by “hollow” data points) between actual survey points to helppredict and uncover better separations quickly and easily.
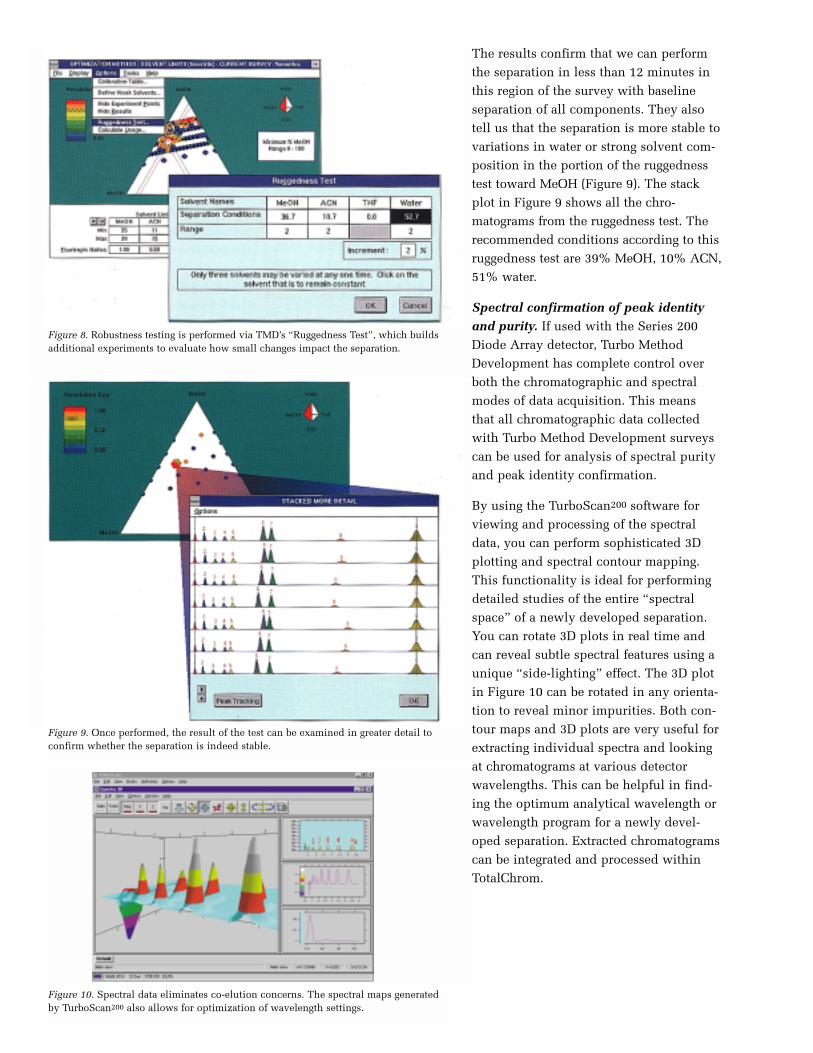
The results confirm that we can performthe separation in less than 12 minutes inthis region of the survey with baselineseparation of all components. They alsotell us that the separation is more stable tovariations in water or strong solvent com-position in the portion of the ruggednesstest toward MeOH (Figure 9). The stackplot in Figure 9 shows all the chro-matograms from the ruggedness test. Therecommended conditions according to thisruggedness test are 39% MeOH, 10% ACN,51% water.
Spectral confirmation of peak identityand purity. If used with the Series 200Diode Array detector, Turbo MethodDevelopment has complete control overboth the chromatographic and spectralmodes of data acquisition. This meansthat all chromatographic data collectedwith Turbo Method Development surveyscan be used for analysis of spectral purityand peak identity confirmation.
By using the TurboScan200 software forviewing and processing of the spectraldata, you can perform sophisticated 3Dplotting and spectral contour mapping.This functionality is ideal for performingdetailed studies of the entire “spectralspace” of a newly developed separation.You can rotate 3D plots in real time andcan reveal subtle spectral features using aunique “side-lighting” effect. The 3D plotin Figure 10 can be rotated in any orienta-tion to reveal minor impurities. Both con-tour maps and 3D plots are very useful forextracting individual spectra and lookingat chromatograms at various detectorwavelengths. This can be helpful in find-ing the optimum analytical wavelength orwavelength program for a newly devel-oped separation. Extracted chromatogramscan be integrated and processed withinTotalChrom.
Figure 8. Robustness testing is performed via TMD’s “Ruggedness Test”, which buildsadditional experiments to evaluate how small changes impact the separation.
Figure 9. Once performed, the result of the test can be examined in greater detail to confirm whether the separation is indeed stable.
Figure 10. Spectral data eliminates co-elution concerns. The spectral maps generatedby TurboScan200 also allows for optimization of wavelength settings.
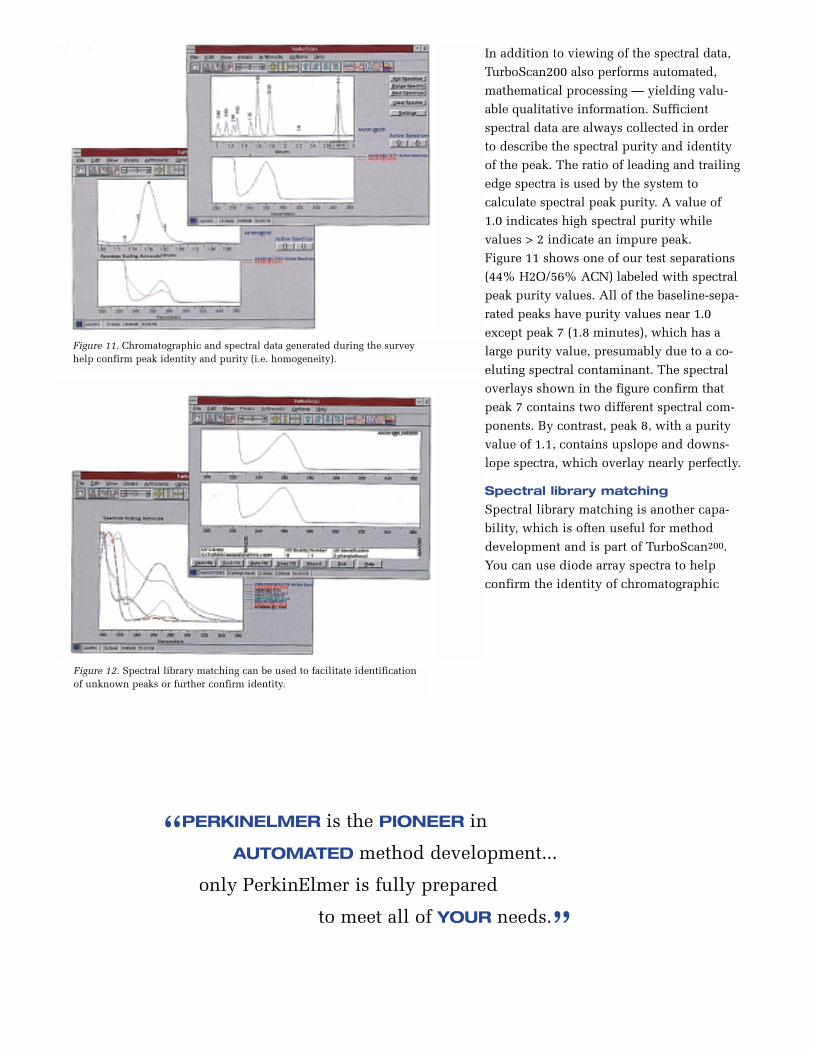
In addition to viewing of the spectral data,TurboScan200 also performs automated,mathematical processing — yielding valu-able qualitative information. Sufficientspectral data are always collected in orderto describe the spectral purity and identityof the peak. The ratio of leading and trailingedge spectra is used by the system to calculate spectral peak purity. A value of1.0 indicates high spectral purity while values > 2 indicate an impure peak. Figure 11 shows one of our test separations(44% H2O/56% ACN) labeled with spectralpeak purity values. All of the baseline-sepa-rated peaks have purity values near 1.0except peak 7 (1.8 minutes), which has alarge purity value, presumably due to a co-eluting spectral contaminant. The spectraloverlays shown in the figure confirm thatpeak 7 contains two different spectral com-ponents. By contrast, peak 8, with a purityvalue of 1.1, contains upslope and downs-lope spectra, which overlay nearly perfectly.
Spectral library matching
Spectral library matching is another capa-bility, which is often useful for methoddevelopment and is part of TurboScan200.You can use diode array spectra to helpconfirm the identity of chromatographic
Figure 11. Chromatographic and spectral data generated during the survey help confirm peak identity and purity (i.e. homogeneity).
Figure 12. Spectral library matching can be used to facilitate identificationof unknown peaks or further confirm identity.
“PERKINELMER is the PIONEER in
AUTOMATED method development...
only PerkinElmer is fully prepared
to meet all of YOUR needs.”
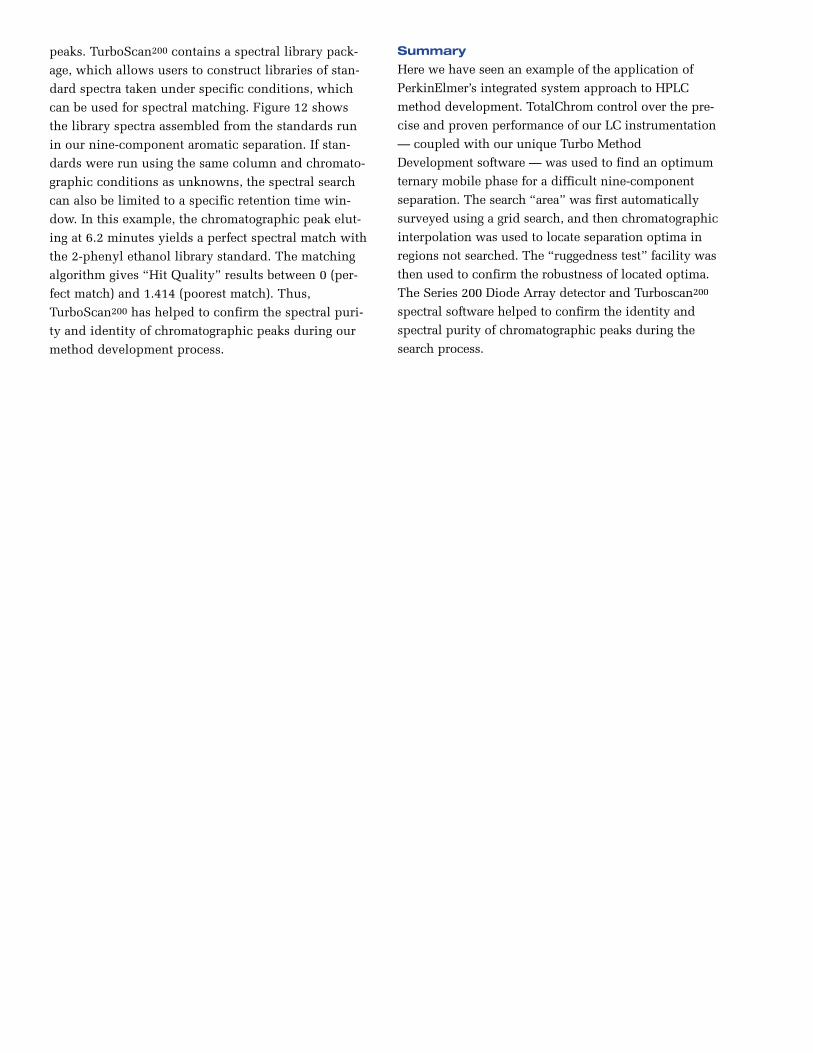
peaks. TurboScan200 contains a spectral library pack-age, which allows users to construct libraries of stan-dard spectra taken under specific conditions, whichcan be used for spectral matching. Figure 12 showsthe library spectra assembled from the standards runin our nine-component aromatic separation. If stan-dards were run using the same column and chromato-graphic conditions as unknowns, the spectral searchcan also be limited to a specific retention time win-dow. In this example, the chromatographic peak elut-ing at 6.2 minutes yields a perfect spectral match withthe 2-phenyl ethanol library standard. The matchingalgorithm gives “Hit Quality” results between 0 (per-fect match) and 1.414 (poorest match). Thus,TurboScan200 has helped to confirm the spectral puri-ty and identity of chromatographic peaks during ourmethod development process.
Summary
Here we have seen an example of the application ofPerkinElmer’s integrated system approach to HPLCmethod development. TotalChrom control over the pre-cise and proven performance of our LC instrumentation— coupled with our unique Turbo MethodDevelopment software — was used to find an optimumternary mobile phase for a difficult nine-componentseparation. The search “area” was first automaticallysurveyed using a grid search, and then chromatographicinterpolation was used to locate separation optima inregions not searched. The “ruggedness test” facility wasthen used to confirm the robustness of located optima.The Series 200 Diode Array detector and Turboscan200
spectral software helped to confirm the identity andspectral purity of chromatographic peaks during thesearch process.

PerkinElmer is a trademark of PerkinElmer, Inc. TurboScan and TotalChrom are trademarks of PerkinElmer Instruments LLC. Windows is a registered trademark of Microsoft Corporation.
L-1854B KG060105 Printed in USA © 2001 PerkinElmer, Inc.
PerkinElmer InstrumentsHeadquarters Office710 Bridgeport AvenueShelton, CT 06484-4794 USAPhone: (800) 762-4000www.perkinelmer.com
Around the corner or across the world, you candepend on PerkinElmer as your partner in provid-ing total solutions for your analytical needs.That’s because there’s MORE to us than ourinstruments and advanced technology. Our com-prehensive support system is designed to helpyour lab operate with greater accuracy, efficiencyand productivity.
Financing Programs
PerkinElmer has a suite of leasing programs tocomplement the needs of today’s companies. In
most cases, you can finance 100% of the instru-ment, software and maintenance—or you maycustomize your own lease.
Unparalleled Customer Support
Most importantly, we’ve assembled a worldwidesupport team that’s unparalleled in the industry—highly trained, knowledgeable people standing byto make sure you always get the assistance youneed, when you need it, whether on-site, onlineor over the phone.
We’re your worldwide partner in BUSINESS SUCCESS.