turbine hub and shroud sealing flow loss mechanisms · turbine hub and shroud sealing flow loss...
TRANSCRIPT
Proceedings of ASME Turbo Expo 2011GT 2011
June 6-10, 2011, Vancouver, Canada
GT2011-46718
TURBINE HUB AND SHROUD SEALING FLOW LOSS MECHANISMS
Metodi Blagoev Zlatinov ∗Choon Sooi Tan
Gas Turbine LaboratoryMassachusetts Institute of Technology
Email: [email protected]
Matthew MontgomeryTito Islam
Melissa Seco-Soley
Gas Turbine EngineeringSiemens Energy Inc.
Orlando, Florida
ABSTRACTPurge air is injected through seals in the hub and shroud
of axial turbines in order to prevent hot gas ingestion into theinter-stage gaps. An investigation into the losses involved withthe injection of purge air has been undertaken, with the objec-tives of answering where the losses are generated, how they aregenerated, and what are the most effective ways for reducingthem. In order to address these questions, a consistent frame-work for interpreting entropy generation as a measure of lossis developed for turbomachinery applications with secondary airstreams. A procedure for factoring out distinct effects is also pre-sented. These tools, applied to steady computations, elucidatefour routes though which change in loss generation is broughtabout by injection of purge air: a shear layer between purge andmain streams, interaction with the passage vortex system thatgenerates radial velocity gradients, changes in wetted loss andtip clearance flow due to an increased degree of reaction, andthe potential for reducing tip clearance flow for the case of purgeflow injected from the shroud. An emphasis is placed on trac-ing these effects to specific purge flow characteristics that drivethem. The understanding gained provides a rationale for the ob-served sensitivity of purge flow losses to the design parameterspurge air mass fraction and swirl, compared to purge slot axialinclination and gap width. Pre-swirling of purge flow is less ef-fective in mitigating losses in the case of shroud-injection, sincethere is a tradeoff with the tip clearance flow suppression effect.
∗Address all correspondence to this author.
NOMENCLATUREA Areacx Axial chorddg Purge gap widthh Specific enthalpyke f f Effective thermal conductivitym Mass flow rateµe f f Effective viscosityΩ Angular speedP Pressureqin Heat transfer per unit area into control volumerhub Hub radiuss Specific entropyS′′′gen Entropy generation rate per unit volumeT Temperatureτi j Shear stress tensorU Disk rim speed, U = ΩrhubV VelocityV Volumew Specific work
Subscripts and Superscriptsa,b Primary and secondary streamsma Mass-averaged quantityRin Rotor inlet planerel Relative frames,c,r Streamwise, cross-flow and radial directions
1 Copyright c© Siemens Energy, Inc. 2011. All rights reserved.
Proceedings of ASME Turbo Expo 2011 GT2011
June 6-10, 2011, Vancouver, British Columbia, Canada
GT2011-46718
1 Copyright © 2011 by ASME and Siemens Energy, Inc.
TE Rotor trailing edge planetot Sum of all streamst1,t2 Stagnation quantity at inflow and outflowt2s Stagnation quantity after ideal expansiontherm Due to heat transfervisc Due to viscous effectswa Work-averaged quantityx,θ ,r Axial, circumferential and radial directions
Non-Dimensional QuantitiesAR Aspect Ratioη Efficiencygf Gap fraction, dg
(rtip−rhub)
λ degree of reaction, ∆hrotor∆hstage
mf Mass fraction, mbma
M Mach numberπ Stage pressure ratioΨ Stage Loading, ∆ht
(Ωrmidspan)2
Φ Flow Coefficient, VxΩrmidspan
φ Injection anglesf Swirl fraction, Vθ
Uσ Solidity, (chorld length/pitch)
INTRODUCTIONIn gas turbines for power generation and aircraft propulsion,
sealing air, commonly referred to as purge air, must be ejectedthrough inter-stage gaps in the hub and shroud of axial turbines toprevent hot gas ingestion into the cavities outside the mainstreamflow path. These secondary air streams interact with the main-stream flow to generate loss. While it has been demonstratedthat certain injection schemes can lead to a reduction in purgeflow-related losses, the flow processes that underlie the observedimprovements are not well understood. The overall goal of thispaper is to delineate and quantify the various loss mechanismsassociated with purge flow injection and trace them back to thespecific purge flow characteristics, thereby providing guidelinesfor a design process based on physical rationale.
The existing literature on this subject has been helpful inguiding the research leading to the results in this paper. Pauet. al. [1] found that injecting purge flow leads to an increasein efficiency, mainly due to the modification of the shock systemdownstream of the stator and to a reduction of the stator trail-ing edge shock losses. However most studies show efficiencypenalties associated with purge flow injection. Kost and Nick-las [2] noted the potential for increasing the horseshoe vortex ifthe purge slot traverses the saddle point. Reid et. al. [3] con-ducted measurements and calculations of purge-mainstream in-teractions, suggesting two loss mechanisms: one due to the mix-ing of the sealant flow with the mainstream flow and the other
due to the change in the flow through a downstream blade row.However these two mechanisms were not rigorously isolated andquantified in terms of purge flow parameters. Ong et. al. [4]uses an analytical mixing model to isolate the purge-mainstreammixing loss, and links the additional losses to a change in flowangles. More recently, Popovic and Hodson [5] have identifiedthree regimes for loss depending on purge mass flow rate andsealing effectiveness. Some new vortical structures have beenobserved [6] to emerge from a purge slot on a linear cascade, andhave been suggested as a cause of enhanced losses. In terms ofdesign improvements, a number of publications [3] [7] [5] havepointed to the potential for reducing losses through swirling ofpurge flow prior to injection. McLean et. al. [8] studied threetypes of injection configurations, and actually observed an in-crease in efficiency from purge injection via root injection.
Clearly, a substantial amount of research has been done onsecondary air losses. However, a lack of clarity in the causal re-lationship between these losses and their drivers still prevents asystematic approach to the design of purge flow injection sys-tems. The specific objectives of this paper are to identify whereand how additional losses are generated due to purge flow injec-tion, and based on this understanding to propose guidelines as towhich design parameters are most effective in mitigating theseloss sources. This paper is organized as follows. Framework ap-proach is first described. The results are then presented to firstdelineate the loss sources in a baseline case with no purge flow.This is followed by results to systematically identify additionalloss mechanisms associated with purge flow injection. Finally, asection is devoted to quantitative delineation of design effects.
FRAMEWORK OF RESEARCH APPROACHSystem Modeling
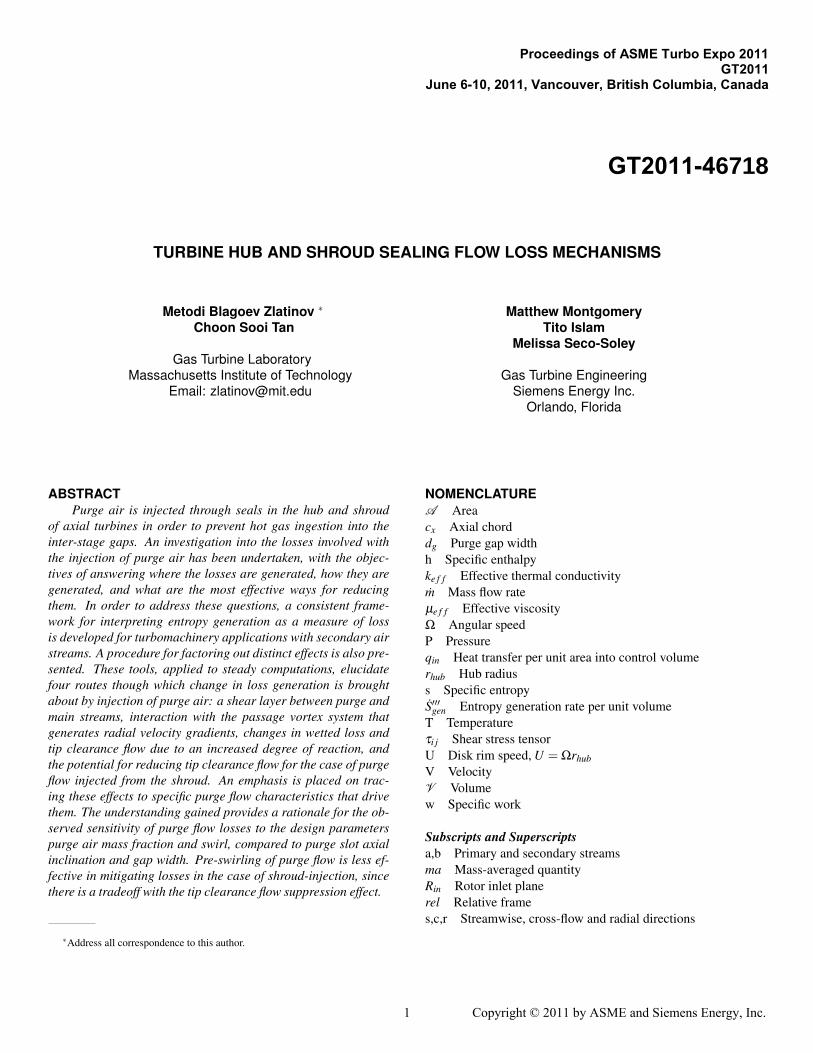
To allow for a systematic delineation of the loss mechanismsassociated with purge flow injection, two models of purge flowinteracting with mainstream flow have been studied in depth us-ing both analytical and computational tools. The first model, il-lustrated in Fig. 1(a), consists of purge flow injection into a sim-ple axisymmetric throughflow (an abstraction of a turbine in theform of an annular duct with no blades). The second model con-sists of a full three dimensional blade passage with nozzle guidevane (NGV) and rotor blade, as depicted in Fig. 1(b). Purge airis injected upstream of the rotor, either at the hub or shroud, andthere is a mixing plane upstream of the purge slots. The valueof this incremental modeling approach is that it allows for lossmechanisms observed in the axisymmetric configuration to befactored out from the three dimensional configuration, therebyrevealing and isolating additional loss mechanisms. The charac-teristics of the representative first stage high pressure unshroudedturbine used for this investigation are listed in Table 1.
Within this framework, four purge flow parameters were in-vestigated for their effect on loss: the purge air mass flow rate,
2 Copyright c© Siemens Energy, Inc. 2011. All rights reserved.
2 Copyright © 2011 by ASME and Siemens Energy, Inc.
maVaTa
mb, Vb,,Tb
dg
ϕ
(a) axisymmetric model
Hub Purge Slot
NGV Rotor
InflowOutflow
Mixing Plane
Shroud Purge Slot
(b) three dimensional blade passage with mixing plane
FIGURE 1. AXISYMMETRIC AND THREE DIMENSIONAL MODELS
TABLE 1. CHARACTERISTICS OF A REPRESENTATIVE TURBINE
STAGE
Quantity Value Quantity Value
Ω 2749 [rad/s] U 300 [m/s]
ARrotor 1.11 π 0.546
Mrotorin 0.785 λ 0.412
Ψ 2.17 Φ 0.65
Tpurge/Tmain 0.5 σrotor 1.37
circumferential (swirl) velocity of purge flow prior to injection,purge jet axial inclination and purge gap width (the last two pa-rameters control purge flow axial and radial momentum, for agiven purge mass flow rate). These design parameters are castin non-dimensional terms as the purge flow mass fraction (mf),swirl fraction of the rim speed (sf), injection angle (φ ) and gapfraction of the annulus height (gf). The design space for whichthis investigation was performed was chosen to be a superset ofthe typical range of parameter values found in industry, spanning0 < s f < 1, 0 < m f < 0.015 , 0 < φ < 90, 0.05 < g f < 0.083.
Computational and Analytical ToolsThe axisymmetric model was investigated both analytically,
based on the method outlined in [9], and computationally, usingthe Ansys 12.0 CFX solver on a structured grid. The three di-mensional blade passage was investigated computationally, withstructured grids generated with the default topology of Auto-gird - O4H1. Grid-convergence studies showed that increasingthe number of nodes used for modeling from 0.9 to 1.9 millionresults in only 3% change in the total losses and less than 1%change in net purge flow losses. Most of the results presented arefrom the finer mesh, while the coarse mesh was used for more ex-pedient parametric studies. In all computations the k−ω ShearStress Transport turbulence model was used with wall functions(y+≈ 12). A typical turbulence intensity of 10% was imposed atthe NGV inlet boundary and 5% at the purge slot inlet boundary.
Interpretation of Entropy as a Measure of LossEntropy generation due to irreversible processes can be re-
lated to lost opportunity to do work in a turbine through the ar-guments in Appendix A. It will also be shown in the followingsubsection that volumetric entropy generation rate can be a use-ful tool for tracing losses to responsible flow features. For thesereasons the authors have chosen to use entropy generation as themeasure of loss. However, it is important to realize that entropygeneration due to thermal mixing is not a loss with respect tothe turbine but rather to the cycle, and in assessing turbine per-formance one must consider viscous effects only. This sectionpresents a method for isolating viscous losses in the context ofmulti-stream and non-uniform flow expansion.
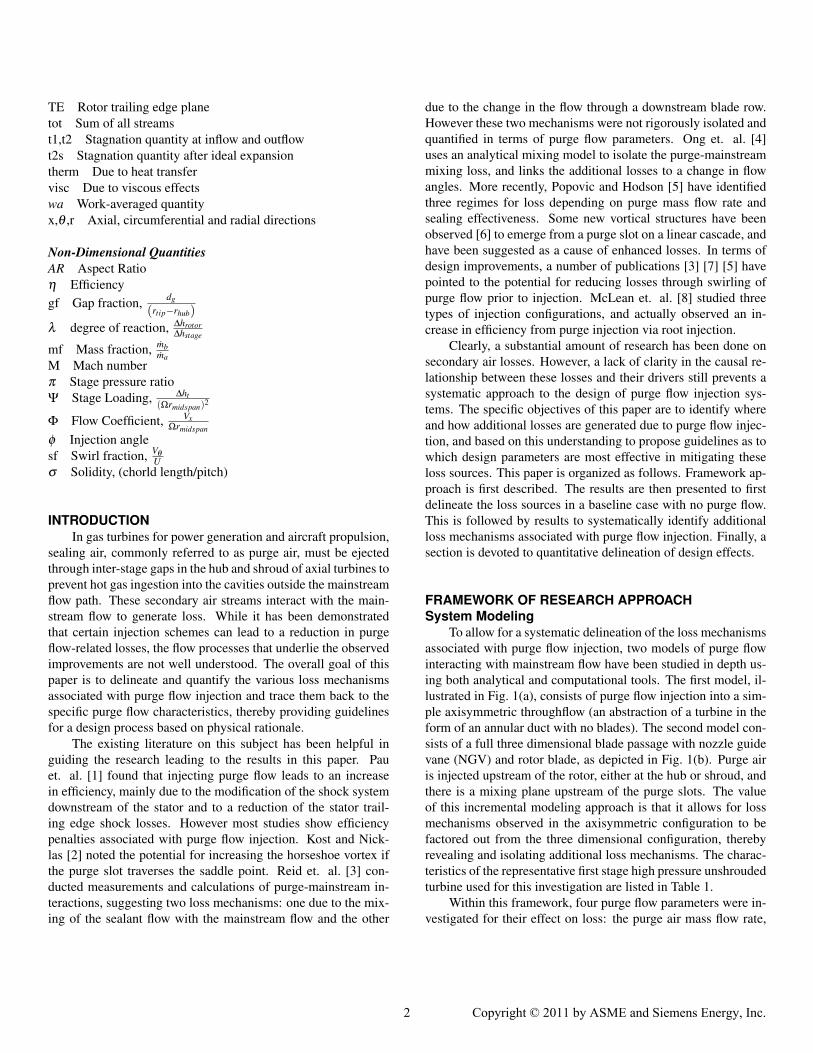
Consider first the scenario of multiple streams of workingfluid with distinct inlet conditions being expanded through a tur-bine to the same downstream stagnation pressure. One way ofdealing with such an expansion is by tracing each individual fluidstream as it expands through the turbine, but a much more practi-cal approach is illustrated in Fig. 2 for the case of two streams, aand b. The first step is to replace the non-uniform inlet flow withan equivalent uniform flow that would produce the same workoutput if expanded through a turbine. To obtain an appropriateaverage stagnation pressure, consider the thought experiment inwhich the higher pressure stream is expanded isentropically to apressure Pwa
t1 such that the work output from this process is justenough to compress the lower pressure stream to the same Pwa
t1 .This process generates no net work, and essentially describes theuseful concept of “work-averaging” developed in [10]. Work-averaged pressure is applicable not only for dealing with mul-tiple discrete streams but also with continuous non-uniformitiesin stagnation pressure and will be used extensively throughoutthis paper. The expression for work-averaged pressure, derived
1refer to NUMECA AutoGrid5 user manual
3 Copyright c© Siemens Energy, Inc. 2011. All rights reserved.
3 Copyright © 2011 by ASME and Siemens Energy, Inc.
Pt1a
Pt2Pt1b
Tt
Pt1
s2s1∆stherm ∆svisc
Tt1
s
wa
ma
ma
FIGURE 2. T-S DIAGRAM OF MULTI-STREAM EXPANSION.
in [10], is therefore reproduced here in Eqn. (1)
Pwat =
∫Ttdm∫
Tt/Pγ−1
γ
t dm
γ
γ−1
(1)
Returning to the simple example of two discrete streams, massflow averaging of stagnation temperature allows us to fix the stateof the substitute uniform flow, while enforcing energy conserva-tion. Expanding this hypothetical uniform flow, with inlet con-ditions Pwa
t1 and T mat1 , to any downstream pressure will yield the
same work output as if the two original streams were expandedindependently to that same downstream pressure. The “ideal”work output of these two streams is therefore readily given byEqn. (2).
wideal = cpT mat1
1−(
Pwat2
Pwat1
) γ−1γ
(2)
However, the qualifier “ideal” has been put in quotations be-cause mass flow averaging of stagnation temperature amountsto thermal mixing at constant pressure. This process is irre-versible and generates an amount of entropy ∆stherm, as indi-cated in Fig. 2. Theoretically, a heat engine, such as the onediscussed in [11], could have been used to bring the two streamsinto thermal equilibrium reversibly, generating additional workamounting to Tt2∆stherm (The reference temperature Tt2 ≈ Tt2 isdiscussed in Appendix A). In practice, this cannot be accom-plished with a simple turbine, and the thermal mixing loss is
unavoidable. Therefore, as far as a turbine component is con-cerned, wideal alone is the relevant ideal work. The irreversiblethermal mixing that generates ∆stherm is not a debit to turbine per-formance but rather a cycle loss that will be accounted for mostrigorously through cycle analysis, as shown in [12] [13].
In an expansion process through a non-ideal turbine entropywill also be generated due to viscous effects, ∆svisc, with atten-dant lost opportunity to do work given by Eqn. (3).
wvisc loss = Tt2∆svisc = Tt2 (∆s−∆stherm) = wideal−wactual
= cp
T mat2 −T ma
t1
(Pwa
t2Pwa
t1
) γ−1γ
(3)
It is only these viscous losses that are of interest to the turbinedesigner, and it is crucial that entropy generated by viscous ef-fects is isolated from total entropy generated. For steady flows,Eqn. (3) provides a convenient way of doing this with work-averaged stagnation pressure and mass-averaged stagnation tem-perature.
Estimates of Viscous Entropy GenerationFor the axisymmetric configuration in Fig. 1(a), the entropy
generation due to viscous effects can be estimated analyticallyusing the control volume mixed out approach outlined by Youngand Wilcock [9]. The only modification made to Young andWilcock’s analysis is the incorporation of circumferential veloc-ity, resulting in Eqn. (4). The quantities in this equation can beexpressed in terms of the non-dimensional purge flow parametersunder investigation, allowing for an expedient parametric studyof their effects on loss.
∆svisc =mb
ma
[(Vx,a−Vx,b
)2+(Vr,a−Vr,b
)2+(Vθ ,a−Vθ ,b
)2
2Ta
](4)
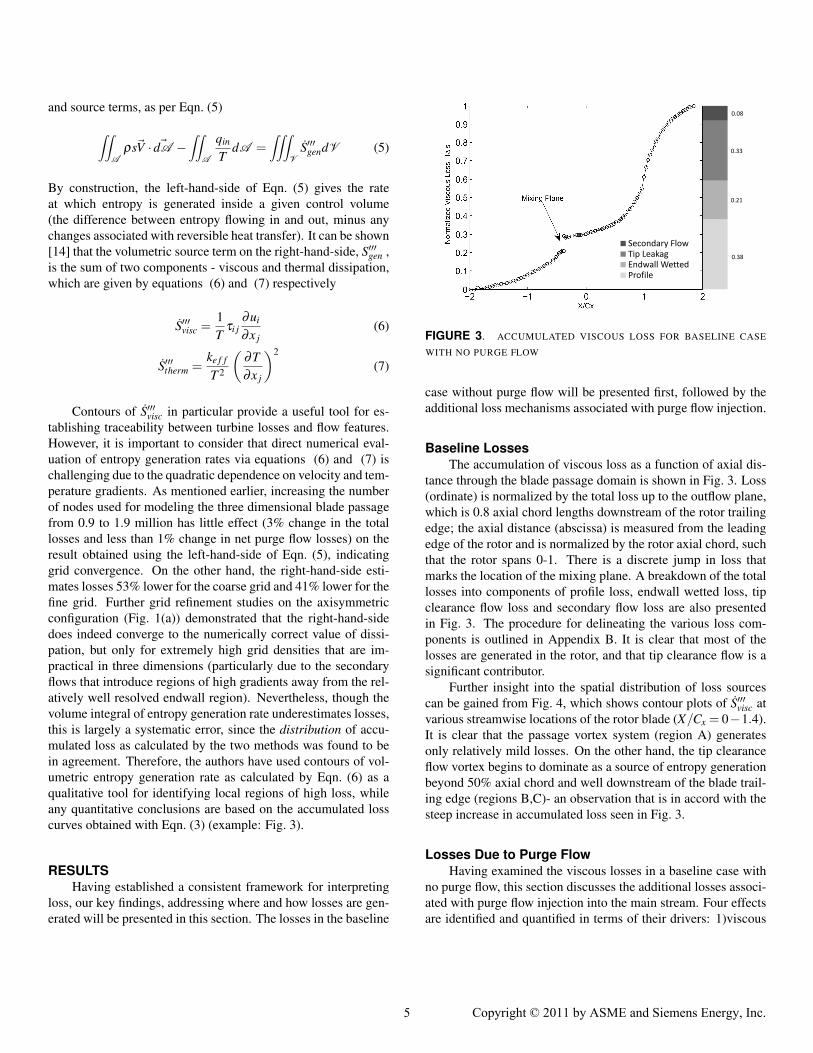
The accumulation of actual viscous losses up to any givenaxial location (as opposed to the fully mixed out loss) can beextracted from the CFD solution and plotted as a function of ax-ial distance, as in Fig. (3). This is done by applying Eqn. (3)between appropriately averaged inlet conditions (pressure beingwork-averaged and temperature mass-averaged) and similarlyaveraged outflow conditions at consecutive axial cuts through thecomputational domain. Plotting accumulated viscous losses as afunction of distance through the axisymmetric duct or three di-mensional blade passage provides quantitative insight into thedistribution of loss sources in the axial dimension.
Further insight into the spatial distribution of entropysources can be gained from the quantity “entropy generation rateper unit volume”. Consider the formulation of a steady state con-servation equation for entropy consisting of convection, diffusion
4 Copyright c© Siemens Energy, Inc. 2011. All rights reserved.
4 Copyright © 2011 by ASME and Siemens Energy, Inc.
and source terms, as per Eqn. (5)
∫∫A
ρs~V · ~dA −∫∫
A
qin
TdA =
∫∫∫V
S′′′gendV (5)
By construction, the left-hand-side of Eqn. (5) gives the rateat which entropy is generated inside a given control volume(the difference between entropy flowing in and out, minus anychanges associated with reversible heat transfer). It can be shown[14] that the volumetric source term on the right-hand-side, S′′′gen ,is the sum of two components - viscous and thermal dissipation,which are given by equations (6) and (7) respectively
S′′′visc =1T
τi j∂ui
∂x j(6)
S′′′therm =ke f f
T 2
(∂T∂x j
)2
(7)
Contours of S′′′visc in particular provide a useful tool for es-tablishing traceability between turbine losses and flow features.However, it is important to consider that direct numerical eval-uation of entropy generation rates via equations (6) and (7) ischallenging due to the quadratic dependence on velocity and tem-perature gradients. As mentioned earlier, increasing the numberof nodes used for modeling the three dimensional blade passagefrom 0.9 to 1.9 million has little effect (3% change in the totallosses and less than 1% change in net purge flow losses) on theresult obtained using the left-hand-side of Eqn. (5), indicatinggrid convergence. On the other hand, the right-hand-side esti-mates losses 53% lower for the coarse grid and 41% lower for thefine grid. Further grid refinement studies on the axisymmetricconfiguration (Fig. 1(a)) demonstrated that the right-hand-sidedoes indeed converge to the numerically correct value of dissi-pation, but only for extremely high grid densities that are im-practical in three dimensions (particularly due to the secondaryflows that introduce regions of high gradients away from the rel-atively well resolved endwall region). Nevertheless, though thevolume integral of entropy generation rate underestimates losses,this is largely a systematic error, since the distribution of accu-mulated loss as calculated by the two methods was found to bein agreement. Therefore, the authors have used contours of vol-umetric entropy generation rate as calculated by Eqn. (6) as aqualitative tool for identifying local regions of high loss, whileany quantitative conclusions are based on the accumulated losscurves obtained with Eqn. (3) (example: Fig. 3).
RESULTSHaving established a consistent framework for interpreting
loss, our key findings, addressing where and how losses are gen-erated will be presented in this section. The losses in the baseline
0.38
0.21
0.33
0.08
0.380.210.330.080.000.501.00
Secondary FlowTip Leakag Endwall Wetted Profile
FIGURE 3. ACCUMULATED VISCOUS LOSS FOR BASELINE CASE
WITH NO PURGE FLOW
case without purge flow will be presented first, followed by theadditional loss mechanisms associated with purge flow injection.
Baseline LossesThe accumulation of viscous loss as a function of axial dis-
tance through the blade passage domain is shown in Fig. 3. Loss(ordinate) is normalized by the total loss up to the outflow plane,which is 0.8 axial chord lengths downstream of the rotor trailingedge; the axial distance (abscissa) is measured from the leadingedge of the rotor and is normalized by the rotor axial chord, suchthat the rotor spans 0-1. There is a discrete jump in loss thatmarks the location of the mixing plane. A breakdown of the totallosses into components of profile loss, endwall wetted loss, tipclearance flow loss and secondary flow loss are also presentedin Fig. 3. The procedure for delineating the various loss com-ponents is outlined in Appendix B. It is clear that most of thelosses are generated in the rotor, and that tip clearance flow is asignificant contributor.
Further insight into the spatial distribution of loss sourcescan be gained from Fig. 4, which shows contour plots of S′′′visc atvarious streamwise locations of the rotor blade (X/Cx = 0−1.4).It is clear that the passage vortex system (region A) generatesonly relatively mild losses. On the other hand, the tip clearanceflow vortex begins to dominate as a source of entropy generationbeyond 50% axial chord and well downstream of the blade trail-ing edge (regions B,C)- an observation that is in accord with thesteep increase in accumulated loss seen in Fig. 3.
Losses Due to Purge FlowHaving examined the viscous losses in a baseline case with
no purge flow, this section discusses the additional losses associ-ated with purge flow injection into the main stream. Four effectsare identified and quantified in terms of their drivers: 1)viscous
5 Copyright c© Siemens Energy, Inc. 2011. All rights reserved.
5 Copyright © 2011 by ASME and Siemens Energy, Inc.

inRx
x
visc
cVST
⎟⎟⎠
⎞⎜⎜⎝
⎛
′′′Δ3
2
21
~
ρ
A
BC
FIGURE 4. ENTROPY GENERATION RATE PER UNIT VOLUME AT
AXIAL PLANES THROUGH ROTOR
shear layer, 2)purge flow-passage vortex interaction, 3)losses re-lated to change in reaction and 4)purge-tip clearance flow inter-action.
1. Viscous Shear Layer. When purge flow is injectedupstream of the rotor, it generally has a velocity deficit with re-spect to the mainstream flow, particularly in the Vθ component.This generates a shear layer at the interface between the purgeand main streams that generates entropy as the velocity gradi-ents are dissipated through viscous action. The phenomenon isobserved most clearly in the meridional plane, shown for the ax-isymmetric and three dimensional configurations in Fig. 5. Notethat this is the only viscous loss mechanisms for the axisymmet-ric configuration (Fig. 1(a)).
Since this shear layer is largely an axisymmetric effect, it isconvenient to study the sensitivity of this loss to design param-eters using the analytical control volume analysis that yieldedEqn. (4). The results of such an analysis are given in Fig. 6,showing the change in normalized loss (Tt2∆svisc normalize bythe baseline losses given in Fig. 3) associated with mixing outpurge and mainstream flows. Data points from the axisymmetricCFD model corroborate the predicted trend with respect to purgeswirl velocity. Loss estimates from CFD are somewhat lower dueto the fact that the flow is not fully mixed out at the exit of thecomputational domain.
Looking at Eqn. (4) it is easy to see why mass fraction hasan almost linear relationship with shear layer loss (linearity isperturbed due to the fact that for a given gap width, increas-ing purge mass flow will affect the purge flow velocity terms aswell). It is also evident from Fig. 6(a) that swirling purge flowto rim speed brings down losses drastically. However, within thedesign space spanning 30 < φ < 90 and 4% < g f < 10% thecontour plot of loss coefficient in Fig. 6(b) varies only by about11%. Note that beyond this design space (particularly for narrowpurge gaps, where the purge jet axial and radial kinetic energy
inRx
x
visc
c
V
ST
3
2
2
1
~
(b)
(a)
Ro
tor
r
x
FIGURE 5. VOLUMETRIC ENTROPY GENERATION RATE DUE TO
VISCOUS EFFECTS IN SHEAR LAYER (a)AXISYMMETRIC MODEL(b)THREE DIMENSIONAL ROTOR PASSAGE.
gap width / annulus height
axia
l inj
ectin
ang
le, d
eg
0.095
0.094
0.093
0.092
0.091
0.09
0.0890.088
0.087
0.0860.085
0.084
0.04 0.06 0.08 0.1
10
20
30
40
50
60
70
80
90∆ Normalized Loss
0 0.5 10
0.01
0.02
0.03
0.04
0.05
0.06
0.07
0.08
0.09
purge swirl / rim speed
∆ N
orm
aliz
ed L
oss
mf=1.5% (CFD)mf=1.5%mf=1.0%mf=0.5%
(b)(a)
FIGURE 6. PARAMETRIC STUDY OF SHEAR LAYER LOSS USING
ANALYTICAL MIXED OUT ANALYSIS. (a)EFFECT OF mf AND sf(b)EFFECT OF gf AND φ
become important), the effect of injection angle may become sig-nificant, however this would require gap widths much narrowerthan what is used in current practices. The takeaway message isthat mass fraction and swirl are the design parameters with thebiggest leverage on shear layer losses.
2. Purge Flow-Passage Vortex Interaction. Whenpurge flow is injected at the hub upstream of a rotor blade, the ad-ditional losses incurred usually exceed what would be expectedfrom mixing out of a shear layer. This can be seen in Fig. 7.Figure 7(a) first shows how the losses for the baseline case canbe subtracted from a case with purge flow to get the net purgeflow-induced loss presented in Fig. 7(b). Figure 7(b) then showshow the loss from the axisymmetric case can be further factoredout, leaving the effects of purge flow beyond those related to the
6 Copyright c© Siemens Energy, Inc. 2011. All rights reserved.
6 Copyright © 2011 by ASME and Siemens Energy, Inc.
−2 −1 0 1 20
0.2
0.4
0.6
0.8
1
X/Cx
Non
−D
im L
ost W
ork
∆svisc
no purge1.5% purge
−2 −1 0 1 2−0.02
0
0.02
0.04
0.06
0.08
0.1
X/Cx
∆spurge
=∆svisc
− ∆sno purge
Axi3D
−2 −1 0 1 2−0.02
0
0.02
0.04
0.06
0.08
0.1
X/Cx
∆spurge 3D
− ∆spurge Axi
Secondary Flow
(a)
−2 −1 0 1 20
0.2
0.4
0.6
0.8
1
X/Cx
Non
−D
im L
ost W
ork
∆svisc
no purge1.5% purge
−2 −1 0 1 2−0.02
0
0.02
0.04
0.06
0.08
0.1
X/Cx
∆spurge
=∆svisc
− ∆sno purge
Axi3D
−2 −1 0 1 2−0.02
0
0.02
0.04
0.06
0.08
0.1
X/Cx
∆spurge 3D
− ∆spurge Axi
Secondary Flow
(b)
−2 −1 0 1 20
0.2
0.4
0.6
0.8
1
X/Cx
Non
−D
im L
ost W
ork
∆svisc
no purge1.5% purge
−2 −1 0 1 2−0.02
0
0.02
0.04
0.06
0.08
0.1
X/Cx
∆spurge
=∆svisc
− ∆sno purge
Axi3D
−2 −1 0 1 2−0.02
0
0.02
0.04
0.06
0.08
0.1
X/Cx
∆spurge 3D
− ∆spurge Axi
sf=0%sf=100%
(c)
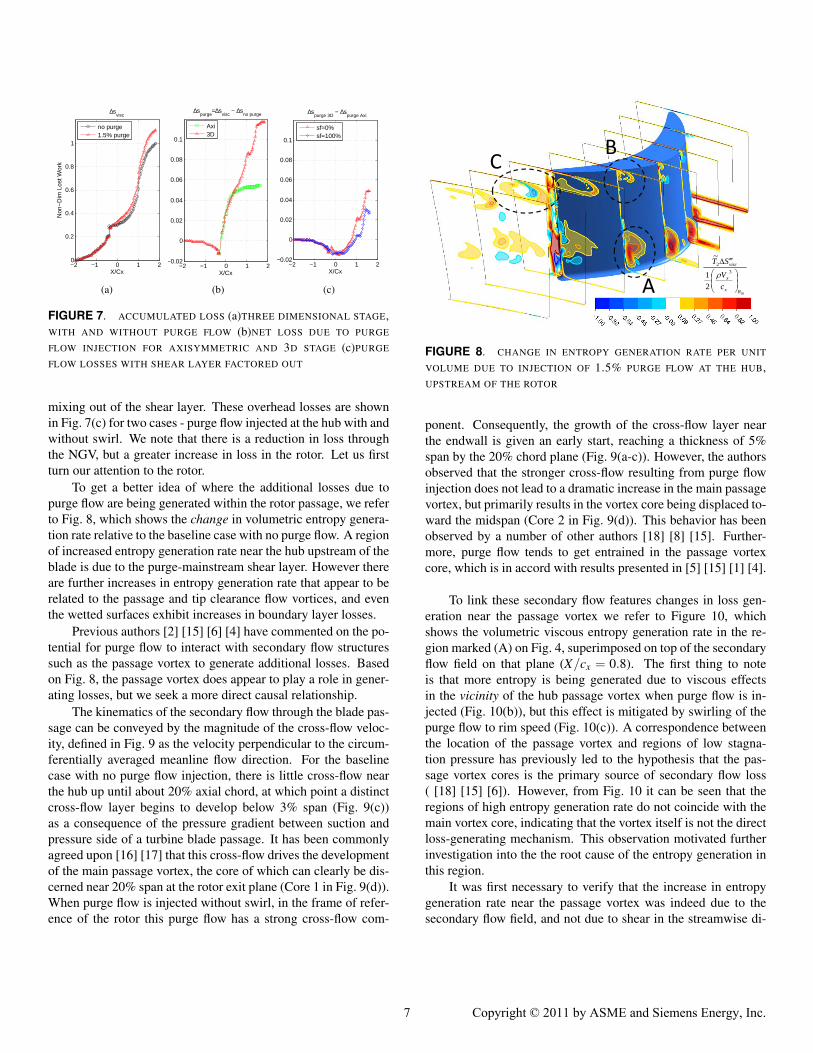
FIGURE 7. ACCUMULATED LOSS (a)THREE DIMENSIONAL STAGE,WITH AND WITHOUT PURGE FLOW (b)NET LOSS DUE TO PURGE
FLOW INJECTION FOR AXISYMMETRIC AND 3D STAGE (c)PURGE
FLOW LOSSES WITH SHEAR LAYER FACTORED OUT
mixing out of the shear layer. These overhead losses are shownin Fig. 7(c) for two cases - purge flow injected at the hub with andwithout swirl. We note that there is a reduction in loss throughthe NGV, but a greater increase in loss in the rotor. Let us firstturn our attention to the rotor.
To get a better idea of where the additional losses due topurge flow are being generated within the rotor passage, we referto Fig. 8, which shows the change in volumetric entropy genera-tion rate relative to the baseline case with no purge flow. A regionof increased entropy generation rate near the hub upstream of theblade is due to the purge-mainstream shear layer. However thereare further increases in entropy generation rate that appear to berelated to the passage and tip clearance flow vortices, and eventhe wetted surfaces exhibit increases in boundary layer losses.
Previous authors [2] [15] [6] [4] have commented on the po-tential for purge flow to interact with secondary flow structuressuch as the passage vortex to generate additional losses. Basedon Fig. 8, the passage vortex does appear to play a role in gener-ating losses, but we seek a more direct causal relationship.
The kinematics of the secondary flow through the blade pas-sage can be conveyed by the magnitude of the cross-flow veloc-ity, defined in Fig. 9 as the velocity perpendicular to the circum-ferentially averaged meanline flow direction. For the baselinecase with no purge flow injection, there is little cross-flow nearthe hub up until about 20% axial chord, at which point a distinctcross-flow layer begins to develop below 3% span (Fig. 9(c))as a consequence of the pressure gradient between suction andpressure side of a turbine blade passage. It has been commonlyagreed upon [16] [17] that this cross-flow drives the developmentof the main passage vortex, the core of which can clearly be dis-cerned near 20% span at the rotor exit plane (Core 1 in Fig. 9(d)).When purge flow is injected without swirl, in the frame of refer-ence of the rotor this purge flow has a strong cross-flow com-
inRx
x
visc
cVST
⎟⎟⎠
⎞⎜⎜⎝
⎛
′′′Δ3
2
21
~
ρ
A
BC
FIGURE 8. CHANGE IN ENTROPY GENERATION RATE PER UNIT
VOLUME DUE TO INJECTION OF 1.5% PURGE FLOW AT THE HUB,UPSTREAM OF THE ROTOR
ponent. Consequently, the growth of the cross-flow layer nearthe endwall is given an early start, reaching a thickness of 5%span by the 20% chord plane (Fig. 9(a-c)). However, the authorsobserved that the stronger cross-flow resulting from purge flowinjection does not lead to a dramatic increase in the main passagevortex, but primarily results in the vortex core being displaced to-ward the midspan (Core 2 in Fig. 9(d)). This behavior has beenobserved by a number of other authors [18] [8] [15]. Further-more, purge flow tends to get entrained in the passage vortexcore, which is in accord with results presented in [5] [15] [1] [4].
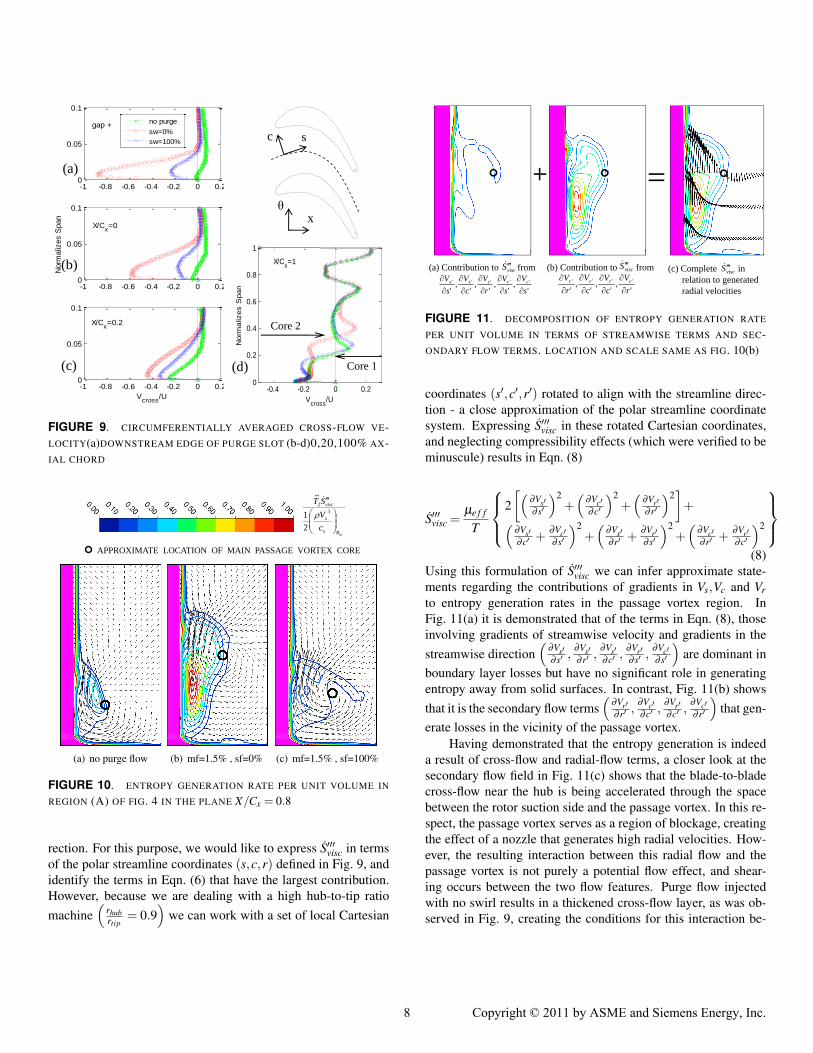
To link these secondary flow features changes in loss gen-eration near the passage vortex we refer to Figure 10, whichshows the volumetric viscous entropy generation rate in the re-gion marked (A) on Fig. 4, superimposed on top of the secondaryflow field on that plane (X/cx = 0.8). The first thing to noteis that more entropy is being generated due to viscous effectsin the vicinity of the hub passage vortex when purge flow is in-jected (Fig. 10(b)), but this effect is mitigated by swirling of thepurge flow to rim speed (Fig. 10(c)). A correspondence betweenthe location of the passage vortex and regions of low stagna-tion pressure has previously led to the hypothesis that the pas-sage vortex cores is the primary source of secondary flow loss( [18] [15] [6]). However, from Fig. 10 it can be seen that theregions of high entropy generation rate do not coincide with themain vortex core, indicating that the vortex itself is not the directloss-generating mechanism. This observation motivated furtherinvestigation into the the root cause of the entropy generation inthis region.
It was first necessary to verify that the increase in entropygeneration rate near the passage vortex was indeed due to thesecondary flow field, and not due to shear in the streamwise di-
7 Copyright c© Siemens Energy, Inc. 2011. All rights reserved.
7 Copyright © 2011 by ASME and Siemens Energy, Inc.
-1 -0.8 -0.6 -0.4 -0.2 0 0.20
0.05
0.1
X/Cx=0.2
Vcross
/U
-1 -0.8 -0.6 -0.4 -0.2 0 0.20
0.05
0.1
X/Cx=0
Norm
aliz
es S
pan
-1 -0.8 -0.6 -0.4 -0.2 0 0.20
0.05
0.1
gap +
-0.5 -0.4 -0.3 -0.2 -0.1 0 0.1 0.2 0.30
0.1
0.2
0.3
0.4
0.5
0.6
0.7
0.8
0.9
1
X/Cx=1
Norm
aliz
es S
pan
Vcross
/U
no purge
sw=0%
sw=100%c s
x θ
-0.4 -0.2 0 0.20
0.2
0.4
0.6
0.8
1
X/Cx=1
Norm
alizes S
pan
Vcross
/U
(a)
(b)
(c) (d) Core 1
Core 2
FIGURE 9. CIRCUMFERENTIALLY AVERAGED CROSS-FLOW VE-LOCITY(a)DOWNSTREAM EDGE OF PURGE SLOT (b-d)0,20,100% AX-IAL CHORD
inRx
x
visc
c
V
ST
3
2
2
1
~
APPROXIMATE LOCATION OF MAIN PASSAGE VORTEX CORE
(a) no purge flow (b) mf=1.5% , sf=0% (c) mf=1.5% , sf=100%
FIGURE 10. ENTROPY GENERATION RATE PER UNIT VOLUME IN
REGION (A) OF FIG. 4 IN THE PLANE X/Cx = 0.8
rection. For this purpose, we would like to express S′′′visc in termsof the polar streamline coordinates (s,c,r) defined in Fig. 9, andidentify the terms in Eqn. (6) that have the largest contribution.However, because we are dealing with a high hub-to-tip ratiomachine
(rhubrtip
= 0.9)
we can work with a set of local Cartesian
(a) Contribution to from
',
',
',
',
''''''
sV
sV
rV
cV
sV crsss
∂∂
∂∂
∂∂
∂∂
∂∂
viscS ′′′& (b) Contribution to from
',
',
',
'''''
rV
cV
cV
rV crcr
∂∂
∂∂
∂∂
∂∂
(c) Complete in relation to generated radial velocities
viscS ′′′&viscS ′′′&
FIGURE 11. DECOMPOSITION OF ENTROPY GENERATION RATE
PER UNIT VOLUME IN TERMS OF STREAMWISE TERMS AND SEC-ONDARY FLOW TERMS. LOCATION AND SCALE SAME AS FIG. 10(b)
coordinates (s′,c′,r′) rotated to align with the streamline direc-tion - a close approximation of the polar streamline coordinatesystem. Expressing S′′′visc in these rotated Cartesian coordinates,and neglecting compressibility effects (which were verified to beminuscule) results in Eqn. (8)
S′′′visc =µe f f
T
2[(
∂Vs′∂ s′
)2+(
∂Vc′∂c′
)2+(
∂Vr′∂ r′
)2]+(
∂Vs′∂c′ +
∂Vc′∂ s′
)2+(
∂Vs′∂ r′ +
∂Vr′∂ s′
)2+(
∂Vc′∂ r′ +
∂Vr′∂c′
)2
(8)
Using this formulation of S′′′visc we can infer approximate state-ments regarding the contributions of gradients in Vs,Vc and Vrto entropy generation rates in the passage vortex region. InFig. 11(a) it is demonstrated that of the terms in Eqn. (8), thoseinvolving gradients of streamwise velocity and gradients in thestreamwise direction
(∂Vs′∂ s′ ,
∂Vs′∂ r′ ,
∂Vs′∂c′ ,
∂Vr′∂ s′ ,
∂Vc′∂ s′
)are dominant in
boundary layer losses but have no significant role in generatingentropy away from solid surfaces. In contrast, Fig. 11(b) showsthat it is the secondary flow terms
(∂Vr′∂ r′ ,
∂Vc′∂c′ ,
∂Vr′∂c′ ,
∂Vc′∂ r′
)that gen-
erate losses in the vicinity of the passage vortex.Having demonstrated that the entropy generation is indeed
a result of cross-flow and radial-flow terms, a closer look at thesecondary flow field in Fig. 11(c) shows that the blade-to-bladecross-flow near the hub is being accelerated through the spacebetween the rotor suction side and the passage vortex. In this re-spect, the passage vortex serves as a region of blockage, creatingthe effect of a nozzle that generates high radial velocities. How-ever, the resulting interaction between this radial flow and thepassage vortex is not purely a potential flow effect, and shear-ing occurs between the two flow features. Purge flow injectedwith no swirl results in a thickened cross-flow layer, as was ob-served in Fig. 9, creating the conditions for this interaction be-
8 Copyright c© Siemens Energy, Inc. 2011. All rights reserved.
8 Copyright © 2011 by ASME and Siemens Energy, Inc.
‐2
‐1.5
‐1
‐0.5
0
0.5
1
1.5
% change
NGV Rotor
m&
PP
orPP reltt ,
(a) change in m and PtP
PPt
m& m&
PPrelt,
NGV Rotor
(b) change in operating point
FIGURE 12. CHANGE IN OPERATING POINT FOR NGV AND ROTOR,MF=1.5% SF=0%
tween cross-flow and passage vortex. Both the baseline case andthe case with swirled purge flow are subject to the same loss-generating process, but having substantially weaker cross-flowsthe effect is much diminished.
3. Losses Related to Change in Reaction. As notedin the discussion of Fig. 8, aside from the increased losses inthe vicinity of the passage vortex, there are also increases in theentropy generation rate near the blade tip and over most of thewetted surfaces of the rotor passage. The reduction in lossesthrough the NGV, shown in Fig. 7(c) must also be addressed.
The reduction in loss through the NGV has been observedpreviously in [3], where it was attributed to an increased de-gree of reaction - a consequence of the blockage introduced withpurge flow injection. However, it is important to realize that thischange in reaction, while reducing the losses through the NGV,also accounts for some of the increased losses through the rotor.Changes in reaction due to cooling and purge flows are taken intoaccount in the design process2, but it is important to be aware ofthis effect so that one does not mistakenly attribute all of theadditional rotor losses in Fig. 7(c) to purge flow-passage vortexinteraction.
For the present configuration, injecting 1.5% purge flow in-creases the degree of reaction from 0.41 to 0.44. Another wayof looking at it is that the operating point of both NGV and ro-tor is shifted as illustrated in Fig. 12, with less acceleration (de-creased Pt
P ) through the NGV but more (increased Pt,relP ) through
the rotor. The higher pressure drop across the rotor implies ahigher pressure difference between the suction and pressure sideof the blade, thus leading to more tip clearance flow. In addition,the changes in pressure ratio indicate likewise changes in freestream Mach number, which in turn explains the decreased NGVlosses and the higher wetted losses through the rotor. All of thesechanges are consistent with the observations in Fig. 8.
2Source:David Little, Siemens Energy Inc.
inRx
x
visc
cVST
⎟⎟⎠
⎞⎜⎜⎝
⎛′′′3
2
21
~
ρ
&
(Bi) (Bii)
(Ci) (Cii)
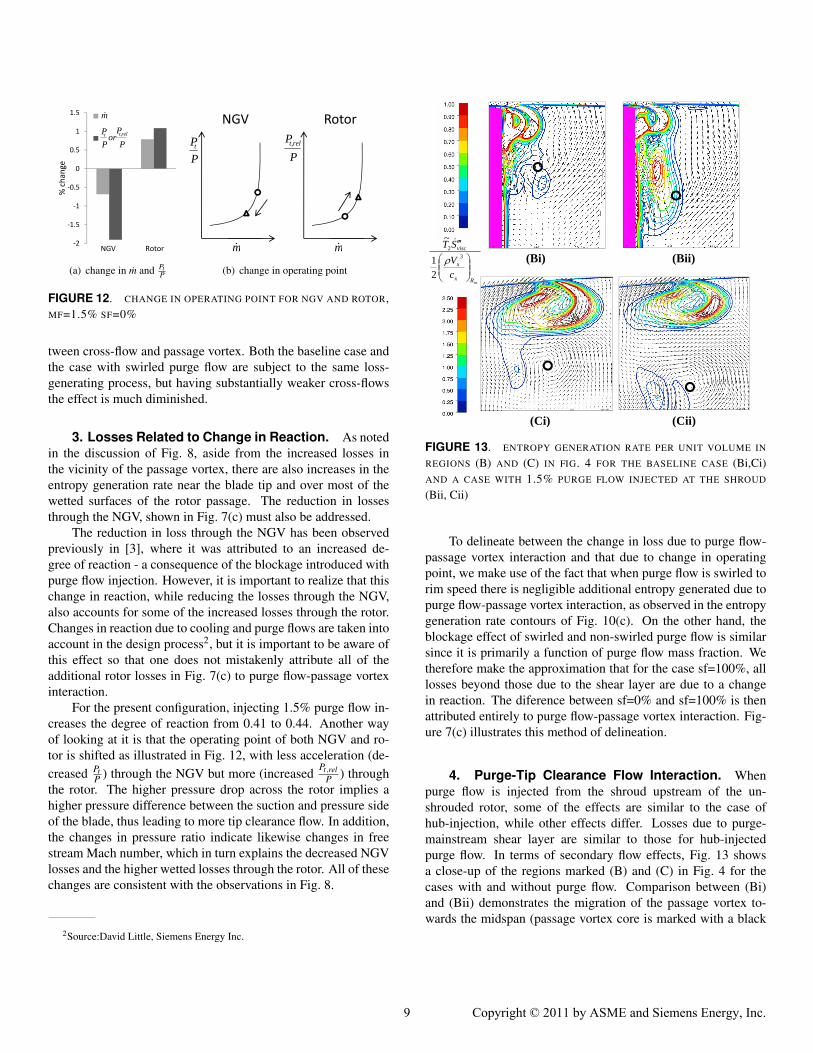
FIGURE 13. ENTROPY GENERATION RATE PER UNIT VOLUME IN
REGIONS (B) AND (C) IN FIG. 4 FOR THE BASELINE CASE (Bi,Ci)AND A CASE WITH 1.5% PURGE FLOW INJECTED AT THE SHROUD
(Bii, Cii)
To delineate between the change in loss due to purge flow-passage vortex interaction and that due to change in operatingpoint, we make use of the fact that when purge flow is swirled torim speed there is negligible additional entropy generated due topurge flow-passage vortex interaction, as observed in the entropygeneration rate contours of Fig. 10(c). On the other hand, theblockage effect of swirled and non-swirled purge flow is similarsince it is primarily a function of purge flow mass fraction. Wetherefore make the approximation that for the case sf=100%, alllosses beyond those due to the shear layer are due to a changein reaction. The diference between sf=0% and sf=100% is thenattributed entirely to purge flow-passage vortex interaction. Fig-ure 7(c) illustrates this method of delineation.
4. Purge-Tip Clearance Flow Interaction. Whenpurge flow is injected from the shroud upstream of the un-shrouded rotor, some of the effects are similar to the case ofhub-injection, while other effects differ. Losses due to purge-mainstream shear layer are similar to those for hub-injectedpurge flow. In terms of secondary flow effects, Fig. 13 showsa close-up of the regions marked (B) and (C) in Fig. 4 for thecases with and without purge flow. Comparison between (Bi)and (Bii) demonstrates the migration of the passage vortex to-wards the midspan (passage vortex core is marked with a black
9 Copyright c© Siemens Energy, Inc. 2011. All rights reserved.
9 Copyright © 2011 by ASME and Siemens Energy, Inc.
(a)
(b)
( )2,21
TErel
TE
V
PP
ρ
−
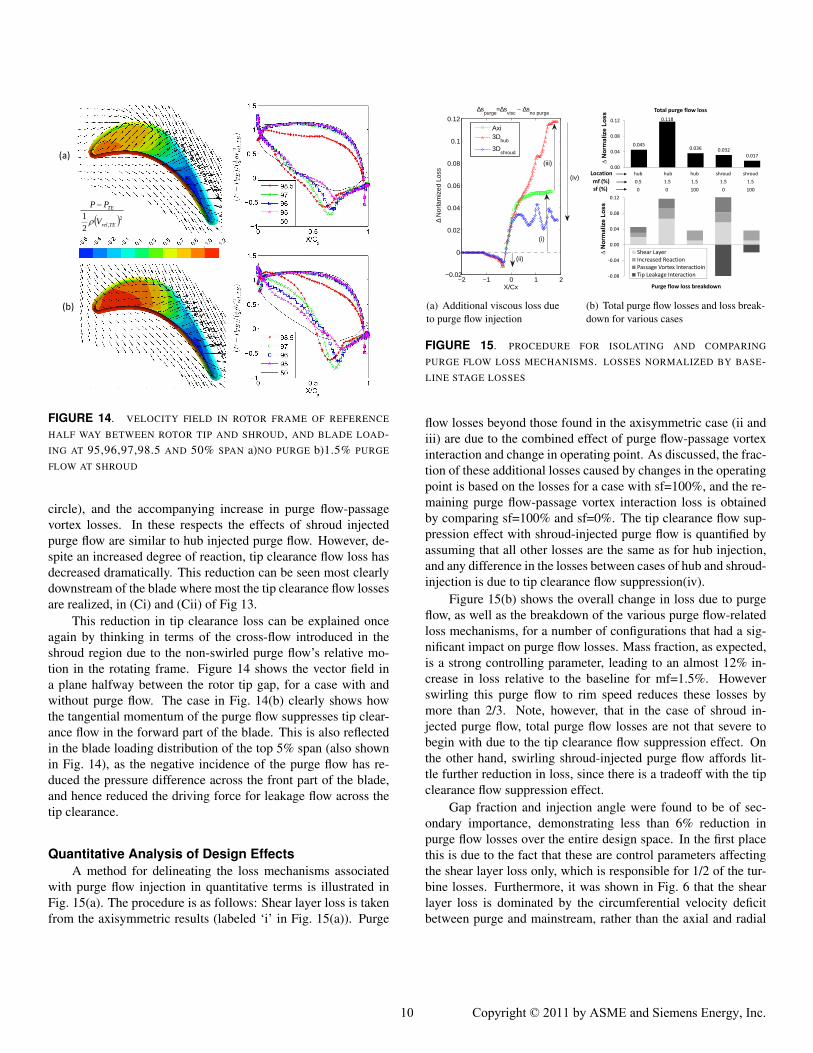
FIGURE 14. VELOCITY FIELD IN ROTOR FRAME OF REFERENCE
HALF WAY BETWEEN ROTOR TIP AND SHROUD, AND BLADE LOAD-ING AT 95,96,97,98.5 AND 50% SPAN a)NO PURGE b)1.5% PURGE
FLOW AT SHROUD
circle), and the accompanying increase in purge flow-passagevortex losses. In these respects the effects of shroud injectedpurge flow are similar to hub injected purge flow. However, de-spite an increased degree of reaction, tip clearance flow loss hasdecreased dramatically. This reduction can be seen most clearlydownstream of the blade where most the tip clearance flow lossesare realized, in (Ci) and (Cii) of Fig 13.
This reduction in tip clearance loss can be explained onceagain by thinking in terms of the cross-flow introduced in theshroud region due to the non-swirled purge flow’s relative mo-tion in the rotating frame. Figure 14 shows the vector field ina plane halfway between the rotor tip gap, for a case with andwithout purge flow. The case in Fig. 14(b) clearly shows howthe tangential momentum of the purge flow suppresses tip clear-ance flow in the forward part of the blade. This is also reflectedin the blade loading distribution of the top 5% span (also shownin Fig. 14), as the negative incidence of the purge flow has re-duced the pressure difference across the front part of the blade,and hence reduced the driving force for leakage flow across thetip clearance.
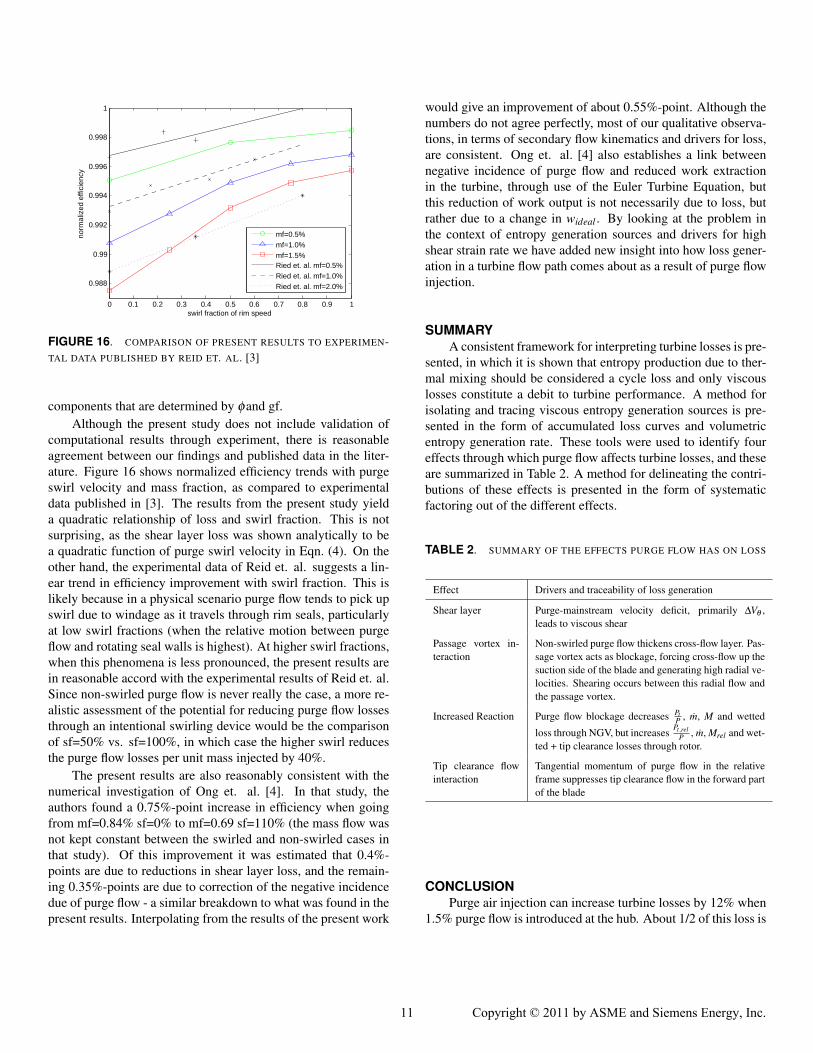
Quantitative Analysis of Design EffectsA method for delineating the loss mechanisms associated
with purge flow injection in quantitative terms is illustrated inFig. 15(a). The procedure is as follows: Shear layer loss is takenfrom the axisymmetric results (labeled ‘i’ in Fig. 15(a)). Purge
−2 −1 0 1 2−0.02
0
0.02
0.04
0.06
0.08
0.1
0.12
X/Cx
∆ N
orla
miz
ed L
oss
∆spurge
=∆svisc
− ∆sno purge
Axi3D
hub
3Dshroud
(iv)
(iii)
(ii)
(i)
(a) Additional viscous loss dueto purge flow injection
‐0.08
‐0.04
0.00
0.04
0.08
0.12
Shear LayerIncreased ReactionPassage Vortex Interactioin Tip Leakage Interaction
0.045
0.118
0.036 0.0320.017
0.00
0.04
0.08
0.12
hub hub hub shroud shroud
0.5 1.5 1.5 1.5 1.5
0 0 100 0 100
Total purge flow loss
Purge flow loss breakdown
∆ N
orm
aliz
e Lo
ss∆
Nor
mal
ize
Loss
mf (%)sf (%)
Location
(b) Total purge flow losses and loss break-down for various cases
FIGURE 15. PROCEDURE FOR ISOLATING AND COMPARING
PURGE FLOW LOSS MECHANISMS. LOSSES NORMALIZED BY BASE-LINE STAGE LOSSES
flow losses beyond those found in the axisymmetric case (ii andiii) are due to the combined effect of purge flow-passage vortexinteraction and change in operating point. As discussed, the frac-tion of these additional losses caused by changes in the operatingpoint is based on the losses for a case with sf=100%, and the re-maining purge flow-passage vortex interaction loss is obtainedby comparing sf=100% and sf=0%. The tip clearance flow sup-pression effect with shroud-injected purge flow is quantified byassuming that all other losses are the same as for hub injection,and any difference in the losses between cases of hub and shroud-injection is due to tip clearance flow suppression(iv).
Figure 15(b) shows the overall change in loss due to purgeflow, as well as the breakdown of the various purge flow-relatedloss mechanisms, for a number of configurations that had a sig-nificant impact on purge flow losses. Mass fraction, as expected,is a strong controlling parameter, leading to an almost 12% in-crease in loss relative to the baseline for mf=1.5%. Howeverswirling this purge flow to rim speed reduces these losses bymore than 2/3. Note, however, that in the case of shroud in-jected purge flow, total purge flow losses are not that severe tobegin with due to the tip clearance flow suppression effect. Onthe other hand, swirling shroud-injected purge flow affords lit-tle further reduction in loss, since there is a tradeoff with the tipclearance flow suppression effect.
Gap fraction and injection angle were found to be of sec-ondary importance, demonstrating less than 6% reduction inpurge flow losses over the entire design space. In the first placethis is due to the fact that these are control parameters affectingthe shear layer loss only, which is responsible for 1/2 of the tur-bine losses. Furthermore, it was shown in Fig. 6 that the shearlayer loss is dominated by the circumferential velocity deficitbetween purge and mainstream, rather than the axial and radial
10 Copyright c© Siemens Energy, Inc. 2011. All rights reserved.
10 Copyright © 2011 by ASME and Siemens Energy, Inc.
0 0.1 0.2 0.3 0.4 0.5 0.6 0.7 0.8 0.9 1
0.988
0.99
0.992
0.994
0.996
0.998
1
swirl fraction of rim speed
norm
aliz
ed e
ffici
ency
mf=0.5%mf=1.0%mf=1.5%Ried et. al. mf=0.5%Ried et. al. mf=1.0%Ried et. al. mf=2.0%
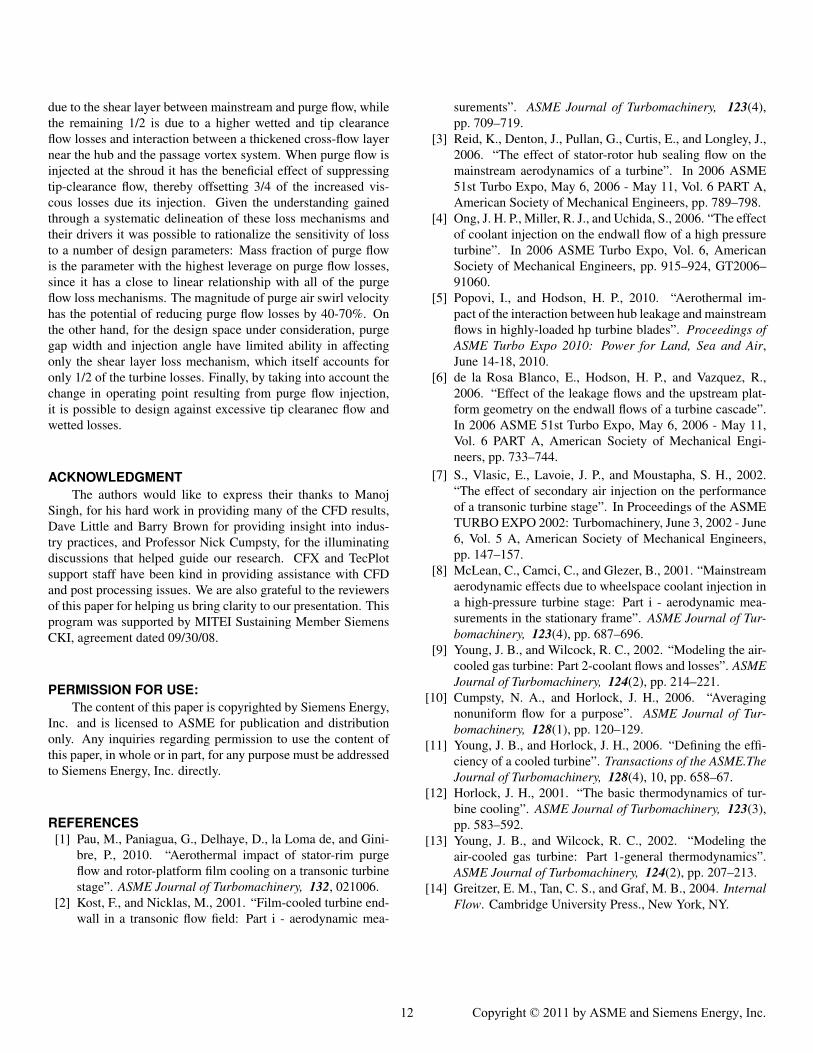
FIGURE 16. COMPARISON OF PRESENT RESULTS TO EXPERIMEN-TAL DATA PUBLISHED BY REID ET. AL. [3]
components that are determined by φand gf.Although the present study does not include validation of
computational results through experiment, there is reasonableagreement between our findings and published data in the liter-ature. Figure 16 shows normalized efficiency trends with purgeswirl velocity and mass fraction, as compared to experimentaldata published in [3]. The results from the present study yielda quadratic relationship of loss and swirl fraction. This is notsurprising, as the shear layer loss was shown analytically to bea quadratic function of purge swirl velocity in Eqn. (4). On theother hand, the experimental data of Reid et. al. suggests a lin-ear trend in efficiency improvement with swirl fraction. This islikely because in a physical scenario purge flow tends to pick upswirl due to windage as it travels through rim seals, particularlyat low swirl fractions (when the relative motion between purgeflow and rotating seal walls is highest). At higher swirl fractions,when this phenomena is less pronounced, the present results arein reasonable accord with the experimental results of Reid et. al.Since non-swirled purge flow is never really the case, a more re-alistic assessment of the potential for reducing purge flow lossesthrough an intentional swirling device would be the comparisonof sf=50% vs. sf=100%, in which case the higher swirl reducesthe purge flow losses per unit mass injected by 40%.
The present results are also reasonably consistent with thenumerical investigation of Ong et. al. [4]. In that study, theauthors found a 0.75%-point increase in efficiency when goingfrom mf=0.84% sf=0% to mf=0.69 sf=110% (the mass flow wasnot kept constant between the swirled and non-swirled cases inthat study). Of this improvement it was estimated that 0.4%-points are due to reductions in shear layer loss, and the remain-ing 0.35%-points are due to correction of the negative incidencedue of purge flow - a similar breakdown to what was found in thepresent results. Interpolating from the results of the present work
would give an improvement of about 0.55%-point. Although thenumbers do not agree perfectly, most of our qualitative observa-tions, in terms of secondary flow kinematics and drivers for loss,are consistent. Ong et. al. [4] also establishes a link betweennegative incidence of purge flow and reduced work extractionin the turbine, through use of the Euler Turbine Equation, butthis reduction of work output is not necessarily due to loss, butrather due to a change in wideal . By looking at the problem inthe context of entropy generation sources and drivers for highshear strain rate we have added new insight into how loss gener-ation in a turbine flow path comes about as a result of purge flowinjection.
SUMMARYA consistent framework for interpreting turbine losses is pre-
sented, in which it is shown that entropy production due to ther-mal mixing should be considered a cycle loss and only viscouslosses constitute a debit to turbine performance. A method forisolating and tracing viscous entropy generation sources is pre-sented in the form of accumulated loss curves and volumetricentropy generation rate. These tools were used to identify foureffects through which purge flow affects turbine losses, and theseare summarized in Table 2. A method for delineating the contri-butions of these effects is presented in the form of systematicfactoring out of the different effects.
TABLE 2. SUMMARY OF THE EFFECTS PURGE FLOW HAS ON LOSS
Effect Drivers and traceability of loss generation
Shear layer Purge-mainstream velocity deficit, primarily ∆Vθ ,leads to viscous shear
Passage vortex in-teraction
Non-swirled purge flow thickens cross-flow layer. Pas-sage vortex acts as blockage, forcing cross-flow up thesuction side of the blade and generating high radial ve-locities. Shearing occurs between this radial flow andthe passage vortex.
Increased Reaction Purge flow blockage decreases PtP , m, M and wetted
loss through NGV, but increasesPt,rel
P , m, Mrel and wet-ted + tip clearance losses through rotor.
Tip clearance flowinteraction
Tangential momentum of purge flow in the relativeframe suppresses tip clearance flow in the forward partof the blade
CONCLUSIONPurge air injection can increase turbine losses by 12% when
1.5% purge flow is introduced at the hub. About 1/2 of this loss is
11 Copyright c© Siemens Energy, Inc. 2011. All rights reserved.
11 Copyright © 2011 by ASME and Siemens Energy, Inc.
due to the shear layer between mainstream and purge flow, whilethe remaining 1/2 is due to a higher wetted and tip clearanceflow losses and interaction between a thickened cross-flow layernear the hub and the passage vortex system. When purge flow isinjected at the shroud it has the beneficial effect of suppressingtip-clearance flow, thereby offsetting 3/4 of the increased vis-cous losses due its injection. Given the understanding gainedthrough a systematic delineation of these loss mechanisms andtheir drivers it was possible to rationalize the sensitivity of lossto a number of design parameters: Mass fraction of purge flowis the parameter with the highest leverage on purge flow losses,since it has a close to linear relationship with all of the purgeflow loss mechanisms. The magnitude of purge air swirl velocityhas the potential of reducing purge flow losses by 40-70%. Onthe other hand, for the design space under consideration, purgegap width and injection angle have limited ability in affectingonly the shear layer loss mechanism, which itself accounts foronly 1/2 of the turbine losses. Finally, by taking into account thechange in operating point resulting from purge flow injection,it is possible to design against excessive tip clearanec flow andwetted losses.
ACKNOWLEDGMENTThe authors would like to express their thanks to Manoj
Singh, for his hard work in providing many of the CFD results,Dave Little and Barry Brown for providing insight into indus-try practices, and Professor Nick Cumpsty, for the illuminatingdiscussions that helped guide our research. CFX and TecPlotsupport staff have been kind in providing assistance with CFDand post processing issues. We are also grateful to the reviewersof this paper for helping us bring clarity to our presentation. Thisprogram was supported by MITEI Sustaining Member SiemensCKI, agreement dated 09/30/08.
PERMISSION FOR USE:The content of this paper is copyrighted by Siemens Energy,
Inc. and is licensed to ASME for publication and distributiononly. Any inquiries regarding permission to use the content ofthis paper, in whole or in part, for any purpose must be addressedto Siemens Energy, Inc. directly.
REFERENCES[1] Pau, M., Paniagua, G., Delhaye, D., la Loma de, and Gini-
bre, P., 2010. “Aerothermal impact of stator-rim purgeflow and rotor-platform film cooling on a transonic turbinestage”. ASME Journal of Turbomachinery, 132, 021006.
[2] Kost, F., and Nicklas, M., 2001. “Film-cooled turbine end-wall in a transonic flow field: Part i - aerodynamic mea-
surements”. ASME Journal of Turbomachinery, 123(4),pp. 709–719.
[3] Reid, K., Denton, J., Pullan, G., Curtis, E., and Longley, J.,2006. “The effect of stator-rotor hub sealing flow on themainstream aerodynamics of a turbine”. In 2006 ASME51st Turbo Expo, May 6, 2006 - May 11, Vol. 6 PART A,American Society of Mechanical Engineers, pp. 789–798.
[4] Ong, J. H. P., Miller, R. J., and Uchida, S., 2006. “The effectof coolant injection on the endwall flow of a high pressureturbine”. In 2006 ASME Turbo Expo, Vol. 6, AmericanSociety of Mechanical Engineers, pp. 915–924, GT2006–91060.
[5] Popovi, I., and Hodson, H. P., 2010. “Aerothermal im-pact of the interaction between hub leakage and mainstreamflows in highly-loaded hp turbine blades”. Proceedings ofASME Turbo Expo 2010: Power for Land, Sea and Air,June 14-18, 2010.
[6] de la Rosa Blanco, E., Hodson, H. P., and Vazquez, R.,2006. “Effect of the leakage flows and the upstream plat-form geometry on the endwall flows of a turbine cascade”.In 2006 ASME 51st Turbo Expo, May 6, 2006 - May 11,Vol. 6 PART A, American Society of Mechanical Engi-neers, pp. 733–744.
[7] S., Vlasic, E., Lavoie, J. P., and Moustapha, S. H., 2002.“The effect of secondary air injection on the performanceof a transonic turbine stage”. In Proceedings of the ASMETURBO EXPO 2002: Turbomachinery, June 3, 2002 - June6, Vol. 5 A, American Society of Mechanical Engineers,pp. 147–157.
[8] McLean, C., Camci, C., and Glezer, B., 2001. “Mainstreamaerodynamic effects due to wheelspace coolant injection ina high-pressure turbine stage: Part i - aerodynamic mea-surements in the stationary frame”. ASME Journal of Tur-bomachinery, 123(4), pp. 687–696.
[9] Young, J. B., and Wilcock, R. C., 2002. “Modeling the air-cooled gas turbine: Part 2-coolant flows and losses”. ASMEJournal of Turbomachinery, 124(2), pp. 214–221.
[10] Cumpsty, N. A., and Horlock, J. H., 2006. “Averagingnonuniform flow for a purpose”. ASME Journal of Tur-bomachinery, 128(1), pp. 120–129.
[11] Young, J. B., and Horlock, J. H., 2006. “Defining the effi-ciency of a cooled turbine”. Transactions of the ASME.TheJournal of Turbomachinery, 128(4), 10, pp. 658–67.
[12] Horlock, J. H., 2001. “The basic thermodynamics of tur-bine cooling”. ASME Journal of Turbomachinery, 123(3),pp. 583–592.
[13] Young, J. B., and Wilcock, R. C., 2002. “Modeling theair-cooled gas turbine: Part 1-general thermodynamics”.ASME Journal of Turbomachinery, 124(2), pp. 207–213.
[14] Greitzer, E. M., Tan, C. S., and Graf, M. B., 2004. InternalFlow. Cambridge University Press., New York, NY.
12 Copyright c© Siemens Energy, Inc. 2011. All rights reserved.
12 Copyright © 2011 by ASME and Siemens Energy, Inc.
[15] Paniagua, G., Denos, R., and Almeida, S., 2004. “Effect ofthe hub endwall cavity flow on the flow-field of a transonichigh-pressure turbine”. ASME Journal of Turbomachinery,126(4), pp. 578–586.
[16] Sharma, O. P., and Butler, T. L., 1987. “Predictions ofendwall losses and secondary flows in axial flow turbinecascades”. ASME Journal of Turbomachinery, 109(2),pp. 229–236.
[17] Wang, H.-P., Olson, S. J., Goldstein, R. J., and Eckert, E.R. G., 1995. “Flow visualization in a linear turbine cas-cade of high performance turbine blades”. In Proceedingsof the International Gas Turbine and Aeroengine Congressand Exposition, June 5, 1995 - June 8, ASME, pp. 11–11pp.
[18] Schuler, P., Kurz, W., Dullenkopf, K., and Bauer, H. J.,2010. “The influence of different rim seal geometries onhot-gas ingestion and total pressure loss in a low-pressureturbine”. Proceedings of ASME Turbo Expo 2010: Powerfor Land, Sea and Air, June 14-18, 2010,.
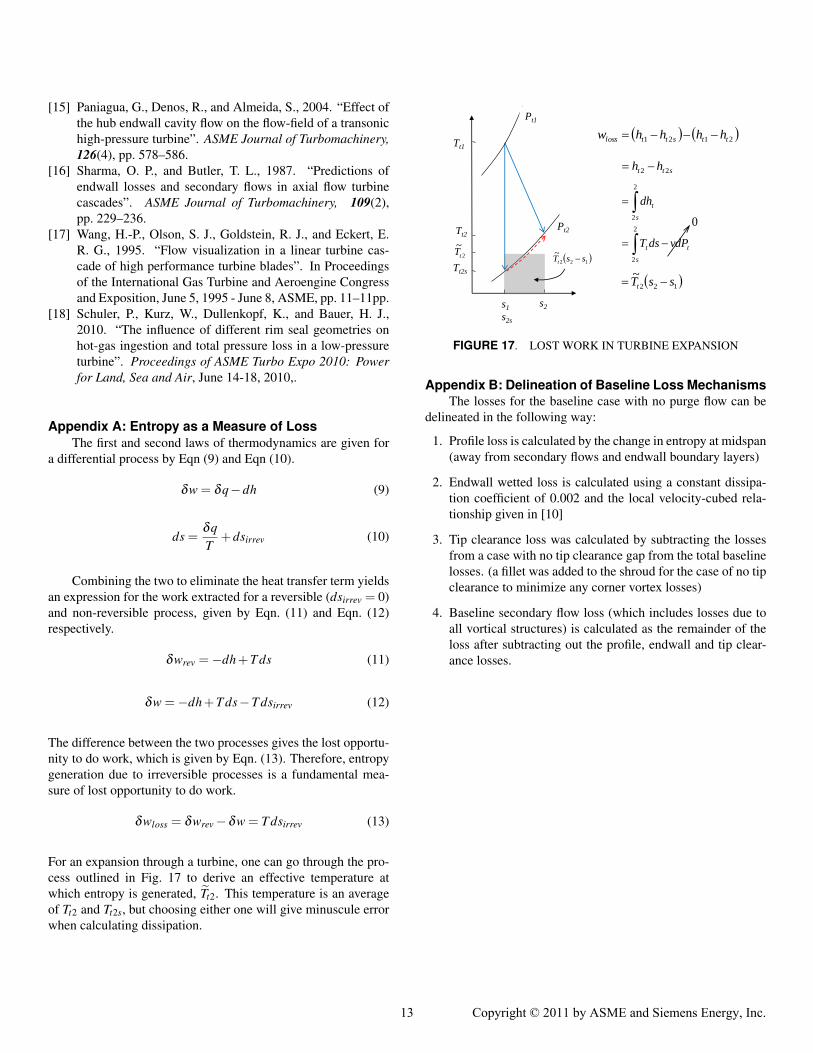
Appendix A: Entropy as a Measure of LossThe first and second laws of thermodynamics are given for
a differential process by Eqn (9) and Eqn (10).
δw = δq−dh (9)
ds =δqT
+dsirrev (10)
Combining the two to eliminate the heat transfer term yieldsan expression for the work extracted for a reversible (dsirrev = 0)and non-reversible process, given by Eqn. (11) and Eqn. (12)respectively.
δwrev =−dh+T ds (11)
δw =−dh+T ds−T dsirrev (12)
The difference between the two processes gives the lost opportu-nity to do work, which is given by Eqn. (13). Therefore, entropygeneration due to irreversible processes is a fundamental mea-sure of lost opportunity to do work.
δwloss = δwrev−δw = T dsirrev (13)
For an expansion through a turbine, one can go through the pro-cess outlined in Fig. 17 to derive an effective temperature atwhich entropy is generated, Tt2. This temperature is an averageof Tt2 and Tt2s, but choosing either one will give minuscule errorwhen calculating dissipation.
s1
s2s
s2
Tt1
Pt1
Tt2
Tt2s
Pt2
2
~tT
2121 ttsttloss hhhhw
2
2
2
2
s
tt
s
t
vdPdsT
dh
122
~ssTt
stt hh 22
0
122
~ssTt
FIGURE 17. LOST WORK IN TURBINE EXPANSION
Appendix B: Delineation of Baseline Loss MechanismsThe losses for the baseline case with no purge flow can be
delineated in the following way:
1. Profile loss is calculated by the change in entropy at midspan(away from secondary flows and endwall boundary layers)
2. Endwall wetted loss is calculated using a constant dissipa-tion coefficient of 0.002 and the local velocity-cubed rela-tionship given in [10]
3. Tip clearance loss was calculated by subtracting the lossesfrom a case with no tip clearance gap from the total baselinelosses. (a fillet was added to the shroud for the case of no tipclearance to minimize any corner vortex losses)
4. Baseline secondary flow loss (which includes losses due toall vortical structures) is calculated as the remainder of theloss after subtracting out the profile, endwall and tip clear-ance losses.
13 Copyright c© Siemens Energy, Inc. 2011. All rights reserved.
13 Copyright © 2011 by ASME and Siemens Energy, Inc.