tunneling through inter-corporate loans: the china experience
TRANSCRIPT
1
Tunneling through Inter-corporate Loans: The
China Experience
By
Guohua Jiang**
Charles M. C. Lee
Heng Yue
Current Draft: November 2nd, 2009
** An earlier version of this paper was titled: “Tunneling in China: the remarkable case of
inter-corporate loans.” Jiang ([email protected]) and Yue ([email protected]) are both
Associate Professor of Accounting at the Guanghua School of Management, Peking University, Beijing,
China; Lee ([email protected]) is the Joseph McDonald Professor of Accounting at Stanford
University. Please direct comments and/or inquiries to any of the co-authors. We are grateful to
Kangtao Ye for sharing his hand collected data on controlling shareholder receivable balances. We
also thank seminar participants at BGI, Stanford University, Santa Clara University, U.C. Davis, U. C.
Berkeley, Carnegie-Mellon University, Penn State Accounting Research Conference, Peking University,
Nanjing University, Shanghai University of Finance and Economics, Southwest University of Finance
and Economics, Tsinghua University, City University of Hong Kong, and Xiamen University for
helpful comments, and the National Natural Science Foundation of China for financial support
(approval number 70532002).
2
Tunneling through Inter-corporate Loans: The China Experience
Abstract
This study investigates a particularly brazen form of corporate abuse, in which controlling shareholders use inter-corporate loans to siphon billions of RMB from hundreds of Chinese listed companies during the 1996 to 2006 period. We document the nature and extent of these transactions, evaluate their economic consequences, examine factors that affect their cross-sectional severity, and report on the mitigating roles of auditors, institutional investors, and regulators. Collectively, our findings shed light on the severity of the minority shareholder expropriation problem in China, as well as the relative efficacy of various legal and extra-legal governance mechanisms in that country.

1
I. Introduction
Traditionally, the focus of the agency literature in the U.S. has been on the conflict
between firm managers and a diffused group of shareholders (e.g., Berle and Means
(1932) and Jensen and Meckling (1976)). However, more recent studies show that
well dispersed ownership is relatively rare outside of the U.S. and Japan, and that
large block holders control most European and Asian companies.1 In this broader
setting, the central agency problem is the risk of controlling shareholder expropriation
of minority investors, a phenomenon commonly referred to as “self-dealing”
(Djankov et al. (2008)) or “tunneling” (Johnson et al. (2000b)).
Although anecdotes of tunneling abound, the exact nature and scope of these activities
are difficult to pin down. These difficulties stem from the many varied, and often
subtle, ways that controlling shareholders can extract private benefits from the
companies they run.2 Perhaps because of these problems, economists usually
measure the impact of tunneling indirectly, either through the price paid for corporate
control, or from changes in firms’ market valuation around specific events.3 While
these studies have clearly established the existence of tunneling, they offer fewer
specifics on how it is conducted, and why certain governance mechanisms designed to
curb the problem might fail to deliver.
1 Studies that examine corporate ownership structure in Asia and Europe include: La Porta et al. (1999),
Claessens et al. (2000), Claessens et al. (2002), Faccio and Lang (2002), Faccio et al. (2001), and
Johnson et al. (2000a). 2 For example, prior studies have discussed such activities as advantageous transfer pricing to parties
related to the controlling shareholder, executive perquisites, excessive compensation, loan guarantees,
directed equity issuances, dividend policies, favorable lending terms, and outright theft of corporate
assets (See Shleifer and Vishny (1997), La Porta et al. (1999), Johnson et al. (2000b), Faccio et al.
(2001)). 3 Prior studies estimate tunneling from the premia paid for controlling shares (Zingales (1994), Dyck
and Zingales (2004), Nenova (2003), and Atanasov (2005)); or from the market reaction to related
party transactions (Bae et al. (2002), Baek et al. (2006)) or earnings (Bertrand et al. (2002)) within a
commonly controlled business group; or from the relative price declines of firms with differing
ownership structures during the Asian Crisis (Lemmon and Lins (2003)).

2
In this study, we investigate a particularly brazen form of tunneling that was widely
practiced among Chinese firms during the 1996 to 2006 period. Specifically, we
examine the use of inter-corporate loans by controlling shareholders to siphon funds
from publically listed companies. Inter-corporate loans are a useful instrument for
this purpose because they are traceable through public sources, and do not require a
“fair value” test, such as would be needed in other asset transfers between related
parties. By examining the origination and settlement of these loans, we can directly
document tunneling flows to/from controlling block holders and their surrogates.
The Chinese stock market is well suited for a study on tunneling for several reasons.
First, by virtue of heritage and design, all Chinese listed firms have a dominant/
controlling shareholder. Second, the trading of controlling shares in China are
highly restricted, thus limiting the ownership benefits of price appreciation to the
controller, and increasing her incentive to obtain benefits through other channels.
Third, the legal system in China offers few options for minority shareholders to take
private enforcement action against block holder misconduct. Fourth, public
enforcement, including fines and prison terms for tunneling, has been hampered by
the limited authority of security market regulators. For these reasons, modern day
China is an environment highly conducive to tunneling behavior.
Our empirical analyses proceed along two lines. First, we document the scope of the
problem, and assess its cross-sectional determinants and economic consequences.
Second, we analyze the efficacy of legal and extra-legal mechanisms (including
auditors, market participants, and regulators) in addressing this particular form of
insider abuse.
Our results show that during 1996 to 2006, tens of billions in RMB were siphoned
from hundreds of Chinese firms by controlling shareholders. Typically reported as
part of "Other Receivables" (OREC), these loans are found in the balance sheets of a
majority of Chinese firms and collectively represent a large portion of their assets and

3
market values. In our sample, OREC balances averaged 8.1% of total assets (5.4%
of market capitalization, or 15.9% of the value of total tradable shares4). For firms
in the top decile, OREC averaged 32% of total assets (21% of market capitalization,
or 60% of the value of total tradable shares).
Using a hand collected sample, we trace a substantial portion of these loans (between
30 to 40% of total OREC in the top three deciles) directly to controlling shareholders
or their affiliates.5 Unlike related lending by Mexican banks (La Porta et al. (2003)),
these loans were not made as part of the Chinese firms’ normal course of business.
Most of these loans did not accrue interest, and even when some interest was accrued,
neither the interest nor the principal were typically ever paid back.6
We show that ORECTA (Other Receivable scaled by Total Assets) balances are larger
for small firms (SIZE), more levered firms (LEV), less profitable firms (ROA),
non-state-owned firms (STATE), and firms registered in regions that are less
economically developed (MARKETIZATION), suggesting that the private benefits of
insider tunneling are more likely to outweigh the costs in these firms. Among firms
controlled by SOE’s, tunneling is more severe for local-government controlled firms
(LOCAL) than for firm controlled by the central-government (CENTRAL), again
suggesting that net incentives for tunneling are greater among LOCAL SOE’s.
Finally, consistent with prior market-price-based studies (e.g., Claessens et al. (2002)
and Lemmon and Lins (2003)), we show that the OREC problem is most severe when
the block holder’s controlling right (C) is much larger than her ownership right (O).
That is, firms in which the controlling shareholder enjoys the lowest cash flow 4 Tradable shares are the shares allowed to be traded on stock exchanges, and available to regular
investors. On average, approximately 35% of all shares outstanding are tradable shares. 5 This figure almost certainly understates the magnitude of the related-party portion of OREC, as many
of the affiliates cannot be easily identified with the controlling entity. The problem is exacerbated by
the pyramidal structure of Chinese listed companies, which can obscure related party relationships (see
Fan et al. (2005)). 6 Later, we describe in detail how the practice of tunneling through inter-corporate loans finally ended
in December 2006 after a long series of government rules and directives (see Appendix 3).
4
ownership rights (i.e., firms with large C/O ratios) also have the largest ORECTA
balances. This result is robust after controlling for all the other determinants of
tunneling.
We also document significant negative economic consequences for the shareholders of
firms with high ORECTA balances. Companies with large ORECTA balances
exhibit worse future operating performance, both in terms of lower accounting
rates-of-return and higher likelihood of entering financial distress. After controlling
for current ROA, we find that the level of ORECTA is the single best predictor of next
year’s ROA. In addition, we show that high ORECTA firms are far more likely to
acquire ST (Special Treatment) status in the future.7 Specifically, 14% of the top
decile ORECTA firms attain ST status in two years, compared to an average of less
than 2% in the bottom 2 deciles firms. Ancillary tests indicate that although
profitability and tunneling severity are negatively correlated, the causality is mainly
unidirectional (i.e. sharp increases in tunneling precedes significant profitability
declines, and not vice versa).
Further tests indicate that market participants do not seem to fully anticipate these
negative consequences. We find that the market uses a higher implied discount rate
in valuing the earnings of High-ORECTA firms, suggesting a general awareness of the
problem. However, we also find that high-ORECTA firms earn lower risk-adjusted
returns in the subsequent 12-months, indicating that the negative implications of these
loans are not fully incorporated into prices. A hedge portfolio that sells the top
decile ORECTA firms and buys the bottom decile earns over 1% per month over the
next 12 months. This result is robust to the inclusion of a variety of risk controls.
7 Market regulators assign ST status to any firm that has had two consecutive annual losses (or whose
book value is negative). ST stocks are “on probation” and operate under various trading and financial
restrictions. If they report one more annual loss, trading will be suspended; a fourth loss will result in
delisting. Because Chinese firms rarely go into actual bankruptcy, ST status can be regarded as a
comparable measure of financial distress.

5
We also provide some evidence on why various legal and extra-legal governance
mechanisms might have been inadequate in containing this practice. First, we show
that institutional ownership is a relatively small part of the Chinese market landscape,
a fact that likely contributes to the persistence of the mispricing. The average
ownership by mutual funds in our sample is only 1.33% of total shares outstanding
(2.8% of tradable shares). As of the end of 2004, ownership by all institutional
investors, including Mutual Funds, Social Security Funds, and Pension Funds, is only
3.75% (8.26% of tradable shares). Interestingly, we find that institutional ownership
is highest among low ORECTA firms, suggesting these institutions tend to avoid
owning high ORECTA firms. Evidently these investors do take ORECTA balances
into account when selecting stocks, but their collective effect on pricing is limited.8
Second, we examine the mitigating role of auditors. Allen et al. (2005) suggest that
a weak auditing profession is at least partially to blame for the relatively sluggish
growth of China’s Listed Sector. We find, however, that auditors in China play an
active monitoring role. Firms with high-OREC balances are far more likely to
receive a qualified opinion – in fact a full 45% of the firms in the highest ORECTA
decile received an unclean opinion in the reporting year. Unfortunately, firms
receiving a qualified opinion in one year exhibit no tendency to reduce their OREC
balance in the following year. This evidence is consistent with the view that when
private enforcement channels are weak or unavailable, disclosure alone is not enough
to curb insider abuse.9
Finally, we report on the constraints that market regulators in China operate under.
We show that a string of security regulations issued between 2001 and 2006 (see
Appendix 3) were largely ignored, primarily because market regulators had no
8 Short-selling is not allowed in China, which further limits the ability of informed investors to
discipline the price of high ORECTA firms. 9 For good discussions on alternative approaches to the regulation of tunneling activities, see La Porta
et al. (2006) and Djankov et al. (2008).

6
jurisdiction over the controlling entities (which themselves were typically unlisted).
It took a joint statement by eight government ministries, threatening public disclosure
and personal action against top management of the controlling entities, to finally stop
the abuse. This unusual show of political resolve finally resulted in the repatriation
of most of the remaining OREC balances – which, even as late as 2006, amounted to
close to 50 billion RMB, and involved over one third of all listed stocks.
Overall, our findings provide a portrait of the nature and severity of the tunneling
problem in China, and new insights on why existing legal and extra-legal governance
mechanisms were inadequate to contain this practice. Our evidence shows that in
certain settings, public disclosure alone is not enough – i.e., when minority
shareholders have no legal recourse and when security regulators have limited
jurisdiction over the controlling entities, even an extremely transparent form of
tunneling can persist for many years. These findings have implications for the
literature on the regulation of insider abuse (e.g., Djankov et al. (2008) and La Porta et
al. (2006)). Specifically, they argue for increased legal, rather than extra-legal,
regulatory measures in curbing Chinese insider abuse.
Looking ahead, we note that the tunneling problem in China has stubborn roots.
Although this specific form of abuse has been eradicated, the incentives that gave rise
to the tunneling are largely intact (in fact, recent reform has increased the C/O ratio of
most Chinese firms, potentially exacerbating the problem). Until these root tensions
are more fully addressed, insider tunneling will pose an on-going challenge to reform
in China. In the mean time, we believe researchers interested in understanding
managerial and investor behavior in China would do well to keep the tunneling
perspective in mind.
The remainder of this paper is organized as follows. Section II provides a review of
related research as well as background information on the Chinese stock market.
Section III presents our empirical analysis, and Section IV concludes with a

7
discussion of the implications of our findings.
II. Literature Review and Institutional Background
II.1. Private Benefits of Corporate Control
The value of controlling rights over corporate resources has come to play a central
role in modern thinking about finance and corporate governance. Early theoretical
work by Grossman and Hart (1988) has evolved into a substantial literature under the
euphemistic label “private benefits of control” (Hart (1995), Zingales (1994)). In
fact, the extensive literature on investor protection and its role in the development of
financial markets (e.g., La Porta et al. (2000)) is focused on the problem of insider
tunneling and its containment in international settings.
A number of prior studies have estimated the magnitude of these private benefits
through the premia paid for voting rights (Zingales (1994), Nenova (2003), Dyck and
Zingales (2004), and Atanasov (2005)). The estimates from these studies range
widely, but are often in the order of 25% or more of the value of firms, particularly in
countries with less developed capital markets.10 Another approach is to infer
tunneling by linking ownership structure to prices paid in related party transactions, or
changes in firm equity value under special settings.11
10 Zingales (1994) show that in Italy private benefits of control are substantial and can easily exceed
60% of the value of non- voting equity. Nenova (2003) measures the value of corporate voting rights
in 18 countries and shows that much of the variation can be explained by the legal environment, law
enforcement, investor protection, takeover regulation, and corporate charter provisions. Dyck and
Zingales (2004) estimate the private benefits of control across 39 countries and find that higher private
benefits of control are associated with less developed capital markets, more concentrated ownership,
and more privately negotiated privatizations. Atanasov (2005) use mass privatization auction data
from Bulgaria to show investors will pay substantially more for a controlling stake.
11 Bae et al. (2002) use evidence from mergers by Korean business groups to show that acquisitions
prices tend to enhance the value of other firms in the group, to the detriment of minority shareholders.
Bertrand et al. (2002) use earnings data on Indian business groups to show evidence consistent with
tunneling by the largest shareholder within the group. Finally, Lemmon and Lin (2003) document a

8
Compared to prior studies, our approach has certain advantages and limitations. By
using a direct measure of tunneling that is independent of firm value, we are able to
gauge the prevalence of the phenomenon across all listed firms (not just firms with
particular ownership structures or within related business groups). We are also able
to provide much more detail and color on how tunneling is actually accomplished, as
well as conduct more detailed tests, including asset pricing tests, on the causes and
consequences of tunneling. Finally, because our measure of tunneling is reported at
regular intervals, we are able to evaluate the response of various parties (such as
auditors, institutional investors, and market regulators), and thus infer something
about the efficacy of alternative governance mechanisms.
The main limitation of our approach is that we only examine one particularly form of
tunneling. Compared to the control premium literature, for example, which provides
an estimate of the total maximum private benefits for control, our evidence provides a
minimum direct measure of tunneling. Our measure is more interpretable as clear
evidence of tunneling, but the magnitude of the overall problem is almost certainly
greater than our estimate. Therefore, while prior evidence establishes a “ceiling” for
the total economic impact of tunneling, our evidence establishes a “floor” for Chinese
firms. Our point is that, even with this minimal estimate, the scale (and reach) of the
tunneling problem in China is impressive, and merits further study.
II.2 Salient Features of the Chinese Stock Market
Chinese stock market is conducive to tunneling for several reasons. First, all
Chinese listed firms have a dominant shareholder. In the early 1990s, under a
“partial privatization” initiative, the Chinese Government allowed state owned
enterprises (SOEs) to sell a minority portion of ownership to private investors. This
led to the creation of China’s two stock exchanges: Shanghai (in 1990) and Shenzhen
relation between ownership structure and the decline in firm value during the Asian financial crises.
9
(in 1991). By the end of 2004, the number of listed stocks reached 1,377 with a total
market capital of 3,706 Billion RMB. Most of these firms are carve-outs or spin-offs
from an existing state-owned enterprise (SOE), in which the original SOE retains a
substantial block holding. Indeed, the Chinese government has been explicit in
requiring that control of these listed companies not be relinquished.12
Second, the trading of block shares is highly restricted. During our study period,
common stocks in China were classified into two groups: tradable or non-tradable
(also called negotiable vs. non-negotiable). 13 Shares owned by all levels of
governments, state agencies (such as universities), and other legal entities, are
non-tradable. The rest of the shares are sold to individual citizens and institutional
investors, and are tradable.14 As of February 2005, non-tradable shares accounted
for 63.51% of all outstanding stock. Approximately 70% of all non-tradable shares
were held by state-owned enterprises.
Third, minority shareholders have few private channels through which to take actions
against insider misconducts. Courts in China have had a long tradition of protecting
State interests and have little experience with private plaintiff-driven litigation (Allen
et al. (2005), MacNeil (2002)). At the same time, Chinese listed firms face few
external governance mechanisms (such of takeovers or other forms of investor
activism) that might deter block holder misconduct. Institutional ownership,
particularly by mutual funds, is also low among Chinese firms, thus limiting the 12 In our sample, the percentage of shares controlled by the largest shareholder for the median firm is
42.6%; the inter-quartile range is 29% to 58%. In the summary section we discuss the Chinese
governments expressed intent to retain control of listed firms, particularly in key industries. 13 Prior to 2005, all block shares are non-tradable. In July 2005, the Chinese government announced
a policy aimed at eventually converting these restricted shares into tradable shares. This initiative is
part of a broad reform program that will take years to implement. Later, we discuss why this initiative
is unlikely to fully resolve the agency problems that lead to tunneling in China. 14 The tradable shares are further subdivided into Tradable-A shares, which are publicly traded among
domestic investors, and foreign (B, H, and N) shares. B-shares are available to foreign investors and
are traded on the two domestic exchanges, whereas H and N shares have an overseas listing. In this
study, the market price of a listed company refers to the price of its Tradable-A shares.

10
disciplining effect of these investors on share prices. In addition, as we illustrate
later, the public enforcement mechanism in China is constrained by the limited
authority of security market regulators.
In sum, the confluence of: (1) highly concentrated ownership structures, (2) limited
ownership benefit for block holders from price appreciation, and (3) absence of legal/
extra-legal mechanisms to curb block holder abuse, have together created an
environment in modern China that is highly conducive to tunneling.
II.3 Other Related Studies
Our study is also related to recent studies that examine corporate governance and
earnings management in China. Several papers have documented weaknesses in the
country’s legal and financial system (e.g., see Liu (2005), Allen et al. (2005), Fan et al.
(2007), Cheung et al. (2006)), and the mitigating effect of regulatory changes (Bai et
al. (2003), Berkman et al. (2005)). A consistent theme is that better corporate
governance is valuable in China’s emerging economy, and improvements in
governance are rewarded in market valuations. A second group of China studies
have explored the effect of ownership structures on earnings management in Chinese
firms ((Liu and Lu (2007), Chen et al. (2003), Peng et al. (2006), Jian and Wong
(2006)). Several of these studies document a phenomenon called “propping”, in
which the controlling shareholder instigates favorable asset-related transfers, so as to
meet key performance targets stipulated by market regulators.
We believe the economics of tunneling provide an important organizing framework
for interpreting these results. Controlling shareholders will sometimes “prop up” the
earnings of a firm through favorable asset transfers, precisely because such actions are
needed to facilitate and sustain long-term tunneling. In the absence of tunneling

11
incentives, such costly forms of earnings management are difficult to understand.15
Similarly, much of the governance literature is only understandable in the presence of
tunneling risk. Improved governance is highly valued in China precisely because of
the real and imminent threat of insider abuse, and the dearth of other effective
enforcement mechanisms. Again, it is tunneling that helps us to understand these
findings. In short, our study helps to make sense of earlier results by demonstrating
the importance of adopting a tunneling perspective when studying managerial
behavior in China.
Problems with loans to related parties are, of course, not unique to China. In the
United States, a landmark tunneling case involved credit facilities from Adelphia
Communications to members of the controlling Rigas family. In Australia,
inter-corporate loans helped to facilitate the building (and later undoing) of the Alan
Bond empire.16 During the Asian crisis, many firms that experienced the worst price
decline made related party loans (Lemmon and Lins (2003)). Similarly, when
Mexican banks lend to firms controlled by the banks’ owners, the lending tends to
take place on better terms but are more likely to default (La Porta et al. (2003)). We
show that insiders’ use of inter-corporate loans to siphon funds reached unprecedented
proportions in China. We examine the causes and consequences of this phenomenon,
and why various governance mechanisms failed to fully mitigate the problem.
15 In fact, both Jian and Wong (2006) and Liu and Lu (2002) find that the pattern of earnings
management observed among Chinese firms is consistent with an abiding desire to facilitate and sustain
long-term tunneling. 16 See Van Peursem et al. (2007) for a detailed analysis of both the Adelphia and Bond cases.

12
III, Empirical Analysis
III.1 Sample Description
Our sample consists of 1,377 public companies, listed on the Shanghai and Shenzhen
stock exchanges during the period 1996 to 2004. We use the CCER China Stock
Database, provided by SinoFin Information Services, to obtain fundamental variables,
price and returns information. To be included in our sample, a company must have
been listed for at least one year, and have filed the necessary financial information
required for our analysis. Collectively, as of the end of 2004, our sample of
companies represents 85.6% of the total listed firms (85.2% of the total market
capitalization) in China.17
Table I presents some descriptive statistics for our sample. In total, we have 7,557
firm-year observations. Chinese firms all have December year-ends, and the financial
information for year t is based on fiscal year-end t-1 financial reports. Panel A
reports the log of total assets (SIZE); market capitalization as of the fourth month
after the fiscal year end in millions of RMB (MV); the total market value of tradable
shares (TMV); the book-to-market ratio measured four months after the fiscal year
end (BM); total leverage, defined as total liabilities divided by total assets (LEV);
return-on-assets, defined as pre-extraordinary income divided by total assets (ROA);
the percentage of shares controlled by the largest shareholder (BLOCK); other
receivables in millions RMB (OREC); as well as other receivables deflated by market
capitalization (ORECMV), tradable market value (ORECTMV), and total assets
(ORECTA).. All variables are winsorized at 1% and 99%.18
Panel A shows that the average market capitalization for our sample is 3.15 billion
17 Throughout the paper, market capitalization (MV) refers to the value of tradable shares multiplied
by total shares outstanding, both tradable and non-tradable. TMV refers to the market value of the
tradable shares alone. 18 All key results are robust to alternative winsorization techniques, including cross-sectional
winsorization each year, winsorsizing the entire sample, and no winsorization.

13
RMB (approximate 381 million US dollars, using the prevailing exchange rate of 8.27
during our sample period). Most of these firms traded at a multiple of 2.5 to 5 times
book (BM), and had reported ROA's of between 1% and 6%. Of particular interest is
that most had substantial "Other Receivables" on their balance sheets (ORECTA) –
the inter-quartile range for this variable is between 1.7% and 10.8% of total assets
(2.6% to 17.5% of tradable market value). As expected, the largest shareholder
controls a substantial portion of these firms – the inter-quartile range for the BLOCK
variable is 29.2% to 58.2%.
Panel B reports year-by-year statistics for ORECTA. This panel shows that Other
Receivable as a percent of total assets has been on the decline over the sample period.
As we show later, the decline coincides with a concerted campaign by the China
Securities Regulatory Commission (CSRC) to reduce these loans.19 Nevertheless,
even by the end of 2004, the median firm still reported an "Other Receivable" balance
representing 2.4% of total assets. By definition, these loans are not part of ordinary
business transactions, and a casual survey of the financial footnotes show that they are
typically made to related parties, often associated with the largest shareholder.
However, this account also can contain miscellaneous receivables from parties not
immediately identifiable with the controlling block holder.
Appendix 1 presents a case study that illustrates the problem. The HANQI Group is
the largest shareholder of FENG HUA, holding a bit less than 30% of its shares.
From early 2002, the HANQI Group (including its subsidiaries HANQI Real Estate,
and Beijing HANQI) “borrowed” large amounts of money from FENG HUA.
Appendix 1 contains excerpts from FENG HUA's financial statements. To gain a
sense for the magnitude of these borrowing, on December 31, 2002, HANQI’s share
of equity in FENG HUA is RMB 116.21 millions. On that date, it and its subsidiaries
borrowed from FENG HUA a total of RMB 198.6 millions. FENG HUA never 19 Appendix 3 shows that the CSRC tried to curb these practices as early as 2001, but its early efforts
were largely ignored.

14
recovered any of the money due from HANQI Group or its subsidiaries. Subsequently,
FENG HUA stock was put into Special Treatment (ST) status as a result of reporting
two consecutive annual losses.
The money that large shareholders owe the listed company is included in a data item
called “Other Receivables” (OREC), which in this instance also included several other
large items not directly traceable to HANQI. Unlike trade receivables, which are
separately reported under the customary title of “Accounts Receivables”, these
corporate borrowings are not part of ordinary business transactions, and are thus
separately flagged in the report.
III.2 Large Share Holders and OREC
To better understand the extent to which “other receivables” is used as a vehicle for
large shareholder tunneling, we secured hand collected data used by Ye (2006).
From financial footnotes, Ye derived Other Receivables due from controlling
shareholders and its affiliated companies for all manufacturing firms listed in the
Shanghai Stock Exchange between 1999 and 2002 (a sample of 1134 firm-years, or
approximately 30% of our full sample during these years). For each year between
1999 and 2002, we sort all listed Chinese firms annually into ten deciles based on
ORECTA (full sample). We then use the Ye (2006) data to examine the proportion
of OREC in each decile directly traceable to the majority shareholder and its affiliates.
Appendix 2 reports the number of firm-years in Ye (2006) captured by each ORECTA
decile in our full sample. Column 3 shows that the Ye sample is quite evenly spread
out over our full sample. Column 4 shows that the average ORECTA balance from
the Ye sample also closely approximates the average for the full sample. Columns 5
and 6 report the total gross OREC and the large shareholder gross receivable (LSH
Gross OREC) derived from the Ye (2006) data set, and Column 7 reports LSH
receivable as a percentage of total gross OREC.

15
Overall, this evidence shows that a substantial portion of OREC is directly traceable
to the largest shareholder and its affiliates, particularly for firms in the high ORECTA
deciles. For example, firms in the top 3 deciles by ORECTA (full sample) have 30
to 40 percent of its OREC balance directly traceable to the majority shareholder or
affiliates. Moreover, the proportion owed by LSH decreases monotonically across
the ORECTA deciles, further indicating that problem of large shareholder tunneling is
also likely to decrease in severity in the lower ORECTA deciles.20
As a final check, we compared our OREC measure to the amount of inter-corporate
loans to controlling shareholders reported in an official list of 189 firms identified by
the Shanghai and Shenzhen Stock Exchanges on June 1, 2006. These 189 firms
were flagged by the two exchanges as those in which the problem of controlling
shareholder tunneling is most severe. We collected the amount of OREC from the
2005 annual reports of these 189 firms, and found the Pearson correlation between our
OREC measure and the amount of LSH OREC reported on this official list to be
73.7%. Moreover, 43.75% of these firms were in the highest 2005 ORECTA decile,
and nearly 90% were in our top four ORECTA deciles.
The evidence thus far strongly suggests that by ranking firms using ORECTA, we
have a good empirical proxy for the degree of inter-corporate lending to the
controlling shareholder and its affiliates. In the following analyses, we aim to better
understand the nature and economic consequences of these loans.
20 To further ascertain the extent to which the Ye (2006) sample is representative of the full sample, we
checked a number of other firm characteristics. The details are not reported but are available on
request. In brief, the Ye firms are not significantly different from the rest of the firm-years in our
sample in terms of Size, BM, and ROA. However, the Ye sample shows slightly higher state
ownership (34.95% versus 31.55%) and lower ORECTA (7.67% versus 8.88%). In the current
context, these differences are likely to understate the extent to which ORECTA is attributable to the
majority shareholder and its affiliates in the Ye sample.

16
III.3 The Persistence of ORECTA
To better understand the nature of these receivables, we sort firms into ten deciles
based on ORECTA, and trace the evolution of this variable through time. Figure 1A
reports the mean ORECTA for each decile in year t through t+3, and Figure 1B
reports the average decile ranking for the same four-year horizon.
The main result from these analyses is that cross-sectional rankings of firms by
ORECTA tend to be quite persistent over time. In other words, firms with larger
(smaller) "Other Receivable" balances tend to remain in the upper (lower) end of the
ORECTA over the next three years. For firms in the highest ORECTA decile in year t,
the average "Other Receivable" in year t+3 is still 20% of total assets. This evidence
is consistent with the long-term nature of the receivables. Specifically, it suggests
that the receivable is a more or less permanent part of the companies' portfolio of
reported assets. Cast in a different light, this evidence shows that listed Chinese
companies are routinely engaged in the practice of extending long-term credit in large
quantities to their largest shareholder.
III.4 Economic Consequences
In this section, we explore the economic consequences of large OREC balances.
Specifically, we examine the implications of large ORECTA balances for firms’ future
operating performance and the likelihood of experiencing financial distress.
Table II Panel A reports the results of a regression in which the dependent variable,
FROA, is the year t+1 return on asset. Independent variables include the current
year return-on-asset (ROA), and a rank variable, R_ORECTA, the scaled decile rank
of ORECTA (i.e., R_ORECTA=1 for firms in the highest ORECTA decile, and =0 for
firms in the lowest decile). In addition, we use a number of other control variables:
LEV is the total liability divided by total assets, SIZE is log of total assets, NEG is a
dummy variable, which takes 1 if current year net income is negative and 0 otherwise;

17
we also control for firm and year fixed effects.21 The results show that R_ORECTA
has a strong negative relation to future ROA, after controlling for other variables
(T-statistic = -8.5). In other words, controlling for current ROA, higher ORECTA
firms earn lower future ROA. The difference between top and bottom decile
ORECTA firms’ expected ROA is 4.9%.
In Table II panel B, we use a LOGIT model to estimate the effect of ORECTA on the
probability of firms becoming “Special Treated” (attaining ST status) in year t+3.
For this analysis, the dependent variable is a dummy variable, which takes 1 if the
firm was specially treated and 0 otherwise. Independent variables include
R_ORECTA and other control variables for predicting financial distress. ROA is
operating income divided by total assets, ATURN is asset turnover, SG is sales
growths from the last year, OCF is operating cash flow divided by total assets,
NONOPERAT is non-operating income deflated by total assets, and BLOCK is the
percentage of shares held by the largest shareholder. Because we use variables in
year t to predict special treatment in t+3, our sample size in Panel B reduces to 5,668
observations.22
Panel B reports the results of two LOGIT models. In the first regression, we use all
the independent variables except R_ORECTA. The results show that ROA, ATURN,
LEV, OCF, SIZE, and BLOCK all have some incremental power to predict future ST
status. In the second regression, we add R_ORECTA to the model, and find that it
has a strongly positive coefficient. In fact, aside from current year ROA,
R_ORECTA is the single most important predictor of subsequent ST status. 21 None of the main results are affected if we only control for annual fixed effects (i.e. exclude firm
fixed effect indicator variables). Also, we obtain very similar results if we use return-on-sales (ROS)
rather than return-on-assets (ROA) as the performance metric in this analysis. 22 We predict ST status for year t+3 because firms that attain this status will have reported two
consecutive years of losses. We skip two years to avoid a peek-ahead bias. As a robustness check,
we also used year t+2 and t+4 ST status as the dependent variable and found similar results.

18
Figure 2 provides a graphic illustration of this result. To construct this figure, we
sort firms annually into ten deciles based on the magnitude of their reported ORECTA.
This figure depicts the proportion of firms in each decile that received ST status two
years after the formation of the deciles. The results show a high proportion (14%) of
the firms in the top ORECTA decile in year t will receive ST status in year t+3. This
compares to an average of around 4% to 5% for the rest of the sample. The next two
ORECTA deciles also exhibit a higher than average tendency to receive ST status.
Overall, these results show that firms with high ORECTA balances perform worse in
terms of operating performance, and are much more likely to become a candidate for
delisting in future years. In the next section, we examine the extent to which market
prices reflect these adverse consequences.
III.5 Market Pricing and Returns Prediction
Table III presents an analysis of the impact of tunneling on firm valuation. The
dependent variable for this analysis is MVTA, defined as the market value of the firm
at the end of the fourth month after fiscal year end, deflated by total assets. The
independent variables are as defined in Table II, except for: BVTA, defined as book
value deflated by total assets, and ROA_ORECTA, an interaction term. To compute
this last variable we multiply ROA by R_ORECTA. To the extent that the market
applies a greater discount to the earnings of high-ORECTA firms, we would expect
the coefficient on ROA_ORECTA to be negative. Once again we include dummy
variables to control for firm and year fixed effects.
The results show that this is indeed the case. As expected the coefficients on both
BVTA and ROA are positive. The coefficient on R_ORECTA is, surprisingly, not
significant in Model 1 and reliably positive in Model 3, suggesting that the market

19
does not generally value high ORECTA firms at a discount. However, the
coefficient on ROA_ORECTA is reliably negative in both Models 2 and 3. The
coefficient estimates from Model 2 indicate that for the highest ORECTA decile firms,
the market assigns an average multiple of just 4 to reported earnings (13.8 – 9.8).
Conversely, for low ORECTA firms, the multiple on earnings is 13.8.
Table IV examines the usefulness of ORECTA in predicting future returns. Panel A
presents future monthly size-adjusted returns (in percentage) for deciles formed on
ORECTA. In each year between 1996 and 2004, we sort firms into ten deciles based
on ORECTA. We then compute future returns begin from May 1 (year t+1) through
April 30 (year t+2). Table values in the first column (EW-ADJ) represent the
average monthly equal-weighted size-adjusted returns for each portfolio.23 Table
values in column 2 (FF-ADJ) are the intercept terms from time-series regression of
each portfolio’s monthly returns on the returns from three factor-mimicking portfolios
(MKT, HML, SMB), constructed in the same manner as Fama and French (1993), but
using Chinese data.
In panel B, we compute risk-adjusted returns using a Fama-McBeth procedure.
Specifically, every month we regress monthly returns on R_ORECTA, R_MV (scaled
decile rank of market value at the end of April (t+1)), R_BM (scaled decile rank of the
Book-to-Market ratio), R_STDRET (standard deviation of daily returns during the
month prior to portfolio formation), and R_LEV (scaled decile rank of leverage,
defined as total liability divided by total assets). Each of the control variables has
been associated with future realized returns in Chinese markets (e.g., see Eun and
Huang (2007)). In total there are 108 months. Panel B reports the mean of these
monthly coefficients and the t-statistics associated with their time-series variation.
The evidence in both panels supports the view that ORECTA is negatively correlated 23 To compute size-adjusted returns, we subtract the average return for the firms in the same size decile
each month. Size decile returns are as reported by the CCER database.

20
with future returns. Panel A shows that low-ORECTA firms generally earn higher
returns than high-ORECTA firms. The pattern is not monotonic across the deciles,
but the difference in monthly returns between the top and bottom ORECTA firms
(from 0.810% to 1.014% per month) is statistically significant. Panel B results show
that this negative correlation with future returns is robust to the inclusion of market
capitalization (MV), book-to-market (BM), idiosyncratic risk (STDRET) and leverage
(LEV). In fact, R_ORECTA is the single most reliable predictor (by T-statistic)
among the known factors.
Table V examines the consistency of this result year-by-year. Table values represent
returns to a hedge strategy that buys the low-ORECTA decile portfolio and sells short
the high-ORECTA portfolio. In computing abnormal returns, we use four different
benchmarks to adjust for alternative measures of risk. ARET1 is the hedge return
where each firm’s abnormal return is computed relative to a reference decile portfolio
formed on the basis of its market value of tradable shares (size-adjusted); ARET2 is
abnormal returns relative to portfolios formed on deciles of firm beta (beta-adjusted);
ARET3 is relative to an equal-weighted market index (EW-index); ARET4 is relative
to a value-weighted market index for tradable shares of both the Shanghai and
Shenzhen markets (VW-index); ARET5 is the annual average of the monthly
coefficients on R_ORECTA derived from monthly Fama-MacBeth regressions with
control variables as describe in Panel B of Table IV (FM-Adj). Reported t-statistics
are based on the time-series variation in annual abnormal returns.
Table V shows that high-ORECTA firms consistently underperform low-ORECTA
firms regardless of the benchmark. The spread between the high and low ORECTA
firms is most pronounced in the second half of the sample period (2000 to 2004).
During this sub-period, high-ORECTA firms underperformed low-ORECTA firms by
1.14% to 1.43% per month, depending on the benchmark. It is perhaps not
surprising that tunneling schemes tend to unravel in bear markets. As firms undergo
economic stress, the non-performing asset problems associated with tunneling become

21
more transparent. For example, in Lemmon and Lins (2003) the effects of tunneling
are only reflected in firms’ price declines during the Asian Financial Crisis.
We find further support for this view when we examined the Allowance for Bad Debt
balances for our sample firms. The average Gross ORECTA balance for our firms
did not decline over time, but the average Net ORECTA (our measure) did. This is
because Chinese firms, on average, increased their Allowance for Bad Debt every
year in the post-2000 period.24 As this Allowance is increased, reported earnings are
simultaneously decreased, thus making the valuation consequences more transparent.
This finding helps to explain the greater hedge returns in the latter period, despite
lower ORECTA balances.
III.6 Ancillary Tests
In this section, we examine cross-sectional factors that could affect the severity of the
tunneling problem across firms. Our first test is motivated by international evidence
that tunneling is most problematic when the block holder’s controlling right (C) is
much larger than her ownership right (O).25 The intuition is straightforward: as the
C/O ratio increases, the controlling shareholder derives relatively greater benefit from
tunneling activities. In China, the largest block holder has effective control, even
when holding a relatively low percentage of total shares. Therefore, we would
expect the tunneling problem to be most severe in low BLOCK firms (i.e. firms
whose percentage held by the largest shareholder are lowest).
Figure 3 illustrates the relationship between ORECTA and BLOCK (the percentage of
24 The WIND database separately reports Gross and Net Other Receivables after 2000. The average
Gross Other Receivables for our sample firms in 2001 was 12.5 million RMB. This variable
increased every year, to a balance of 13.9 million RMB in 2004. However, this increase was more
than offset by the increase in the average Bad Debt Allowance (11% of Gross Other Receivables in
2001 and increasing to 16% of Gross Other Receivables in 2004). As a result, Net ORECTA
decreased each year throughout this period. 25 See, for example, Lemmon and Lin (2003) and Claessens et al. (2002).

22
shares outstanding held by the largest shareholder). To construct this graph, we sort
firms each year into 10 deciles based on the percentage of common shares held by the
biggest shareholder (BLOCK). We then calculate the median of ORECTA in each
decile. The figure depicts the distribution of ORECTA in each BLOCK decile. The
X-axis is decile rankings based on BLOCK. BLOCK values are on the left Y-axis,
ORECTA values are on the right Y-axis.
Figure 3 shows that the use of ORECTA is most pervasive when the block holder’s
controlling right (C) is much larger than her ownership right (O). Specifically,
ORECTA balances are highest when the controlling shareholder holds less than 30%
of the shares. In fact, in the top BLOCK decile (where the controlling shareholder
owns over 70% of cash-flow rights), ORECTA balances are quite low (around 2%).
Table VI provides a more comprehensive analysis of factors that could affect the
severity of the tunneling problem across firms. The dependent variable in this
analysis is ORECTA. The independent variables are: BLOCK; ROA
(return-on-assets from the prior year); SIZE (log of total assets); STATE (a dummy
variable that takes the value of one if the largest shareholder is any level of
government or any government-owned institution); Central and Local (dummy
variables indicating whether the largest shareholder is a central government or local
government agency); MARKETIZATION (a comprehensive index measuring the
development of the regional market in which the firm is registered (see Fan and Wang
(2006)), where higher values indicate greater regional market development; and
LAYER (the number of intermediate layers between the company and its controlling
owner through the longest pyramidal chain (see Fan et al. (2007)). We also include
industry and year fixed effect dummies.
Model 1 reports the result when only ROA, BLOCK, and SIZE are included as
explanatory variables. This model shows that ORECTA is higher for smaller firms
and less profitable firms. Consistent with the univariate analysis, BLOCK has a

23
strong negative relation with ORECTA after controlling for SIZE and ROA. Model
2 adds STATE and shows that this form of tunneling is worse when the controlling
shareholder is not a state-owned enterprise. Non-state entities that control listed
firms include regional collectives and private entrepreneurs. Our evidence suggests
that, on average, companies controlled by these entities tend to have more severe
tunneling problems. Model 3 adds MARKETIZATION and shows that the tunneling
problem is marginally attenuated if the firm is located in a more developed region of
the country. This is consistent with the notion that tunneling is a bigger problem in
less developed areas of China, and is analogous to the cross-country findings in
Nenova (2003).
In Model 4, we separate state-owned enterprises (STATE) into Local and Central
agencies, and find that tunneling problems appear to be relatively more severe in
Local-government controlled enterprises. The difference between Central and Local
is statistically significant. This finding is consistent with Cheung et al. (2008), who
analyze a sample of related party transactions and find that local government
controlled entities tend to have a greater problem with expropriations through transfer
pricing. They argue that is because local government bureaucrats are less likely to
be prosecuted for misappropriation of state funds. Finally, Model 5 shows that the
number of layers of ownership in the pyramidal structure (LAYER) is not related to
the level of ORECTA.
Overall, the results of these regressions confirm that BLOCK is strongly negatively
correlated with ORECTA. At the same time, it shows that SIZE, ROA, STATE, and
MARKETIZATION also contribute in explaining the degree of tunneling across firms.
In particular, local government controlled firms have a more severe problem than
central government controlled firms, and non-state controlled firms have a more
severe problem than state controlled firms.
Thus far we have seen that ORECTA is higher for low ROA firms. At the same time,
24
ORECTA is incrementally useful in predicting future ROA (after controlling for
current ROA). An interesting question is whether tunneling is a consequence or a
cause of poor performance. While our data do not allow us to fully address this issue,
we attempt to provide some evidence on it in Table VII. This table presents annual
industry-adjusted ROA in the years immediately adjacent to a large increase in
ORECTA (defined either as an increase in decile ranking of 5 or more (Panel A), or as
an increase in ORECTA of 0.15 or more, starting from a low base (Panel B)). In
effect, Panel A identifies firms in the lower five deciles in year t-1 that moved to the
higher five decile in year t. Similarly, Panel B identifies firms in one of the lowest 7
deciles in year t-1 that moved to one of the three highest deciles in year t.26
The results in Panel A of Table VII show that for the firms with a large increase in
ORECTA ranking, industry adjusted ROA in years t-2 and t-1 are not significantly
different from zero, but ROA in years t, t+1, and t+2 are significantly worse than
industry average. The results in Panel B provide some evidence that performance
began to decay in year t-1 for firms with large ORECTA balance increases, but that
the assumption of the loan is a strong predictor of worse future performance still holds.
We find virtually identical results using other ROA cutoffs. In general, the evidence
suggests that while poor operating performance (weakly) increases the likelihood of a
large increase in ORECTA, a large increase in ORECTA is a strong predictor of future
deterioration in operating performance.
The fact that a relatively transparent disclosure item is not fully priced seems curious.
Investigating further, we find that institutional investors and mutual funds play a small
role in Chinese markets. Table VIII presents total shareholdings of Mutual Funds
and all Institutional Investors (including mutual funds, Social Security Funds, Pension
26 For Panel A, we also tested firms whose ORECTA decile rank increased by at least 4 or 6 in year t.
For Panel B, we also tested firms whose ORECTA are less than 0.10 in year t-1 and whose change in
ORECTA is 0.12, 0.15, or 0.18 or greater in year t. None of the key results are affected by these
perturbations.

25
Funds) as a percentage of total shares outstanding or total tradable shares. We
obtained annual mutual fund ownership data from 1999 to 2004, and end-of-year
institutional ownership data of 2004 from WIND Information Company. This table
shows that average ownership by mutual funds in is only 1.33% of total shares
outstanding (2.8% of tradable shares). As of the end of 2004, ownership by all
institutional investors, including Mutual Funds, Social Security Funds, and Pension
Funds, is only 3.75% (8.26% of tradable shares). Interestingly, we find that
institutional ownership is highest among low ORECTA firms, suggesting that the
institutions tend to avoid high ORECTA firms. Evidently these investors do take
ORECTA balances into account, but their collective effect on pricing is limited.
Collectively, our findings suggest that the private rents to controlling shareholders
might not be fully incorporated in normal expected returns.
Some prior studies (e.g., Allen et al. (2005)) allege that weakness in the audit
profession is at least partially to blame for China’s corporate governance woes. We
attempt to shed some light on this issue by assessing the large sample relation
between audit qualifications and ORECTA balances. In Panel A of Table IX, we
examine the extent to which ORECTA balances are related to the likelihood of
receiving an audit qualification. In this test, we use a LOGIT model where the
dependent variable, Q, equals 1 if the firm receives a qualified audit opinion and 0
otherwise. LQ (lagged Q) is the corresponding auditor opinion variable in the
previous year. AR is accounts receivable deflated by total assets. ORECTA is as
defined earlier.
The Model 1 results in Panel A show that ORECTA is highly significant, and
positively correlated with the probability of receiving a qualified opinion. In terms
of its ability to predict the likelihood of a qualified opinion, it is more important than
any other variable, including ROA and LEV. Model 2 shows that, even after
including LQ (lagged Q), ORECTA is still highly significant. Evidently auditors are

26
well aware ORECTA balances, and are willing to issue unclean opinions for high
ORECTA firms.27
Figure 4 offers a graphical depiction of this result. This graph shows that 45% of all
firms in the top ORECTA decile receive unclean opinions. The probability of an
unclean opinion declines almost monotonically across ORECTA deciles, such that
only around 5% of the firms in the lower deciles receive unclean opinions. Once
again, the evidence is consistent with auditors playing a monitoring role with respect
to tunneling activities using corporate loans.
As a final test, we examine the effect of a qualified opinion on subsequent tunneling
behavior. Panel B of Table IX reports a regression of ORECTA in year t+1 on
current year ORECTA, and dummy variable Q, as well as other control variables. If
firms curtail their tunneling activities after receiving a qualified opinion, we would
expect the coefficient on Q to be negative. Instead, we find that the Q coefficient is
positive and significant, indicating that firms are more likely to increase their
ORECTA balance after a qualified opinion. This counter-intuitive result could be
due, in part, to the fact that some firms charge an interest balance on the loans. The
interest, which is also typically not repaid, simply increases the outstanding loan
balance.28 In any event, we find no evidence that firms receiving a qualified opinion
in year t will reduce their use of OREC as a vehicle for tunneling in the next period.
III.7 The Long Road to Regulatory Reform
27 To confirm these results, we read a large number of audit reports for top ORECTA decile firms. In
many cases, we found the report explicitly citing the Other Receivable balance as a reason for the audit
qualification. 28 Jian and Wong (2006) report that among their sample of Chinese firms with related party loans, 84%
did not charge any significant interest. For the remaining firms, interest was generally accrued rather
than paid in cash.

27
Thus far our analysis highlights a chronic problem that affected many listed firms in
the Chinese market during the 1996 to 2006 time period. In Appendix 3, we
document the regulatory efforts to curb this abuse. We provide a brief annotated
discussion of these rules and regulations here.
Opening Rounds (Pre-2004)
Efforts to reduce OREC balances began as early as 2001, when the CSRC issued a
(largely ignored) request to listed companies to stop the practice of lending to
controlling shareholders. Coincidentally, 2001 was the first year that the Chinese
stock market showed clear signs of being in a serious decline (a bear market that
would last until 2006). By August 2003, the CSRC had issued explicit instructions
calling for an end to loans by listed companies to controlling shareholders (CSRC
Rule 2003-56). In fact, the same ruling required listed companies to reduce their
OREC balances to their controlling shareholder by 30% per year. This ruling was
also largely ignored, perhaps because the CSRC had no means of enforcing punitive
action against the controlling shareholders, most of whom were not publicly listed.
The Middle Game (2004-2005)
In January 2004, against the backdrop of a bleak 3-year-old bear market, the State
Council issued Directive 2004-3, titled “On the reform and development of capital
markets.” A section of this directive specifically addresses the problem of tunneling,
and states “we must prevent controlling shareholders from embezzling listed company
assets, and punish those who did.” This directive provided the CSRC a much needed
mandate to take action against controlling shareholders.
In July 27, 2004, recognizing the difficulties most controlling shareholders will have
in making repayments, CSRC proposes “Debt for Equity Swaps”, whereby the
controlling shareholder may (subject to approval) repay the amount owed by
28
exchanging the loan for their equity position in the listed company. In June 6, 2005,
CSRC Rule 2005-37 spelled out explicit non-compliance penalties. Perhaps most
importantly, the rule states that in 2006, CSRC will disclose the names of all
controlling shareholders who still owe balances of 100 million or more RMB as of
December 31, 2005, as well as names of the chairperson of the controlling entity.
In November 1, 2005, the State Council issued a Directive on Behalf of CSRC.
Broadly titled “On Improving the Quality of Listed Companies”, this directive
acknowledged that the listed companies are in bad shape, and prescribed a sweeping
list of changes (targeting controlling shareholders). In particular, this directive stated
that the top management of controlling shareholders or colluding firms will be
personally punished, if such payments remain outstanding by the end of 2006.
The End Game (2006)
November 7, 2006, in an unprecedented move, eight government ministries issued a
joint announcement, making it clear that the top management of controlling entities
will be fired from their post and face disciplinary punishment if the December 31,
2006 deadline is not met.29 By December 31, 2006, 399 listed companies managed
to resolve OREC balances totaling 39 billion RMB. Another 17 listed companies,
with OREC balances totally 9.2 billion RMB, failed to resolve their loans. In 10 out
of these 17 companies, top management of the controlling entity or colluding entities,
were arrested – thus bringing to a close an extraordinary chapter in securities market
regulation history.
IV. Summary
This study documents the widespread use of corporate loans by controlling
shareholders to extract funds from Chinese listed companies. Typically reported as 29 These ministries represent a broad spectrum of governmental agencies that, collectively, had the power to ensure the top management of controlling shareholders will be arrested if necessary.

29
"Other Receivables" (OREC), these loans represent a substantial portion of the
reported assets and market capitalization of Chinese firms. We show that these loans
are of a long-term nature, that they are typically made to parties related to the
controlling shareholder, and that they were used extensively to transfer funds out of
hundreds of Chinese firms in the 1996 to 2006 time period. We also find that firms
with large OREC-to-total-asset (ORECTA) balances experience worse future
operating performance and are much more likely to become candidates for delisting.
Market participants seem to only partially anticipate these negative outcomes. While
the market applies a higher discount rate to the earnings of high-ORECTA firms,
high-ORECTA firms still earn negative risk-adjusted returns over the next 12-months.
Institutional investors and mutual funds tend to avoid high ORECTA firms and hold a
disproportionally large percentage of low ORECTA firms. However, institutional
ownership is a relatively small part of the Chinese market landscape, a fact that likely
contributes to the persistence of the mispricing. Collectively, our evidence suggests
that the private rents extracted by controlling shareholders might not be fully
incorporated in normal expected returns.
We show this form of tunneling is most severe when the block shareholder’s
controlling right (C) is significantly larger than her ownership right (O). Specifically,
we find that ORECTA balances are highest in firms where the controlling
shareholder’s cash-flow ownership right (O) is less than 40%. As the controlling
shareholder’s ownership right increases, the incentive to tunnel diminishes and so
does ORECTA. We also find that the severity of the tunneling problem is greater for
smaller, worse performing, non-state-owned firms, particularly if they are located in
regions of the country that are less economically developed.
We also provide some evidence on why various legal and extra-legal governance
mechanisms were inadequate in containing this practice. We show that
high-ORECTA firms are much more likely to receive a qualified audit opinion. In
30
fact, 45% of the firms in the highest ORECTA decile receive a qualified opinion
(compared to less than 5% among low ORECTA firms). However, firms that receive
a qualified opinion in year t show no inclination to reduce their ORECTA balance in
year t+1. These findings show that auditors do play a monitoring role, but absent
effective enforcement (either by regulators or informed investors), unclean audit
opinions alone are insufficient to deter tunneling behavior.
Finally, we document the long and arduous efforts by the CSRC and other regulators
to put an end to this particular form of tunneling. We show that between 2001 and
the end of 2006, numerous rulings, directives and other edicts were issued. These
efforts culminated in an eight ministry joint statement in November 2006 which
threatened personal action against the top management of controlling shareholders
unless all inter-corporate loans from listed companies are repatriated by December 31,
2006. This unprecedented show of political resolve finally forced the repatriation of
most of the remaining OREC balances – which, even as late as 2006, amounted to
close to 50 billion RMB, involving over 400 firms.
Overall, our findings provide a portrait of the nature and severity of the tunneling
problem in China, and the on-going challenges associated with regulatory reform in
this major emerging economy. Our evidence shows that, in certain settings,
disclosure alone is not enough. Specifically, when minority shareholders have no
private litigation channels, and when market regulators have limited jurisdiction over
the controlling entities, even an extremely transparent form of tunneling can persist
for many years. These findings argue for increased legal, rather than extra-legal,
regulatory measures in curbing Chinese insider abuse.
Although the specific form of abuse associated with inter-corporate loan has largely
ceased, the economic incentives that gave rise to this behavior are still intact. Under
China’s recent regulatory reform, controlling shareholders’ holdings have now largely
been converted into tradable status. However, the Chinese government has signaled

31
its intent to retain control of all state-owned listed companies. At the time of this
writing, Chinese laws restrict both the timing and amount of the sale of controlling
blocks, and analysts project the lower bound on the government’s intended
shareholdings to be between 25% and 60% for Chinese firms in most industries.30
Given these developments, in spite of the considerable progress made to date, we
remain cautious about the resolution of the tunneling problem in China. At least in
the foreseeable future, China’s Listed Sector will continue to be dominated by
controlling shareholders whose benefit from firm price appreciation will be limited.
In fact, most controlling shareholders will face an even wider gap between their
controlling rights (C) and cash ownership rights (O) – thus potentially increasing
tunneling incentives.
Until these fundamental agency issues are resolved, we believe the threat of tunneling
will remain a concern for Chinese investors and regulators. At the same time,
academics interesting in understanding managerial and investor behavior in China
would do well to keep the tunneling perspective in mind.
30 In a May 2006 report, Hualin Securities analyst Fupeng Qi, after analyzing a vast number of
regulations, rulings, policy announcements and speeches by government officials, classified listed
companies into five groups, and estimated lower bounds on the government’s intended shareholding in
listed companies for each:
Group 1: Listed companies in industries that are critical to national or economic security, or provide
important public goods or services. For this group, the government minimum holding is 60%.
Group 2: Listed companies in important energy or natural resources industries, or major high-tech
industries. For this group, the minimum government shareholding is 51%.
Group 3: Listed firms in agriculture, and manufacturing, no less than 35%.
Group 4: Listed firms in highly competitive industries, no less than 25%
Group 5: listed firms in retailing and other service industries, no less than 10%.
Of course, these estimates only apply to controlling shareholders that are state-owned. However, we
have no reason to believe non-state-owned block holders will be any more eager to relinquish their
controlling positions.

32
References
Allen, Franklin, Jun Qian, and Meijun Qian. 2005. “Law, Finance, and Economic Growth in China”. Journal of Financial Economics 77, 57-116
Atanasov, Vladimir, 2005. “How much value can blockholders tunnel? Evidence from the Bulgarian mass privatization auctions”. Journal of Financial Economics 76, 191-234.
Bae, Kee-Hong, Jun-Koo Kang and Jin-Mo Kim. 2002. “Tunneling or Value Added? Evidence from Mergers by Korean Business Groups”. Journal of Finance 57, 2695-2740.
Baek, Jae-Seung, Jun-Koo Kang, and Inmoo Lee. 2006. “Business Groups and Tunneling: Evidence from Private Securities Offerings by Korean Chaebols”. Journal of Finance 61, 2415-2449.
Bai, Chong-En, Qiao Liu, Joe Lu, Frank M. Song, and Junxi Zhang, 2004. “Corporate Governance and Market Valuation in China”. Journal of Comparative Economics 32: 599-616.
Berkman, Henk, Robert Cole, and Jiang Hu, 2005. “Agency Conflicts, Expropriation and Firm Value: Evidence from Securities-Market Regulation in China”. Working paper, Massey University Albany.
Berle, Adolf and Gardiner Means, 1932. The Modern Corporation and Private Property, New York: Macmillan.
Bertrand, Marianne, Paras Mehta, and Sendhil Mullainathan, 2002. “Ferreting Out Tunneling: An Application to Indian Business Groups”. Quarterly Journal of Economics 117:1, 121-148.
Chen, Xiao, Chi-Wen Jevons Lee, and Jing Li, 2003. “Chinese Tango: Government Assisted Earnings Management”. Working paper, Tulane University.
Cheung, Yan-Leung, Lihua Jing, Raghavendra Rau, and Aris Stoutaitis. 2006. “Tunneling, Propping, and Expropriation: Evidence from Connected Party Transactions in Hong Kong”. Journal of Financial Economics 82:343-386.
Cheung, Yan-Leung, P. Raghavendra Rau, and Aris Stouraitis. 2008. “The Helping Hand, the Lazy Hand, or the Grabbing Hand? Central vs. Local Government Shareholders in Publicly Listed Firms in China”. Working paper, University of Hong Kong.
Claessens, Stijn, Simeon Djankov, and Larry Lang. 2000, “The separation of ownership and control in East Asian Corporations”. Journal of Financial Economics 58, 81-112.
Claessens, Stijn, Simeon Djankov, Joseph Fan, and Larry Lang. 2002. “Disentangling the Incentive and Entrenchment Effects of Large Shareholders”. Journal of

33
Finance 57, 2741-2771.
Djankov, Simeon, Rafael La Porta, Florencio Lopez-de-Silanes, and Andrei Shleifer. 2008. “The law and economics of self-dealing”. Journal of Financial Economics 88, 430-465.
Dyck, Alexander, and Luigi Zingales, 2004. “Private Benefits of Control: An International Comparison”. Journal of Finance 59, 537-600.
Eun, Cheol S., and Wei Huang, 2007. “Asset Pricing in China’s domestic stock markets: Is there a logic?”. Pacific-Basin Finance Journal 15, 452-480.
Faccio, Mara, and Larry Lang. 2002. “The ultimate ownership of Western European corporations”. Journal of Financial Economics 65, 365-395.
Faccio, Mara, Larry Lang, and Leslie Young. 2001. “Dividends and Expropriation”. American Economic Review, Vol. 91, 54-78.
Fama, E. F., and K. R. French, 1993, Common risk factors in the returns of stocks and bonds, Journal of Financial Economics 33, 3-56.
Fama, E. F. and J. MacBeth. (1973). ‘‘Risk, Return, and Equilibrium: Empirical Tests.’’ Journal of Political Economy 81, 607–636.
Fan, Joseph P.H., T.J. Wong, and Tianyu Zhang. 2005. “The Emergence of Corporate Pyramids in China”, working paper, Chinese University of Hong Kong.
Fan, Joseph P.H., T.J. Wong, and Tianyu Zhang, 2007, “Politically Connected CEOs, Corporate Governance, and Post-IPO Performance of China’s Newly Partially Privatized Firms”. Journal of Financial Economics 84, 330-357.
Fan, G., Wang, X., 2006. “The Report on the Relative Process of Marketization of Regions in China”. The Economic Science Press (in Chinese).
Grossman, S., and O. Hart, 1988, "One Share-One Vote and the Market for Corporate Control," Journal of Financial Economics, 20, 175-202.
Hart, O. 1995. Firms, Contracts, and Financial Structure. Oxford University Press, Oxford, U.K.
Jensen, M., and W. Meckling, 1976. “Theory of the firm: Managerial behavior, agency costs, and ownership structure”. Journal of Financial Economics 3, 305-360.
Jian, Ming, and T.J. Wong. 2006. “Propping and Tunneling through Related Party Transactions”. Review of Accounting Studies, forthcoming.
Johnson, S., Boone, P., Breach, A., and E. Friedman, 2000a, “Corporate governance in the Asian financial Crisis”, Journal of Financial Economic 58, 141-186.
Johnson, S., R. La Porta, A. Shleifer and F. Lopez-de-Silanes. 2000b. “Tunneling”, American Economic Review Papers and Proceedings 90, 22-27.

34
La Porta, R., F. Lopez-De-Silanes, and A. Shleifer. 1999. “Corporate ownership around the world”, Journal of Finance 54, 471-517.
La Porta, R., F. Lopez-De-Silanes, and A. Shleifer. 2000. “Investor protection and corporate governance”, Journal of Financial Economics 59, 3-27.
La Porta, R., F. Lopez-De-Silanes, and A. Shleifer. 2006. “What works in securities laws?” Journal of Finance 61, 1-32.
La Porta, R., F. Lopez-De-Silanes, A. Shleifer, and R. Vishny. 1998. “Law and Finance”, Journal of Political Economy 106, 1113-1155.
La Porta, R., F. Lopez-de-Silanes and G. Zamarripa. 2003. “Related Lending”, Quarterly Journal of Economics 118: 231-268
Lemmon, Michael and Karl V. Lins. 2003. “Ownership Structure, Corporate Governance, and Firm Value: Evidence from the East Asian Financial Crisis”. Journal of Finance 58, 1445-1468.
Liu, Qiao. 2005. “Corporate Governance in China: Current Practices, Economics Effects, and Institutional Determinants”. Working paper, the University of Hong Kong.
Liu, Qiao, and Joe Lu. 2007. “Corporate Governance and Earnings Management in the Chinese Listed Companies: A Tunneling Perspective”, Journal of Corporate Finance 13, 881-906.
MacNeil, I., 2002. “Adaptation and convergence in corporate governance: The case of Chinese listed companies”. Journal of Corporate Law Studies 2, issue 2.
Nenova, Tatiana, 2003, “The value of corporate voting rights and control: A cross-country analysis”. Journal of Financial Economics 68, 325-351.
Peng, Winnie, K.C. John Wei, and Zhishu Yang, 2006, “Tunneling or propping: evidence from connected transactions in China”. Working paper, Hong Kong University of Science and Technology.
Shleifer, Andrei, and Robert Vishny. 1997. “A Survey of Corporate Governance”, Journal of Finance 52, 737-783.
Van Peursem, Karen, Maiqing Zhou, Tracey Flood, and James Buttimore. 2007. “Three cases of corporate fraud: an audit perspective”. Working paper, University of Waikato, New Zealand.
Ye, Kangtao. 2006. “Related Party Transactions, Value Relevance of Accounting Information, and Agency Costs,” Ph.D. dissertation, Peking University.
Zingales, Luigi. 1994. “The Value of the Voting Right: A Study of the Milan Stock Exchange Experience”. Review of Financial Studies 7, 125-148.

35
Appendix 1: FENG HUA: A Case Study in Large Shareholder Tunneling The HANQI Group is the largest shareholder of FENG HUA (stock code: 600615), holding a bit less than 30% of its shares. From early 2002, the HANQI Group (including its subsidiaries HANQI Real Estate, and Beijing HANQI) “borrowed” large amounts of money from FENG HUA. The following table contains excerpts from FENG HUA's financial statements. To gain a sense for the magnitude of these borrowing, on December 31, 2002, HANQI’s share of equity in FENG HUA is RMB 116.21 millions. On that date, it and its subsidiaries borrowed from FENG HUA a total of 198.6 millions. In terms of financial reporting, the money that large shareholders owe the listed company is included in a data item called “Other Receivables” (OREC), which in this instance also included several other large items not directly traceable to HANQI. 52.2 millions RMB were written off on December 31, 2004 because Beijing HANQI no longer existed (bankrupt). FENG HUA was subsequently “specially treated (ST)”. All table values are in millions RMB, except percentages. All data is available on SINA finance website.
Reporting Date
Gross OREC Total Assets
Gross OREC/
Total Assets
Gross OREC from
HANQI Group
Gross OREC from
Beijing HANQI
Gross OREC from
HANQI Real Estate
Total Gross OREC from
HANQI
HANQI’s % in Gross
OREC
Item (1) (2) (1)/(2) (4) (5) (6) (7)=(4)+(5)+
(6) (7)/(3) 2004-12-31 304.4 693.2 44% 122.2 0 31.7 153.9 51% 2004-06-30 308.0 781.2 39% 122.2 52.2 30.0 204.4 66% 2003-12-31 328.4 804.5 41% 122.2 52.2 30.0 204.4 62% 2003-06-30 362.8 940.4 39% 116.5 52.2 30.0 198.6 55% 2002-12-31 342.9 947.6 36% 116.4 52.2 30.0 198.6 58% 2002-06-30 306.2 1078.5 28% 122.0 52.2 30.0 204.2 67% 2001-12-31 189.6 1084.2 17% 52.2 30.0 82.2 43% 2001-06-30 66.0 1193.9 6%

36
Appendix 2: The Proportion of Large Shareholder Receivables (LSH Gross OREC) within each ORECTA Decile
This table reports the gross amount of large shareholder receivable as a proportion of total other receivables (OREC) for firms sorted by ORECTA decile. To construct this table, we first sort our full sample of firm-years annually into deciles by ORECTA. We then report aggregate statistics for the Ye (2006) firm-year observations within each ORECTA decile. Ye (2006) hand collected the amount of other receivables due from the controlling shareholder and its affiliates (LSH Gross OREC) for all manufacturing firms listed on the Shanghai Stock Exchange between 1999 and 2002. This table reports the number of Ye observations in each decile, the average ORECTA value, the average LSH Gross OREC value, and LSH Gross OREC expressed as a percentage of total gross OREC.
Full Sample Ye (2006) Sample
ORECTA
Number of Ye
(2006) firm-years in full sample
deciles ORECTATotal Gross
OREC
LSH Gross OREC
(LSH gross /Total
gross) Low 0.56% 139 0.40% 8.38 1.04 6.60%
2 1.62% 156 1.20% 24.40 6.05 14.30%
3 2.74% 115 2.10% 47.15 13.63 16.70%
4 4.01% 112 3.10% 74.66 11.78 15.10%
5 5.37% 103 4.20% 111.16 27.44 19.00%
6 6.99% 95 5.90% 107.58 21.45 22.00%
7 9.13% 104 7.80% 138.67 43.26 24.30%
8 12.10% 105 10.90% 186.06 50.54 30.70%
9 17.22% 109 16.40% 263.91 90.54 30.90%
High 31.97% 96 32.50% 481.44 252.12 42.20%

37
Appendix 3: The Long Road to Regulatory Reform Rules and regulations specifically related to tunneling through inter-corporate loans Early 2001 – CSRC Requirement In early 2001, the China Securities Regulatory Commission (CSRC) issued a general requirement that all listed companies collect their “loans” (OREC) to controlling shareholders, but this requirement was widely ignored. August 28, 2003 – CSRC Rule 2003-56 This rule prohibits listed firms from issuing new loans to (and loan guarantees on behalf of) the controlling shareholder and sets out specific targets and guidelines for reducing existing OREC balances. Specifically, it requires listed companies to reduce the money controlling shareholders obtained from them, by 30% every year (starting 2003).
January 2004 – State Council Directive 2004-3 The State Council issued a board directive, a section of which specifically addresses the problem of tunneling, and states “we must prevent controlling shareholders from embezzling listed company assets, and punish those who did.” July 27, 2004 – CSRC Proposes “Debt for Equity Swaps” Recognizing that many controlling shareholders simply did not have enough cash to repay the OREC they owed, the CSRC proposed repayments by a debt for equity swap. June 6, 2005 – CSRC Rule 2005-37 This rule outlines specific steps for regulators to follow in the case of non-compliance. Importantly, the rule states that in 2006, CSRC will disclose the names of all controlling shareholders still owing 100 million or more RMB as of December 31, 2005. November 1, 2005 – State Council Directive on Behalf of CSRC Written by the CSRC, but issued by the State Council, this rule prescribed sweeping changes to corporate governance and disclosure rules (targeting controlling shareholders). In particular, it set December 31, 2006 as a date by which all OREC from controlling entities and affiliates must be repaid. November 7, 2006 – Eight Ministry Joint Announcement Eight government ministries issued a joint announcement, making it clear that the top management of controlling entities will face disciplinary punishment if the deadline for repayment is not met. Collectively, these agencies had the power to ensure top management of controlling shareholders will be arrested if necessary. By the December 31, 2006 deadline, 399 listed companies managed to resolve OREC balances totaling 39 billion RMB. Another 17 companies, with OREC balances totally 9.2 billion RMB, failed to resolve their loans. In 10 out of these 17 companies, top management of the controlling/colluding entities, were arrested.

38
Table I Descriptive Statistics
This table presents firm characteristics for our sample of 7,557 firm-year observations from 1996 to 2004. Our sample includes firms that are listed in China’s stock market for at least one year and have necessary financial information. Chinese firms all have December year-ends and financial information for year t is based on fiscal year-end t-1 financial reports. SIZE is the log of total assets; MV is market capitalization of the stock at the end of the fourth month after the fiscal year end (in million RENMINBI); TMV is market value of tradable market shares; BM is book-to-market ratio; LEV is leverage, defined as total liabilities divided by total assets; ROA is return on assets; BLOCK is the percentage of shares controlled by the largest shareholder; OREC is other receivables (in million RENMINBI); ORECMV is other receivables deflated by market value of equity; ORECTMV is other receivables deflated by market value of tradable shares; ORECTA is other receivable deflated by total assets; We have winsorized all variables at 1% and 99%.
Variable N Mean Median Std Dev Q1 Q3
Panel A: Firm Characteristics
SIZE 7557 20.966 20.901 0.883 20.363 21.528 MV 7557 3150 2191 3324 1352 3589
TMV 7557 1091 765 1227 465 1302 BM 7557 0.331 0.276 0.223 0.180 0.421 LEV 7557 0.455 0.455 0.177 0.329 0.581 ROA 7557 0.028 0.034 0.063 0.010 0.058
BLOCK 7538 0.437 0.426 0.173 0.292 0.582 OREC 7557 123 56 362 21 131
ORECMV 7557 0.054 0.026 0.087 0.009 0.061 ORECTMV 7557 0.159 0.072 0.268 0.026 0.175 ORECTA 7557 0.081 0.048 0.093 0.017 0.108
Panel B: ORECTA by year 1996 287 0.102 0.086 0.079 0.131 0.045 1997 502 0.117 0.093 0.097 0.160 0.046 1998 702 0.111 0.085 0.093 0.157 0.040 1999 804 0.109 0.075 0.108 0.139 0.035 2000 894 0.098 0.059 0.109 0.125 0.025 2001 1007 0.071 0.039 0.087 0.091 0.016 2002 1055 0.065 0.035 0.082 0.081 0.012 2003 1127 0.056 0.029 0.074 0.069 0.010 2004 1179 0.057 0.024 0.082 0.067 0.008
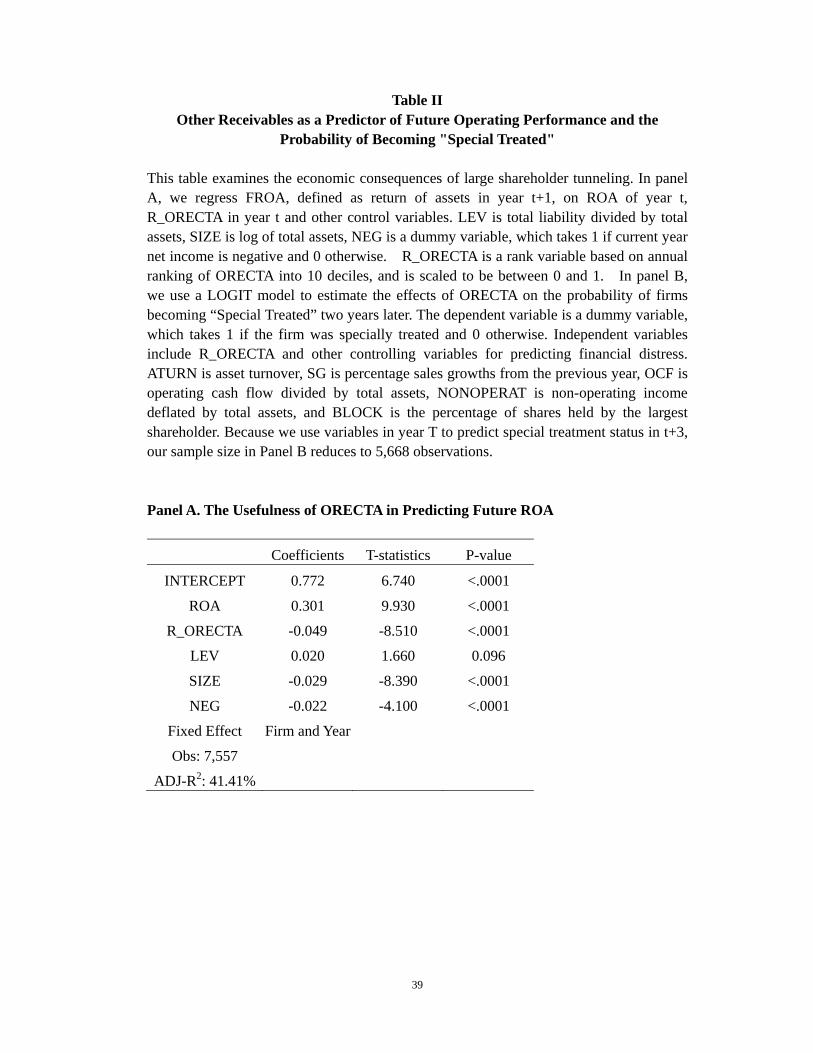
39
Table II Other Receivables as a Predictor of Future Operating Performance and the
Probability of Becoming "Special Treated"
This table examines the economic consequences of large shareholder tunneling. In panel A, we regress FROA, defined as return of assets in year t+1, on ROA of year t, R_ORECTA in year t and other control variables. LEV is total liability divided by total assets, SIZE is log of total assets, NEG is a dummy variable, which takes 1 if current year net income is negative and 0 otherwise. R_ORECTA is a rank variable based on annual ranking of ORECTA into 10 deciles, and is scaled to be between 0 and 1. In panel B, we use a LOGIT model to estimate the effects of ORECTA on the probability of firms becoming “Special Treated” two years later. The dependent variable is a dummy variable, which takes 1 if the firm was specially treated and 0 otherwise. Independent variables include R_ORECTA and other controlling variables for predicting financial distress. ATURN is asset turnover, SG is percentage sales growths from the previous year, OCF is operating cash flow divided by total assets, NONOPERAT is non-operating income deflated by total assets, and BLOCK is the percentage of shares held by the largest shareholder. Because we use variables in year T to predict special treatment status in t+3, our sample size in Panel B reduces to 5,668 observations. Panel A. The Usefulness of ORECTA in Predicting Future ROA
Coefficients T-statistics P-value
INTERCEPT 0.772 6.740 <.0001
ROA 0.301 9.930 <.0001
R_ORECTA -0.049 -8.510 <.0001
LEV 0.020 1.660 0.096
SIZE -0.029 -8.390 <.0001
NEG -0.022 -4.100 <.0001
Fixed Effect Firm and Year
Obs: 7,557
ADJ-R2: 41.41%

40
(Table II Continued)
Panel B: LOGIT model, where the dependent variable is the probability of a firm being in Special Treatment status in Year T+3
Coefficient Chi-Sq P-value Coefficient Chi-Sq P-value
INTERCEPT 2.403 0.004 0.948 0.132 0.000 0.997
R_ORECTA 1.428 26.705 <.0001
ROA -28.787 72.547 <.0001 -26.101 58.431 <.0001
ATURN -1.120 17.798 <.0001 -0.981 13.795 0.000
LEV 1.425 10.337 0.001 1.121 6.173 0.013
SG -0.227 2.712 0.100 -0.213 2.475 0.116
OCF -2.582 7.778 0.005 -1.988 4.500 0.034
NONOPERAT -2.560 0.161 0.688 -3.398 0.292 0.589
SIZE -0.234 7.156 0.008 -0.167 3.520 0.061
BLOCK -1.146 7.769 0.005 -0.838 4.006 0.045
Fixed Effects Industry and Year
Industry and Year
Observations: 5,668
PSEUDO-R2: 4.88% 5.36%

41
Table III The Relation between Other Receivables and Firm Valuation
This table examines whether market prices take into consideration the negative impact of a large ORECTA balance on future operating performance. The dependent variable is MVTA, defined as market value of the firm at the end of fourth month after fiscal year end, deflated by total assets. The independent variables are: BVTA, defined as book value deflated by total assets; ROA, defined as the return on total assets; NEG, a dummy variable that equals 1 if current year net income is negative and 0 otherwise; LEV, total liability divided by total assets; SG, percentage sales growth from the previous year; SIZE, log of total assets; BLOCK, the percentage of shares held by the largest shareholder; R_ORECTA, the scaled decile rank of ORECTA (i.e., R_ORECTA=1 for firms in the highest ORECTA decile, and =0 for firms in the lowest decile); and ROA_ORECTA, an interaction term computed by multiplying ROA by R_ORECTA. ***, **, and * signify statistical significance at the 1, 5, and 10% levels, respectively. All regressions include firm and year fixed effects.
Dependent Variable: MVTA
Model 1 Model 2 Model 3
INTERCEPT 19.924*** 20.470*** 19.808***
R_ORECTA -0.010 0.357***
ROA_ORECTA -9.835*** -11.865***
BVTA 0.728* 0.567 0.659*
ROA 9.301*** 13.804*** 15.155***
NEG 1.060*** 0.843*** 0.810***
LEV -0.541 -0.569 -0.545
SG 0.002 0.002 0.002
SIZE -0.886*** -0.905*** -0.885***
BLOCK 0.201* 0.092 0.159*
Fixed Effects Firm and
Year
Firm and
Year
Firm and
Year
No. of Observations 7,557 7,557 7,557
Adjusted R2 50.51% 51.56% 51.77%

42
Table IV The Usefulness of Other Receivables in Returns Prediction
This table examines the usefulness of ORECTA in predicting future returns. Panel A presents
future monthly returns (in percentage) for deciles formed on ORECTA. In each year between
1996 and 2004, we sort firms into ten deciles based on ORECTA for year t. EW-ADJ represents
the average monthly equal-weighted returns for each portfolio, computed from May 1 (year t+1)
through April 30 (year t+2), FF-ADJ represents the intercept term from regressing the monthly
returns of each portfolio on three factor-mimicking portfolios (MKT, SMB, HML) constructed
from all Chinese stocks using the Fama-French (1993) methodology. Panel B presents
Fama-McBeth cross-sectional regressions of monthly returns on R_ORECTA, R_MV (Market
Value), R_BM (Book-to-Market), R_STDRET (standard deviation of daily returns during the
month prior to portfolio formation) and R_LEV (total liability divided by total assets). The four
independent variables are decile ranks based on annual ranking of ORECTA, MV, BM and LEV,
and monthly ranking of STDRET respectively, scaled to be between 0 (lowest decile) and 1
(highest decile). In total there are 108 months. Panel B reports the mean of these monthly
coefficients and the t-statistics associated with their time-series variation.
Panel A. Returns of Portfolios Based on ORECTA
Group Observations EW-ADJ FF-ADJ
1 8978 0.395 0.177
2 9039 0.343 0.206
3 9065 0.146 0.037
4 9051 0.170 0.124
5 9016 -0.074 -0.152
6 9042 0.189 0.184
7 9061 -0.096 -0.189
8 9001 0.008 0.004
9 9023 -0.321 -0.370
10 8825 -0.619 -0.633
Hedge (1-10) 1.014 0.810
T =7.36 T=5.75
Panel B. Cross-sectional Regression of Monthly Returns on R_ORECTA and Other
Control Variables
Coefficient T-statistics P-value
INTERCEPT 1.660 2.233 0.028
R_ORECTA -0.722 -3.314 -0.001
R_MV -1.621 -2.957 -0.004
R_BM 0.444 1.066 0.289
R_STDRET -1.407 -3.129 -0.002
R_LEV 0.315 1.800 0.075

43
Table V Year-by-year Hedge Returns Adjusted for Different Measures of Risk
This table presents average monthly abnormal returns for a trading strategy that buys an equal-weighted portfolio of firms in the lowest decile of ORECTA and sells an equal-weighted portfolio of firms in the highest decile of ORECTA. Portfolio holdings are rebalanced annually and returns are computed from May 1 (year T+1) through April 30 (year T+2). We present year-by-year results as well as aggregated results for two sub-periods (the bull market of 1996-99, and the bear market of 2000-04). In computing abnormal returns, we use four different characteristic-based matching samples to adjust for alternative measures of risk. ARET1 is the hedge return where each firm’s abnormal return is computed relative to a reference decile portfolio matched on the basis of its market value of tradable shares (MktCap); ARET2 is abnormal returns relative to portfolios formed on deciles of firm beta (Beta-Match); ARET3 is relative to an equal-weighted market index (EW-index); ARET4 is relative to a value-weighted market index for tradable shares of both the Shanghai and Shenzhen markets (VW-index). ARET5 is the annual average of the monthly coefficients on R_ORECTA derived from monthly Fama-MacBeth regressions with control variables as describe in Table IV Panel B (FM-Adj). Reported t-statistics are based on the time-series variation in annual abnormal returns.
ARET1
(MktCap)ARET2 (Beta)
ARET3 (EW)
ARET4(VW)
ARET5 (FM)
1996 0.406 -0.171 -0.049 -0.049 0.271 1997 0.011 -0.271 -0.237 -0.237 0.406 1998 0.633 0.444 0.546 0.546 0.004 1999 0.091 -0.206 -0.234 -0.236 0.085 2000 0.873 0.615 0.624 0.629 0.535 2001 1.044 1.341 1.516 1.505 0.829 2002 1.226 1.419 1.833 1.924 1.217 2003 2.505 2.444 2.528 2.520 1.886
2004 0.065 0.514 0.654 0.608 1.263
Average 0.685 0.613 0.718 0.721 0.722
T-test 2.454 1.909 2.091 2.076 3.246
96-99 Bull Market 0.285 -0.051 0.006 0.006 0.191
00-04 Bear Market 1.143 1.267 1.431 1.437 1.146
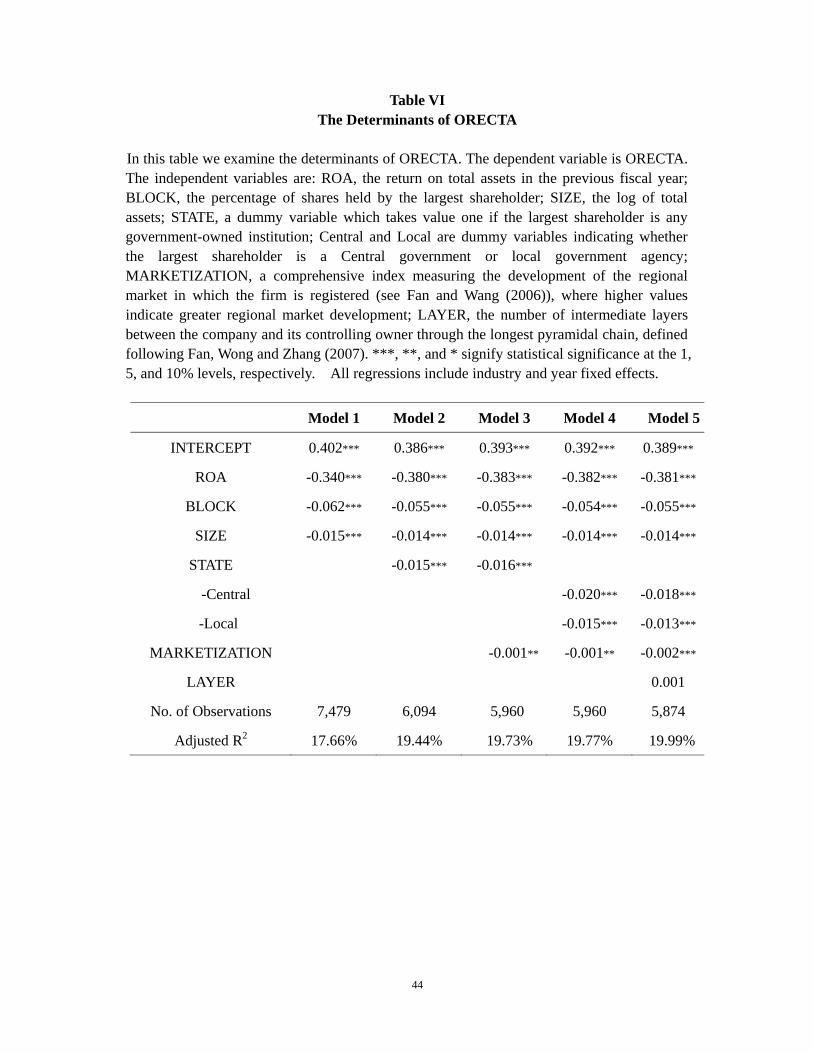
44
Table VI The Determinants of ORECTA
In this table we examine the determinants of ORECTA. The dependent variable is ORECTA. The independent variables are: ROA, the return on total assets in the previous fiscal year; BLOCK, the percentage of shares held by the largest shareholder; SIZE, the log of total assets; STATE, a dummy variable which takes value one if the largest shareholder is any government-owned institution; Central and Local are dummy variables indicating whether the largest shareholder is a Central government or local government agency; MARKETIZATION, a comprehensive index measuring the development of the regional market in which the firm is registered (see Fan and Wang (2006)), where higher values indicate greater regional market development; LAYER, the number of intermediate layers between the company and its controlling owner through the longest pyramidal chain, defined following Fan, Wong and Zhang (2007). ***, **, and * signify statistical significance at the 1, 5, and 10% levels, respectively. All regressions include industry and year fixed effects.
Model 1 Model 2 Model 3 Model 4 Model 5
INTERCEPT 0.402*** 0.386*** 0.393*** 0.392*** 0.389***
ROA -0.340*** -0.380*** -0.383*** -0.382*** -0.381***
BLOCK -0.062*** -0.055*** -0.055*** -0.054*** -0.055***
SIZE -0.015*** -0.014*** -0.014*** -0.014*** -0.014***
STATE -0.015*** -0.016***
-Central -0.020*** -0.018***
-Local -0.015*** -0.013***
MARKETIZATION -0.001** -0.001** -0.002***
LAYER 0.001
No. of Observations 7,479 6,094 5,960 5,960 5,874
Adjusted R2 17.66% 19.44% 19.73% 19.77% 19.99%

45
Table VII Annual Industry-adjusted ROA Surrounding Large Increases in ORECTA
This table presents annual industry-adjusted ROA in the years immediately adjacent to a large increase in ORECTA. We define a large ORECTA increase in two ways. For panel A, we sort firms each year into ten deciles based on ORECTA (Decile 1 are low ORECTA firms and Decile 10 are high ORECTA firms). We then focus on the subset of companies whose ORECTA decile rank increases by 5 or more in year t. For panel B, we examine firms that had ORECTA less than 0.15 in year t-1, but reported an increase of at least 0.15 in year t. Table values represent the annual industry adjusted ROA for these large ORECTA increase firms in year t-2 to t+2. Industries are defined according to the 2-digit code assigned by China Securities Regulatory Commission (CSRC). For each year, we test the statistical significance of the deviation from industry mean ROA, and the statistical significance of the change from the previous year. ***, **, and * signify statistical significance at the 1, 5, and 10% levels, respectively. Panel A: Firms whose ORECTA decile rank increased by 5 or more in year t
Year Obs Mean T-stat on deviation
from industry mean T-stat on change from previous year
-2 91 -0.001 0.12
-1 121 -0.001 0.23 0.02
0 123 -0.018 2.89*** 2.19**
1 101 -0.013 2.30** 0.52
2 83 -0.023 3.01*** 1.03
Panel B: Firms whose ORECTA are less 0.15 in year t-1 and whose change in ORECTA is 0.15 or greater in year t
Year Obs Mean T-stat on deviation
from industry mean T-stat on change from previous year
-2 70 -0.012 1.38
-1 87 -0.014 2.25** 0.15
0 88 -0.066 5.70*** 3.98***
1 69 -0.039 4.58*** 1.90*
2 53 -0.047 3.92*** 0.57
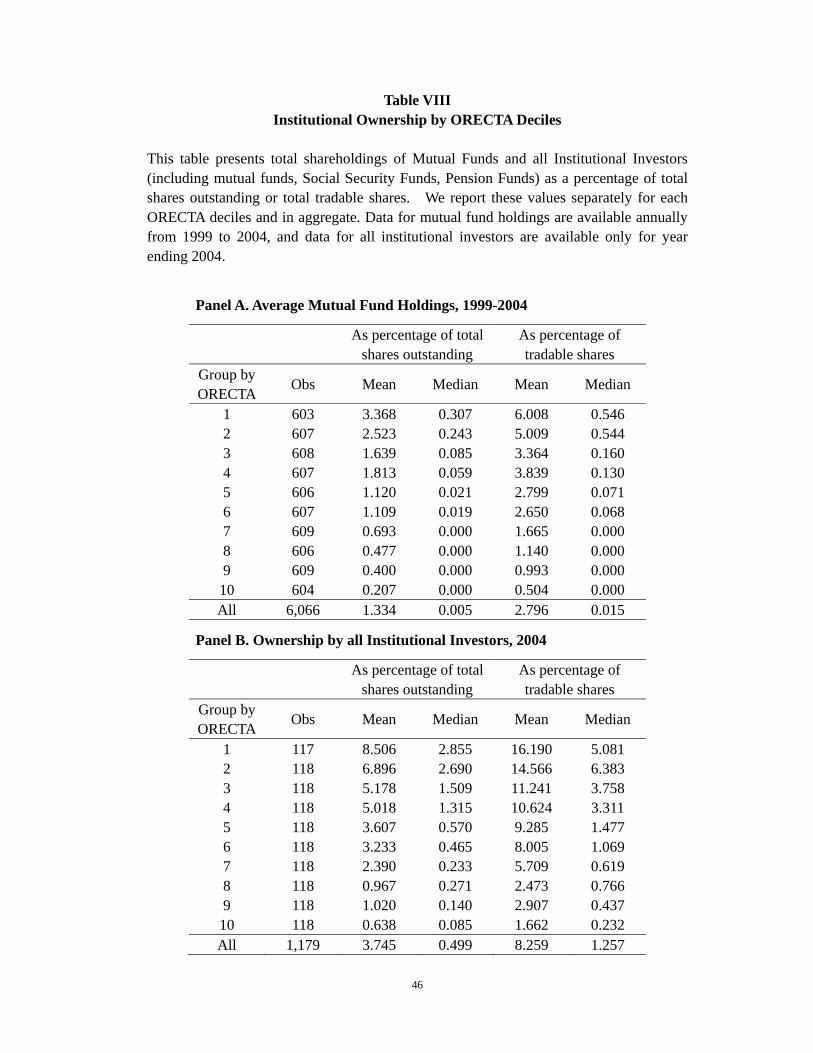
46
Table VIII Institutional Ownership by ORECTA Deciles
This table presents total shareholdings of Mutual Funds and all Institutional Investors (including mutual funds, Social Security Funds, Pension Funds) as a percentage of total shares outstanding or total tradable shares. We report these values separately for each ORECTA deciles and in aggregate. Data for mutual fund holdings are available annually from 1999 to 2004, and data for all institutional investors are available only for year ending 2004.
Panel A. Average Mutual Fund Holdings, 1999-2004
As percentage of total
shares outstanding As percentage of tradable shares
Group by ORECTA
Obs Mean Median Mean Median
1 603 3.368 0.307 6.008 0.546 2 607 2.523 0.243 5.009 0.544 3 608 1.639 0.085 3.364 0.160 4 607 1.813 0.059 3.839 0.130 5 606 1.120 0.021 2.799 0.071 6 607 1.109 0.019 2.650 0.068 7 609 0.693 0.000 1.665 0.000 8 606 0.477 0.000 1.140 0.000 9 609 0.400 0.000 0.993 0.000 10 604 0.207 0.000 0.504 0.000 All 6,066 1.334 0.005 2.796 0.015
Panel B. Ownership by all Institutional Investors, 2004
As percentage of total
shares outstanding As percentage of tradable shares
Group by ORECTA
Obs Mean Median Mean Median
1 117 8.506 2.855 16.190 5.081 2 118 6.896 2.690 14.566 6.383 3 118 5.178 1.509 11.241 3.758 4 118 5.018 1.315 10.624 3.311 5 118 3.607 0.570 9.285 1.477 6 118 3.233 0.465 8.005 1.069 7 118 2.390 0.233 5.709 0.619 8 118 0.967 0.271 2.473 0.766 9 118 1.020 0.140 2.907 0.437 10 118 0.638 0.085 1.662 0.232 All 1,179 3.745 0.499 8.259 1.257
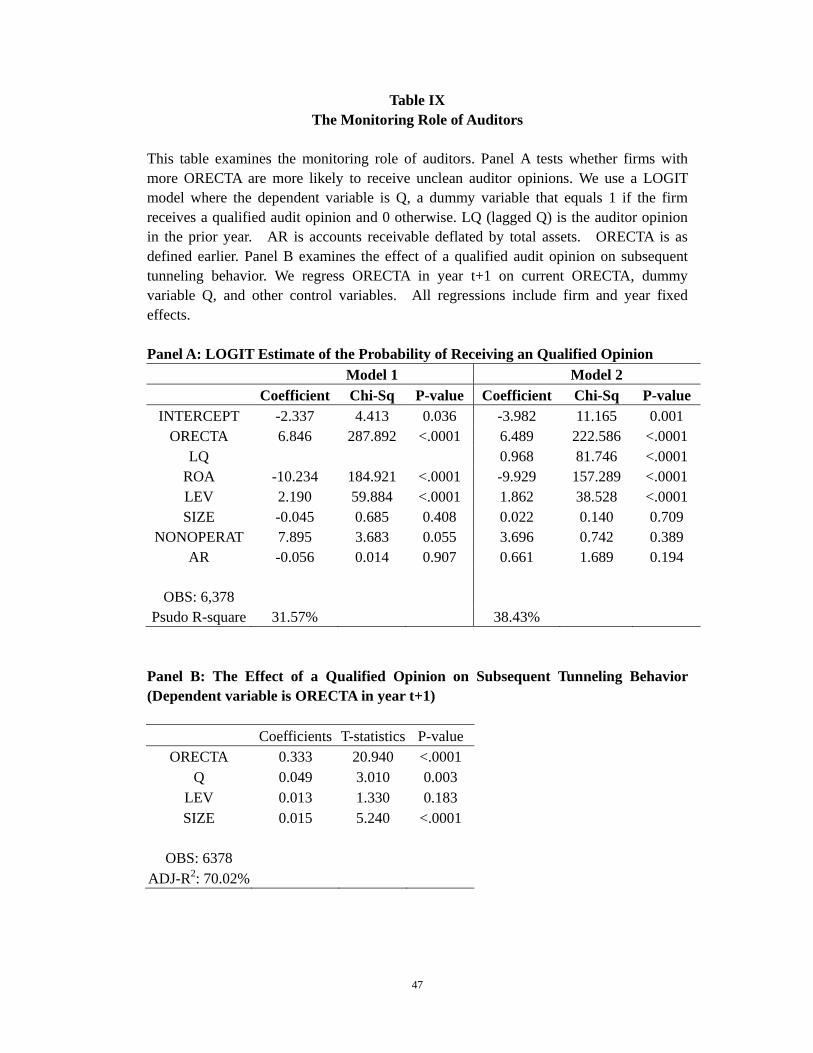
47
Table IX The Monitoring Role of Auditors
This table examines the monitoring role of auditors. Panel A tests whether firms with more ORECTA are more likely to receive unclean auditor opinions. We use a LOGIT model where the dependent variable is Q, a dummy variable that equals 1 if the firm receives a qualified audit opinion and 0 otherwise. LQ (lagged Q) is the auditor opinion in the prior year. AR is accounts receivable deflated by total assets. ORECTA is as defined earlier. Panel B examines the effect of a qualified audit opinion on subsequent tunneling behavior. We regress ORECTA in year t+1 on current ORECTA, dummy variable Q, and other control variables. All regressions include firm and year fixed effects. Panel A: LOGIT Estimate of the Probability of Receiving an Qualified Opinion
Model 1 Model 2 Coefficient Chi-Sq P-value Coefficient Chi-Sq P-value
INTERCEPT -2.337 4.413 0.036 -3.982 11.165 0.001 ORECTA 6.846 287.892 <.0001 6.489 222.586 <.0001
LQ 0.968 81.746 <.0001 ROA -10.234 184.921 <.0001 -9.929 157.289 <.0001 LEV 2.190 59.884 <.0001 1.862 38.528 <.0001 SIZE -0.045 0.685 0.408 0.022 0.140 0.709
NONOPERAT 7.895 3.683 0.055 3.696 0.742 0.389 AR -0.056 0.014 0.907 0.661 1.689 0.194
OBS: 6,378
Psudo R-square 31.57% 38.43% Panel B: The Effect of a Qualified Opinion on Subsequent Tunneling Behavior (Dependent variable is ORECTA in year t+1)
Coefficients T-statistics P-value ORECTA 0.333 20.940 <.0001
Q 0.049 3.010 0.003 LEV 0.013 1.330 0.183 SIZE 0.015 5.240 <.0001
OBS: 6378
ADJ-R2: 70.02%
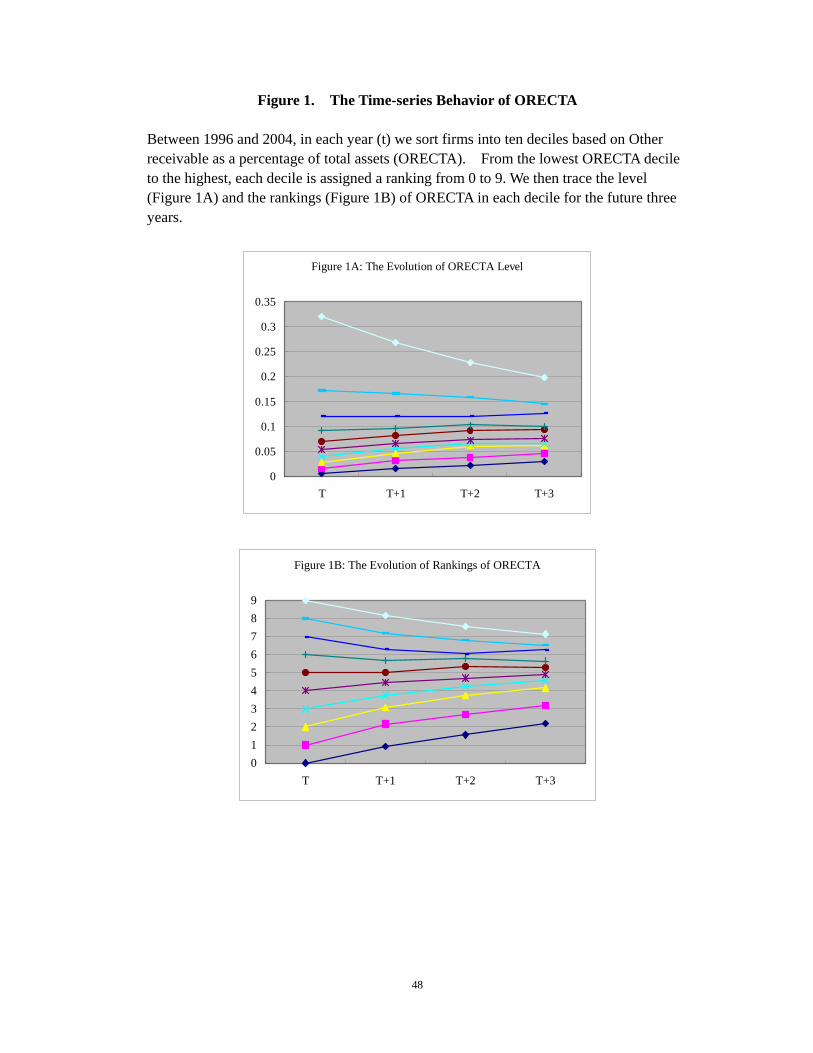
48
Figure 1. The Time-series Behavior of ORECTA
Between 1996 and 2004, in each year (t) we sort firms into ten deciles based on Other receivable as a percentage of total assets (ORECTA). From the lowest ORECTA decile to the highest, each decile is assigned a ranking from 0 to 9. We then trace the level (Figure 1A) and the rankings (Figure 1B) of ORECTA in each decile for the future three years.
Figure 1A: The Evolution of ORECTA Level
0
0.05
0.1
0.15
0.2
0.25
0.3
0.35
T T+1 T+2 T+3
Figure 1B: The Evolution of Rankings of ORECTA
0
1
2
3
4
5
6
7
8
9
T T+1 T+2 T+3

49
Figure 2. The Proportion of Firms in each ORECTA Decile that attains ST (Special Treatment) status in two years
Chinese listed firms that have had two consecutive annual losses (or whose book value becomes negative) receive “Special treatment" or "ST” status. ST stocks are under various trading and financial restrictions, and if an ST stock reports one more loss year, it will be delisted. Because Chinese firms rarely go bankrupt, ST can be regarded as an equivalent financial distress metric. Between 1996 and 2004, we sort firms annually into ten deciles based on the magnitude of their reported ORECTA (other receivables as a percentage of total assets). This figure depicts the proportion of firms in each decile that received ST status two years after the formation of the deciles. That is, we form the portfolios in year t, and observe whether this firm is specially treated in year t+3.
% of ST firms in Ten ORECTA Deciles
0.00
0.02
0.04
0.06
0.08
0.10
0.12
0.14
0.16
1 2 3 4 5 6 7 8 9 10

50
Figure 3. The Relation between BLOCK and ORECTA This graph examines the relation between ownership structure and the extent of tunneling using
ORECTA. Prior literature suggests that the incentives for tunneling will be most acute when a
blockholder’s cashflow ownership (C) is much lower than her controlling ownership (O). To test this
hypothesis, we sort firms annually into 10 deciles based on BLOCK, the percentage of common shares
held by the biggest shareholder (a proxy for C). We then compute the median ORECTA in each decile
(the line graph), as well as the average BLOCK value (the bar graph). The X-axis is decile rankings
based on BLOCK. Numerical values for BLOCK are reported in the left side of the graph; numerical
values for ORECTA are reported on the right.
The Relation between BLOCK and ORECTA
0.0
0.1
0.2
0.3
0.4
0.5
0.6
0.7
0.8
1 2 3 4 5 6 7 8 9 10
0.00
0.01
0.02
0.03
0.04
0.05
0.06
0.07
0.08
0.09
BLOCK ORECTA

51
Figure 4: The Relation between ORECTA and the Probability of Firms Receiving an Unclean Auditor Opinion Each year, firms are sorted into ten deciles based on ORECTA. We then calculate the percentage of firms within each group that received a qualified opinion in the accompanying audit report.
The Probability of Firms Receiving an Unclean Auditor Opinionfor ORECTA Deciles
0.000.050.100.150.200.250.300.350.400.450.50
1 2 3 4 5 6 7 8 9 10