tuning the fermi level through the dirac point of giant ... the fermi level through the dirac point...
TRANSCRIPT

Tuning the Fermi level through the Dirac point of
giant Rashba semiconductor BiTeI with pressure
D. VanGennep1, S. Maiti1,2, D. Graf2, S. W. Tozer2, C. Martin1,3,
H. Berger4, D. L. Maslov1, J. J. Hamlin1
1Department of Physics, University of Florida, Gainesville, FL 326112National High Magnetic Field Laboratory, Tallahassee, FL 323103School of Theoretical and Applied Science, Ramapo College of New Jersey, Mahwah, NJ
074304Institute of Condensed Matter Physics, Ecole Polytechnique Federale de Lausanne,
CH-1015 Lausanne, Switzerland
E-mail: [email protected]
Abstract. We report measurements of Shubnikov-de Haas oscillations in the giant Rashba
semiconductor BiTeI under applied pressures up to ∼ 2 GPa. We observe one high
frequency oscillation at all pressures and one low frequency oscillation that emerges between
∼ 0.3 − 0.7 GPa indicating the appearance of a second small Fermi surface. BiTeI has a
conduction band bottom that is split into two sub-bands due to the strong Rashba coupling,
resulting in a ‘Dirac point’. Our results suggest that the chemical potential starts below the
Dirac point in the conduction band at ambient pressure and moves upward, crossing it as
pressure is increased. The presence of the chemical potential above this Dirac point results
in two Fermi surfaces. We present a simple model that captures this effect and can be used to
understand the pressure dependence of our sample parameters. These extracted parameters
are in quantitative agreement with first-principles calculations and other experiments. The
parameters extracted via our model support the notion that pressure brings the system
closer to the predicted topological quantum phase transition.
arX
iv:1
404.
7004
v2 [
cond
-mat
.mtr
l-sc
i] 1
4 N
ov 2
014

1. Introduction
In materials that combine broken inversion symmetry with a large spin-orbit coupling, the
so-called “Rashba effect” can cause lifting of the spin-degeneracy leading to two chiral
sub-bands. Such strong spin-orbit coupled materials have potential use in spintronic
applications [1, 2]. Until recently, systems exhibiting large Rashba splittings were restricted
largely to surfaces [3, 4], interfaces [5], and thin films [6, 7, 8]. BiTeI appears to exhibit a
very large Rashba splitting of the bulk electronic bands [9] and, for this reason, has attracted
significant attention.
First-principles calculations have predicted that, under presssure, BiTeI undergoes
a band inversion and becomes the first instance of a non-centrosymmetric topological
insulator [10]. The critical pressure, Pc, for the band inversion is predicted to be in the
range of 1.7 - 4.1 GPa. Infrared reflectance and transmission measurements under pressure
found signatures of the predicted topological quantum phase transition (TQPT) [11]. In
particular, consistent with the approach to a linear dispersion near Pc, a maximum in the
plasma frequency, ωp (and hence the the Fermi velocity, νF ) was found near 2.2 GPa. X-
ray diffraction measurements, also reported in that study, found that the crystal structure
remained unchanged from the ambient pressure one below ∼ 9 GPa, although the ratio
of the lattice constants, c/a, passes through a weak minimum near Pc [11, 12]. Another
infrared study under pressure [13] did not report clear evidence for the TQPT, though in
that work the number of pressures sampled near Pc was lower. A combined theoretical
and high pressure x-ray diffraction study suggested that the band inversion occurs closer to
4.5 GPa [12]. In order to further address the effects of compression on BiTeI, we have carried
out measurements of Shubnikov-de Haas (SdH) oscillations under pressure.
A number of recent papers have reported measurements of SdH oscillations in BiTeI at
ambient pressure [14, 15, 16]. Although BiTeI is nominally a semiconductor with a band gap
of ∼ 0.3 eV, self doping (i.e. non-stoichiometry) leads to a chemical potential, µ, that lies in
the conduction band, producing carrier densities on the order of ∼ 1019 cm−3. The samples
examined in these studies fall into two categories, with the µ, lying either above or below
the Dirac point that arises at the crossing point of the two chiral sub-bands. For the case
where µ lies below the Dirac point, only the so-called outer Fermi surface (OFS) is present,
and only a single oscillation frequency, F−, is observed. For cases where µ lies above the
Dirac point, an inner Fermi surface (IFS) is present and, consequently, a second oscillation
frequency, F+, is also observed. In this paper, we report measurements of Shubnikov-de
Haas oscillations in BiTeI under applied pressures up to 1.9 GPa. These measurements show
that, for the sample examined in this study, µ appears to lie at or below the Dirac point at
ambient pressure, and is pushed above it with increasing pressure.
2

2. Experimental methods
Single crystals of BiTeI were grown by the chemical vapor transport method. A small piece of
sample with dimensions of about 700µm×200µm×40µm was cut from a larger crystal. Pt
wires were attached to the crystal using Dupont 4929N conductive silver paste. The sample
was mounted to the wire and fiber optic feed-through of a piston-cylinder pressure cell which
was constructed from MP35N alloy. The pressure was calibrated at room temperature and
again at the lowest temperature using the fluorescence of the R1 peak of a small ruby
chip [17]. Daphne 7474 oil was used as the pressure-transmitting medium [18] surrounding
the sample. The resistance was measured using a Quantum Design PPMS for each pressure
up to 1.9 GPa. A Lakeshore 370 resistance bridge was used for the transport measurement.
Four wire electrical resistivity measurements were carried out between 2-300 K, in magnetic
fields up 16 tesla, at pressures of 0.3, 0.7, 1.1, 1.4, and 1.9 GPa. The sample resistance was
measured in the crystalline ab-plane, while the magnetic field was applied parallel to the
c-axis.
3. Results
Fig. 1 presents on overview of our results. Increasing pressure leads to a slight suppression
in the overall magnitude of the resistivity, although the shape of the curves do not change
significantly (Fig. 1a). Fig. 1b shows the magnetic field dependence of the resistivity for each
pressure. For all pressures, oscillations of the resistivity are visible in the raw data. The
oscillations can be more clearly observed by plotting the field derivative of the resistivity,
as shown in Fig. 1c. Plotting the data in this way reveals the presence of two regimes. At
low pressures, only one set of oscillations is apparent, evident at fields above ∼ 10 tesla.
Beginning at pressures above ∼ 1 GPa, a second, lower frequency oscillation appears at low
fields. As pressure increases the low field oscillations become larger in amplitude and persist
to higher fields. At the highest pressure the low field oscillations die-out for fields above
about 3 tesla.
The oscillations at 1.9 GPa closely resemble those observed at ambient pressure in
Ref. [16]. The higher frequency oscillations have been identified as being associated with
the OFS while the low frequency oscillations are associated with the IFS. The absence of
the IFS oscillation at the lowest pressure and it’s appearance under pressure, suggests that
the chemical potential lies at or slightly below the Dirac point and ambient pressure and
then rises above the Dirac point as pressure increases. This is discussed in further detail in
Section 4.
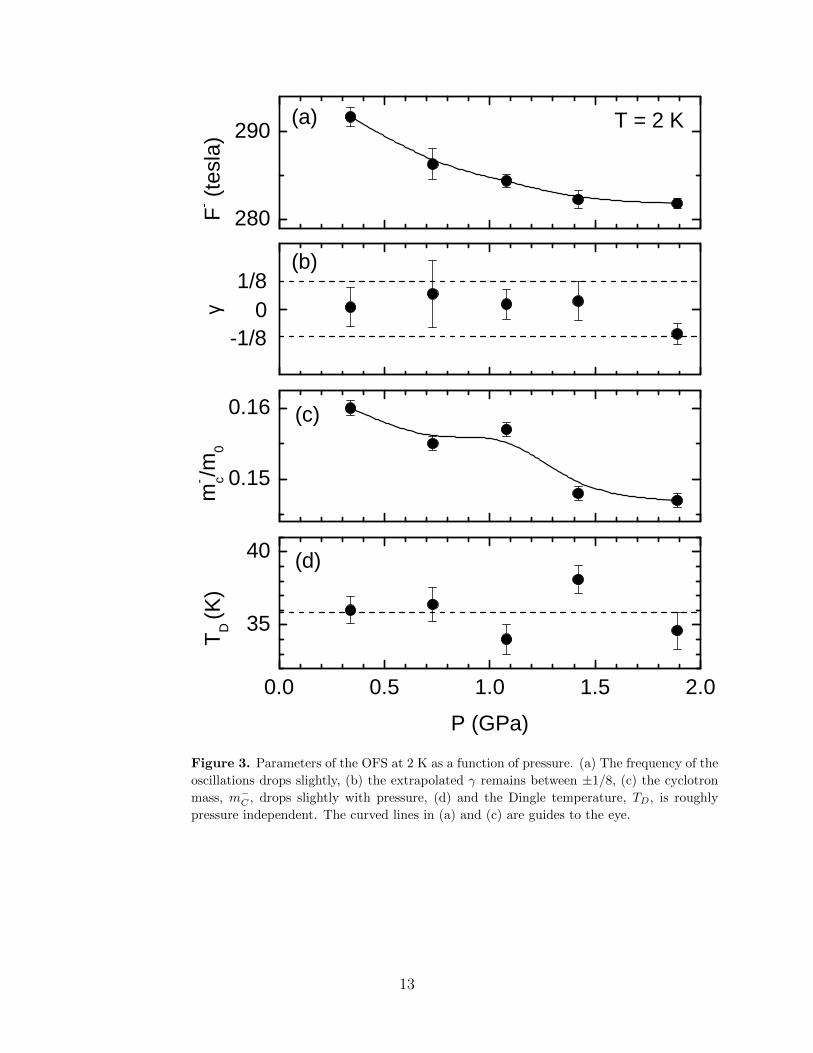
We first discuss the OFS oscillations, which are presented in Figs. 2 and 3. The
oscillations were analyzed by subtracting a polynomial background from the magneto-
resistance. The frequency was then extracted from the resulting data using a fast Fourier
transform (FFT). Fig. 2a plots the normalized FFT amplitude versus frequency for the
highest and lowest pressures in our experiments. The frequency has also been determined
3

by taking the slope of a plot of the Landau level index, n, versus the value of 1/B where the
oscillatory part of the magneto-resistance passes through a maximum (see Fig. 2b). Both
methods of extracting the frequency yield nearly identical results. The frequencies extracted
via index plot are plotted versus pressure in Fig. 3a. A small reduction in the frequency
with pressure is evident. Because the maximum fields in these experiments are far from
the quantum limit for the OFS, we have shifted the values of n by the integer value that
produces the smallest intercept. The values of the intercept, γ are plotted versus pressure
in Fig. 3b. The intercept values all lie between the values of ±1/8, which is consistent with
a non-trivial Berry’s phase as discussed in Ref. [16]. The temperature and field dependences
of the oscillation amplitudes were used to extract the effective cyclotron mass, m−c , and
Dingle temperature, TD, respectively, as described in Ref. [14]. Figs. 3a and 3b show the
effective mass and Dingle temperature, respectively, as a function of pressure. The effective
mass shows a weak suppression with pressure. The lack of a strong reduction in the Dingle
temperature supports the expectation that good hydrostatic conditions are maintained in
the cell over the entire pressure range studied.
Next, we turn to the low frequency oscillations associated with the IFS. Fig. 4a shows
the negative second derivative of the resistivity, −d2ρ/dB2 versus the inverse field, 1/B,
in the vicinity of the IFS oscillations for the highest two pressures. The Landau indices
are indicated by the integer numbers located at the peaks in −d2ρ/dB2 and half integer
values located at the valleys [19]. For these oscillations, the quantum limit is reached below
3 tesla, presumably because of a very low carrier density. The position of the last dip in the
data before the IFS oscillations die out is denoted B−0 . Because the IFS oscillations die out
very quickly at low fields, it is only possible to reliably extract the 1/B values for the first
1− 2 Landau levels. Nonetheless, this is enough to provide an estimate of the frequency of
these oscillations. Fig. 4b plots the Landau index versus 1/B for the pressures where these
oscillations are present. The frequency of these oscillations is determined from the slope
of a linear fit to the data and listed for each pressure in Table 1. The substantial increase
in this frequency is consistent with pressure pushing the Fermi level upwards relative to
the Dirac point (see Section 4). In order to obtain an estimate of the pressure where the
IFS first appears, we have also plotted the B−0 feature as a function of relative volume,
V/V0 in Fig. 4c. The applied pressures can be converted into relative volume using the
equation of state determined via high-pressure x-ray diffraction measurements [11]. A linear
extrapolation of B−0 suggests that the IFS appears for relative volumes below 0.983, which
amounts pressures above 0.4 GPa. Using the background subtraction method described in
Ref. [16] and the temperature dependent amplitude of these oscillations, we were able to
arrive at an estimate of the cyclotron mass, m+C/m0 ∼ 0.012, at 1.9 GPa, for the carriers
on the IFS. The smaller amplitude of the oscillations at lower pressures prohibits a reliable
estimate of the mass at lower pressures.
4

4. Discussion
We have already mentioned that the appearance of a second oscillation is consistent with an
increase of the chemical potential with pressure. In order to obtain quantitative estimates
of the position of the chemical potential relative to the Dirac point, we have taken two
complementary approaches. In the first approach, we extracted band structure parameters
including the band mass, the Rashba parameter α, and chemical potential from our data
using a simple model Hamiltonian. In the second approach, we determined the chemical
potential by relating our data to previous first principles calculations. We find that both
approaches yield nearly identical pressure dependences of the chemical potential.
4.1. Analysis in terms of the Rashba Hamiltonian
Noting that the chemical potential lies somewhere in the vicinity of ∼ 100 meV from the
bottom of the conduction band [20, 9, 16, 14, 15] we model the bottom of the conduction
band by the usual Rashba Hamiltonian:
Hk = ~2(k2x + k2y
2m1
+k2z
2m2
)I + α(σ × k)z − µ (1)
where m1,2 are the effective in-plane (m1) and out of plane (m2) band masses, α is the Rashba
parameter that encodes the strength of the spin-orbit interaction, µ is the chemical potential,
σ is the vector of Pauli matrices, and the z-axis is along the normal to the a− b planes. We
have added the kz dispersion to reproduce the Fermi surface topology in 3D [15, 16]. The kzdispersion is not significant for our study as we apply the magnetic field along along the z-
direction. Thus, kz remains a good quantum number and only the value of kz corresponding
to the maximum cross-sectional area of the Fermi surface (kz = 0 in this model) is relevant.
The magnetic field quantizes the x− y motion into Landau levels given by [21]:
E±n = ~ωc
(n±
√4ER~ωc
n+ ∆2
), n ≥ 1, (2)
where ‘+’ and ‘-’ correspond to the inner and outer Rashba sub-bands and the Zeeman term,
∆, is given by ∆ = 12
(1− gm1
2m0
), where g is the effective g-factor, ωc = Be
m1, and m0 is the
bare mass of the electron. Within this model, it is natural to define a Rashba energy scale
ER = 12m1
(α~
)2, which measures the position of the Dirac point relative to the bottom of
the conduction band. The three relevant band structure parameters of this model are µ
(measured from the Dirac point), α, and m1 (m2 is not relevant for this study). All of these
parameters can be extracted from our measurements at each pressure and thereby one can
examine how pressure affects the band structure. To relate this model to BiTeI, one simply
needs to translate the origin from kz = 0 to the A point of the Brillouin zone [10].
5

4.1.1. Linearity of index plots: In the work of Murakawa et al. [16], it was found that the
index plots for both sub-bands were linear to the lowest Landau levels. We show below that
our simplified model captures this behavior if ∆ is small. To see this, we solve Eq. (2) for
the fields at which En = µ:
m1µ
~e1
B±n
= n(1 + 2f)±√
4f(1 + f)n2 + ∆2. (3)
where f = ER
µand µ is taken to be above the Dirac point. We see that the dependence of
1/Bn on n is, in general, non-linear. However, if 4n2f(1 + f) ∆2, the dependence reduces
to:m1µ
~e1
B±n
≈ n(√
1 + f ±√f)2 +O
(∆2
4n√f(1 + f)
). (4)
Thus, the observed linearity of the index plots suggests a negligible role of the Zeeman term.
Using this input from the experiment, we drop the Zeeman terms (∆) in our subsequent
analysis.
4.1.2. Evolution of band structure parameters with pressure: We focus on the data sets
that show two frequencies. This translates to the regime with µ > 0, where there are two
Fermi surfaces, and the two frequencies in SdH oscillations correspond to the maximal cross
sectional areas of each Fermi surface. From Eq. (4), these frequencies are found as:
F± =µm1
~e
(√1 + f ∓
√f)2. (5)
The cyclotron masses (m±C), extracted from the temperature dependence of the SdH
amplitude, are proportional to the derivatives of the areas with respect to the energy
evaluated at the Fermi level:
m±C = m1
(1∓
√f√
1 + f
). (6)
Comparing Eqs. (5) and (6), we find that
m+C
m−C
=
√F+
F− , (7)
andF−
F+=
(√1 + f +
√f√
1 + f −√f
)2
. (8)
Using these equations, it is possible to extract the parametersm1, α, and µ from the measured
values of F± and m±C . Eq. (7) provides a useful consistency check.
In Table 1, we report the results of this analysis on our data for the pressures where
both oscillations can be observed (1.1-1.9 GPa) and, for comparison, on the ambient pressure
6

Ref. [16] This work This work This work
Sample A 1.1 GPa 1.4 GPa 1.9 GPa
F+ (tesla) 3.4 0.6(1) 1.0(1) 2.0(2)
F− (tesla) 347 284.4(3) 282.3(4) 281.8(3)
m+C/m0 0.023 0.007(1) 0.009(1) 0.012(1)
m−C/m0 0.183 0.157(1) 0.148(1) 0.147(1)
m1/m0 0.11 0.082(1) 0.078(1) 0.080(1)
µ (meV) 66 18(1) 25(1) 34(2)
α (eVA) 4.3 4.1(1) 4.2(1) 4.1(1)
Table 1. Microscopic parameters m1, α, and µ determined from frequencies, F±, and
cyclotron masses, m±C taken from SdH measurements, using the method described in the
text.
data of Murakawa et al. [16]. For our data, we used Eq. (7) to estimate m+C at 1.1 and 1.4
GPa, since, as mentioned earlier, it was not possible to reliably extract the mass at these
pressures due to the small amplitude of oscillations. At 1.9 GPa, this approach yields m+C
within ∼ 3% of the measured value. The values of the Rashba parameter, α, presented in
Table 1 also agree very well with those determined through ARPES measurements [9]. Both
α and the band mass, m1, do not appear to be strongly pressure dependent, at least over this
range of pressures. However, the chemical potential shows a clear increase with pressure.
The black circles in Fig. 5a present the dependence of µ on the relative volume V/V0.
A linear extrapolation of the data suggests that the chemical potential is located about
10 meV below the Dirac point at ambient pressure, crosses the Dirac point near V/V0 = 0.984
(0.4 GPa), and rises to ∼ 34 meV above the Dirac point at our highest pressure (1.9 GPa).
This analysis results in the same estimate of the pressure at which the chemical potential
crosses the Dirac point (0.4 GPa) as was obtained by plotting the quantum limit field, B−0 ,
versus volume (see Figure 4c). Future Hall effect measurements under pressure might be
sensitive to the appearance of the IFS under pressure.
4.2. Comparison with first principles calculations
As a consistency check for the method described above, we have also arrived at an estimate
of the chemical potential by comparing the observed oscillation frequencies with previous
first principles calculations of the band structure. Bahramy et al. [10] have calculated the
band structure for three different relative volumes, corresponding to ambient pressure, and
pressures both equal to and above the critical pressure for the band inversion Pc. Our
experiments correspond to the pressure range below Pc. We began by digitizing the band
structure calculations presented in Fig. 2 of Ref. [10]. From this data, were were able to
determine the specific relationship between the ratio of frequencies of the inner and outer
Fermi surface oscillations and the chemical potential (measured from the Dirac point). The
7

chemical potential versus pressure obtained using this method is presented in Fig. 5a. For a
given frequency ratio, the estimated µ is nearly the same regardless of whether the ambient
(green triangles) or P = Pc (red squares) calculations are used. These data also agree quite
well with the estimates of the chemical potential arrived at above by analyzing the data in
terms of the Rashba Hamiltonian (black circles).
Using m1, α and µ listed in Table 1 we can arrive at a picture of how the electronic
structure (at the bottom of the conduction band) changes with pressure and compare this
with the previous predictions. Fig. 5b presents the dispersions for the two Rashba sub-bands
(all energies are measured from the chemical potential). The various changes under pressure
that we had previously discussed are directly evident from Fig. 5b: the slight decrease in F−,
substantial increase in F+, and increase in the chemical potential relative to the Dirac point.
In addition, Fig. 5b reveals that pressure appears to push the bottom of the conduction
band lower towards the valence band. Although the sign of this trend is consistent with
the approach to a pressure induced band inversion, the magnitude of the effect is not in
quantitative agreement with predictions. For the range of relative volumes corresponding
to 1.1-1.9 GPa, Ref. [10] (Supplementary material) predicts that the gap should drop by
∼ 70 meV, whereas we find the bottom of the conduction band dropping by only ∼ 10 meV.
However, we note that our model does not include the coupling between the valence and
conduction bands, which will become increasingly pronounced as the pressure approaches
Pc.
5. Conclusions
We have carried out a series of measurements of SdH oscillation in BiTeI at pressures up to
1.9 GPa. This pressure is below the pressure which appears to be required to drive BiTeI
through a pressure-induced band inversion [10, 11, 12]. An analysis of the results in terms
of a simple model Hamiltonian allows an estimate of the pressure dependence of various
band structure parameters such as the band mass, m1, the chemical potential µ, and the
Rashba parameter α. The estimated value of α is consistent with ARPES measurements [9].
Our data suggests a clear increase in the chemical potential from below the ‘Dirac point’ to
above it as pressure is increased. This analysis suggests a lowering of the conduction band
minimum with pressure. The sign of this trend (although not the magnitude) is consistent
with the approach to a pressure induced band inversion as predicted in Ref. [10]. Further
studies at higher pressures and in lower carrier density samples will be necessary to explore
the possible appearance of novel surface states in the high-pressure non-centrosymmetric
topological insulator phase.
Acknowledgments
DV and JJH acknowledge the National High Magnetic Field Laboratory’s User Collaborative
Grants Program (UCGP) for support. DG and SWT acknowledge support from the
8

Department of Energy (DOE) from grant DOE NNSA de-na0001979. SM is a Dirac Post-
Doctoral Fellow at the National High Magnetic Field Laboratory, which is supported by
the National Science Foundation via Cooperative agreement No. DMR-1157490, the State of
Florida, and the U.S. Department of Energy. DLM acknowledges support from the National
Science Foundation (NSF) from grants NSF DMR-0908029 and NSF DMR-1308972. We
thank Hai-Ping Cheng and David Tanner for informative conversations.
Bibliography
[1] D. Marchenko, A. Varykhalov, M. R. Sholz, G. Bihlmayer, E. I. Rashba, A. Rybkin, A. M. Shikin,
and O. Rader. Giant Rashba splitting in graphene due to hybridization with gold. Nature
Communications, 3:1232, 2012.
[2] A. Takayama, T. Sato, S. Souma, T. Oguchi, and T. Takahashi. Tunable spin polarization in bismuth
ultrathin film on Si(111). Nano Letters, 12:1776, 2012.
[3] S. LaShell, B. A. McDougall, and E. Jensen. Spin splitting of Au(111) surface state band observed with
angle resolved photoelectron spectroscopy. Phys. Rev. Lett., 77:3419, 1996.
[4] Yu. M. Koroteev, G. Bihlmayer, J. E. Gayone, E. V. Chulkov, S. Blugel, P. M. Echenique, and Ph.
Hofmann. Strong spin–orbit splitting on Bi surfaces. Phys. Rev. Lett., 93:046403, 2004.
[5] J. Nitta, T. Akazaki, H. Takayanagi, and T. Enoki. Gate control of spin–orbit interaction in an inverted
In0.53Ga0.47As/In0.52Al0.48As heterostructure. Phys. Rev. Lett., 78:1335, 1997.
[6] J. H. Dil, F. Maier, J. Lobo-Checa, L. Patthey, G. Bihlmayer, and J. Osterwalder. Rashba-Type
Spin-Orbit Splitting of Quantum Well States in Ultrathin Pb Films. Phys. Rev. Lett., 101:266802,
2008.
[7] T. Hirahara, T. Nagao, I. Matsuda, G. Bihlmayer, E. V. Chulkov, Yu. M. Koroteev, P. M. Echenique,
M. Saito, and S. Hasegawa. Role of Spin-Orbit Coupling and Hybridization Effects in the Electronic
Structure of Ultrathin Bi Films. Phys. Rev. Lett., 97:146803, 2006.
[8] T. Hirahara, T. Nagao, I. Matsuda, G. Bihlmayer, E. V. Chulkov, Yu. M. Koroteev, and S. Hasegawa.
Quantum well states in ultrathin Bi films: Angle-resolved photoemission spectroscopy and first-
principles calculations study. Phys. Rev. B., 75:035422, 2007.
[9] K. Ishizaka, M. S. Bahramy, H. Murakawa, M. Sakano, T. Shimojima, T. Sonobe, K. Koizumi, S. Shin,
H. Miyahara, A. Kimura, K. Miyamoto, T. Okuda, H. Namatame, M. Taniguchi, R. Arita, N. Nagaosa,
K. Kobayashi, Y. Murakami, R. Kumai, Y. Kaneko, Y. Onose, and Y. Tokura. Giant Rashba-type
spin splitting in bulk BiTeI. Nature Materials, 10:521, 2011.
[10] M. S. Bahramy, B.-J. Yang, R. Arita, and N. Nagaosa. Emergence of non-centrosymmetric topological
insulating phase in BiTeI under pressure. Nature Communications, 3:679, 2012.
[11] X. Xi, C. Ma, Z. Liu, Z. Chen, W. Ku, H. Berger, C. Martin, D. B. Tanner, and G. L. Carr. Signatures
of a pressure-induced topological quantum phase transtion in BiTeI. Phys. Rev. Lett., 111:155701,
2013.
[12] Y. Chen, X. Xi, W.-L. Yim, F. Peng, Y. Wang, H. Wang, Y. Ma, G. Liu, C. Sun, Z. Chen, and H. Berger.
High-pressure phase transitions and structures of topological insulator BiTeI. JPCC, 117:25677, 2013.
[13] M. K. Tran, J. Levallois, P. Lerch, J. Teyssier, A. B. Kuzmenko, G. Autes, O. V. Yazyev, A. Ubaldini,
E. Giannini, D. van der Marel, and A. Akrap. Infrared- and Raman-spectroscopy measurements of
a transition in the crystal structure and a closing of the energy gap of BiTeI under pressure. Phys.
Rev. Lett., 112:047402, 2014.
[14] C. Martin, E. D. Mun, H. Berger, V. S. Zapf, and D. B. Tanner. Quantum Oscillations and optical
conductivity in Rashba spin-splitting BiTeI. Phys. Rev. B., 87:041104(R), 2013.
[15] C. Bell, M. S. Bahramy, H. Murakawa, J. G. Checkelsky, R. Arita, Y. Kaneko, Y. Onose, M. Tokunaga,
9

Y. Kohama, N. Nagaosa, Y. Tokura, and H. Y. Hwang. Shubnikov-de Haas oscillations in the bulk
Rashba semiconductor BiTeI. Phys. Rev. B., 87:081109(R), 2013.
[16] H. Murakawa, M. S. Bahramy, M. Tokunaga, Y. Kohama, C. Bell, Y. Kaneko, N. Nagaosa, H. Y. Hwang,
and Y. Tokura. Detection of Berry’s Phase in a Bulk Rashba Semiconductor. Science, 342:1490,
2013.
[17] G. J. Piermarini, S. Block, J. D. Barnett, and R. A. Forman. Calibration of the pressure dependence
of the R1 ruby fluorescence line to 195 kbar. J. Appl. Phys., 46:2774, 1975.
[18] K. Murata, K. Yokogawa, K. Yoshino, S. Klotz, P. Munsch, A. Irizawa, M. Nishiyama, K. Iizuka,
T. Nanba, T. Okada, Y. Shiraga, and S. Aoyama. Pressure transmitting medium Daphne 7474
solidifying at 3.7 GPa at room temperature. Rev. Sci. Instrum., 79:085101, 2008.
[19] The assignment of integer indices to the maxima in −d2ρ/dH2 (rather than the minima) depends on
the ratio ρxx/ρxy > 1. Preliminary Hall measurements under pressure on a sample cut from the same
parent crystal used in this study indicate that this condition is satisfied with ρxx/ρxy ≥ 1.3 for fields
up to 16 tesla.
[20] M. S. Bahramy, R. Arita, and N. Nagaosa. Origin of giant bulk Rashba splitting: Application to BiTeI.
Phys. Rev. B., 84:041202(R), 2011.
[21] Yu. A. Bychkov and E. I. Rashba. Properties of a 2D electron gas with lifted spectral degeneracy.
JETP Letters, 39:78, 1983.
10

0 . 5
1 . 00 1 0 0 2 0 0 3 0 0
0 5 1 0 1 50 5 1 0 1 50 . 3
0 . 4
0 . 5
T ( K )
ρ (m
Ω−cm
)( a )
1 . 91 . 41 . 10 . 70 . 3
P ( G P a )
P ( G P a )( c )
dρ/dB
(arb.
units)
B ( t e s l a )
1 . 9
1 . 4
1 . 1
0 . 7
0 . 3
P ( G P a )
( b )
ρ (m
Ω−cm
)
B ( t e s l a )
T = 2 K
1 . 91 . 41 . 10 . 70 . 3
Figure 1. (a) Electrical resistivity in the ab-plane versus temperature, measured from
2-300 K at several pressures. (b) Resistivity versus magnetic field for several pressures.
The magnetic field was applied parallel to the c-axis. At the lowest pressures, only one set
of oscillations is visible (above ∼ 12 tesla). At higher pressures, a second set of oscillations
emerges below ∼ 3 tesla. (c) These features are more clearly visible in a plot of the derivative
of the resistivity with respect to field. The derivative plots have been offset vertically for
clarity.
11

2 0 0 2 5 0 3 0 0 3 5 0 4 0 0 0 1 0 2 0 3 0 0 . 0 0
0 . 0 5
0 . 1 01 . 9 G P a
amplit
ude (
arb. u
nits)
F - ( t e s l a )
( a )0 . 3 G P a
( b )
1/B (
tesla-1 )
n
1 . 9 G P a
Figure 2. Data for oscillations arising from the OFS. (a) FFT amplitude versus frequency
at 0.3 and 1.9 GPa. A small decrease in the frequency is evident. (b) Inverse field, 1/B,
versus Landau index, n, for the OFS at 1.9 GPa.
12
2 8 0
2 9 0
0 . 1 5
0 . 1 6
0 . 0 0 . 5 1 . 0 1 . 5 2 . 0
3 5
4 0
F- (tesla
) T = 2 K( a )
- 1 / 8
1 / 8 ( b )
γ 0
( c )
m- c/m0
( d )
T D (K)
P ( G P a )Figure 3. Parameters of the OFS at 2 K as a function of pressure. (a) The frequency of the
oscillations drops slightly, (b) the extrapolated γ remains between ±1/8, (c) the cyclotron
mass, m−C , drops slightly with pressure, (d) and the Dingle temperature, TD, is roughly
pressure independent. The curved lines in (a) and (c) are guides to the eye.
13

0 . 5 1 . 0 1 . 5 0 1 2
0
1
2
3
1 . 0 0 0 . 9 8 0 . 9 6 0 . 9 4 0
1
2
3B -
0
1 . 4 G P an = 1 . 5
n = 1
n = 2
1 / B ( t e s l a - 1 )
-d2 ρ/dB2 (a
rb. un
its)( a )
n = 1
1 . 9 G P a
B -0
( b )
1/B (
tesla-1 )
n
( c )
B- 0 (tesla
)
V / V 0
Figure 4. Data concerning oscillations arising from the IFS. (a) Negative second derivative
of the resistivity with respect to field. The data have been offset vertically for clarity. The
small amplitude of the the oscillations only allows the first 1− 2 oscillations to be resolved.
B−0 indicates the last dip in the data as the IFS reaches the quantum limit. (b) Index plot
for the IFS at 1.9 GPa (black circles), 1.4 GPa (red squares), and 1.1 GPa (blue triangles).
(c) A plot of B−0 versus relative volume extrapolates to zero at V/V0 = 0.983. This implies
that the IFS does not appear until ∼ 0.4 GPa
14

0 . 9 4 0 . 9 6 0 . 9 8 1 . 0 0
- 1 0
0
1 0
2 0
3 0
4 0
µ (me
V)
0 . 0 0 0 . 0 4 0 . 0 8
- 1 0 0
- 5 0
0
E - µ
(meV
)
Figure 5. (a) Position of the chemical potential, µ, referenced to the Dirac point. The black
circles indicate values determined by analyzing our data in terms of the Rashba Hamiltonian
(Section 4.1.2) The green triangles and red squares indicate values estimated by comparing
observed oscillation frequencies to the first principles calculations of Bahramy et al. [10]
for BiTeI at ambient pressure and the critical pressure for band inversion, respectively.
Regardless of which estimate is used, extrapolation suggests that the chemical potential lies
∼ 10 meV below Dirac point at ambient pressure and crosses above it at V/V0 = 0.984,
corresponding to a pressure of 0.4 GPa. (b) Band structures at various pressures formed by
using the parameters listed in Table 1.
15