tuning in the rise of online video in latin america (4)
TRANSCRIPT

Festival of Media LatAm | 24 September 2012
Gian Fulgoni Executive Chairman and Co-founder, comScore
Tuning In:
The Rise of Online Video
in Latin America
1 Online Video Viewing in Latin America
2 What Can We Learn from the U.S.?
3 Some Thoughts for the Future

In 1996, 2/3 of world’s Internet population was in the US, yet today Asia Pacific is the largest region
with over 40% of online population.
Many emerging regions likely to bypass old modes, skipping dial-up to go straight to broadband,
making multimedia, video, and collaborative content immediately accessible.
Early adoption of mobile web in addition to PC web will likely be popular in many of these high-
growth areas.
Asia Pacific
Distribution of Worldwide Internet Audience
66%
13%
34%
87%
1996 2011
U.S. Internet Population vs. Rest of the World
Rest of the
World
U.S.
Source: comScore Media Metrix, Visitors Age 15+ Home/Work Location, Dec-2011
Asia Pacific, 41,3%
Europe, 26,4%
North America,
14,6%
Latin America,
9,0%
Middle East - Africa, 8,8%
The U.S. is No Longer the Center of the Online Universe
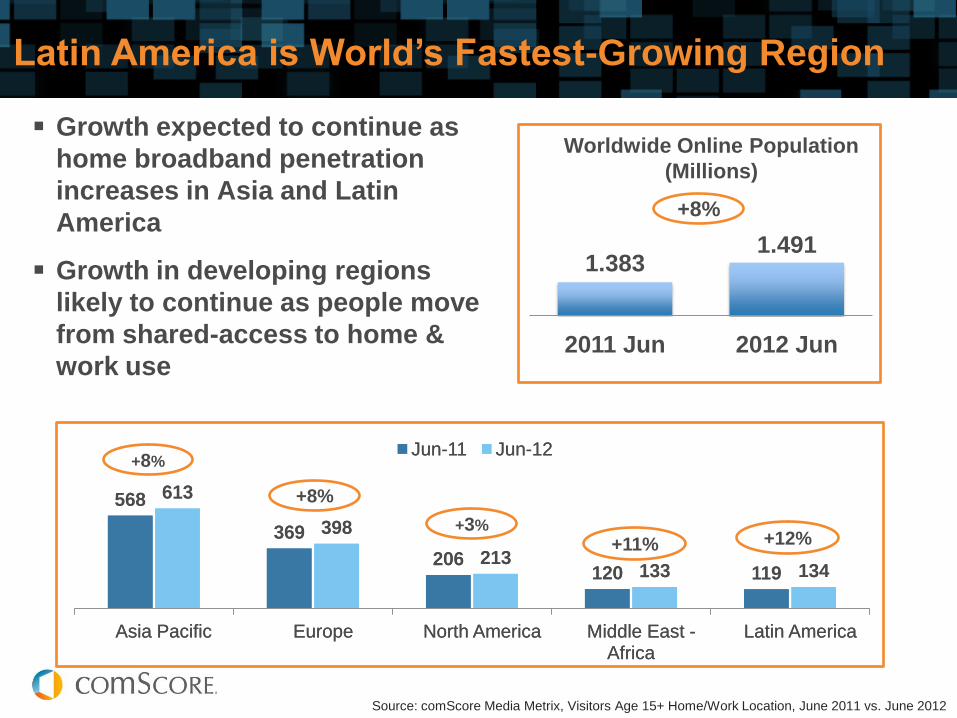
Latin America is World’s Fastest-Growing Region
568
369
206 120 119
613
398
213 133 134
Asia Pacific Europe North America Middle East - Africa
Latin America
Jun-11 Jun-12
Growth expected to continue as
home broadband penetration
increases in Asia and Latin
America
Growth in developing regions
likely to continue as people move
from shared-access to home &
work use
+8%
+8%
Worldwide Online Population
(Millions)
Source: comScore Media Metrix, Visitors Age 15+ Home/Work Location, June 2011 vs. June 2012
+8%
+3%
+11% +12%
568
369
206 120 119
613
398
213 133 134
Asia Pacific Europe North America Middle East - Africa
Latin America
Jun-11 Jun-12
1.383 1.491
2011 Jun 2012 Jun

Focus: Latin America
July 2010 Penetration Data V0910
Latin America
Argentina
Brazil
Chile
Mexico

Growth in Video Viewing in 2011
Total Videos Viewed (000) Dec-2011
Percent Growth vs. Dec. 2010
BRAZIL 4.7 Billion +74%
MEXICO 3.0 Billion +80%
ARGENTINA 1.5 Billion +75%
CHILE 1.0 Billion +91%
Online Video’s Blockbuster Year Videos Viewed Grew by Double Digits Across LatAm Region

1
Source: comScore Video Metrix, July-2012
MEXICO
Videos
(Millions)
Share of
Videos
Google Sites 2,164 62%
VEVO 219 6%
Viacom Digital 54 2%
CHILE
Videos
(Millions)
Share of
Videos
Google Sites 927 80%
VEVO 58 5%
Viacom Digital 17 2%
BRAZIL
Videos
(Millions)
Share of
Videos
Google Sites 4,435 75%
Globo 359 6%
VEVO 193 3%
ARGENTINA
Videos
(Millions)
Share of
Videos
Google Sites 988 63%
VEVO 65 3%
Facebook.com 22 1%
Driven by YouTube, Google Sites Account for
More than 60% of Videos Viewed in LatAm

Video Consumption in LatAm skews younger … with under 34
age segment accounting for almost 60% of videos viewed
15-24 25-34 35-44 45-54 55+
28% 30%
21%
14%
8%
Source: comScore Video Metrix, July-2012
% Composition of Video Time Spent

Reach of online video is slightly greater in the LatAm
region than Worldwide
82%
92%
81%
96%
85%
84%
Mexico
Chile
Brazil
Argentina
USA
Worldwide
Monthly Online Video Reach / Web Population
Source: comScore Video Metrix, July-2012

Room for growth in video consumption in LatAm
151,2
168,6
139,2
120,0
245,9
169,5
Mexico
Chile
Brazil
Argentina
USA
Worldwide
Videos per Viewer
Source: comScore Video Metrix, July-2012

Room for growth in video engagement in LatAm
13,63
12,45
11,61
11,32
22,05
19,40
Mexico
Chile
Brazil
Argentina
USA
Worldwide
Monthly Hours per Viewer
Source: comScore Video Metrix, July-2012

While growing rapidly in LatAm,
time spent watching online video
equivalent to only a percentage point
or two of the time spent watching TV

What Can We Learn from the U.S.?

SOURCE: IAB for Internet Advertising Revenue and KANTAR for Total Mediaedia
Measurement
$31.7 Billion U.S. Online
Ad Spending in 2011
+22% vs. year ago
IAB says U.S. online ad spend is now larger than newspapers,
magazines and radio, and equivalent to 46% of TV
10X Faster
Growth
Than
All Media

TV Online Video
44.581
1.338
44.334
2.321
US Monthly Total Hours (millions) Spent Watching TV vs. Online Video
Monthly Total Hours (millions) in Q4 2010
Monthly Total Hours (millions) in Q4 2011
In the U.S, time spent watching traditional TV is essentially flat while
online video is growing strongly
SOURCE: TV: Nielsen Cross Platform Report – Q4 2011. Online Video: comScore Video Metrix
-0.6%
+74%
Video now equals 5% of total time
spent watching TV

$1.8 Billion U.S. Online Video Ad Spending in 2011
IAB says U.S. online video ad spending is surging
Equivalent
to 6% of all
online ad
spending
+40% vs. year ago
SOURCE: IAB for Online and Various for Total Media dia
Measurement 2011
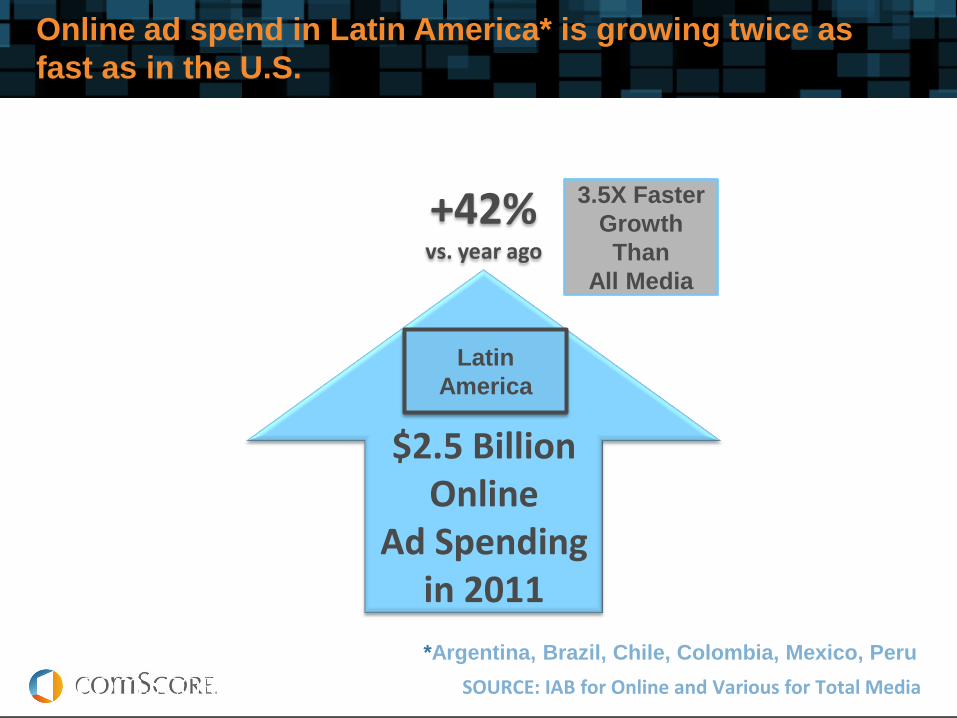
Online ad spend in Latin America* is growing twice as
fast as in the U.S.
3.5X Faster
Growth
Than
All Media
$2.5 Billion Online
Ad Spending in 2011
+42% vs. year ago
Latin
America
*Argentina, Brazil, Chile, Colombia, Mexico, Peru

Online video allows convenient viewing of TV content and
is an incremental audience – it’s not about avoiding ads
Recent comScore study sought to answer: why do viewers choose to watch
TV content online?
– NOT out of ad-avoidance
– Main factor is convenience and time-shifting
7%
13%
25%
38%
57%
71%
Don’t subscribe to cable/don't have a TV
Prefer the online experience
Like to see past episodes
Less ads
Convenience
Missed episode on TV

Online viewers of TV programs are open to more ads – at least 6.5 minutes
per TV hour
0,0
20,0
40,0
60,0
80,0
100,0
1 min 2 min 3 min 4 min 5 min 6 min 7 min 8 min 9 min 10 min 11 min 12 min 13 min 14 min 15 min
Negligible Minimal Long Enough Too Long
Base sizes:
Total=640
Optimal length of commercials for an hour of TV viewed online
*Respondents were asked questions on a sliding scale from ‘how much advertising is so
negligible that it would not interfere at all’, through to ‘how much advertising is too long and
would interfere completely with the viewing experience’?

A CBS Perspective on TV and Video Advertising from 2009

CBS: Online video ads can demand a premium price because
of heightened consumer attention and more precise targeting

CBS: Even with lower ad loads than TV but a premium price, video
ads can have same value as TV ads

The Limitation of TV: Brands Trying to Reach their Target with
TV Alone Hit A Plateau of Diminishing Returns
85,1 87,9
67,8 74,1
0
10
20
30
40
50
60
70
80
90
100
0 2.500 5.000 7.500 10.000 12.500 15.000
Cost ($000)
Total Reach
Effective Reach
Total Reach and Effective Reach for a TV
Campaign as a Function of Cost
Typically 30%+ of Target Audience is not Effectively reached

Adding Branding Advertising to TV With Online Video Builds
Reach and Effective Reach
Media Plan GRPs Total Reach Effective
Reach
TV Only 1,000 85% 68%
TV + Video Combination
TV (90%) 900 84% 66%
Online Video (10%) 500 64% 44%
TV + Online Video 1,400 90% 84%
TV Only vs.
90% TV + 10% Online Video 400 5% 16%
Impact of a 90/10 Allocation
Source: comScore simulation using
single source TV and Internet data

1 Online video viewing in LatAm is surging
2 Lessons from U.S.
Online video viewing of TV content incremental to TV
Consumers will accept online video ad loads of 10%+
Premium pricing possible for video ads
3 Online video advertising can add effective reach to a TV
campaign –especially among younger age segments
Summary Thoughts