tunable contact barrier of single wall carbon nanotube films for electrical contact to...
DESCRIPTION
referenceTRANSCRIPT

TUNABLE CONTACT BARRIER OF SINGLE WALL CARBON NANOTUBE FILMS FOR ELECTRICAL CONTACT TO SEMICONDUCTORS AND POLYMERS
By
ZHUANGCHUN WU
A DISSERTATION PRESENTED TO THE GRADUATE SCHOOL OF THE UNIVERSITY OF FLORIDA IN PARTIAL FULFILLMENT
OF THE REQUIREMENTS FOR THE DEGREE OF DOCTOR OF PHILOSOPHY
UNIVERSITY OF FLORIDA
2008
1

© 2008 Zhuangchun Wu
2

To my parents, my wife and my daughter
3

ACKNOWLEDGMENTS
I thank my academic advisor, Dr. Andrew G. Rinzler, for his thoughtful knowledge and
emotional support throughout my PhD study. I also thank my committee members for their
advice. The cooperative research projects with Dr. Reynold’s group gave me insights about
polymer science. I have used various instruments and equipment from Dr. Herbard’s lab which
made my research much easier, and I was benefited from his “Solid State Physics” lecture.
Dr. Jeremiah Mwaura worked closely with me for the OLED project. I also thanks to Dr.
Kyu-pil Lee, who did collaboration with me on the GaN LED project.
Dr. Zhihong Chen showed me the ropes of the lab and I benefited from discussions and
hand on hand training from her. Dr. Jeniffer Sippel-Oakley, Mr. Bo Liu, Mr. Mitch McCarthy
helped me in various ways throughout my Ph.D study. Mr. McCarthy helped me to build a
chamber for nanotube/silicon heterojunction sensitivity to environmental gas study. Guneeta
Singh deserves my special thanks for all the enlightening conversations about life, culture and
everything beyond physics. I would like to thank Ms. Debra Anderson from UFIC and Ms.
Barbara Bostin for their continuous help for my family. I would like to thank Physics machine
shop personnel for helping me machining various experimental setups.
4

TABLE OF CONTENTS page
ACKNOWLEDGMENTS ...............................................................................................................4
LIST OF TABLES...........................................................................................................................7
LIST OF FIGURES .........................................................................................................................8
ABSTRACT...................................................................................................................................12
1. INTRODUCTION .....................................................................................................................14
1.1 Single Walled Carbon Nanotube ......................................................................................14 1.2 Chiral Vectors, Unit Cell of Graphene Lattice .................................................................15 1.3 Energy Dispersion of the Graphene Lattice and Single Wall Carbon Nanotube
(SWNT)...............................................................................................................................16 1.4 Density of States of SWNT ..............................................................................................17 1.5 Motivation for the Single Wall Nanotube Film Studies in this thesis ..............................18
2. SINGLE WALLED CARBON NANOTUBE THIN FILM-FABRICATION AND PHYSICAL PROPERTIES ....................................................................................................23
2.1 Fabrication of a Carbon Nanotube Film ...........................................................................23 2.2 Transfer of a Carbon Nanotube Film to a Substrate .........................................................26 2.3 Surface Morphology of a Carbon Nanotube Film ............................................................26 2.4 Resistivity of a Carbon Nanotube Film ............................................................................27 2.5 Optical Spectroscopy of a Carbon Nanotube Film...........................................................27
3. SHIFTING THE FERMI LEVEL OF CARBON NANOTUBE FILM ....................................34
3.1 Introduction.......................................................................................................................34 3.2 Optical Analog to the Electrolyte-Gated Nanotube Based FET (O-NFET) .....................35
3.2.1 Experimental Details ..............................................................................................36 3.2.2 Transmittance Spectrum of O-NFET as a Function of the Applied Gate
Voltage.........................................................................................................................37 3.2.3 The Film Resistivity as a Function of the Applied Gate Voltage...........................39
3.3 Discussion and Explanation..............................................................................................39 3.4 Time Drive of the O-NFET ..............................................................................................42 3.5 Conclusion ........................................................................................................................42
4. OHMIC CONTACT COUPLING CARBON NANOTUBE FILM TO P-GALLIUM NITRIDE ................................................................................................................................52
4.1 GaN Light Emitting Diode Background...........................................................................53 4.2 Experiments Details for Fabricating SWNT Film Based GaN LED................................54 4.3 Results...............................................................................................................................55
5

6
4.3.1 Contact Resistance..................................................................................................55 4.3.2 I-V Characteristic of Carbon Nanotube Film/p-GaN .............................................56
4.4 Discussion.........................................................................................................................56 4.5 Conclusion ........................................................................................................................57
5. ORGANIC LIGHT EMITTING DIODE WITH SWNT FILM AS ANODE ...........................64
5.1 Introduction.......................................................................................................................64 5.2 MEH-PPV.........................................................................................................................64 5.3 Experimental Details ........................................................................................................65 5.4 Discussion.........................................................................................................................66
5.4.1 MEH PPV does not wet with SWNT .....................................................................68 5.5 Conclusion ........................................................................................................................69
6. CARBON NANOTUBE/SILICON HETEROJUNCTION.......................................................74
6.1 Introduction about Schottky Barrier .................................................................................74 6.2 Experimental Details of SWNT/p-Si Heterojunction .......................................................75 6.3 Results of SWNT/p-Si Heterojunction and Discussion....................................................76 6.4 SWNT/n-Si Photovoltaic Device......................................................................................79 6.5 Experimental details for SWNT/n-Photovoltaic device ...................................................80 6.6 SWNT/n-Si Photovoltaic cell results and discussion .......................................................80 6.7 Conclusion on SWNT/p-Si heterojunction and SWNT/n-Si solar cell ............................82
7. PATTERNING OF SWNT FILM ...........................................................................................102
7.1 Patterning of SWNT Film to Sub-Millimeter.................................................................102
8. SUMMARY AND FUTURE WORK .....................................................................................106
8.1 Summary.........................................................................................................................106 8.2 Future Work....................................................................................................................106
LIST OF REFERENCES.............................................................................................................107
BIOGRAPHICAL SKETCH .......................................................................................................111

LIST OF TABLES
Table page 4-1 Contact resistances of Ti/Al/Pt/Au on carbon nanotubes, carbon nanotube film on p-
GaN, and standard Ni/Au on p-GaN..................................................................................59
7

LIST OF FIGURES
Figure page 1-1. Chiral vector Ch, translational vector T and the unit cell (OACB) of a (4,2) SWNT
illustrated on a graphene sheet. .........................................................................................19
1-2. Band structure of graphene lattice (top) and the Brillouin zone of graphene lattice (bottom). The quantization of the wave vectors perpendicular to the tube axis of the nanotube lead to a set of discrete set of energy sub-bands (red parallel lines in the bottom). .............................................................................................................................20
1-3. Energy dispersion relationship of (10, 10) and (10, 0) SWNT. Notice the cross of the valence band and conduction band of the (10, 10) nanotube at the Fermi level, which implies it is a metallic nanotube, whereas the energy gap at the Fermi level (0 in these plots) show the (10, 0) nanotube to be semiconducting. .........................................21
1-4. Density of states (DOS) of (10, 10) and (10, 0) nanotube. Notice the finite states at the Fermi level of (10, 10) nanotube, resulting it’s characterization as a metal. While the (10, 0) has a gap, indicating it’s a semiconductor. ............................................................22
2-1. AFM image of a 50nm SWNT film. .....................................................................................31
2-2. The transmittance of a 50nm before and after baking at 600oC in Argon.............................32
2-3. Transmittance of a 240nm free standing SWNT film before (grey curve) and after (black solid curve) baking, with wavelength up to 120 micron meter. Also shown is the transmittance vs. much shorter wavelength range of a 50nm SWNT film on quartz substrate. The inset shows the electronic transaction between valence band and conduction band of the DOS from (12,8) semiconducting nanotube and (10,10) metallic nanotube. ..............................................................................................................33
3-1 The schematic drawing of a solid state optical modulator .....................................................44
3-2. A sketch of the optical analog to the electrolyte-gated NFET ..............................................45
3-3. Three transmittance spectrum as a function of applied counter electrode voltage, i.e. 0V, +0.4V and -0.5V. ........................................................................................................46
3-4. Density of states (DOS) of (12, 8) single walled carbon nanotube .......................................47
3-5. The transmittance of the nanotube film as a function of the applied gate voltage, from +1.8V to -1.8V. The transmittance at S1 peak (1676nm) increased from 44% to 92%, while the S2 peak (932nm) varied from 51% to 68%. The IR at 3080nm decreased from 97% to 75%, at opposite direction to the S1 peak modulation. ...............................48
3-6. The resistivity of the nanotube film as a function of the applied gate voltage......................49
8

3-7. The transmittance at S1, S2 and M1 depends on the gate voltage. ......................................50
3-8. Time drive of the S1 transmittance peak with +/- 1V gate voltage.......................................51
4-1. Schematic view of the GaN based light-emitting diode using SWNT film as the p-Ohmic contact. ...................................................................................................................60
4-2. IV characteristics of GaN LED with different metal, i.e. Ti/Al/Pt/Au, Pd only and Pd/Au contact on carbon nanotube fim. All the devices are using carbon nanotube film as the p-GaN contact. ................................................................................................61
4-3. Emission spectrum of the GaN LED with injection current 0.1mA......................................62
4-4. Picture of the visible emission from the GaN LED with carbon nanotube film as the p-GaN contact electrodes. .....................................................................................................52
5-1. A) Structure of MEH-PPV (top) and B) Illustration of the OLED device with ITO/PEDOT PSS as anode (middle) C) OLED device with SWNT film (bottom) ..........70
5-2. ITO/PEDOT PSS based OLED radiance and current vs. voltage .........................................71
5-3. SWNT film based OLED radiance and current vs. voltage ..................................................72
5-4. Illustration of the energy band alignment of the OLED devices...........................................73
6-1. Flat band model of contact barrier and Schottky barrier height ............................................84
6-2. Illustration of single gate and double gate of carbon nanotube/Si heterojunction ................85
6-3. Three steps explaining the SWNT/p-Si single gate heterojunction device fabrication process................................................................................................................................86
6-4. Circuit diagram of the single gate device (top) and double gate device (bottom).................87
6-5. Source drain current as a function of gate voltage for SWNT/Si heterojunction with heavily and lightly doped p-Silicon. Over a course of +/-0.7V gate voltage, Isd modified 10 and 36 times, for heavily and lightly doped silicon, respectively. ................88
6-6. IV characteristics of the SWNT/p-Silicon heterojunction at different gate voltage A) Lightly doped p-silicon and B) heavily doped p-Si ...........................................................89
6-7. Flat band model of modulating the contact barrier of SWNT/Si heterojunction by shifting the Fermi level of SWNTs....................................................................................90
6-8. The current decreased significantly after 5 hour of continuously application of gate voltage for the lightly doped silicon device. Same phenomena observed for heavily doped silicon device as well. .............................................................................................91
9

10
6-9. Double gating effect, with identical source gate and drain gate. Isd can be modulated more than 300 times by applying gate voltage ±0.7V. ......................................................92
6-10. Carbon nanotube silicon junction current in argon environment will change upon introduce oxygen or air. .....................................................................................................93
6-11. Carbon nanotube silicon junction transpot vs different ambient condition.........................94
6-12. Circuit diagram of the boot-strap PV device .......................................................................95
6-13. I-V characteristic of the SWNT/n-Si solar cell, dark (top) and under illumination (bottom)..............................................................................................................................96
6-14. The series resistance was determined to be 283 ohm for low doping n-silicon solar cell. ...................................................................................................................................97
6-15. IV characteristic for the solar cell under different bias .......................................................98
6-16. The close up of Figure 6-14, to show the open circuit voltage change under different gate bias. ............................................................................................................................99
6-17. Flat band model of gating effect for SWNT/n-Si junction (top) and illustration of photovoltaic effect (bottom). The blue line illustrates the over-gated situation, where there is a barrier generated for the hole to transfer from the silicon to the SWNT. ........100
6-18. Energy band alignment at the SWNT/n-Si interface before (red) and after (black and blue) gate voltage is applied. For the black and blue curve, we can see the built in potential is increased. However, the further increase the gate voltage will push the Fermi level of the SWNT too low, to generate a barrier for hole to transfer from Silicon to SWNT, reduce the charge harvest efficient.....................................................101
7-1. Illustration of coarse patterning of interdigitated finger with line width 0.1mm ................105

LIST OF ABBREVIATIONS
SWNT: Single walled carbon nanotube
OLED: Organic light emitting diode
PV: Photovoltaic
TEM: Transmission electron microscopy
AFM: Atomic force microscopy
SEM: Scanning electron microscopy
ITO: Indium tin oxide
EMI-BTI: 1-ethyl-3-methylimidazolium bis-(trifluoromethylsulfonyl)imide
11

Abstract of Dissertation Presented to the Graduate School of the University of Florida in Partial Fulfillment of the Requirements for the Degree of Doctor of Philosophy
TUNABLE CONTACT BARRIER OF SINGLE WALL CARBON NANOTUBE FILMS FOR ELECTRICAL CONTACT TO SEMICONDUCTORS AND POLYMERS
By
Zhuangchun Wu
August 2008
Chair: Andrew G. Rinzler Major: Physics
Single walled carbon nanotubes (SWNTs) are quasi one dimentional molecule formed with
pure sp2 carbon-carbon bonding. They are chemically stable, near ballistic transporters, and have
high surface area. According to their chiral vector and diameter, they can be either metallic or
semiconducting. They are a new class of material in the nanometer range which has unique
physical and chemical properties. Their unique one dimensional character gives them unusual
electrical properties.
A method of manufacturing thin films made of 100% SWNTs was explored. The carbon
nanotube films made by this method are thin enough to be transparent, yet still conducting. The
electrical and optical properties of those films have been studied, as well as application examples
for integrating the film into opto-electrical devices. The SWNT films made by this method have
following advantages: they are thickness controllable, uniform, transparent, conducting, and
formed at room temperature. We found the SWNT films were comparable in terms of the
conductivity and transparency to the standard industry transparent electrode, indium tin oxide
(ITO).
12

An optical analog of SWNT based FET was constructed which demonstrated the ability to
shift the Fermi level of the SWNT film by about 0.9eV. We can shift the Fermi level by such
large amount is due to the one dimensional characteristic of SWNT such that the density of states
(DOS) of the nanotubes are finite and easy to be filled or emptied upon injecting or depleting
electrons by applying a gate field. This unique feature makes the SWNT film favorable in
making ohmic coupling to usually difficult materials, like GaN.
The SWNT film has been demonstrated to form ohmic contact with p-GaN light emitting
diode (LED). Studies on using SWNT as anode for constructing organic LED (OLED) have
shown great hopes. Several challenges of this system have been identified and further research is
still on the way.
The heterojunction between SWNT film and silicon has been investigated. The carrier
injection across the p-silicon and nanotube film junction has been modulated by a factor of 300
by application of a gate voltage of less than 2V. The contact barrier was found sensitive to the
environment. Both oxygen and other component of the atmosphere (most likely water vapor) will
contribute to the junction resistance change. The n-silicon and nanotube film will form Schottky
barrier and showed photovoltaic effect.
Patterning the SWNT films to sub-millimeter range was demonstrated, which can be
beneficial to all the applications.
In summary, the SWNT film provides a new type of film for electrical coupling to opto-
electronic devices as well as various inorganic and organic materials. The ease of Fermi level
tunability for this nanotube film provides the new opportunity for working with a wide range of
materials, including previously proven to be difficult ones.
13

14
CHAPTER 1 INTRODUCTION
1.1 Single Walled Carbon Nanotube
A single walled carbon nanotube (SWNT) is essentially a single atomic layer of a graphene
sheet rolled to form a seamless tube, with a diameter on the order of one nanometer, its length in
the range of micrometers up to one centimeter. Multi walled carbon nanotubes (MWNTs) are
nested coaxial layers of SWNTs. Carbon nanotubes have remained a highly active research area
since the MWNT structure was elucidated in 1991 by Iijima (1). SWNTs are quasi one
dimensional objects. They have rich physical properties as well as many potential applications.
According to their chirality and diameter, SWNT can be either metallic or semiconducting,
making them very attractive as the next generation of bottom up building blocks for electronic
devices (2-4). All the carbon atoms in the SWNT lattice are bonded with sp2 σ bonds, which are
among the strongest chemical bonds, making SWNT very stable and inert to covalent chemistry
except under extreme conditions. Various sensors (5-8) were manufactured based on the SWNTs
by detecting their resistance change upon exposure to various chemicals. Functionalization of the
SWNT was another research topic to make SWNTs either binding to different agents for the
purpose of biosensor applications or for separating metallic nanotubes from semiconducting ones
(9-11). Nanotube based field effect transistors (NFET) also have been demonstrated (12-14), as
well as integrated logical circuits based on semiconducting SWNTs (15,16).
A central topic in this thesis concerns the ease of shifting the Fermi level of a conducting
film made of SWNTs. I will first introduce a method of making thin, transparent and conducting
SWNT films, followed by a description of the physical properties of the film. Then, two
examples of using this thin film as the electrode for optoelectronic devices, in which the Fermi
level shift of the nanotubes plays an important role will be discussed. Finally, by shifting the

Fermi level of the nanotubes in the film, the transport across the heterojunction between the
SWNT film and silicon will be modulated.
This first Chapter will give the basic fundamentals of the SWNTs as well as the motivation
of this study. In Chapter 2, the fabrication as well as electrical and optical properties of the
SWNT film will be explored. In Chapter 3, a SWNT film is utilized as the electrode to make
Ohmic contact with the p-GaN side of a GaN LED. Chapter 4 demonstrates an optical analog of
nanotube based FET and successfully shifts the Fermi level of a nanotube film by about 0.9
electron Volts. Chapter 5 discusses using the nanotube film as an anode to construct an organic
light emitting diode (OLED). Chapter 6 investigates the nanotube silicon heterojunction and
modulating the transport across the junction by applying a gate field. Chapter 7 explains a
method of patterning the nanotube films down to sub millimeter scale. Chapter 8 gives a
summary to this thesis and points out the future research needed to be done.
The remainder of this chapter will introduce the fundamental physical properties of
SWNT, which are closely followed according to reference 17 and 19. Chiral vectors, followed
with energy dispersion relationship and density of states of the SWNT will be explained and will
lay the theoretical foundation for the experimental phenomena in this thesis.
1.2 Chiral Vectors, Unit Cell of Graphene Lattice
Starting from the unit vectors of the two dimentional graphene lattice 1 and 2, we define
a chiral vector .
ar ar
hCr
hCr
=n 1+m 2 (n,m) with ar ar ≡ m <n
As illustrated in Figure 1-1, start from point O, we have the chiral vector (4 1+2ar ar 2) to
point A, such that OA is the chiral vector hCr
. Later we will roll this OA to form a seamless tube,
which will called (4,2) nanotube.
15

Next we define a translational vector Tr
(also starting with point O, OB), which is
orthogonal to chiral vector , i.e. hCr
0=•TCh
rr
BC can be obtained through translating OA by amount of Tr
. This OACB will make up a
unit cell of the (n,m) nanotube, in this case, a (4,2) nanotube.
The nanotube (n,m) will be formed if we cut the OACB out of a graphene sheet and roll
along the OA direction to form the circumference of the nanotube. So the diameter dh, of the
nanotube is
dh= 2L/π, L= hCr
= nmmnaCC hh ++=• 22rr
This OACB is the unit cell in real space.
1.3 Energy Dispersion of the Graphene Lattice and Single Wall Carbon Nanotube (SWNT)
By using tight binding approximation, only considering the nearest neighbor atoms, one
can get the energy dispersion of the graphene sheet, as illustrated in Figure 1-2.
In order to calculate the energy dispersion of a SWNT, we need to impose the boundary
condition to the 2D graphene lattice, since the nanotubes are rolled up into a tube.
qKCh π2=•rr
, where q=1, 2, ….N, N is the number of hexagons in the real space unit cell
OAB’B.
This will result in a quantized wave vector
,2222 nmmna
qC
qkh ++==⊥
ππ ( Tk ⊥⊥ , the nanotube axis, q=1,2,…N)
By applying this boundary condition to the 2D graphene lattice, the SWNT dispersion
becomes simple cut lines through the 2D dispersion relation of graphene in the direction
16

specified by the boundary conditions (in turn dictated by the real space direction of the nanotube
axis).
Examples of the energy dispersion relationship of (10,10) and (10, 0) nanotube are shown
in Figure 1-3. It is clear that the valence band and conduction band of (10, 10) nanotube has a
cross point right at the Fermi level, which makes it intrinsically metallic. While for (10, 0)
nanotube, there is a band gap at the Fermi level. So, it is a semiconducting nanotube.
1.4 Density of States of SWNT
In order to calculate the density of states (DOS) of a SWNT, one can take the energy
dispersion relationship of the SWNT, divide the energy into small intervals and sum the k
vectors appearing in each energy segment. This procedure leads to density of states diagrams
specific to each nanotube of distinct (n,m) index such as shown in Figure 1-4.
As shown in Figure 1-4, (10, 10) and (10, 0) nanotube density of states again confirms that
the (10, 10) nanotubes are metallic, with finite density of states at the Fermi level, while the
semiconducting (10, 0) nanotube has a band gap right at the Fermi level. The sharp features in
the DOS of the nanotubes are called von Hove singularities. There can be electronic transitions
between symmetric valence band and conduction band von Hove singularities, resulting in
absorption bands in the optical spectrum of the SWNTs. The band gap for the semiconducting
nanotubes is inversely proportional to the diameter of the nanotube (17).
The density of states of SWNT is finite, but the mobility along the nanotube is near
ballistic (18,20). The effective scattering length is on the order of micrometers for metallic tubes
and a few hundred nanometers for semiconducting nanotubes (18,20). Because the carbon
nanotubes are only quasi one dimensional, they have some tolerance for defects. Although the
density of states for the nanotubes is low (compared to typical metals) the charge mobility is very
17

high making the nanotubes good conductors. The Fermi level of the nanotube is easily tuned
because of the low density of states.
1.5 Motivation for the Single Wall Nanotube Film Studies in this thesis
Techniques developed to produce thin homogeneous films of SWNT that are
simultaneously transparent and electrically conducting are exploited to study the potential of the
SWNTs as Fermi level tunable electrodes in electronic and optoelectronic devices.
18

a1
a2
(4,2) C h
T (4,-5)
O
A
B
C
Figure 1-1. Chiral vector Ch, translational vector T and the unit cell (OACB) of a (4,2) SWNT illustrated on a graphene sheet. 1
1 Reprinted with permission from Ph. Avouris, Z. Chen and V. Perebeinos, Nature Nanotechnology 2, 605 (2007) Copyright © 2007, Nature Publishing Group
19

Figure 1-2. Band structure of graphene lattice (top) and the Brillouin zone of graphene lattice (bottom). The quantization of the wave vectors perpendicular to the tube axis of the nanotube lead to a set of discrete set of energy sub-bands (red parallel lines in the bottom). 2
2 Reprinted with permission from Ph. Avouris, Z. Chen and V. Perebeinos, Nature Nanotechnology 2, 605 (2007) Copyright © 2007, Nature Publishing Group
20

Figure 1-3. Energy dispersion relationship of (10, 10) and (10, 0) SWNT. Notice the cross of the valence band and conduction band of the (10, 10) nanotube at the Fermi level, which implies it is a metallic nanotube, whereas the energy gap at the Fermi level (0 in these plots) show the (10, 0) nanotube to be semiconducting. 3
3 Reprint with permission from Z.H. Chen, Thesis, University of Florida, 2003
21

22
Figure 1-4. Density of states (DOS) of (10, 10) and (10, 0) nanotube. Notice the finite states at the Fermi level of (10, 10) nanotube, resulting it’s characterization as a metal. While the (10, 0) has a gap, indicating it’s a semiconductor. 4
4 Reprint with permission from Shigeo Maruyama www.photon.t.u-tokyo.ac.jp/

CHAPTER 2 SINGLE WALLED CARBON NANOTUBE THIN FILM-FABRICATION AND PHYSICAL
PROPERTIES
Prior to 2002, much of the effort in the community of SWNT research was focused on the
individual nanotubes (2,3,5). In this thesis, a different approach was explored by using the
SWNT effectively in bulk as thin films possessing thickness less than 200 nm over macroscopic
areas (up to 5.5 inches in diameter). The film fabrication and properties are described here.
2.1 Fabrication of a Carbon Nanotube Film
All the single walled carbon nanotubes used in this study were synthesized from laser
vaporization growth and later purified by Dr. Andrew Rinzler (4,24). It will be referred to as
“carbon nanotubes” or “nanotubes”. The growth and purification process is briefly described as
follows.
The laser vaporization growth apparatus involves a dual pulsed laser beam, precisely timed
to fire one after another to hit a rotating target. The target was composed of a mixture of catalyst
cobalt and nickel particles, 1 atomic percent each, together with carbon, sitting in the hot zone of
the 1200oC furnace, with flowing argon (4,24), all in a two inch diameter closed quartz tube. The
SWNT deposit on the down stream of the quartz tube wall, together with a mixture of the
amorphous carbon and metal catalyst particles. All the amorphous carbon and catalyst particles
need to be removed in order to get the pure SWNT.
The carbon nanotubes were purified by a cross flow filtration method to remove the
amorphous carbon and catalyst particles (24). In order to separate into small bundles and
individual nanotubes, typically they will be suspended in an aqueous solution (25), otherwise the
nanotubes entangle with each other to form an intractable mass. Since the surface volume ratio of
the nanotubes is tremendous, the Van der Waals force is strong enough to hold them together. In
order to suspend in water, some kind of surfactant is needed. It is found 1 weight percent of
23

Triton-X 100 surfactant solution will stably suspend the nanotubes for a long time (24, 25). The
surfactant has a hydrophobic head and a long hydrophilic tail. The surfactant will form hydration
shells around the nanotubes. Only once the surfactant concentration reaches the so called critical
micelle concentration (CMC), does it starts to coat the nanotubes. The process of surfactant
coating of the nanotube is a dynamic process. Some surfactant will always come off the nanotube
and some other surfactant molecules newly bind onto the nanotube surface. If the surfactant
concentration is lower than the CMC, the surfactant polymers are rather associated with each
other to form the micelles. Once the concentration is above CMC, there will be enough free
surfactant for the nanotube surfaces to begin to be coated.
Even with the use of a surfactant energy must be put into the material to break apart the
large agglomerates of nanotubes. This is accomplished using ultrasonication. The ultra
sonication energy will break the aggregates apart. The surfactant can then quickly coat the
nanotube bundles preventing reaggregation. Too much sonication will start to cleave the
nanotubes and result in shorter tube length. So, it’s a matter of balancing the degree of bundle
disaggregation to individual nanotubes versus the tube length. To make a uniform SWNT film, it
is desired to have more individual and small bundle nanotubes in the solution. It will make the
film more homogeneous and decrease surface roughness. This becomes more important when
making organic optoelectronic devices where the working polymer layer is in the order of 100
nm thick and the surface roughness of the SWNT film becomes critical. Apart from the bundle
size, the particles in the nanotube film are another critical issue, just like the silicon industry
needs to lower the particle concentration in a silicon wafer. Much effort including extra filtration
process and the environment where those films were made have been taken into account to
address the particle issue. More details will be discussed in chapter 5.
24

The nanotube solution concentration (mass/volume) in a stock solution was determined
simply by making a thick nanotube film by the filtration method (described below) from a
known volume of solution on a Teflon filter membrane so that the film could be peeled off the
membrane (so called buckypaper) allowing determination of its mass with a microbalance. Once
the concentration was determined a thin film was made from a known volume of the stock
solution and its thickness measured by atomic force microscopy (AFM). Once the film thickness
(for a particular area) resulting from one particular volume of the stock concentration was
known, a simple calculation will tell us how much solution is needed for any desired thickness
film of a given area.
The film is made by the filtration process trapping the nanotubes on filtration membranes
with pores too small for the nanotubes to permeate. The filtration process sketch is shown in
Figure 2-1. A membrane (cellulous ester, Millipore, VCWP) with pore size 100nm was typically
used. This material was carefully chosen so that it can be easily dissolved away later by
dissolution with acetone during the transfer process, resulting in a pure nanotube film, either
attached to a substrate or free standing. This fabrication process is self-regulated to form uniform
thickness films. If one region of the membrane were to accumulate more nanotubes, the
nanotubes themselves begin to impede the flow of the solution through that portion of the
membrane hence bringing fewer nanotubes to that region. The pore size of the nanotube film
made from a well sonicated solution usually is in the order of few to tens of nanometer, as seen
on AFM images. This means the pore sizes are much smaller than the average pore sizes of the
filter membrane used. After a few layers of the nanotube landed on the filter membrane, the
regulation of the flow was dominated by the smaller pore size of the nanotube film. Once the
solution was all gone through, the film was then rinsed with sufficient amount of DI water to
25

remove the remaining surfactant in the film. The nanotube film is dried on the filtration
membrane, which brings the nanotubes into intimate contact with each other.
2.2 Transfer of a Carbon Nanotube Film to a Substrate
In order to use the film, a transfer process is needed, either being transferred to a substrate
or held up by a frame for free standing purpose. The transfer process starts with a nanotube film
sitting on the membrane, wetted with DI water, then bringing the nanotube film in contact with a
clean surface. It can be virtually any surface of the material for which nanotube film to contact
with or the surface of a supporting substrate, as long as that substrate can tolerate the membrane
dissolving and the rinsing solvent, in this case, acetone and methyl alcohol. Once the two
surfaces were in contact, the two objects will be sandwiched by two metal plates and a clamp
will be used to apply pressure to the assembly. While sitting in an 80o C oven for half an hour,
the majority of the DI water initially for wetting the nanotube film will evaporate and the surface
tension of the water will bring the nanotube film into intimate contact with the substrate surface.
Then the membrane will be dissolved away, using sequential acetone baths (typically 4 baths) to
ensure removal of residual membrane material. Finally methyl alcohol was used as the final bath
to then dry the nanotube film sample out of a low residue solvent.
2.3 Surface Morphology of a Carbon Nanotube Film
The surface morphology of the nanotube film was characterized by the scanning electron
microscope (SEM) and the atomic force microscope (AFM), as shown in Figure 2-1. The root
mean square surface roughness is about 7 nm. For a thinner film, for example, a 7nm film, there
are appreciable areas of open spaces and other areas with nanotube bundles. In order to lower the
surface roughness, smaller bundles and more individual nanotubes will help. From AFM images,
we will see particles embedded in the nanotube films and also on the surface of the film. These
particles are typically on the order of micrometers, which is much bigger than the nanotube film
26

thickness. For using the nanotube film as electrodes in organic optoelectronic devices, those
particles will cause serious shorting issues, because those polymer photoactive layers are
typically on the order of 100nm thick. Increasing the polymer layer will decrease the device
efficiency because the carrier mobility is limited for polymers. It is an ongoing research project
being carried out in our group for improving the surface smoothness of the nanotube film.
2.4 Resistivity of a Carbon Nanotube Film
The resistivity of the nanotube film was measured by the Van der Pauw method. For as
prepared 50nm film, the resistivity is typically 3x10⁻⁴ Ω·cm (60 ohm/square) and the value is
quite stable, for as long as a month. The resistivity will increase 5-10 times when the film get de-
doped by baking at 600oC in Argon for half an hour. Once the film has been de-doped, it can be
re-doped by exposure to various dopants at room temperature, such as bromine vapor or nitric
acid vapor. The resistivity will recover or even be slightly lower than the as-prepared sample.
However, this doping is not stable, once the film is exposed to air for a couple of hours, it will
become de-doped.
2.5 Optical Spectroscopy of a Carbon Nanotube Film
Optical spectroscopy of the nanotube film has been characterized by a Perkin-Elmer dual
beam spectrometer (Lambda 900). The dual beam refers to sample beam and reference beam. By
placing the sample on a substrate in the sample beam and an identical substrate in the reference
beam the instrument normalizes the sample transmittance at each wavelength to the substrate
transmittance in the reference beam. Hence the absorbance of the sample is determined, without
substrate absorbance. The absorption of the light was come from the sample, in this case, a
nanotube film. The spectrometer generated a monochromatic light, through a slit, incident on the
sample (in our case, perpendicular to the sample surface), and the detector integrated the
radiation that passed through the sample at the same wavelength for a given period of time
27

(integration time). At the Ultra violet/Visible range, the slit width was kept as small as possible
to maintain the accuracy of the wavelength, but large enough to give a good signal to noise ratio.
In the near infrared region (in our case, above 850nm) where the detector has poor dynamic
range, the intensity striking the detector was kept constant by modifying the slit width..
Therefore, the system adjusted the slit width to achieve the required constant intensity and the
width of the slit would be recorded and converted into the transmittance of the film.
A typical transmittance spectrum of the nanotube film is shown in Figure 2-2, before and
after baking at 600oC in argon environment. The dips in the transmittance around 1670nm,
930nm and 650nm are labeled S1, S2 and M1, respectively. S1 and S2 peaks are the absorption
bands which correspond to the electronic transitions between the first and second pair of the Van
Hove singularities in the conduction band and valence band of the density of states of the
semiconducting SWNTs, as illustrated in chapter 1. M1 peak corresponds to the absorption from
the first pair of such transitions contributed by the metallic nanotubes. The absorptions observed
are broad, despite the very sharp structure of the van Hove singularities, because of the
dependence of the energy separation between the singularities on the nanotube diameter (recall
the inverse proportionality of the band gap to the nanotube diameter) and the diameter
distribution of the nanotubes present in the sample (17). The bundling of nanotubes in the sample
also acts to perturb the singularities smearing out the contribution from the discrete tubes to the
absorption.
It is worth while to emphasize that the absorption peak intensity for a given nanotube film
provides information about the occupancy of the nanotube electronic density of states. As the
Fermi level shifts inside the nanotube film, the S1, S2 and M1 absorption peak intensity will
28

change accordingly. The transmittance spectra thus provide information about the location of the
the Fermi level in the SWNT films.
Figure 2-2 shows the transmittance of a 50nm thick SWNT film, before and after baking at
600oC inside an argon environment. The difference in the S1 and S2 intensity is obvious for pre-
and post baking of the film. As described below this change is due to a shift in the Fermi level of
the nanotubes upon baking. This Fermi level shifting is the result of chemical dopants removal.
We will show shifting the Fermi level of the nanotube film through electric field in chapter 3 and
6.
In order to understand the change in the intensity of the S1 and S2 peaks before and after
baking for the nanotube film, we have to understand from the point of view of the DOS of the
nanotube. The inset of Figure 2-3 shows the DOS of the (10,10) and (12,8) nanotubes. The
arrows in the inset correspond to electronic transition from the valence band singularities to the
conduction band singularities for S1 and S2 transition of the (12,8) nanotube and M1 transition
of the (10,10) nanotube, which correspond to the absorption peak in the transmittance spectrum.
If the Fermi level sits in the middle of the gap, the available electrons in the fully occupied
valence band and the available states in the empty conduction band are maximized, hence the
transition probability is maximized,. Once we p-dope the SWNT film, the Fermi level will shift
towards the left. When it moves into the valence band, it will empty some states in the valence
band, making fewer electrons available for participating in the electronic transition, which will
result in the decrease of the absorption S1 peak. On the other hand, if we n-dope the nanotube,
the conduction band states will be partially occupied. Then the transition from valence band to
the conduction band will also get smaller, resulting in a smaller absorption S1 peak. If the Fermi
level moves deep into the valence band, further into the second van Hove singularity, it will start
29

to decrease the S2 absorption peak. The same analysis is applied to the M1 peak as well. This is
why we can use the spectrum as the indicator of where the Fermi level of the nanotube film sits
but cannot tell whether it is p doped or n doped. It is easy to tell whether it’s p or n doping by
shifting the Fermi level corresponding to the known external field applied to the nanotube film
while monitoring the spectrum, which will be explained further in the next chapter.
Figure 2-3 shows the transmittance of two films, one 50nm film sitting on quartz,
measured with a narrow wavelength window, the other a 240nm free standing SWNT film, with
a much broader wavelength window, up to 300μm, before and after baking at 600oC with argon.
Notice in Figure 2-3, there is a big transparency window between the wavelengths of 2 to
10 μm, at which range the industry standard transparent conducting film indium tin oxide (ITO)
is totally opaque. This unique feature makes SWNT film an outstanding candidate for using in
microwave electronic applications.
In summary, we described a simple method for manufacturing pure single walled carbon
nanotube films and characterized the electrical and optical properties of the film. The SWNT
films are comparable to ITO in terms of the conductivity and the transparency in the visible
range but far better transparent in the infrared region (ITO is totally cut off after 2μm). The
Fermi level of the SWNT film is readily shiftable upon depleting or adding electrons to the
nanotube film, either by chemical or as will be shown electrical means.
30

Figure 2-1. AFM image of a 50nm SWNT film. 5
5 Reproduced in part with permission from [Z.Wu et.al, Science 305, 1273-1276 ] Copyright [2004] AAAS
31

Figure 2-2. The transmittance of a 50nm before and after baking at 600oC in Argon.
32

33
Figure 2-3. Transmittance of a 240nm free standing SWNT film before (grey curve) and after (black solid curve) baking, with wavelength up to 120 micron meter. Also shown is the transmittance vs. much shorter wavelength range of a 50nm SWNT film on quartz substrate. The inset shows the electronic transaction between valence band and conduction band of the DOS from (12,8) semiconducting nanotube and (10,10) metallic nanotube.6
6 Reproduced in part with permission from [Z.Wu et.al, Science 305, 1273-1276 ] Copyright [2004] AAAS

CHAPTER 3 SHIFTING THE FERMI LEVEL OF CARBON NANOTUBE FILM
3.1 Introduction
In previous research, Dr. Zhihong Chen in our research group has designed a solid state
optical modulator (Figure 3-1) and demonstrated that upon applying a gate voltage, the Fermi
level of the carbon nanotube film can be shifted (as shown by a 0.1% modulation of the S1
transmittance peak at 6V of gating voltage) (19). The solid state optical modulator is essentially
a transparent capacitor, with two electrodes sandwiched with AlOx as the dielectric layer. The
two electrodes are a thin layer of carbon nanotube film and indium tin oxide (ITO), respectively.
The whole structure sits on a glass substrate. By applying a voltage between the two electrodes
of the capacitor, the optical transmittance of the whole device was monitored by a dual beam
spectrometer, having the sample beam going through the entire device. Since S1 peak is
corresponding to the electronic transitions between the first pair of von Hover singularities of
semiconductor single wall carbon nanotubes, we reach the conclusion that the Fermi level of the
SWNT has been changed upon the application of the gate field. The reasons the total modulation
effect is rather small are two fold: the first and most important one is electronic screening. The
gate field will be mostly screened by the first several layers of the carbon nanotubes next to the
dielectric layer, leaving the rest of the nanotubes not experiencing the gate electric field. Second,
the gating field is rather small, since the dielectric layer is about 81nm thick. In order to increase
the modulation percentage, more charges are needed to inject into the electrodes. By simply
increasing the capacity, one can inject more charges. The capacitance per unit area is important
in this modulation effect. One way to increase the capacitance is to reduce the distance between
the two electrodes of the capacitor, which is reducing the dielectric layer thickness. But reducing
the dielectric layer will cause breaking down of the dielectric layer and cause leakage current.
34

For their operable voltage range electrolytic capacitors have much greater charge storage
capacity than dielectric capacitors. This is due to the fact that in the electrolyte, there are ions in
the solution that can move freely, in response to the electric field generated by the electrodes
immersed into the electrolyte solution. The ions will accumulate very close to the electrode,
which has the equivalent effect of reducing the spacing between the capacitor electrodes, helping
to inject more charges onto the electrodes. The distance for those ions that accumulate next to the
electrode is within the so called Helmholtz layer or double layer, which has a thickness typically
on the order of a few nanometers. Here the phenomenon is exploited to greatly enhance the
electric field gated modulation of the absorption bands in the nanotube films.
3.2 Optical Analog to the Electrolyte-Gated Nanotube Based FET (O-NFET)
We designed a device which is an optical analog to the electrolyte-gated nanotube based
field effect transistor (O-NFET). In this device we have two electrodes, one sample and one
counter (gate) electrode. They are identical SWNT films. The two films were both immersed in
the electrolyte, i.e., an ionic liquid EMI-BTI (1-ethyl-3-methylimidazolium bis-
(trifluoromethylsulfonyl)imide) (23). By applying a voltage between the two films, we could
inject electrons or holes onto each of the nanotube electrodes, respectively. With the help of the
ionic liquid, the charge we can inject onto the nanotube film electrodes will be much increased
compared to having no ionic liquid (as we explained above). The transmittance through the
sample SWNT electrode was monitored while applying a different potential between the sample
and counter electrodes. As discussed in the previous chapter, monitoring the transmittance of the
SWNT film at wavelengths corresponding to particular electronic transitions provides
information about the Fermi level within the film.
35

3.2.1 Experimental Details
As illustrated in Figure 3-2, Two identical, 150nm thick single wall carbon nanotube films
(15mm by 8.5mm) were transferred onto a sapphire substrate (25mm by 25 mm), with 2mm gap
between them. Two thin (50nm) strips of palladium film were thermally evaporated across the
top edges of the nanotube films to make electrical contact with each of them. At the bottom of
the sapphire substrate, a U shape thin rubber gasket was placed along the edge of the substrate on
the film side, and covered with a thin glass plate (25mm by 8mm, hence not in the path of the
light) to form a reservoir for the ionic liquid. The gasket, glass plate and substrate were held
together by a clamp.
Once the device was constructed it was held horizontally and the nanotube films were
wetted and saturated by ionic liquid EMI-BTI. This ionic liquid is viscous, with a very low vapor
pressure and stable at room temperature in ambient environment (23). Once the films were
wetted the device was tilted to be in a vertical position, the excess amount of ionic liquid drained
to the reservoir but by capillary forces a thin layer remained on top of the two nanotube films.
The two nanotube film strips were also in electrolytic contact through the ionic liquid drained
into the reservoir.
The O-NFET device was placed inside a Perkin-Elmer dual beam spectrometer (Lambda
900). By measurement it was previously confirmed that EMI-BTI is transparent from 300nm to 2
μm of wavelength. The monochromatic sample beam passes through the sample nanotube film
and the other nanotube film serves as the gate electrode. Initially we used a platinum wire
(1.5mm diameter) as the gate electrode. But since the surface area of the Pt wire (although we
increased the length of the wire by making several circles inside the ionic liquid reservoir) is
much smaller compared to that of the sample nanotube film, it would be a limiting effect for the
36

capacitance of this device. This led to the decision to use an identical nanotube film as the gating
electrode, thus solving this problem.
One disadvantage of this device is the the response time is rather long, typically in the
order of minutes. The rearrangement of ions in the viscous ionic liquid is slow. Accordingly a
delay of more than 5 minutes was used between each change of voltage and the spectral
measurement. The delay time was determined by monitoring the non-Faradaic charging current
of the device when the voltage was changed. Once the gate current dropped to tens of nanoamps,
the spectrum was recorded (spectra recorded when the charging currents differed by a factor of 2
in this range showed no discernable difference).
3.2.2 Transmittance Spectrum of O-NFET as a Function of the Applied Gate Voltage
The transmittance of the SWNT film electrode as a function of the gate voltage is shown in
Figure 3-3. The measurement takes place from UV to near infrared (IR), i.e. from 350nm to
3080nm. The gate voltages are 0V (no gate voltage), positive 0.5V and negative 0.4V. First, let’s
focus on the absorption spectrum when the gate voltage is 0V. There are three absorption peaks,
S1 (1676nm), S2 (932nm) and M1 (652nm). As discussed in chapter two, the peaks S1 and S2
correspond to the electronic transitions from the conduction band to the valance band of the
semiconducting nanotubes in the SWNT sample film. This electronic transition is illustrated in
Figure 3-4, which shows the density of states of the (12, 8) semiconducting SWNT. As we
know, the energy gap is inverse proportional to the nanotube diameter (17). The diameter
distribution of the nanotubes in our sample is determined by TEM images in the reference 24,
which is mainly between 1.1-1.6nm. That energy gap agreed well with the (12,8) nanotube,
which has the diameter of 1.365nm.
Compare to the DOS of (12,8) nanotube, the S1 and S2 peaks in the transmittance
spectrum of the nanotube film are much more broadened. The broadening of the peaks is mainly
37

due to the distribution of the nanotube diameter in the film as well as to the bundling effect, as
we discussed in chapter two. Typical bundles in our films are about 5-10nm in diameter. These
bundles will also contribute to one of the gating effects, which will be discussed later in this
chapter.
In other words, for a given sample with a fixed electronic status, the transmittance or
absorbance spectrum will be constant. The electronic status is the availability of the valence band
carriers and the conduction band carriers, or where the Fermi level is sit for a given material. If
we apply a voltage to inject electrons or holes onto that sample, it will shift the Fermi level of the
sample, by changing the conduction band or valence band carrier distributions, hence changing
the corresponding absorption spectrum. This is the case for Figure 3-5, where we applied +0.4V,
0V and -0.5V to the nanotube film counter electrode. Because there is ionic liquid next to the
carbon nanotubes and the Helmholtz layer is on the order of nanometers, the nearby counter ions
allowed us to inject much more charge onto the entire bulk of the nanotube film with a lower
gate voltage, compared to the solid state device discussed at the beginning of this chapter. When
a negative voltage (-0.5V) is applied to the counter electrode, positive ions from the ionic liquid
will accumulate at the counter electrode, and negative ions will accumulate at the sample
nanotube film. This will allow more holes to be injected onto the sample nanotube film, shifting
the Fermi level to the p side, resulting in less absorption. As a result, the transmittance at S1 peak
increased from 68% (Vg=0V) to 73.9% (Vg=-0.5V), which is consistent with our prediction. The
opposite situation happens when the positive voltage is applied to the counter electrode, in which
case the transmittance of the film at S1 decreases from 68% to 58%.
The transmittance of the nanotube film as a function of the applied voltages in the range of
positive 1.8V to negative 1.8V on the counter electrode (gate voltage) is shown in Figure 3-5.
38

This gate voltage range was chosen to remain below the reduction/oxidation threshold for EMI
BTI,.
3.2.3 The Film Resistivity as a Function of the Applied Gate Voltage
In order to confirm that the carrier density at given point of the gate voltage on the
nanotube film agreed well with the Fermi level shifting picture, the resistivity of the nanotube
film was measured as a function of gate voltage in a similar device using a Linear Research LR
700 AC Resistance Bridge operated at 16Hz. To facilitate the four probe resistance measurement
the sample film in this case had four 1 mm wide Pd strips deposited across the thin direction of
the film separated by 3 mm. Figure 3-6 shows the film resistivity corresponding to the gate
voltage. As the gate voltage starts from negative 1.8V increasing towards zero and then positive,
the resistivity continuously increases until the gate voltage reaches +1.4V, after which the
resistivity decreases a little as the gate voltage continues increasing to +1.8V.
3.3 Discussion
If the semiconducting nanotubes in the nanotube film are intrinsic or un-doped, the Fermi
level of those nanotubes will be sitting at the middle gap of the DOS of the nanotubes. The
nanotubes in the films are a mixture of semiconducting and metal nanotubes, and the Fermi level
of the films will be the equilibrium of all the nanotubes in the films. So, the Fermi level of the
film will be sitting at the middle of the DOS of the nanotubes if all the nanotubes are intrinsic.
The following direction of “left” or “right” refers to the horizontal axis of the Figure 3-4,
the electronic energy of the nanotube film.
For intrinsic nanotubes, the S1 peak of the absorption spectrum will be at a maximum
when the gate voltage is zero. By injecting electrons to the nanotube film, those electrons will
occupy the conduction band density of states, which will shift the Fermi level to the right. Those
newly occupied conduction band states will be unavailable to participate into the electronic
39

transitions between valence band and conduction band, which will decrease the absorption of the
S1 peak. On the other hand, if we inject holes into the nanotube film (or deplete electrons from
the nanotube film), shifting the Fermi level to the left side, that will decrease the valence band
carriers to be excited into conduction band, also resulting in decrease of the absorption S1 peak.
The experimental observation is that when applying negative gate voltage, the
transmittance of S1 increases, or in other words the absorption decreases, which is agreed well
with our previous analysis. But by applying positive gate voltage, the transmittance of S1
decreases, or equivalent to the increase absorption of S1 peak. This tells us that the Fermi level is
not sitting in the mid-gap, rather, in the p-side (left of the gap), under the S1 valence singularities
when the gate voltage is zero. This is somewhat surprising since the nanotube films were baked
to 600o C in Ar to de-dope them prior to their saturation with the ionic liquid. This seemingly
intrinsic p-type behavior of the nanotube film is likely due to the equilibration of the chemical
potential of the mixed metallic and semiconducting nanotubes with the Pd contact electrodes in
the presence of the surrounding ionic liquid.
A second initially perplexing phenomenon was that far before completely saturating the
changes in the S1 peak, the S2 peak starts to change. This is better observed in Figure 3-7, which
plots the transmittance at the corresponding peak positions versus the applied gate voltage.
According to the simple picture of the gate voltage induced Fermi-level shift, the change of S1,
S2 and M1 should appear sequentially as the Fermi level progress sequentially through the
corresponding valence band singularities.
This seemingly paradoxical behavior is readily explained by electrostatic screening and the
fact that the nanotubes in the films are not individual nanotubes but rather bundles of nanotubes.
For bundles, the inside nanotubes are not directly exposed to ionic liquid. At the lower applied
40

voltages only the outer nanotubes of the bundles will form double layer with ionic liquid and
participate in the electronic doping process. The charges on those outer layer nanotubes will
partially screen the inner nanotubes from the ionic field. Once the equilibrium is established for a
given gate voltage, the Fermi level for the outer layer nanotubes can well lie below M1 while the
Fermi level for the inner nanotubes can still lie below the S1 singularity. Since however the
carrier density of nanotubes is low compared to conventional metals the outer layer of nanotubes
can only partially screen the inner nanotubes so that at the higher applied voltages the S1 peak
can is virtually gone, which means even the Fermi level has shifted below the S1 valence
singularity even for the innermost nanotubes in the bundles.
The transmittance of the film in the near IR region (above 2200nm) responds to gate field
in the opposite direction as that of the S1 peak. When the gate voltage is increased in the
negative direction, the transmittance of S1 increases while that in the near IR region decreases.
The transmittance in the near IR region is governed by free carrier absorption. As the gate
voltage is made more negative the concentration of p type carriers is increased (making the film
more conducting) and increasing the free carrier absorption explaining the observed changes inj
the near IR Transmittance.
From the resistivity versus gate voltage relationship, we can figure out whether the
nanotube film is intrinsic or either n or p doped. If the Fermi level is initially sitting in the n-side,
the resistivity will decrease when the gate voltage moving toward the negative, since the
negative voltage will make the film less n doped, which is not the phenomena we see in our
resistivity data. What is really going on is that when a negative voltage is applied to the counter
electrode, the Fermi level of the nanotube film shifts away from the band gap, resulting in the
drop of the resistivity of the film. This implies that the nanotubes were previously p-doped under
41

the zero gate voltage. When the Fermi level shifting away from the gap, the nanotubes will be
more p-doped, in other words, more conducting. Indeed the resistivity of the nanotube film will
decrease as the gate voltage becomes more negative, which is also confirmed by the near IR
region’s transparency drop.
As the gate voltage increases from zero to +1.4V, the resistivity (Figure 3-6) increases
accordingly, which corresponds to a decrease in the carrier (hole) concentration, as the Fermi
level moves into the gap. This change in the resistivity saturates after 1.4V gate voltage and
actually begins to turn around indicating that the nanotubes have just begun to be n doped at the
largest voltage of 1.8V. This behavior is consistent with saturation appeared in the S1 peak after
+1.4V gate voltage.
3.4 Time Drive of the O-NFET
In order to confirm that the gating effect of the transmittance spectrum comes from the
gating effect, we performed a time drive measurement at the S1 wavelength to confirm that the
whole process is reversible. This step helps to rule out any redox chemistry contribution.
A square wave of +/- 1V gate voltage was applied, each lasting 50 seconds with a period of
100 seconds, while monitoring the transmittance of the S1 peak at 1676nm. The transmittance of
S1 peak will alternate from 71% to 57%, fully recoverable, as illustrated in Figure 3-8. Notice
that the transmittance gradually changing but does not reach a plateau during the 50 seconds
period. As discussed previously, this is due to the slow reorganization of the ions in the viscous
ionic liquid during charging and discharging. The transmittance will reach a plateau after a few
minutes.
3.5 Conclusion
The Fermi level of the single wall carbon nanotube can be shifted upon applying an
electrical field inside an optical analogy nanotube based FET has been confirmed. The Fermi
42

level shifting effect was confirmed through monitoring the transmittance intensity change of the
nanotube film at certain wavelength which corresponding to the electronic transition of the
SWNT while applying a gate voltage. Since spectral changes are observed from the M1 band
associated with a depletion of the first valence band of the metallic nanotubes in the sample (see
the DOS for the (10,10) nanotube shown in the inset of Figure 2-3) the Fermi level of the
nanotube can be shifted by about 0.9eV by applying a gate voltage less than 2V. The near IR
transmittance decrease was corresponding to the free carrier absorption was also observed as the
carrier concentration increase in the SWNT film. The film resistivity as a function of the gate
voltage showed the SWNT was initially p-doped.
43

Figure 3-1 The schematic drawing of a solid state optical modulator 7
7 Reprint with permission from Z.H. Chen, Thesis, University of Florida, 2003
44

Figure 3-2. A sketch of the optical analog to the electrolyte-gated NFET8
8 Reproduced in part with permission from [Z.Wu et.al, Science 305, 1273-1276 ] Copyright [2004] AAAS
45

Figure 3-3. Three transmittance spectrum as a function of applied counter electrode voltage, i.e. 0V, +0.4V and -0.5V.
46

S1
S2
Figure 3-4. Density of states (DOS) of (12, 8) single walled carbon nanotube9
9 Reproduced in part with permission from [Z.Wu et.al, Science 305, 1273-1276 ] Copyright [2004] AAAS
47

Figure 3-5. The transmittance of the nanotube film as a function of the applied gate voltage, from +1.8V to -1.8V. The transmittance at S1 peak (1676nm) increased from 44% to 92%, while the S2 peak (932nm) varied from 51% to 68%. The IR at 3080nm decreased from 97% to 75%, at opposite direction to the S1 peak modulation. 10
10 Reproduced in part with permission from [Z.Wu et.al, Science 305, 1273-1276 ] Copyright [2004] AAAS
48

Figure 3-6. The resistivity of the nanotube film as a function of the applied gate voltage11
11 Reproduced in part with permission from [Z.Wu et.al, Science 305, 1273-1276 ] Copyright [2004] AAAS
49

Figure 3-7. The transmittance at S1, S2 and M1 depends on the gate voltage. 12
12 Reproduced in part with permission from [Z.Wu et.al, Science 305, 1273-1276 ] Copyright [2004] AAAS
50

Figure 3-8. Time drive of the S1 transmittance peak with +/- 1V gate voltage.
51

52
CHAPTER 4 OHMIC CONTACT COUPLING CARBON NANOTUBE FILM TO P-GALLIUM NITRIDE
We have demonstrated that the SWNT film is a new type of conducting, transparent, Fermi
level shiftable electrode material. These features of the SWNT film lead us to test their ability to
incorporate into optoelectronic devices as transparent electrodes through which the charges
transferred across the interface of the nanotube film and the semiconductors. It is well known
that when two distinct materials come into intimate contact with each other, there will be energy
barriers across their interface. Such energy barriers possess a height and a width (depletion
width, into both side of the physical interface). To first order, in the Schottky-Mott model the
height will be determined by the energy band alignment of the two materials while the width of
the associated depletion region on each each side will be governed by the height of the barrier
and the carrier density of that material. For metal-metal contact, since the electron density is so
high, the barrier will be negligible because the barrier width is very thin at both sides to tunnel
through. In metal semiconductor contacts in contrast the carrier concentration of the
semiconductor is so much lower compare to that of the metal, that the depletion width on the
semiconductor side can be very wide (up to microns), resulting in an insurmountable barrier to
charge transport across the junction. Schottky barriers can be useful for example as in Schottky
diodes as well as Schottky FETs, But for most semiconductor devices, an Ohmic contact (with
negligible barrier height and/or width) is preferred since the efficiency of charge transfer across
the metal semiconductor interface is of priority. Ohmic contact causes less energy to be
dissipated at the junction in terms of charge injection or extraction.
Wide band gap semiconductors, such as GaN are very useful in making visible LED as
well as high temperature operation applications. The band gap of the semiconductor is wide such
that the p-band of the semiconductor is far away (greater than -7eV) from the vacuum level. The

work functions of most metals are less than 5.5eV, which makes it difficult to make ohmic
contact with the p-band, resulting in a barrier for charge transfer into the p-band. There is a need
for a p-type transparent electrode which can ohmically couple to p-GaN. In this chapter, a GaN
LED device was demonstrated by using SWNT film to couple to the p-GaN side of the LED. The
contact resistance of the nanotube film to p-GaN versus the conventional metal contact to the p-
GaN was also compared.
4.1 GaN Light Emitting Diode Background
Gallium nitride (GaN) is a wide band semiconductor with a 3.4eV band gap and 4.1eV
electron affinity. This means the valence band lies at 7.5eV. Since the p-GaN is p doped it’s
Fermi level lies near this valence band edge meaning that Ohmic contact requires a metal with a
work function approaching the valence band edge. Most metals however have a work function
less than 5.5eV. This remains a technical challenge for wide band gap semiconductors. It is well
known that if the contact barrier between metal and semiconductor is high, it requires higher
voltage to overcome the high contact barrier, resulting in overheating, low efficiency and
electromigration. An approach to make ohmic contact to semiconductors is by heavily doping a
thin buffer layer right at the interface to reduce the barrier width, which will enhance the
probability for charges tunneling through the barrier. This additional layer however adds cost to
the device fabrication process.
A wide variety of metals and alloys have been explored for making low contact barrier and
therefore low contact resistance contact to p-GaN. These inclue Ni/Au, Ni, Au, Pd, Pd/Au,
Pt/Au, Au/Mg/Au, Au/C/Ni, Ni/Cr/Au and Pd/Pt/Au (26-28). Typically Ni, Pt, or Pd is the metal
in direct contact to p-GaN and the structure will be annealed at 400-750oC. This will produce a
contact resistance in the range of 10-1-10-3 Ω cm2. Higher annealing temperatures can degrade
metal contacts, usually because they will react with GaN to form metal gallides.
53

54
In order to observe the light produced in the LED structure, transparent conducting
contacts are needed. Indium tin oxide (ITO) has been a candidate however, ITO shows rectifying
behavior on p-GaN, and is more commonly used as the n-GaN contact.
One of the failure modes for the electronic device is the electro-migration of the metal
contacts into the semiconductor. Typically, it requires 1-3eV to remove one metal atom from the
bulk, compared to 7eV to remove one carbon atom from nanotubes tightly bound lattice.
Furthermore, the entire carbon nanotube is simply too large to migrate. Thus, with SWNT film as
the electrode, there will be no electro-migration problem.
From chapter 2, we already learned that the thin nanotube film is transparent all the way
from UV to infrared. The GaN LED will emit light at 434nm, where the transmittance for a
100nm thick carbon nanotube film is ~60% (thinner film will be more transmissive but at the
price of lower conductance).
4.2 Experiments Details for Fabricating SWNT Film Based GaN LED
This research was carried out with collaboration with Dr. Lee, Dr. Ren and Dr. Pearton
from material science and engineering department, University of Florida. First, metal organic
chemical vapor deposition (MOCVD) method was used to grow n-GaN followed with p-GaN on
c-plane sapphire substrate. A 100nm thick carbon nanotube film was deposited on top of p-GaN,
covering the entire surface of the sample. Once the nanotube film was attached to the p-GaN, the
assembly was first dried and annealed at 600oC for 6 hours in argon to remove any residual
cellulous ester. Thermally deposited Ti/Al/Pt/Au, Pd/Au, or Pd was patterned by a standard e-
beam lift-off process and a mesa was formed by Cl2/Ar inductively coupled plasma ethching to
expose the n-GaN side of the device. The nanotube film was simultaneously patterned by this
standard e-beam lithography process. Annealing of the device was carried out under nitrogen

environment for one minute, at 700oC. The whole structure of the diode is illustrated in Figure 4-
1.
4.3 Results
4.3.1 Contact Resistance
In order to investigate the contact resistance of the carbon nanotube film/ p-GaN interface,
the carbon nanotube film was deposited on single layer p-GaN on sapphire substrate. The
transmission line method (TLM) was used to determine the contact resistance of the nanotube
film/p-GaN contact resistance (29). The control devices of the conventional Ni/Au metal
contacts on p-GaN were also fabricated. Upon fabrication, the conventional metal contact is non-
Ohmic, while the as deposited carbon nanotube film contact was Ohmic with a resistance of 0.12
Ohm·cm2. After 500oC annealing in nitrogen for one minute of rapid thermal anneal (RTA), the
resistance of the conventional metal became 0.033 Ohm cm2, while for the carbon nanotube film
structure after a 700oC RTA the contact resistance was 0.011Ohm cm2, a factor of 3 smaller than
that of the conventional metal. This data is summarized in Table 4.1. The annealing temperature
was optimized for least contact resistance for the different devices. It is worth while to note that
the carbon nanotube film itself is very conducting. There is another layer of metal film at the
corner of the nanotube film, which makes the electrical connection to the device, as illustrated in
Figure 4-1. The contact resistance between the metal film and carbon nanotube is negligible, two
orders of magnitude smaller (after annealing) compare to the contact resistance between
nanotube film and p-GaN. The measurement of the contact resistance of as deposited metal
Ti/Al/Pt/Au on the carbon nanotube is 5.3X10⁻³ Ω cm2 , reducing to 1.3X10⁻⁴ Ω cm2 after the
700oC RTA.
The lowest contact resistance of the conventional metal was achieved at the annealing
temperature of 500oC, while the lowest contact resistance of the nanotube film/p-GaN was
55

achieved at 700oC, The latter temperature was tried with the metal contact but at 700oC, the
conventional metal was severely degraded through the reaction of the metal to the GaN. Thus,
excellent thermal stability is another advantage of the nanotube film, an important feature in
order to achieve the lowest contact resistance which also adds simplicity to the whole device
fabrication since it can tolerate higher temperature required for n-GaN patterning and RTA
treatment.
4.3.2 I-V Characteristic of Carbon Nanotube Film/p-GaN
In order to investigate whether different metal contacts to the nanotube film will change
the overall LED performance, we measured I-V characteristics of the junction with different
metal contact pads. In all cases, the junctions showed rectifying effects, as expected. They all
show similar forward and reverse current. However as shown in Figure 4-2 there were subtle
differences depending on the metal used, likely due to a Fermi level equilibration between the
nanotubes and the distinct metals used.
The GaN LED emitted blue light at 434nm, as shown in the spectrum of Figure 4-3 and a
picture of the actual device glowing light in Figure 4-4.
4.4 Discussion
First of all, why will the RTA process improve the contact in both cases? For the metal
semiconductor interface, contact resistance improvement upon rapid thermal annealing results
from the surface atoms will gaining enough energy at high temperature to rearrange themselves
and lower the overall surface energy. On the other hand, for nanotube film/p-GaN, it is very
likely that upon rapid thermal annealing, the surface atoms of the GaN rearrange themselves and
more carbon nanotube come in intimate contact to the p-GaN, so that the actual contact area
between nanotube film and p-GaN increases, hence lowering the contact resistance.
56

Secondly, the Fermi level of the carbon nanotube lies at about 5eV, which is 2.5eV away
from 7.5eV, where the p-GaN valence band sits which should result in a large barrier. Hence the
question becomes why do nanotube films provide a good ohmic contact p-GaN? The most likely
reason is that the carbon nanotubes posses a low density of states permitting large shifts in their
Fermi-level. As shown in Chapter 3 under relatively low voltages (1.8 V) the nanotube Fermi
level could be shifted 0.9eV. Upon applying an appropriate voltage, the Fermi-level shift lowers
the contact barrier for hole injection into the p-GaN. Note that the nanotubes provide a very
unconventional metal in this respect. For conventional metals, which have three dimensional
density of states, and very high carrier density, the shift of the Fermi level at low biased voltages
is negligible.
4.5 Conclusion
Low contact resistance was achieved by using single walled carbon nanotube films coupled
to the p-GaN. The SWNT film’s thermal stability simplifies the LED manufacturing process by
allowing the n-GaN RTA process with the SWNT film in place. The contact resistance is 3 times
smaller than the conventional metal after 700oC RTA in N2 for 1min. This SWNT film provides a
new class of p electrodes to all the high work function p type semiconductors. The tight bonding
of the carbon atoms in the nanotube implies that the principle cause of lifetime degradation in
these devices: electromigration, will simply not occur when nanotubes are used for electrical
contact to the devices.
The mechanism we propose for SWNTs making ohmic contact to high work function
semiconductors is due to the limited density of states of the one dimensional carbon nanotubes.
This enables one to shift the Fermi level up by several electron volts upon applying a small
voltage, to accommodate the large p-band of the semiconductor. The side wall of the nanotube
57

prevents any covalent bonding between nanotube to the semiconductor, which allows this Fermi
level shifting to happen without so called Fermi level pinning.
58

Table 4-1. Contact resistances of Ti/Al/Pt/Au on carbon nanotubes, carbon nanotube film on p-GaN, and standard Ni/Au on p-GaN13
Specific contact resistance (Ω cm2)
Structure 700oC, N2, 1min annealing As prepared (no annealing)
Ti/Al/Pt/Au on carbon
nanotube film 1.31X10⁻⁴ 5.4X10⁻³
Carbon nanotube film/p-GaN 0.011 0.12
Ni/Au/p-GaN 0.033 after 500oC annealing Non-Ohmic
13 Reproduced in part with permission from [Lee, K. et.al, Nano Lett. 4(5), 911-914] Copyright [2004] American Chemical Society
59

GaN
Ti/Al/Pt/Au
SWNT 3.4
7.5
4.1
Figure 4-1. Schematic view of the GaN based light-emitting diode using SWNT film as the p-Ohmic contact.14
14 Reproduced in part with permission from [Lee, K. et.al, Nano Lett. 4(5), 911-914] Copyright [2004] American Chemical Society
60

Figure 4-2. IV characteristics of GaN LED with different metal, i.e. Ti/Al/Pt/Au, Pd only and Pd/Au contact on carbon nanotube fim. All the devices are using carbon nanotube film as the p-GaN contact. 15
15 Reproduced in part with permission from [Lee, K. et.al, Nano Lett. 4(5), 911-914] Copyright [2004] American Chemical Society
61

Figure 4-3. Emission spectrum of the GaN LED with injection current 0.1mA16
16 Reproduced in part with permission from [Lee, K. et.al, Nano Lett. 4(5), 911-914] Copyright [2004] American Chemical Society
62

Figure 4-4. Picture of the visible emission from the GaN LED with carbon nanotube film as the p-GaN contact electrodes.17
17 Reproduced in part with permission from [Lee, K. et.al, Nano Lett. 4(5), 911-914] Copyright [2004] American Chemical Society
63

CHAPTER 5 ORGANIC LIGHT EMITTING DIODE WITH SWNT FILM AS ANODE
5.1 Introduction
We have demonstrated the ability for the SWNT film to ohmically couple with inorganic
semiconductor GaN. It is natural to test if SWNT film will be a good candidate for coupling to
organic semiconductors, since organic optoelectronic devices have drawn considerable attention
due to their ease of process and low cost (30-33).
Indium Tin Oxide (ITO) is presently the transparent electrode used in most OLED devices.
However as a rigid oxide material ITO has limited flexibility before it breaks hence it excludes
the possibility of flexible/foldable displays. Carbon nanotube films in contrast (deposited on
flexible substrates, such as Polyethylene terephthalate, or PET) can be bent indefinitely without
damage making them excellent candidates for flexible display applications. Additionally the
SWNTs possess an extreme chemical tolerance making them compatible with virtually any
process step that might be required in OLED fabrication.
5.2 MEH-PPV
In order to test if SWNTs integrate well with organic light emitting devices, it is wise to
choose a widely used organic material to start with. After consulting with Dr. Reynolds from
Chemistry Department of University of Florida, Poly[2-methoxy-5-(2'-ethyl-hexyloxy)-1,4-
phenylene vinylene] (MEH-PPV) was chosen as the candidate polymer in our first trial OLED
devices. Because MEH-PPV has been fully studied, it is easy to process, commercially available,
air stable and its electroluminescent emission is in the visible range (32).
The structure of MEH-PPV is shown in Figure 5-1, along with the illustration of the layer
by layer OLED structure. The MEH PPV initially used for this study was synthesized by Dr.
64

Reynolds’ group. Later we also used a batch purchased from Aldrich. This work was done in
close collaboration with Dr. Jeremiah Mwaura from Dr. Reynolds’ group.
5.3 Experimental Details
MEH-PPV was dissolved with dichloroethene over night at room temperature, with a
concentration of 5mg/ml. The solution was constantly stirred with a stir bar to help fully dissolve
into the polymer. Before using the dissolved polymer solution, it was filtered with a syringe filter
of 5μm pore size to remove un-dissolved polymer and large impurity particles. After filtering,
the solution was spin casting onto nanotube film at 1000rpm for 45second, which resulted in a
film with thickness in the range of 60-100nm. The MEH PPV film thickness was estimated based
on the thickness of the same polymer concentration prepared under the same conditions on an
ITO substrate. The nanotube film surface is much rougher compare to that of ITO/PEDOT PSS,
which made the polymer film thickness measurement difficult. The MEH PPV film thickness on
SWNT will be discussed further when we get to the wetting issue of MEH PPV on SWNT.
A SWNT film with a 50nm thickness was deposited onto a one inch square microscope
glass slide substrate. All the substrates were cleaned with acetone and methanol and then rinsed
with DI water prior to deposition of SWNT films. At the same time, control devices with ITO as
the anode were fabricated side by side as the SWNT film based devices. ITO coated glass was
plasma cleaned and spin coated with 100nm of PEDOT PSS as the buffer layer, baked at 150oC
in vacuum oven for 2 hours to remove excess water from the PEDOT PSS layer.
After spin coating the MEH-PPV, a cathode consisting of 10nm of calcium and 150nm of
aluminum was thermally evaporated onto the MEH-PPV through a shadow mask. Before the
evaporation of the cathode, the sample was vacuum degassed in the vacuum (2H10-7torr)
deposition chamber over night to allow the solvent to fully evaporate. The area of the cathode
(through the shadow mask) defines the area of the working OLED. The illustration of the OLED
65

is shown in Figure 5-1. Once the device was taken out of the vacuum chamber it was
immediately coated using 5minute epoxy to prevent oxidation of the calcium electrode greatly
shortening the device life time.
5.4 Discussion
Since the working polymer is on the order of 100nm thick, the cleanliness of the substrate
and the polymer solution are crucial to the successful functioning of the devices. Dust particles
are usually on the order of a micrometer. We fabricated 8 pixels on one glass substrate, only one
out of 8 pixels worked reasonably well, but with a dimmer glow than the ITO control device.
The only working pixel was also nonuniformly illuminated, visible to the naked eye when it was
turned on. The control ITO devices were much better: bright with all devices working. The fact
that there is one pixel working meant that the energy band alignment of the carbon nanotube film
with the MEHPPV was not the major problem. The nonuniformity in the light of the working
pixel indicates there may be intrinsic nonuniformity to start with in the nanotube film. This was
confirmed by the fact that the current is higher than that of the ITO device under the same bias
voltage but with lower light emission.
We performed transmission electron microscopy (TEM, JOEL 2010F) on the SWNT films
finding large micron scale particles. Furthermore using the energy dispersive X-ray spectrometer
(EDS) to analyze the chemical component of the particles, it was found that these were
principally made of principally calcium and magnesium. There were also smalled particulates
made of cobalt and nickel, the catalysts used in the growth of the SWNTs. The calcium and
magnesium contamination was initially mysterious until it was recognized that these were most
likely dust particles from the laboratory cement walls and floor, since these SWNT films were
prepared in the ambient laboratory environment. Additional cross flow filtration was done to the
66

stock nanotube solution to remove more of the residual catalyst particles. To avoid the dust
particles, a class 100 clean room was constructed in the laboratory for manufacture of the SWNT
films.
Once the SWNT films became cleaner, the fraction of nanotube based OLEDs that emitted
any light was greatly increased (~5 out of 8 pixels vs. less than 1 out of 8 previously) though the
performance of most of the nanotube devices was poor. The performance of a typical
ITO/PEDOT PSS OLED device current and radiance as a function of the applied voltage is
shown in Figure 5-2 (these did not vary much from device to device). The performance of one of
the best performing SWNT film based OLEDs is shown in Figure 5-3. Note that under the same
applied voltage, the radiance of the SWNT film based device was roughly one order of
magnitude less than the ITO/PEDOT PSS based device. A possible explanation for this poor
performance of the SWNT based devices is that while the steps taken above to improve the
purity of the films helped, there were still particles observed in the SWNT films. While not
generating dead shorts completely killing the major fraction of the devices these particles
generated high current regions that drew down the local potential across the other regions like a
voltage divider circuit. Alternatively or perhaps coinciding with this is the possibility that the
nanotubes were too efficient at hole injection into the devices. The resulting electron hole
imbalance then responsible for the poorer performance. The energy band alignment of the OLED
system is shown in Figure 5-4. We can see that the alignment of the PEDOT PSS to the p-band
of the MEH-PPV is better than that of the SWNT film. But since we have demonstrated the
ability of shifting the Fermi level of SWNT film, this mismatch in the energy band only requires
slightly higher applied voltage. On the other hand the most efficient OLEDs should have
balanced electrons and holes injected from both electrodes and recombine in the middle of the
67

electroluminescent polymer layer away from the luminescence quenching anode and cathode.
Most polymers, including MEH PPV, have much better hole mobility than electron mobility
(35). If we have indeed improved the hole injection from SWNT, say, much better than the
electron injection, that will result in luminescence quenching at the cathode.
5.4.1 MEH PPV does not Wet with SWNT
Further study revealed that the MEH PPV does not wet the SWNT surface. In order to take
advantage of the high surface area of the SWNT film, MEH-PPV was diluted to roughly 1/10 of
the original concentration. More over, the diluted MEH PPV solution was soaked for 30 seconds
to allow better penetration of the solution into the nanotube network, since the pore size of the
nanotube film was on the order of tens of nanometer. The spin casting procedure was repeated
for 10 times to compensate the diluted solution in order to obtain same polymer film thickness.
After spin casting, the MEH-PPV film looks nonuniform in color to the naked eye and the device
performance was poor.
In order to find out what was the cause of this nonuniformity, a regular concentration
solution was used and one drop of MEH-PPV solution was put on top of SWNT film. This
should gave a much thicker film since during the spin casting process, the majority of the
solution will be spin off the substrate. When the solvent began to evaporate, the wetted drop area
became smaller, leaving behind no sign of MEH-PPV coated on SWNT film from regions where
the drop had wetted the film. Since the MEH PPV has orange color, it can be easily identified if
there is a coating on the nanotube film. When the solvent had fully evaporated, the MEH-PPV
had all accumulated at the center of the drop with a much smaller area than the initial MEH-PPV
solution drop area. This leads to the conclusion that MEH PPV polymer itself has little affinity
for the carbon nanotube surface. Poor wet ability will result in less contact area between the two,
causing charge injection problems.
68

5.5 Conclusion
SWNT film as anode for making MEH-PPV organic LED was successfully manufactured
and compared with ITO/PEDOT PSS based devices. The radiance of the nanotube based device
was one order of magnitude lower than the ITO/PEDOT PSS based device. The possible reason
of wet ability of SWNT film to MEH PPV has been suggested and further work is necessary to
determine the cause of the poor performance.
69

PEDOT PSS
ITO
MEH PPV
Glass
Al Ca
MEH PPV SWNT
Glass
Ca Al
Figure 5-1. A) Structure of MEH-PPV (top) and B) Illustration of the OLED device with ITO/PEDOT PSS as anode (middle) C) OLED device with SWNT film (bottom)
70

3mm
Figure 5-2. ITO/PEDOT PSS based OLED radiance and current vs. voltage
71

Figure 5-3. SWNT film based OLED radiance and current vs. voltage
72

73
5.3 5.2
Ca (2.9)
Vacuum level
ITO / PETDOT PSS
ΦAl
ΦITO Al (4.3) 3.2
ΔEe
SWNT shiftable MEH-PPV
Figure 5-4. Illustration of the energy band alignment of the OLED devices.

CHAPTER 6 CARBON NANOTUBE/SILICON HETEROJUNCTION
6.1 Introduction about Schottky Barrier
The metal semiconductor heterojunction plays an important role for all semiconductor
devices. The transport across the metal semiconductor junction is determined by the contact
barrier height. For ideal situation, without surface states, the barrier height is given by the
difference of the metal work function and the electron affinity of the semiconductor (for n-type
semiconductor), this is called the Schottky-Mott limit (37). The flat band model illustrates the
contact barrier height in Figure 6-1. When the metal and semiconductor come into intimate
contact, the Fermi level across the interface will be lined up. Since the semiconductor has higher
electron affinity in Figure 6-1, electrons will flow from semiconductor to the metal until thermo
dynamic equilibrium was achieved. The Fermi level in the semiconductor side will be lowered
by an amount equal to the difference of their work function. The negative charge transferred
from the semiconductor will build up in the metal side and the equal amount but opposite sign of
the charges will be built up in the semiconductor side. Since the density of electronic states of the
semiconductor usually is lower compare to that of the metal, this positive charge will be
distributed over a region called depletion region (since oppositely charged majority carriers are
neutralized there). The width of this depletion region will be determined by the doping level of
the semiconductor and the amount of charge transferred. A small barrier height and narrow
depletion region results in what is called Ohmic contact. A large barrier height and large
depletion region will give rectifying behavior. For simple electrical contact purposes, an Ohmic
contact is preferable for better transport across the junction. A contact barrier in contrast will
consume power and generate heat. As the device size shrinks and device density increases in
integrated circuits, heat dissipation becomes a problem.
74

According to experimental measurements, flat band model usually does not work. Most
metals will form covalent bonds with semiconductor surfaces. This covalent bonding will add
intermediate states in the band gap of the semiconductor. This is the reason why the contact
barrier height is not sensitive to the work function difference between metals, a phenomena
called Fermi level pinning (38-40), widely observed in semiconductor/metal contacts.
Given the demonstrated ability to modify the Fermi level in chapter 3, the idea described
here was to form a sort of transistor based on modulating the Schottky barrier contact between
SWNTs and a doped semiconductor (silicon). Figure 6-2 illustrates the relevant features needed
for such a device, in which there is a SWNT/Si interface (called the Source), an Al/Silicon ohmic
contact (serving as the Drain), and a strip of Pd thin film sitting on top of SiO2 that will act as the
gate contact to an electrolytic gate in electrolytic contact with the nanotube film/Si surface. Since
the Schottky barrier depends on the Fermi level offset, if one modifies the Fermi level, the
current passing through the junction will be modulated as well.
6.2 Experimental Details of SWNT/p-Si Heterojunction
Lightly (with resistivity 2-10 Ohm cm) and heavily (<0.005 Ohm cm) Boron-doped silicon
with thermally grown 250nm oxide was purchased from Silicon Quest International and diced
into 20 H30mm2 pieces. The surface of the silicon substrate was cleaned with Acetone, methanol
alcohol and DI water. To construct the device shown in Figure 6-2, a thick layer of photoresist
was painted with one window of 2H4mm2 and 20H 7mm2 strip left unpainted, those area later
will be etched with hydrofluoric acid (HF), as explained in Figure 6-3 a). The fresh etched
silicon was rinsed with DI water and blow dry with nitrogen and immediately put into a high
vacuum chamber for thermally evaporating a 100nm aluminum (Al), to form an Ohmic contact
with the silicon, as explained in Figure 6-3b). The Al film was split into two in order to check the
contact resistance between Al and silicon. The resistance varies from several ohms to tens of
75

ohms depending on the doping level of the silicon. It is considered Ohmic contact due to the
large contact area (~100mm2) between the Al and silicon. Also shown in Figure 6-3b) is the two
Pd film pads thermally evaporated through a shadow mask, with one pad next to the silicon
window, being careful to avoid any direct contact with the bare silicon. The other Pd bar is
parallel to the first one, and will be served as the gate electrode.
A 50nm thick nanotube film (3*10mm) was transferred across onto the exposed silicon
window, with 2mm overlap the Palladium bar very next to this Si window, as illustrated in
Figure 6-3c). A small well (not shown on the figure) made of poster putty was built around the
nanotube film and the gate electrode, and several drops of ionic liquid, EMI-BTI were put into
this well to make the source and gate electrode both immersed inside the ionic liquids. The
electrical connections to all three electrodes (Source, Drain and Gate) are connected through the
gold wire pressed with fresh cut indium dot onto the corresponding metal films. The circuit
diagram is illustrated in Figure 6-4, where a source drain voltage is applied. We keep the source
drain voltage as a constance vary the gate voltage to see the current change as a function as the
gate voltage.
6.3 Results of SWNT/p-Si Heterojunction and Discussion
The I-V characteristic as a function of gate voltage for both highly doped and lightly doped
silicon was measured. The source drain voltage held constantly at 0.1V, by changing the gate
voltage from -0.7V to +0.7V, the source drain current was recorded. For lightly doped silicon (2-
10 Ohm cm), the gating effect is obvious. When the gate voltage was varied from -0.7V to
+0.7V, the source drain current dropped from 128μA to 3.5μA, a factor of 36 times smaller, as
shown in Figure 6-5. While the heavily doped silicon device source drain current reduced from
256μA to 25μA, a factor of 10 times change, less than the lightly doped silicon device.
76

In Figure 6-6, the gate voltage was held at a constant value while measuring the source
drain current as a function of the source drain voltage, both for lightly doped silicon (top) and the
heavily doped silicon (bottom). When the gate voltage is zero, the IV curve showed rectifying
characteristic, indicating there is a barrier at the carbon nanotube silicon interface. When we
apply positive gate voltage, the transport gets reduced. When negative gate voltage is applied,
the current increased, both in the forward and reverse direction. The increase in the forward
direction is much more obvious. When the gate voltage increased to negative 0.7V, the reverse
direction current gets significantly increased.
The gating effect is explained as the following two reasons. First let’s explain from the
energy diagram, as illustrated in Figure 6-7. When the gate voltage is zero, there is a built in
potential barrier right at the SWNT/p-Si junction because of the difference in the Fermi level of
the SWNT and the silicon. Upon applying negative gate voltage, the source is relatively positive,
move the Fermi level of the SWNT downward on the Figure 6-7 energy diagram. This will make
the energy alignment between carbon nanotube and silicon valence band better, or in other
words, reduce the barrier at the interface. The second reason comes from the carrier
concentration change upon application of gate voltage. When the negative gate voltage was
applied, the source electrode was positive relative to the gate electrode. It draws negative ions in
the ionic liquid to the vicinity of the carbon nanotube. Since the carbon nanotube is in intimate
contact with the silicon surface, that excess amount of negative charge near the silicon surface
will increase the positive carrier concentration inside silicon locally, which will result in a
thinner barrier region for better injecting charge from the nanotube to silicon and vice versa. The
positive gate voltage will do the reverse to the negative gate voltage.
77

After continuously applying the gate voltage for 5 hours, the source drain current reduced
dramatically, as shown in Figure 6-8. This might because when the gate voltage is applied, the
silicon surface will attract ionic liquid and those ions will lift the nanotube from intimate contact
with the silicon surface, hence reducing the effective contact surface between nanotube and
silicon.
Double gating structure (also being illustrated in Figure 6-2) was also explored, in which
case another SWNT/p-Si junction replaced the Si/Al drain. The fabrication process is very
similar to that of the single gate device. This is a symmetric device, with the gate on source and
drain can be independently modulated. When two identical gate voltages were applied for source
gate and drain gate, the source drain voltage was kept at constant of 0.1V. The source drain
current can be modulated more than 300 times when the gate voltage changed from positive 0.7V
to negative 0.7V, as shown in Figure 6-10. When the source junction and the drain junction
working simultaneously to be open or close so that the source drain current on/off ratio is much
bigger than the single gate device, which is 36 times modulation for the lightly doped device. In
contrast, the single junction device will have the drain (Al/Si ohmic contact) always turned on.
Finally we studied the ambient environment influence on the transport across the carbon
nanotube silicon heterojunction. According to our observation, the current across the nanotube
film/ silicon junction will stabilize when the sample was left in any of the following environment
more than half an hour. We have tested air, oxygen, argon or under Vacuum. But upon ambient
environment change, the current will have a sudden change, as illustrated in Figure 6-10 and
Figure 6-11. In Figure 6-10, it showed the current suddenly reduces when the device is stabilized
in argon upon exposure to oxygen. While in Figure 6-11, when the device was stabilized in argon
with a stabilized current, a bigger drop in current will occurred immediately upon exposure to
78

oxygen. This can be explained by the oxygen playing an important role in the charge transfer
process between the interface of carbon nanotube and silicon. It is very likely water vapor in air
also contribute to the charge injection across the interface (42).
6.4 SWNT/n-Si Photovoltaic Device
We just demonstrated the ability to electrochemically shift the Fermi level of the SWNT
by applying a gate voltage relative to the SWNT with ionic liquid as the electrolyte. We can
modulate the current across the SWNT/p-Si interface. On the other hand, if we investigate the
SWNT/n-Si interface, there will be a bigger barrier compare to SWNT/p-Si, according to the flat
band model. Since the SWNT films are transparent, this barrier will be useful for photovoltaic
application. This is a Schottky barrier type photovoltaic device, since the SWNT film can be
regarded as a conducting film.
Because the Fermi level in the n-Si is higher than that of the SWNT, silicon will donate
electrons to SWNT to reach an equilibrium state. As a result, there will be a depletion region in
silicon near the interface. As we know, when the light incident onto that interface, the photon
will be absorbed by the semiconductor and the energy will be transferred as the exciton—the
electron hole pair. This light absorption will mainly happen in the silicon depletion region. The
depletion region is extended from SWNT side to the silicon side. The width of the depletion
region at each side was determined by the carrier concentrations of the SWNT and the n-Si. The
product of the two (carrier concentration and the depletion width) at SWNT and n-Si side will be
equal to each other. The built in electric field inside the depletion region will separate the
electron and hole, driving the holes goes toward the SWNT side and electrons goes to the silicon,
then passing through the ohmic contact, going out to the external circuit.
79
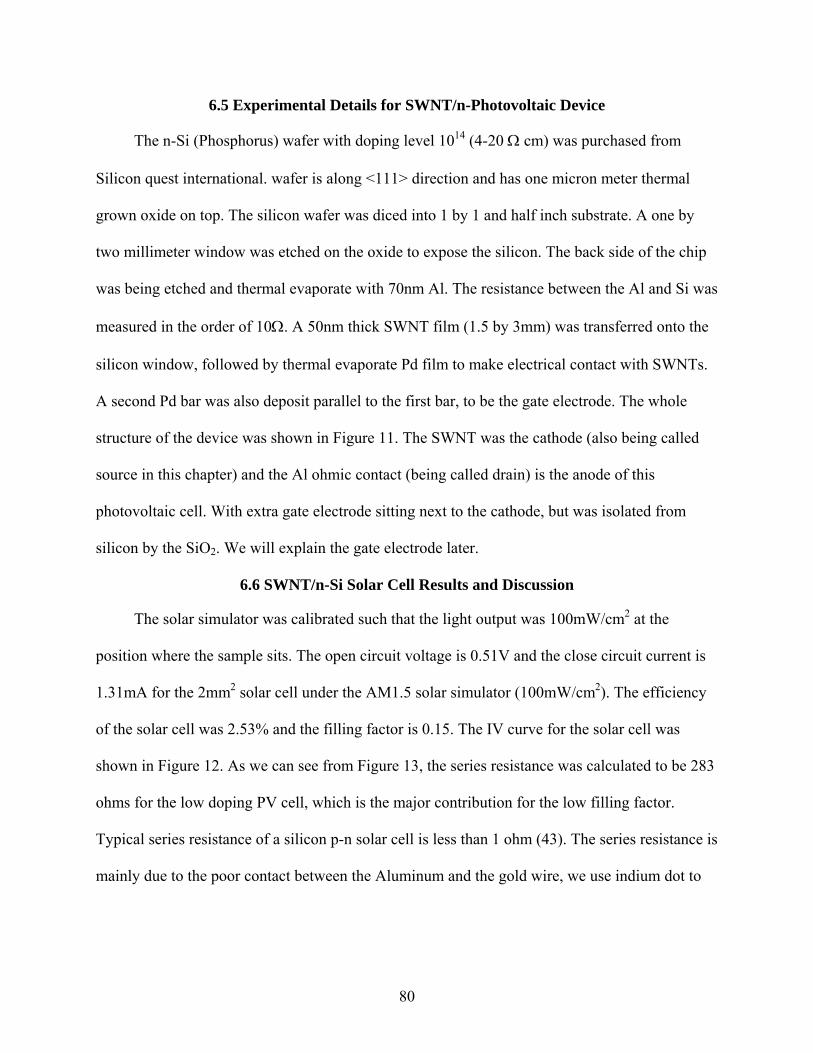
6.5 Experimental Details for SWNT/n-Photovoltaic Device
The n-Si (Phosphorus) wafer with doping level 1014 (4-20 Ω cm) was purchased from
Silicon quest international. wafer is along <111> direction and has one micron meter thermal
grown oxide on top. The silicon wafer was diced into 1 by 1 and half inch substrate. A one by
two millimeter window was etched on the oxide to expose the silicon. The back side of the chip
was being etched and thermal evaporate with 70nm Al. The resistance between the Al and Si was
measured in the order of 10Ω. A 50nm thick SWNT film (1.5 by 3mm) was transferred onto the
silicon window, followed by thermal evaporate Pd film to make electrical contact with SWNTs.
A second Pd bar was also deposit parallel to the first bar, to be the gate electrode. The whole
structure of the device was shown in Figure 11. The SWNT was the cathode (also being called
source in this chapter) and the Al ohmic contact (being called drain) is the anode of this
photovoltaic cell. With extra gate electrode sitting next to the cathode, but was isolated from
silicon by the SiO2. We will explain the gate electrode later.
6.6 SWNT/n-Si Solar Cell Results and Discussion
The solar simulator was calibrated such that the light output was 100mW/cm2 at the
position where the sample sits. The open circuit voltage is 0.51V and the close circuit current is
1.31mA for the 2mm2 solar cell under the AM1.5 solar simulator (100mW/cm2). The efficiency
of the solar cell was 2.53% and the filling factor is 0.15. The IV curve for the solar cell was
shown in Figure 12. As we can see from Figure 13, the series resistance was calculated to be 283
ohms for the low doping PV cell, which is the major contribution for the low filling factor.
Typical series resistance of a silicon p-n solar cell is less than 1 ohm (43). The series resistance is
mainly due to the poor contact between the Aluminum and the gold wire, we use indium dot to
80

make connection between the gold wire and the aluminum back contact. Improvement for
reducing series resistance is under way, including using higher doping n-Si.
As we know, the Fermi level of the nanotube can be readily shifted. Since the open circuit
voltage of the solar cell was depend on the built in potential and that was determined by the
Fermi level difference between the metal and the semiconductor. As we have demonstrated in
the SWNT/p-Si interface, we can modulate the transport across the interface by applying a gate
voltage. We use the same idea to test the gate field on the solar cell.
As we illustrated in the layout of the device, there is a gate electrode sitting parallel to the
source electrode (the SWNT film). The gate electrode was isolated from the silicon by the oxide
layer underneath it. We put a drop of ionic liquid EMI-BTI on top of the SWNT and gate
electrode.
We apply a gate field between the gate electrode and the drain electrode. This gate field is
provided with a battery, with floating ground. When the gate is connected to the drain, without
additional battery, we call that 0V. When the gate is applied with a negative potential, we call it
negative gate voltage. In Figure 6-14, we showed the IV characteristic under different gate bias.
As we can see, the positive gate voltage will decrease the solar cell efficiency, both decreasing
the open circuit voltage and the close circuit current. While with a negative gate bias of -0.3V,
the open circuit voltage will slightly increase from 0.52V (when 0V gate bias was applied) to
0.548V. When the gate voltage increased to -0.45V, the open circuit voltage remains at 0.548V.
Further increase the gate voltage to -0.6V, the open circuit voltage starts to drop back to 0.528V.
We only tested up to this value because we need to keep the gate bias below the redox voltage. It
is clear that the overall efficiency for this solar cell was best when the gate voltage is -0.45V and
81

followed by -0.3V and -0.6V, all of which are better than that of the 0V. The efficiency under 0V
bias is better than that of open circuit.
The explanation is as follow. When the SWNT was in contact with n-Si, the Fermi level of
the SWNT was lie below that of the n-Si, as shown in Figure 6-16. The electron from the silicon
side will donate to the SWNT, forming a depletion region and a built in potential. That forms a
Schottky barrier type solar cell. When we apply a positive gate field, the gate electrode will be
positive compare to 0V situation. That positive potential on the gate electrode will attract
negative ions from the ionic liquid EMI-BTI, as a result, the SWNT will be surrounded by net
positive ions. The relative potential of the SWNT will be negative, which shifts the Fermi level
of the SWNT up, making the built in potential for the solar cell smaller. On the opposite
situation, when the negative gate voltage was applied, the opposite situation will happen. This
explains why negative 0.3V gate voltage will increase the open circuit voltage of the solar cell.
However, as the Fermi level moves further down when the gate electric field gets more negative,
the Fermi level will move below the p-band of the silicon, which will form a barrier for the holes
to across that barrier. This was illustrated in Figure 6-17, in which the blue line shows this
situation.
6.7 Conclusion on SWNT/p-Si Heterojunction and SWNT/n-Si Solar Cell
This chapter explored the SWNT/Si heterojunction behavior and we investigated the gate
effect of that transportation.
The heterojunction between SWNT and p-Si was explored. The transport can be tuned by a
factor of more than 300 when applied a gate voltage of ±0.6V. Such an obvious gating effect was
due to the following two reasons: (1) the limited available electronic states of the SWNT making
the Fermi level shift feasible upon applying a small gate potential; (2) the porosity of the SWNT
82

film allow ions get access to majority of the nanotube which reduces the distance between the
counter electrode, enhanced the gating effect.
The SWNT/n-Si solar cell showed an efficiency of 2.53% and the filling factor was 0.15.
The IV characteristic was changed when the gate voltage was applied, which agrees well with
what happened in the SWNT/p-Si case. The gate field changed the Fermi level of the SWNT
hence changed the performance of the SWNT/n-Si solar cell.
The variable contact barrier was demonstrated by Lonergan et al in 1997 (41). Lonergan’s
experiment use a hybrid of inorganic-organic, n-Indium Phosphide | poly (pyrrole) | nonaqueous
electrolyte architecture. By applying a potential through the gate electrode, the permeate network
of conjugated polymer allows the electrolyte to access and enable electrochemical tuning of the
contact barrier between the n-Indium Phosphide and poly (pyrrole) for 0.6V. The disadvantage
of this system is that the polymer is air sensitive and thus prone corrosion. So it has to be carried
out in a glove box and by using nonaqueous electrolyte to eliminate the possible corrosion.
Our carbon nanotube films are an air stable, open, conductive network. More over, the
graphene wall of the carbon nanotube is very stable and known not to easily form covalent
bonding. Plus we already demonstrated that the Fermi level of the nanotube is readily shiftable in
previous chapters. All of the above make nanotube films very desirable for studying
heterojunction properties.
83

X d
qφB
EFm
qφm
qχ
EC EFs
Vacuum
EV
Schottky Barrier Flat band model
Figure 6-1. Flat band model of contact barrier and Schottky barrier height
84

Pd pad
Drop of ionic liquid (EMI:BTI)
Al Ohmic Contact
SWNT film
SiO2
Gate
p-Si
Drop of ionic liquid
(EMI:BTI) Gate
SWNT film
p-Si
Pd pad
SiO2
Figure 6-2. Illustration of single gate and double gate of carbon nanotube/Si heterojunction
85

SiO2
Si a) Etch two windows down to bare Si, the rest is SiO2
Si
b) Deposit Pd and Al pads
Al Pd
SWNT Film
Ionic Liquid drop
c) Transfer SWNT Film and add a drop of ionic liquid coving source and gate electrode
Figure 6-3. Three steps explaining the SWNT/p-Si single gate heterojunction device fabrication
process
86

ISD
Drain
A drop of ionic liquid
VSD
Gate
SourcVSG
ISD
Sourc
Gate A drop of ionic liquid
VSG VSD
Gate
VDG
Drain
Figure 6-4. Circuit diagram of the single gate device (top) and double gate device (bottom).
87

Figure 6-5. Source drain current as a function of gate voltage for SWNT/Si heterojunction with
heavily and lightly doped p-Silicon. Over a course of +/-0.7V gate voltage, Isd modified 10 and 36 times, for heavily and lightly doped silicon, respectively.
88

-0.30 -0.15 0.00 0.15 0.30
-80
0
80
160
240
320I s
d (μ
A)
Vsd (V)
Vg= - 0.7V Vg= - 0.35V Vg= 0 V Vg= 0.35V Vg= 0.7V
-0.30 -0.15 0.00 0.15 0.30-600
-300
0
300
600
900 Vg= - 0.7V Vg= - 0.35V Vg= 0 V Vg= 0.35V Vg= 0.7V
I sd
(μA
)
Vsd (V)
A
B
Figure 6-6. IV characteristics of the SWNT/p-Silicon heterojunction at different gate voltage A)
Lightly doped p-silicon and B) heavily doped p-Si
89

p-Si 4.05eV
Al 4.28eV
1.12eV SWNT SWNT
Figure 6-7. Flat band model of modulating the contact barrier of SWNT/Si heterojunction by shifting the Fermi level of SWNTs.
90
4
8
12
16
-0.70 -0.42 -0.14 0.14 0.42 0.70
Vg(V)
Isd(
uA)
Figure 6-8. The current decreased significantly after 5 hour of continuously application of gate
voltage for the lightly doped silicon device. Same phenomena observed for heavily doped silicon device as well.
91

Figure 6-9. Double gating effect, with identical source gate and drain gate. Isd can be modulated
more than 300 times by applying gate voltage ±0.7V.
92

Figure 6-10. Carbon nanotube silicon junction current in argon environment will change upon introduce oxygen or air.
93

-1950
-1900
-1850
-1800
-1750
-1700
-1650
-1600
-1550
-1500
Ar 2hr
Ar 6hr
immed
. Exp
ose to
air
8min
13min
18min
23min
28min
back to
pumping
withAr
withAr, a
fter 2m
in
time, condition
Isd
(μA
)
Isd (μA)
Figure 6-11. Carbon nanotube silicon junction transpot vs different ambient condition.
94

holes R
SWNn-Si junct
/
ion
Gate on insulator
Al/Si back contact
A drop of ionic liquid
I +
load electrons
Figure 6-12. Circuit diagram of the boot-strap PV device
Gate Voltage
Pd pad
Al Ohmic Contact
SWNT film
SiO2
Gate
n-Si
Ammeter R
Light
95

Figure 6-13. I-V characteristic of the SWNT/n-Si solar cell, dark (top) and under illumination (bottom).
96

Figure 6-14. The series resistance was determined to be 283 ohm for low doping n-silicon solar cell.
97

Figure 6-15. IV characteristic for the solar cell under different bias
98

Figure 6-16. The close up of Figure 6-14, to show the open circuit voltage change under different gate bias.
99

1.12eV SWN
n-Si 4.05eV
Figure 6-17. Flat band model of gating effect for SWNT/n-Si junction (top) and illustration of
photovoltaic effect (bottom). The blue line illustrates the over-gated situation, where there is a barrier generated for the hole to transfer from the silicon to the SWNT.
Hole SWNT
Light
Barrier
Electron
100

Fermi level shift
qφB qφB
SWNT
Figure 6-18. Energy band alignment at the SWNT/n-Si interface before (red) and after (black and blue) gate voltage is applied. For the black and blue curve, we can see the built in potential is increased. However, the further increase the gate voltage will push the Fermi level of the SWNT too low, to generate a barrier for hole to transfer from Silicon to SWNT, reduce the charge harvest efficient.
101
CHAPTER 7
PATTERNING OF SWNT FILM
In order to use the SWNT films in devices, they will typically need to be patterned into
some desired shape. For film pattern dimensions bigger than a millimeter, it is easy to cut the
nanotube film on the membrane prior to transfer with scissors or a razor blade followed by
transfer of the shaped film. However, for sub millimeter dimension patterning, it is necessary to
develop some technique to form the desired pattern. In this chapter, we describe the techniques
for making such patterns with line width in the order of 100 μm. Standard lithography and e-
beam lithography method to produce fine line width down to 50 nm has been demonstrated by
another group (43). The majority content of this chapter was published as a US patent in 2007
(44).
7.1 Patterning of SWNT Film to Sub-Millimeter
The idea is to pre-pattern the filtration membrane within a manner that blocks the pores of
the membrane in the inverse pattern desired for the nanotube film, such that the nanotubes, when
they are vacuum filtered to the surface of the membrane only deposit in the non-occuluded
regions. As one implementation of this we used a solid ink printer (Xerox Phaser 8400) to
produce the pattern in the membrane. An example of this is the interdigitated pattern shown in
Figure 7-1, with line width about 100 μm and comparable spacing between the interdigital
fingers. The printer’s ink is a thermoplastic, which is a combination of waxes, polyethylene and
proprietary compounds who’s melting point was determined by experiment, to be about 90oC. To
form a patterned nanotube film the inverse pattern of that desired is first printed transparency
sheet (Phaser 840/850 standard transparency film). Transparency sheet is preferred to paper
because the wax spreads more on paper decreasing the resolution of the resulting pattern. The
transparency film is then placed (with printed pattern face down) into contact with the filtration
102

membrane, a cellulose ester membrane (Millipore, VCWP), on a hot plate set at a temperature
just above the melting point of the thermoplastic ink. The thermoplastic ink melts and is partly
transferred into the pores of cellulose ester membrane, filling the pores in the pattern that was
printed on the transparency sheet. The hotplate is turned off allowing the wax to solidify and the
membrane and transparency sheet are peeled apart. From here the film fabrication process and
the transfer to the desired substrate proceeds as normally. During the filtration the nanotubes are
not drawn to those part of the membrane where the pores have been plugged by the wax and in
fact the hydrodynamic force sweep the nanotubes away from those region to deposit only in
those regions where the pores have not been blocked. This can result in partial alignment of the
nanotube / bundles along the long direction of the edges between the blocked and unblocked
regions of the membrane. If the unblocked regions are narrow lines of order 100 μm the
nanotubes can end up preferentially aligned along the long direction of the line enhancing the
conductivity of the film along that direction. Since most application for the patterned nanotube
film will be to serve as electrodes for devices, this technique will result in the enhancement of
the conductivity along the direction where it is most needed. Note that the standard photo
lithography, e-beam lithography or plasma etching does not provide such advantage.
The limitation of this technique comes from the following two factors:
1. the resolution of the printer
2. the length of the nanotube and nanotube bundles
The first one is trivial. The second one is because once the line spacing gets too small,
there will be cross talk between adjacent lines. When one bundle or long nanotube was drawn
down onto the filtration membrane, it will lie parallel to the membrane surface, but will be more
or less random in plane. Once it lie perpendicular to the line direction, it will lie across the
103

spacing, even if that spacing was been plugged with thermoplastic and no flow rate. If the
numbers of such cross-talk nanotubes are small, we can pass through a high current between the
adjacent pattern to burn those nanotubes away. But once there are significant numbers of
nanotubes or nanotube bundles, as is the case when the pattern line and spacing are in the same
order as the average nanotube bundle lengths (tens of micron meters in our samples), the pattern
lines are no longer separated by the line spacing.
One issue of the above transfer method is that when the thermoplastic melts during the
transfer process, it tends to smear around, which will decrease the resolution of the pattern. We
solve this problem by pulling a vacuum while transferring the pattern. We clamped the
membrane and PET substrate, on which sits the thermoplastic pattern, to the filtration apparatus.
By applying a vacuum while adding hot water (slightly above the melting point of the
thermoplastic ink) to the top funnel. When the thermoplastic is melting, there is a suction force to
guide the melted thermoplastic to the corresponding position of the cellulous ester membrane.
The water was kept at the funnel, since the PET substrate will not allow water to follow through.
Once the thermoplastic pattern was transferred, we can replace the hot water with nanotube
solution, and remove the PET membrane, to allow the nanotube film to form onto the cellulous
ester membrane, with the desired pattern formed.
This is a simple and cost efficient technique to form coarse line width at the order of 100
micron meter, which is useful for many applications such as display purpose. However, nanotube
film can be patterned to submicron scale, which has been demonstrated by Dr. Ant Ural’s group
(ref). They use standard photo lithography as well as E-beam lithography showed line width as
thin as 50nm can be achieved.
104

105
Printed Pattern (reversed) Desired Pattern
Figure 7-1. Illustration of coarse patterning of interdigitated finger with line width 0.1mm

CHAPTER 8 SUMMARY AND FUTURE WORK
8.1 Summary
This dissertation provides a method to fabricate single walled carbon nanotube films and
pattern them down to less than 100nm thick line width. The electronic and optical properties of
the film with different film thicknesses have been studied. This SWNT film provides a new class
of conducting and transparent electrodes for optoelectronic devices, such as LED, photovoltaic
(PV) device, organic LED and organic PV.
An optical analogy based on carbon nanotube FET device was manufactured and
successfully demonstrated by applying a small gate voltage to shift the Fermi level of the SWNT
film about 0.9eV. Baking at 600oC and doping with nitric acid will de-dope and redope the
SWNT film, changing its transparency as well as its conductivity.
Several examples of using SWNT film as electrode to build optoelectronic devices were
shown. First, it was shown that by utilizing the SWNT film to form ohmic contact to p-GaN, it is
possible to light up the GaN LED. Then it is demonstrated SWNT film can be used as the anode
to fabricate MEH-PPV organic LED. Finally, the SWNT film silicon heterojunction was studied
and the transport across the heterojunction can be modulated by a factor of 300.
8.2 Future Work
As discussed in chapter 5, the OLED device still needs further study to improve the
efficiency, as well as the solar cell efficiency improvement in chapter 6. Other possible
applications include using the high surface area of the SWNT film to fabricate capacitors.
Another possibility is by using the nano scale pore size of the SWNT film to serve as a filter
membrane for exchanging the nano particles.
106

LIST OF REFERENCES
1. S. Iijima, Helical Microtubules of graphitic carbon. Nature 354, 56 (1991).
2. Ph. Avouris, T. Hertel, R. Martel, T. Schmidt, H.R. Shea, and R.E. Walkup, Carbon Nanotubes: Nanomechamics, Manipulation, and Electronic Devices. Applied Surface Science 141, 201 (1999).
3. S.J. Tans, A.R.M. Verschueren and C. Dekker, Room-temperature transistor based on a single carbon nanotube, Nature 393, 49 (1998)
4. A. Thess, R. Lee, P. Nikolaev, H. Dai, P. Petit, J. Robert, C. Xu, Y.H. Lee, S.G. Kim, A.G. Rinzler, D.T. Colbert, G.E. Scuseria, D. Tomanek, J.E. Fischer, & R.E. Smalley, Crystalline ropes of metallic carbon nanotubes. Science 273, 483 (1996).
5. J. Kong, N.R. Franklin, C.W. Zhou, M.G. Chapline, S. Peng, K. Cho, H.J. Dai, Nanotube Molecular Wires as Chemical Sensors, Science 287, 622 (2000)
6. K.H. An, S.Y. Jeong, H.R. Hwang, Y.H. Lee, Enhanced Sensitivity of a Gas Sensor Incorporating Single-Walled Carbon Nanotube-Polypyrrole Nanocomposites, Advanced Materials 16, 1005 (2004)
7. S Chopra, K McGuire, N Gothard, AM Rao, A Pham, Selective gas detection using a carbon nanotube sensor, Appl. Phys. Lett. 83, 2280 (2003)
8. J. Sippel-Oakley, H.T.Wang, B.S. Kang, Z.C. Wu, F. Ren, A.G. Rinzler and S.J. Pearton, Carbon nanotube films for room temperature hydrogen sensing, Nanotechnology 16 2218 (2005)
9. M.S. Strano, C.A. Dyke, M.L. Usrey, P.W. Barone, M.J. Allen, H. Shan, C. Kittrell, R.H. Hauge, J.M. Tour,R.E. Smalley, Electronic Structure Control of Single-Walled Carbon Nanotube Functionalization, Science, 301, 1519 (2003)
10. M. Shim, N.W. Kam, R.J. Chen, Y. Li, and H. Dai, Functionalization of Carbon Nanotubes for Biocompatibility and Biomolecular Recognition, Nano Letters, 2, 285 (2002)
11. A.Modi, N. Koratkar, E. Lass, B. Wei and P.M. Ajayan, Miniaturized gas ionization sensors using carbon nanotubes, Nature 424, 171 (2003)
12. S. J. Tans, A.R.M. Verscheuren, and C. Dekker, Room-temperature transistor based on a single carbon nanotube. Nature 393, 49 (1998).
13. R. Martel, T. Schmidt, H.R. Shea, T. Hertel, and Ph. Avouris, Single and multi-wall carbon nanotube field-effect transistors. Appl. Phys. Lett. 73, 2447 (1998)
14. J.A. Misewich, R.Martel, Ph. Avouris, J.C. Tsang, S. Heinze, J. Tersoff, Electrically Induced Optical Emission from a Carbon Nanotube FET, Science 300, 783 (2003)
107

15. A. Bachtold, P. Hadley, T. Nakanishi, and C. Dekker, Logic circuits with carbon nanotube transistors. Science 294, 1317 (2001)
16. Z. Chen, J. Appenzeller, Y.M. Lin, J. Sippel-Oakley, A.G. Rinzler, J. Tang, S.J. Wind, P.M. Solomon, Ph. Avouris, An integrated logic circuit assembled on a single carbon nanotube. Science 311, 1735 (2006)
17. R. Saito, Dresselhaus, G. & Dresselhaus, M. S. Physical properties of carbon nanotubes. London: World Scientific Publishing Company, Imperial College Press, (1998).
18. A. Javey, J. Guo, Q. Wang, M. Lundstrom and H.J. Dai, Ballistic carbon nanotube field-effect transistors, Nature 424, 654 (2003)
19. Z.H. Chen, Electric field induced transparency modulation in single wall carbon nanotube ultra-thin films and a method to separate metallic and semiconducting nanotubes. Thesis, University of Florida, 2003
20. Ph. Avouris, Z. Chen and V. Perebeinos, Carbon-based electronics, Nature Nanotechnology 2, 605 (2007)
21. Z.H. Chen, X. Du, M.H. Du, C.D. Rancken, H.-P. Cheng, A.G. Rinzler, Bulk Separative Enrichment in Metallic or Semiconducting Single Wall Carbon Nanotubes, Nano Letters 3, 1245 (2003)
22. M. S. Arnold, A. A. Green, J.F. Hulvat, S.I. Stupp, & M.C. Hersam, Sorting carbon nanotubes by electronic structure using density differentiation, Nature Nanotech. 1, 60 (2006)
23. M.J. Earle, J.MSS Esperanca, M.A. Gilea, J.N.C. Lopes, L.P.N. Rebelo, J.W. Magee K.R. Seddon and J.A. Widegren, The distillation and volatility of ionic liquids, Nature 439, 831 (2006)
24. A.G. Rinzler J. Liu, H. Dai, P. Nikolaev, C.B. Huffman, F.J. Rodriguez-Macias, P.J. Boul, A.H. Lu, D. Heymann, D.T. Colbert, R.S. Lee, J.E. Fischer, A.M. Rao, P.C. Eklund & R.E. Smalley, Large-scale purification of single-wall carbon nanotubes: process, product, and characterization. Applied Physics A 67, 29 (1998)
25. V.C. Moore, M.S. Strano, E.H. Haroz, R.H. Hauge and R.E. Smalley, Individually suspended single-walled carbon nanotubes in various surfactants, Nano Lett. 3 1379 (2003)
26. S. Nakamura, T. Mukai, M. Senoh, Candela-class high-brightness InGaN/AlGaN double-heterostructure blue-light-emitting diodes, Appl. Phys. Lett. 64 1687 (1994)
27. D.J. King, L. Zhang, J.C. Ramer, S.D. Hersee, L.F. Lester, Temperature Behavior of Pt/Au Ohmic Contacts to p-GaN, Mater. Res. Soc. Symp. 468, 421 (1997)
108

28. L.F. Lester, D.J. King, L. Zhang, J. C. Ramer, and S.D. Hersee, Ohmic Contacts to n- and p-GaN, Proc. Electrochemical Society 971, 171 (1997)
29. G.K. Reeves, H.B. Harrison, Obtaining the specific contact resistance from transmission line model measurements, Electron Device Letters, IEEE 3, 111 (1982)
30. Peter K. H. Ho, D. Stephen Thomas, Richard H. Friend, Nir Tessler, All-Polymer Optoelectronic Devices, Science 285, 233 (1999)
31. Conjugated Polymeric Materials: Opportunities in Electronics, Optoelectronics, and Molecular Electronics, J.L. Brédas (Editor), R.R. Chance (Editor), Springer-Verlag New York, LLC; (May 1990)
32. Terje A. Skotheim (Editor), John Reynolds (Editor), Conjugated Polymers: Processing, Devices, and Applications (Handbook of Conducting Polymers), 3rd ed., Boca Raton, FL: CRC Press, Taylor & Francis, Inc., December (2006)
33. Joseph Shinar, Organic Light-Emitting Devices, New York: Springer-Verlag New York, LLC, October (2003)
34. see www.cheaptubes.com website, Brattleboro, VT 05301 USA, April, 2008
35. G. G. Malliaras, J. R. Salem, P. J. Brock, and C. Scott, Electrical characteristics and efficiency of single-layer organic light-emitting diodes, Phys. Rev. B 58, R13411 (1998)
36. S.M. Sze, Physics of semiconductor devices, John Wiley & Sons, New York, (1981)
37. Raymond T. Tung, Recent advances in Schottky barrier concepts, Materials Science and Engineering: R: Reports 35, 1 (2001)
38. Leonard J. Brillson (Editor), Contacts to Semiconductors: Fundamentals and Technology (Materials Science and Process Technology), Noyes Publications, Webster, New York (October 1, 1993)
39. Winfried Mönch, Semiconductor Surfaces and Interfaces, Springer, Berlin (May 11, 2001)
40. Mark C. Lonergan, A Tunable Diode Based on an Inorganic Semiconductor |Conjugated Polymer Interface, Science 278, 2103 (1997)
41. L. Valentini, I. Armentano and J.M. Kenny, Electrically switchable carbon nanotubes hydrophobic surfaces, Diamond and Related Materials 14, 121 (2005)
42. R.J. Handy, Theoretical analysis of the series resistance of a solar cell, Solid State Electron. 10, 765 (1967)
109

110
43. A. Behnam, L. Noriega, Y. Choi, Z. Wu, A.Rinzler, A. Ural, Resistivity scaling in single-walled carbon nanotube films patterned to submicron dimensions, Applied Physics Letters 89, 093107 (2006)
44. A.G. Rinzler, Z. Wu, Low temperature methods for forming patterned electrically conductive thin films, Publication No.:WO/2007/035838, Publication date: 29, 03, 2007

BIOGRAPHICAL SKETCH
Zhuangchun Wu was born at 1971, in a small village called WuWei, YiXing
county, JiangSu province, China. His father is ZhiYing Wu and his mother HongFeng
Huang. Both his parents did not get a chance to get education and are peasants. He has
two elder sisters Guifang and Chaofang, whom he developed closed relationships with.
He is a student who came from a rural Chinese education. During his high school,
his physics teacher, Mr. Liangcai Lin, inspired his interest in physics and his English
teacher, Mr. MinShi Yang, showed him the door into learning English. Both of these
experiences played an important roles in his later career development. He managed to get
into Nanjing University, one of the best universities in China. Although while there he
only pursued a college diploma, he still had the dream of higher education. He received a
master’s degree from the physics while he was working in Nanjing University as a lab
technician in the Physics Department. He applied to study in the USA and was accepted
by the University of Vermont. While there he received a master’s degree in material
science. Later, he applied to the University of Florida and worked with Dr. Andrew G.
Rinzler on carbon nanotubes for 5 years.
He has a daughter, Emma, who is the source of all of his joy over the years of
graduate study in Florida.
111