tuesday, march 27, 2012 fie advocacy day 2012 – california state capitol
DESCRIPTION
Parent Engagement: A Strategy for a Better California Dr. Linda Murray, Ph.D. Superintendent-in-Residence The Education Trust—West . Tuesday, March 27, 2012 FIE Advocacy Day 2012 – California State Capitol. K-12 Enrollment in California, 1994 v. 2011. 1993-94. 2010-11. - PowerPoint PPT PresentationTRANSCRIPT

© 2012 THE EDUCATION TRUST – WEST
Parent Engagement: A Strategy for a Better California
Dr. Linda Murray, Ph.D. Superintendent-in-ResidenceThe Education Trust—West
Tuesday, March 27, 2012FIE Advocacy Day 2012 – California State Capitol

© 2012 THE EDUCATION TRUST – WEST
K-12 Enrollment in California, 1994 v. 2011
37%
9%8%
42%
1% 1%51%
7%9%
27%
3% 3%
LatinoAfrican-AmericanAsianWhiteMultiple/No ResponseAmerican IndianFilipinoPacific Islander
Total Enrollment 5.3 million
% low-income* 44%
# English Learners 1.2 million
Total Enrollment 6.2 million
% low-income* 55%
# English Learners 1.3 million
1993-94 2010-11
*The percentage of students eligible for free or reduced price meals.

© 2012 THE EDUCATION TRUST – WEST
African-American English-Language Arts Achievement Gap
2003 2004 2005 2006 2007 2008 2009 2010 20110
20
40
60
80
100
23 20 2227 27 28
33 32 35
52 48 51 55 56 5763 61 64
CST 3rd Grade ELAAfrican-American-White Gap, 2003-2011
African American White
Perc
ent P
rofic
ient
& A
bove
California Department of Education, 2011
Gap= 29
Gap= 29
© 2012 THE EDUCATION TRUST – WEST
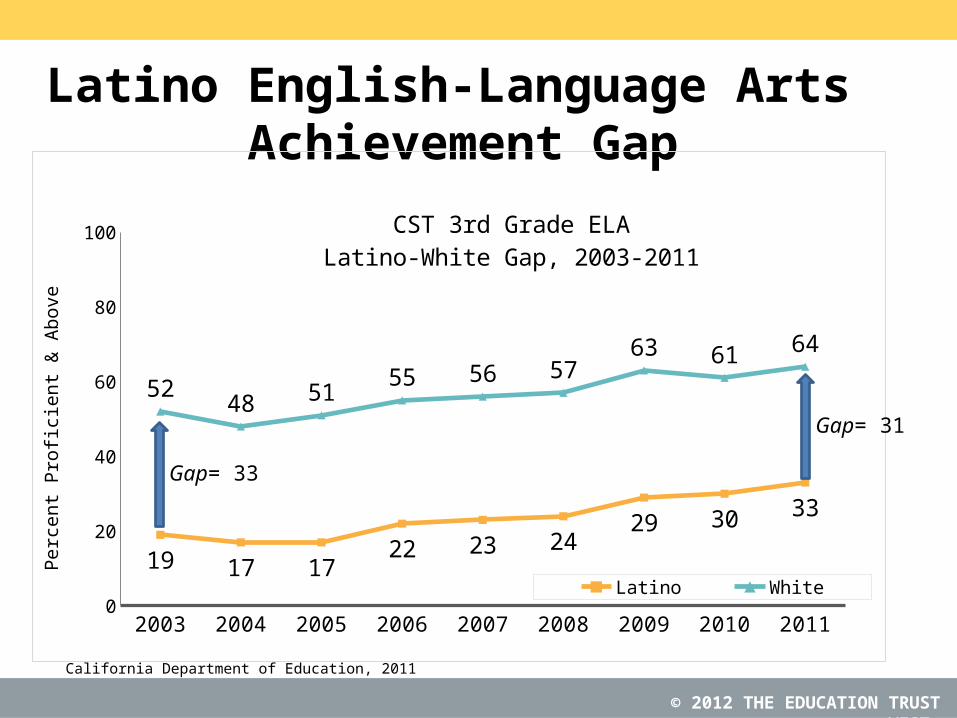
Latino English-Language Arts Achievement Gap
2003 2004 2005 2006 2007 2008 2009 2010 20110
20
40
60
80
100
19 17 1722 23 24
29 30 33
52 48 51 55 56 5763 61 64
CST 3rd Grade ELALatino-White Gap, 2003-2011
Latino White
Perc
ent P
rofic
ient
& A
bove
California Department of Education, 2011
Gap= 31
Gap= 33

© 2012 THE EDUCATION TRUST – WEST
CST 3rd Grade ELA Proficiency, by Ethnicity (2011)
African Amer-ican
Latino White Asian0%
10%
20%
30%
40%
50%
60%
70%
80%
90%
100%
12% 11%4% 3%
20% 21%
9% 7%
33% 34%
24%20%
25% 24%
35%32%
10% 9%
29%37%
AdvancedProficientBasicBelow BasicFar Below Basic
Perc
enta
ge o
f Stu
dent
s
California Department of Education, 2011
© 2012 THE EDUCATION TRUST – WEST
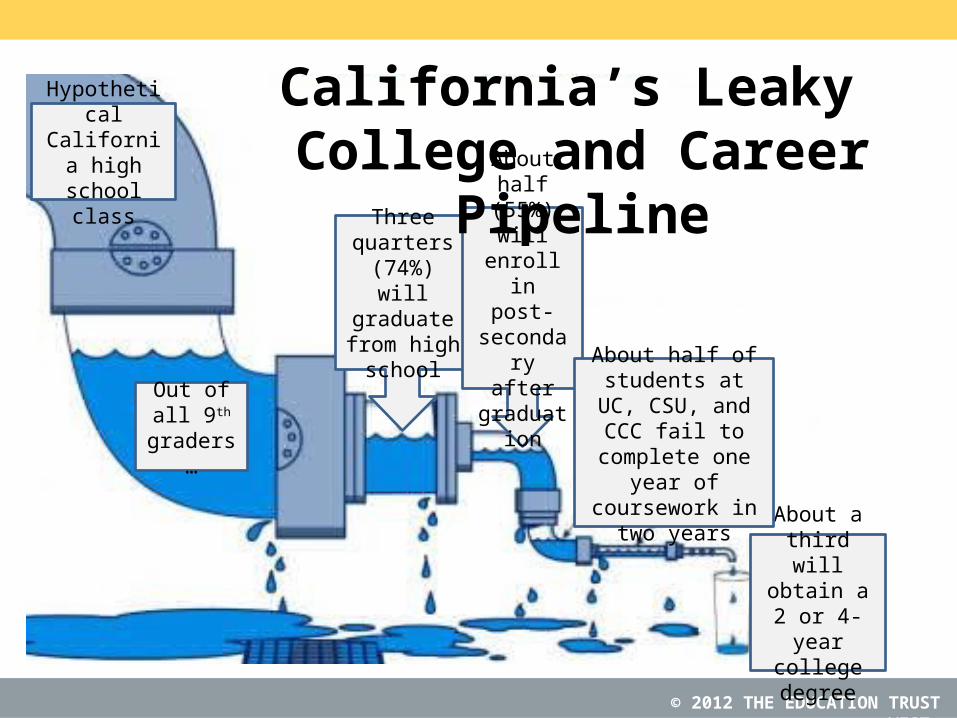
Three quarters
(74%) will graduate from high
school
About half (55%) will enroll in
post-secondary
after graduation
Out of all 9th
graders…
Hypothetical California high
school class
About a third will obtain a 2 or 4-year
college degree
About half of students at UC, CSU,
and CCC fail to complete one year of coursework in
two years
California’s Leaky College and Career Pipeline

© 2012 THE EDUCATION TRUST – WEST
Too Few African-American and Latino Graduates are Eligible for a 4-Year California University
All Asian White African- Amer-ican
Latino0%
20%
40%
60%
80%
100%
35%
59%41%
27% 26%
39%
29%
43%
31% 41%
74%
89%83%
59%68%
High School and A-G Graduation Rates by Race/Ethnicity, 2009-10
High School Graduation Rate
HS Grads NOT Meeting A-G Requirements
High
Sch
ool G
radu
ation
Rat
e
California Department of Education, 2011

© 2012 THE EDUCATION TRUST – WEST
H.S. Grads A-G Complete CCC Enroll CSU Enroll UC Enroll0%
20%
40%
60%
80%
100%
67
2620
85
57
16 15
62
52
1612
62
Class of 2009: College Pathways
All
Latino
African-American
Perc
enta
ge o
f 9th
gra
de e
nrol
lmen
t
Source: Rogers, J. Bertrand, M., Freelong, R., Fanelli, S. (2011). Free Fall: Educational Opportunities in 2011. Los Angeles: UCLA IDEA, UC/ACCORD

© 2012 THE EDUCATION TRUST – WEST
Proportional representation of African-American and Latino students in California and its public universities
African-American Latino
% of California population ages 18-24
8% 45%
% of UC undergraduate enrollment
3% 16%
% of CSU undergraduate enrollment
6% 25%
Within California’s Public Universities, Students of Color are Underrepresented

© 2012 THE EDUCATION TRUST – WEST
Within California’s Public Universities, College Admission is No Guarantee of Success
Source: California Postsecondary Education Commission, Graduation Rates for Students Starting College in 2001
Six-year graduation rates for first-time freshmanUC CSU
African-American 70% 31%Latino 73% 40%
© 2012 THE EDUCATION TRUST – WEST
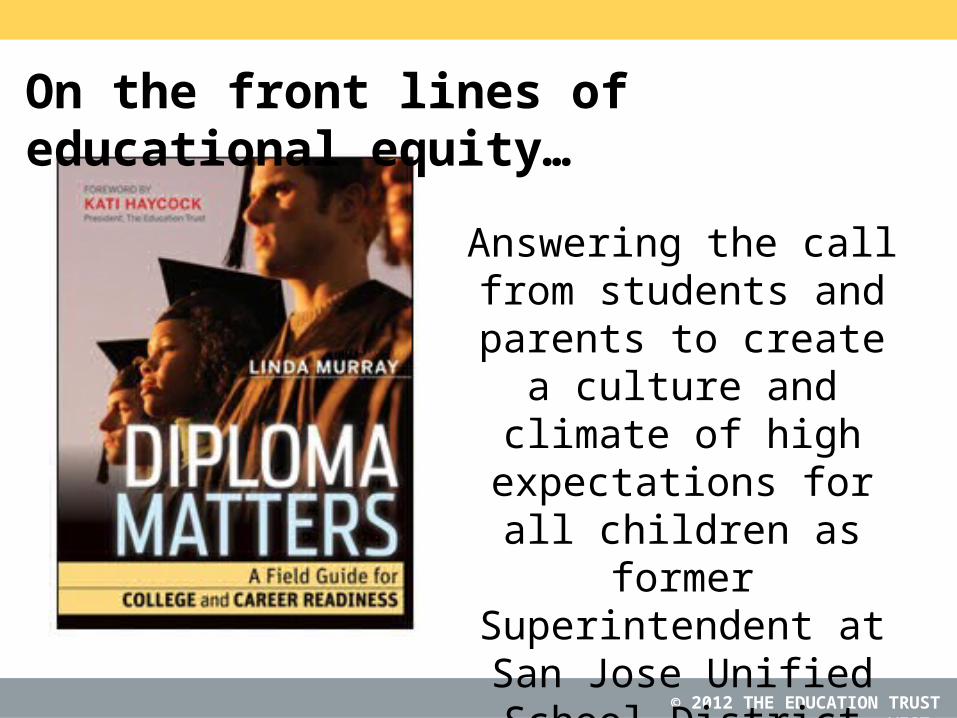
Answering the call from students and parents to
create a culture and climate of high expectations for all
children as former Superintendent at San Jose
Unified School District
On the front lines of educational equity…

© 2012 THE EDUCATION TRUST – WEST
Authentic community engagement is HARD WORK and TAKES TIME
© 2012 THE EDUCATION TRUST – WEST
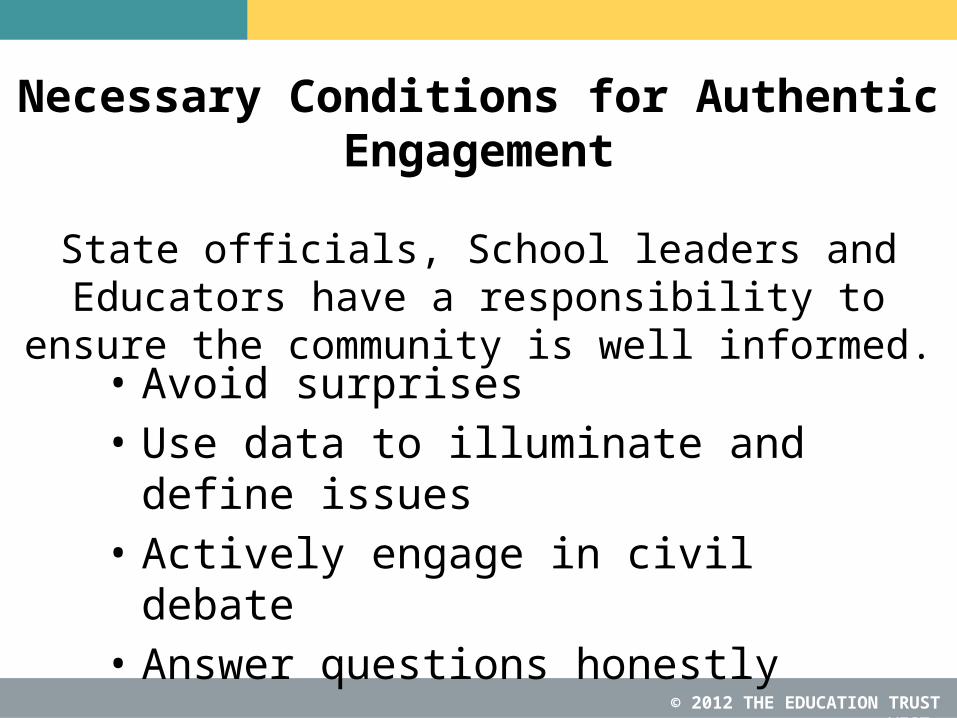
Necessary Conditions for Authentic Engagement
State officials, School leaders and Educators have a responsibility to ensure the community is well informed.
• Avoid surprises• Use data to illuminate and define issues• Actively engage in civil debate• Answer questions honestly

© 2012 THE EDUCATION TRUST – WEST
The goal for community engagement should be to FIND COMMON
GROUND and BUILD CONSENSUS

© 2010 THE EDUCATION TRUST— WEST
Contact Info:
The Education Trust—Westwww.edtrustwest.org
510-465-6444
Follow us on: