tube investments of india limited · 1949 1955 1960 1965 1978 1985 2001 2010 2012 1949 –set up ti...
TRANSCRIPT

Tube Investments of India Limited
Copyright TI | All Rights Reserved www.tiindia.com
Stock Codes: BSE: 504973 NSE: TUBEINVEST Bloomberg: TI IN / TI IB Reuters: TUBE.NS / TUBE.BOCIN: L35921TN1949PLC002905

2
Safe Harbour
This presentation contains forward-looking statements which may be identified by their use of words
like “plans,” “expects,” “will,” “anticipates,” “believes,” “intends,” “projects,” “estimates” or other words
of similar meaning. All statements that address expectations or projections about the future, including,
but not limited to, statements about the strategy for growth, product development, market position,
expenditures, and financial results, are forward-looking statements.
Forward-looking statements are based on certain assumptions and expectations of future events. The
companies referred to in this presentation cannot guarantee that these assumptions and expectations
are accurate or will be realized. The actual results, performance or achievements, could thus differ
materially from those projected in any such forward-looking statements. These companies assume no
responsibility to publicly amend, modify or revise any forward looking statements, on the basis of any
subsequent developments, information or events, or otherwise.
Copyright TI | All Rights Reserved www.tiindia.com

3
Contents
Copyright TI | All Rights Reserved www.tiindia.com
Tube Investments of India Ltd.
About Murugappa Group
Company Financials
Business Divisions Performance

4
Murugappa Group
Copyright TI | All Rights Reserved www.tiindia.com
28 Businesses One Powerful Group
A ₹ 225 Billion Murugappa Group as of 2012-13

5
The Philosophy we cherish
Copyright TI | All Rights Reserved www.tiindia.com
“The fundamental principle of economic activity is that no man
you transact with will lose; then you shall not.”- Arthashastra
6
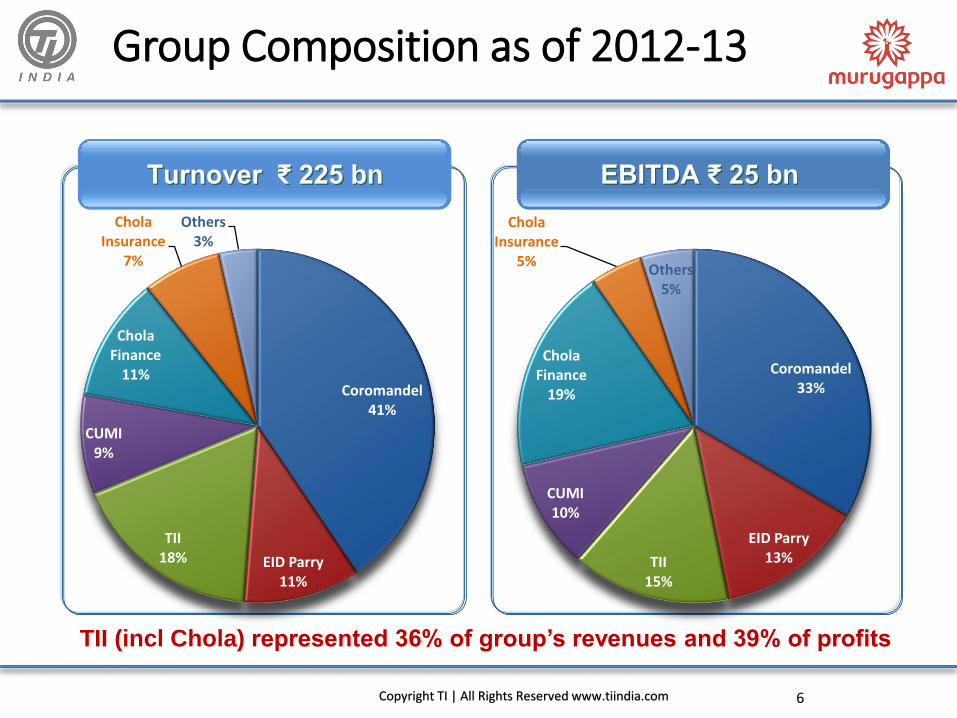
Group Composition as of 2012-13
Copyright TI | All Rights Reserved www.tiindia.com
Turnover ₹ 225 bn EBITDA ₹ 25 bn
Coromandel41%
EID Parry11%
TII18%
CUMI9%
Chola Finance
11%
Chola Insurance
7%
Others3%
Coromandel33%
EID Parry13%TII
15%
CUMI10%
Chola Finance
19%
Chola Insurance
5%Others
5%
TII (incl Chola) represented 36% of group’s revenues and 39% of profits

7
Spirit of Murugappa
Copyright TI | All Rights Reserved www.tiindia.com

8
Contents
Tube Investments of India Ltd.
About Murugappa Group
Company Financials
Business Divisions Performance
Copyright TI | All Rights Reserved www.tiindia.com

9
TII – A Conglomerate
1949 1955 1960 1965 1978 1985 2001 2010 2012
1949 – Set up TI Cycles (BSA & Hercules Brands)
1955 – Incorporated Tube Products
1985 – Indigenously manufactured 100 cc bike chain
2010 – Acquired Sedis, France1960 – Incorporated Diamond Chain
1965 – Set up TI Metal Forming Products
2012 – Acquired ShanthiGears
1978 –Promoted Financial Services
2001– Promoted General Insurance Co.
Copyright TI | All Rights Reserved www.tiindia.com

10Copyright TI | All Rights Reserved www.tiindia.com
Manufacturing
Manufacturers of
◦ Tubes, Strips, & Tubular Components
◦ Bicycles & Fitness Products,
◦ Chains for Automobile sector & Industrial applications,
◦ Doorframe & Channels
◦ Industrial Gears
20 Manufacturing Locations
Suppliers to all major automotive OEM’s in India
Focus on Quality & Operational excellence
Financial Services
Financing
◦ 574 branches across 22 states
◦ 90% presence across Tier II & III cities
General Insurance
Over 101 offices, Over 9000 agents and 5 bancassurance channel partners
Corporate Overview
Key Financials
₹ Cr. 2012-13 2013-14 Growth
Revenue 7752 8834 14%
EBITDA 889 1044 17%
PBT 674 789 17%
Net Profit 289 311 8%

11
Leadership Position
Preferred Supplier of precision tubes (CDW)
One of the Largest bicycle producers in
India
Preferred supplier for metal formed door
frames
Major player in automotive and
agricultural chains
Copyright TI | All Rights Reserved www.tiindia.com
12
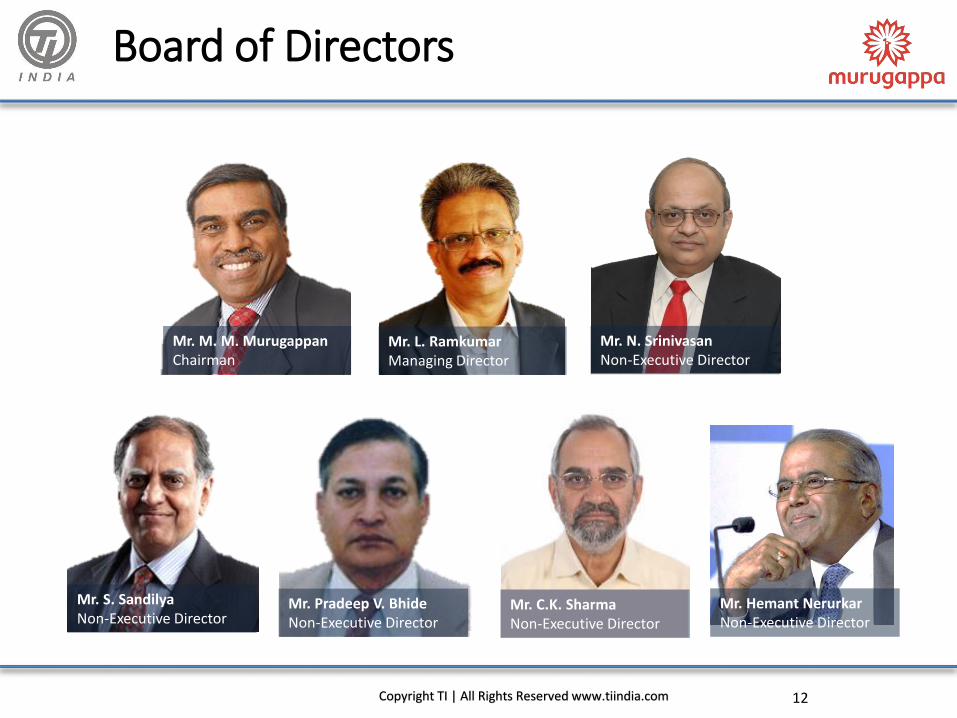
Board of Directors
Copyright TI | All Rights Reserved www.tiindia.com
Mr. M. M. MurugappanChairman
Mr. L. RamkumarManaging Director
Mr. N. SrinivasanNon-Executive Director
Mr. S. SandilyaNon-Executive Director
Mr. Pradeep V. BhideNon-Executive Director
Mr. C.K. SharmaNon-Executive Director
Mr. Hemant NerurkarNon-Executive Director

13
Leadership Team
Mr. Kalyan K. Paul Mr. Arun Alagappan Mr. K. R. SrinivasanMr. P. Ramachandran
Mr. R. Natarajan Mr. N. Prasad
Dr. Sreeram
Mr. R. Narayanan Mr. Arjun Ananth
Copyright TI | All Rights Reserved www.tiindia.com

14
Tube Investments of India Ltd. Consolidated for the year 2013-14 – Revenue Composition
Copyright TI | All Rights Reserved www.tiindia.com
Tube Investments of India Ltd. (Consolidated)
₹ 8834 Cr.
Manufacturing*
₹ 3903 Cr.
Financial Services*
₹ 4937 Cr.
*Includes Inter Segment Revenue

15
Business Composition Consolidated for the year 2013-14
Cycles / Components13%
Engineering18%
Metal Formed Products
12%
Insurance18%
Gear & Gear
Products2%
Financial Services
37%
Revenue ₹ 8834 Cr Operating PBIT ₹ 917 Cr
Cycles / Components4%
Engineering15%
Metal Formed Products
8%
Insurance10%
Gear & Gear Products
2%
Financial Services
61%
Copyright TI | All Rights Reserved www.tiindia.com

16
Bicycles
Business Composition - Manufacturing Consolidated for the year 2013-14 – Revenue Composition
Copyright TI | All Rights Reserved www.tiindia.com
Manufacturing*
₹3903 Cr.
TII (Standalone)
₹ 3526 Cr.
Cycles*
₹ 1185 Cr.
Engineering*
₹ 1622 Cr.
Metal Forming*
₹ 851 Cr.
Shanthi Gears*
₹ 156 Cr.
FC 10*
₹ 249 Cr.
*Includes Inter Segment Revenues
Fitness Tubes/Strips Metal Formed
Gears SEDIS

17
Business Composition - Manufacturing Consolidated for the year 2013-14
Cycles / Components29%
Engineering40%
Metal Formed Products
27%
Gear & Gear Products
4%
Revenue* ₹ 3903 Cr Operating PBIT ₹ 266 Cr
Cycles / Components14%
Engineering51%
Metal Formed Products
26%
Gear & Gear Products
9%
Copyright TI | All Rights Reserved www.tiindia.com
*Includes Inter Segment Revenues

18
Business Composition – TII Standalone Standalone for the year 2013-14
Cycles / Components33%
Engineering44%
Metal Formed Products
23%
Revenue ₹ 3526 Cr Operating PBIT ₹ 242 Cr
Cycles / Components16%
Engineering56%
Metal Formed Products
28%
Copyright TI | All Rights Reserved www.tiindia.com

19
Business Composition – Financial Services Consolidated for the year 2013-14 – Revenue Composition
Copyright TI | All Rights Reserved www.tiindia.com
Financial Services
₹ 4937 Cr.
Insurance
₹ 1646 Cr.
Financing
₹ 3279 Cr.
Risk Services
₹ 12 Cr.
Insurance Financing Risk Service

20
Business Composition – Financial Services Consolidated for the year 2013-14
Insurance33%
Financial Services
67%
Risk Services
0%
Revenue ₹ 4937 Cr Operating PBIT ₹ 651 Cr
Insurance15%
Financial Services
85%
Risk Services
0%
Copyright TI | All Rights Reserved www.tiindia.com

21
Shareholding Pattern
Copyright TI | All Rights Reserved www.tiindia.com
48.25% 48.26% 48.26% 48.23%
15.56% 16.17% 16.26% 16.34%
9.67% 9.27% 9.41% 9.54%
26.52% 26.31% 26.07% 25.89%
JUN-13 SEP-13 DEC-13 MAR-14
Promoter FII DII Others
Market Cap*
₹ 3371 Cr.
* As on 31st March 2014

22
Shareholders’ Return
Source: Moneycontrol.com
Copyright TI | All Rights Reserved www.tiindia.com
Uninterrupted dividend history for 61 yearsDividend payout policy ~30-40% of profits
0
50
100
150
200
250
01-Apr-09 01-Apr-10 01-Apr-11 01-Apr-12 01-Apr-13
Share Price Movement - BSE
31-Mar-14
₹ 180.35
₹ 26.30

23Copyright TI | All Rights Reserved www.tiindia.com
CRISIL Rating
AA for long term
A1+ for short term
Standalone Balance Sheet
Total Debt / Equity – 1.10
Long term Debt / Equity – 0.85
Healthy ROCE across business verticals
Financial Services
Capital adequacy ratio above the stipulated limit –
17.23%
General Insurance
Solvency ratio – 1.44
Financial Strength
0.860.73 0.75
1.10 1.10
2009-10 2010-11 2011-12 2012-13 2013-14
Total Debt/Equity Ratio
10%
17% 16%
9% 8%
2009-10 2010-11 2011-12 2012-13 2013-14
ROE %

24
Contents
Tube Investments of India Ltd.
About Murugappa Group
Company Financials
Business Divisions Performance
Copyright TI | All Rights Reserved www.tiindia.com

25
Cycles / Components
Pioneers in Selling Cycling… not just cycles
Copyright TI | All Rights Reserved www.tiindia.com

26Copyright TI | All Rights Reserved www.tiindia.com
55% 51%
45% 49%
Industry TII
Standard Special
Business Overview
Business Mix - CyclesIndustry
Bicycle Industry size: ~ 17 Mn growing at ~1%
Fitness Industry Home Segment: ~ ₹ 300 Cr growing at ~ 18%
Business Drivers
Large dealer network across India – over 10,000 touch points across India
Expansive Retail Formats in Urban (BSA Stores), Rural (RHB), Lifestyle (Track& Trail): 940 stores
Multi Locational Servicing Centers
Continuous New product development
Extensive BTL & ATL activities
Focus on Exports
State of Art manufacturing facilities for Alloy and Carbon
Capital Expenditure
₹ 11 Crore2012-13
₹ 8 Crore2013-14

27
Business Strengths
Brand equity
- BSA, Hercules, Montra & Phillips
Super Premium Lifestyle Cycles
- Cannondale, Mongoose,
Bianchi, Montra, Schwinn
Pioneer in Retail Formats
- BSA Go, BSA Hercules store, Track & Trail Lounge
Selling Cycling not Just Cycles
Multi Location ServicingPioneer in New Product
Development
Copyright TI | All Rights Reserved www.tiindia.com

28Copyright TI | All Rights Reserved www.tiindia.com
Performance
Fast Growth in the Premium Segment: 100% involumes of Montra cycles over last year
New Product Development
Over 32 new products launched during the year
NPD to sales % at 20% for the year 2013-14
Retail Format
TI pioneered exclusive retail formats which currentlyprovides around 30%* of total volumes
Marketing Events
Organized around 50 cycling events all over India
Over 200,000 people participated in all the events
Around 2200 BTL activities conducted with touchpoints of approximately 10,00,000
Business Highlights
Best cycle brand – Hercules from ABP NEWS-BRAND XCELLENCE AWARDS
*Including Secondary Sales

29
Key Financial Trend
946
1114
1285 12551179
2009-10 2010-11 2011-12 2012-13 2013-14
Sales
69 78 76 49 39
7% 7%
6%
4%3%
2009-10 2010-11 2011-12 2012-13 2013-14
PBIT & PBIT Margin
PBIT PBIT%
335 376 267 277 306 324 277 272
6% 6%
2%0.3%
5%4%
3%
1%
Q1 Q2 Q3 Q4 Q1 Q2 Q3 Q4
Sales & PBIT Margin
Sales PBIT%
2012-13 2013-14
89% 91% 92%
56% 52%
2009-10 2010-11 2011-12 2012-13 2013-14
ROCE %
figures in ₹ Crores
Copyright TI | All Rights Reserved www.tiindia.com
PBIT considered after exceptional item

30
Key Financials
Copyright TI | All Rights Reserved www.tiindia.com
Particulars 2013-14 2012-13 % Growth
Volumes
Cycles (Lac nos) 38 41 -7%
Net Sales (incl. Inter Unit) 1179 1255 -6%
EBITDA 46 62 -26%
3.9% 4.9%
PBIT (after Exceptional Items) 39 49 -21%
3.3% 3.9%
APPLICATION OF FUNDS
Net Fixed Assets (Incl. CWIP) 46 46
Net Working Capital 16 39
Total Capital Employed 62 85
Sales/NWC 74.8 32.3
ROCE% 52.3% 55.8%
figures in ₹ Crores

31
Engineering
Leader in CDW tubes for the Automotive industry
Copyright TI | All Rights Reserved www.tiindia.com

32Copyright TI | All Rights Reserved www.tiindia.com
Industry
Tubes: Significant Player in safety critical applications
2 wheelers: Leader in Front Forks in India
4 wheelers: Leader in many critical applications such as side impact beam, steering columns etc
CRSS: Niche player in specialized products
Tubular Components: Value added products
Business Drivers
Manage High Variety demand in Tubes effectively
High Focus on Value Addition for Products
Application oriented designing for Auto industry
New Facility for Non-Auto Segment
Focus on internal efficiencies
Business Overview
Capital Expenditure
₹ 82 Crore2012-13
₹ 125 Crore2013-14
Business Mix
Auto78%
Non-Auto22%

33
Business Strengths
Preferred Source for high variety CDW Tubes
Multi locations- Closer to customer
Gearing for Non-Auto
Niche CRSS player-focus on low volume / metallurgy
Focus on Value Added Products
Focused Application Engineering
Copyright TI | All Rights Reserved www.tiindia.com

34
Business Highlights
Extensive Focus on PQCDSM to improve internal efficiency
Over 14 Tech shows at Maruti, Tata Motors, Nissan, JCB, Mahindra,
VECV, Eicher etc.
Over 38 projects identified from these tech shows
Increased share of business across customer segments
High Focus on Value Addition for customer acquisition & retention
Copyright TI | All Rights Reserved www.tiindia.com
Best Technical Cooperation Award from Luk India during
the Supplier Meet 2013
Awarded “Best Supplier Award” in the category of Raw Material in Jan ‘14
Received Appreciation certificate from JBM OGIHARA in Oct ‘13
Awarded “Best Delivery Award” by KYB in the Supplier
Conference 2013
Awarded for “Best Vendor in support Role” by Gabriel in Sep’13

35
Key Financial Trend
890
1190
1449 1467 1510
2009-10 2010-11 2011-12 2012-13 2013-14
Sales
85 113 131 110 136
10% 9% 9%
7%
9%
2009-10 2010-11 2011-12 2012-13 2013-14
PBIT & PBIT MarginPBIT PBIT%
394 376 340 357 367 371 379 392
8% 8%6%
8% 8% 9% 9%11%
Q1 Q2 Q3 Q4 Q1 Q2 Q3 Q4
Sales & PBIT Margin
Sales PBIT%
2012-13 2013-14
24%
29%31%
23%25%
2009-10 2010-11 2011-12 2012-13 2013-14
ROCE %
figures in ₹ Crores
Copyright TI | All Rights Reserved www.tiindia.com

36
Key Financials
Copyright TI | All Rights Reserved www.tiindia.com
Particulars 2013-14 2012-13 % Growth
Strips: (Volumes Tonnes)
Domestic 54986 51490 7%
Exports 544 249 118%
Tubes: (Volumes Tonnes)
Domestic 135960 136238 -0%
Exports 9714 8193 19%
Net Sales (incl. Inter Unit) 1510 1467 3%
EBITDA 170 142 19%
11.3% 9.7%
PBIT 136 110 24%
9.0% 7.5%
APPLICATION OF FUNDS
Net Fixed Assets (Incl. CWIP) 416 310
Net Working Capital 193 190
Total Capital Employed 609 500
Sales/NWC 7.8 7.7
ROCE% 24.5% 23.6%
figures in ₹ Crores

37
Metal Formed Products
Precision Value added Components
Copyright TI | All Rights Reserved www.tiindia.com

38Copyright TI | All Rights Reserved www.tiindia.com
Industry
Growth in 2 Wheelers at 7%
Slowdown in 4 Wheelers & Commercial Vehicles at negative 5% & 9% respectively
Slowdown Agricultural, Manufacturing and Infrastructure sector impacting growth
Slow growth in Europe & US
Business Drivers
Factories located closer to customer locations
Strong “DIAMOND” brand
High quality products - Customer end rejections well below the customer targets
Leveraging Acquisitions – SEDIS Synergies
Increasing Portfolio for Fine Blanking
Expand applications for Industrial Segment
Business Overview
6%
27%
67%
Railways Non-Auto Auto
Business Mix
Capital Expenditure
₹ 49 Crore2012-13
₹ 33 Crore2013-14

39
Business Strengths
Leader in many segmentsCustomer reach with
multiple plant locations
Wide range of Products & Good Brand Equity –
Diamond & Rombo
Strong Focus on Quality Systems
Suppliers to all Major Auto Manufacturers in India
Diversified Portfolio of Industries Served
Copyright TI | All Rights Reserved www.tiindia.com
40
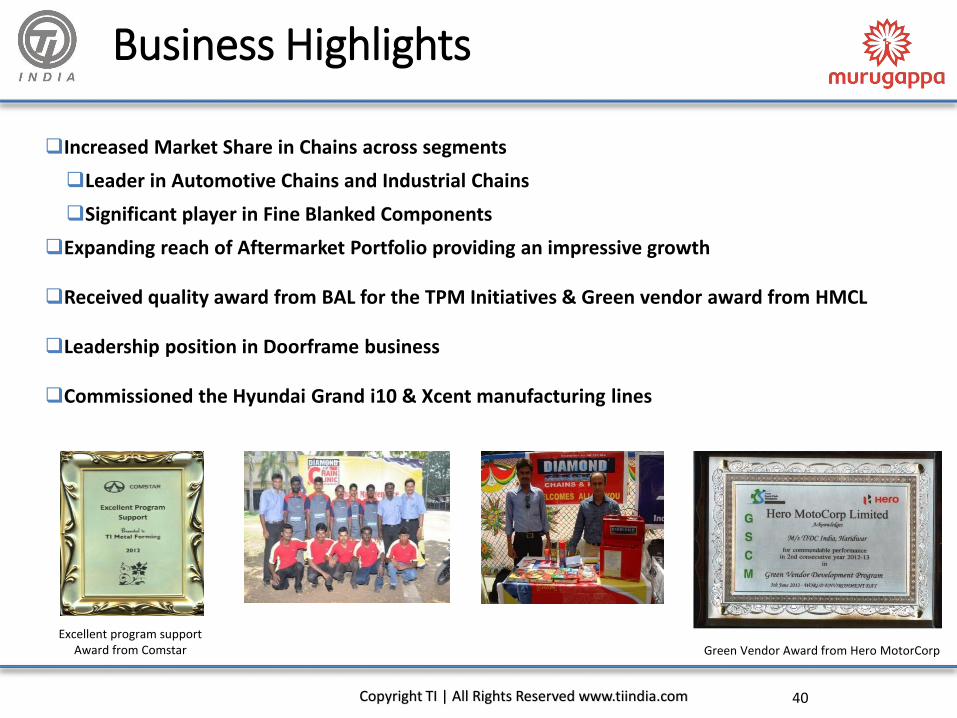
Business Highlights
Increased Market Share in Chains across segments
Leader in Automotive Chains and Industrial Chains
Significant player in Fine Blanked Components
Expanding reach of Aftermarket Portfolio providing an impressive growth
Received quality award from BAL for the TPM Initiatives & Green vendor award from HMCL
Leadership position in Doorframe business
Commissioned the Hyundai Grand i10 & Xcent manufacturing lines
Copyright TI | All Rights Reserved www.tiindia.com
Excellent program supportAward from Comstar Green Vendor Award from Hero MotorCorp

41
Key Financial Trend
577
769860
795 799
2009-10 2010-11 2011-12 2012-13 2013-14
Sales
24%27%
24%
16%14%
2009-10 2010-11 2011-12 2012-13 2013-14
ROCE %
219 204 187 185 183 202 205 209
11%10%
9%10%
7%
10% 10%
7%
Q1 Q2 Q3 Q4 Q1 Q2 Q3 Q4
Sales & PBIT Margin
Sales PBIT%
2012-13 2013-14
80 102 112 80 67
14% 13% 13%
10%8%
2009-10 2010-11 2011-12 2012-13 2013-14
PBIT & PBIT Margin
PBIT PBIT%
figures in ₹ Crores
Copyright TI | All Rights Reserved www.tiindia.com

42
Key Financials
Copyright TI | All Rights Reserved www.tiindia.com
Particulars 2013-14 2012-13 % Growth
Doorframes (Lakh Sets) 8 9 -14%
Sections for railway wagons (Sets) 987 2797 -65%
Chains:
Domestic (Lac ESS feet) 715 606 18%
Exports (Lac ESS feet) 70 90 -21%
Net Sales (incl. Inter Unit) 799 795 1%
EBITDA 99 112 -12%
12.3% 14.2%
PBIT 67 80 -16%
8.4% 10.1%
APPLICATION OF FUNDS
Net Fixed Assets (Incl. CWIP) 325 332
Investments 61 60
Net Working Capital 92 96
Total Capital Employed 478 488
Sales/NWC 8.7 8.3
ROCE% 13.9% 16.3%
figures in ₹ Crores

43
Metal Formed Products (Contd.)
Leading French Manufacturer of Industrial Chains
Copyright TI | All Rights Reserved www.tiindia.com

44Copyright TI | All Rights Reserved www.tiindia.com
F C 10 – Holding company of Sedis
Two plants in France
Five global patents
Leader in special and engineering class chains
Range of industries catered to
Waste Treatment / Car / escalator / textiles / food processing / packaging / cement / sugar / paper / water treatment / lumber / dams / amusement park / Oil Platforms
Leader in France
Present in around 100 countries
Around 200 distributors
Around 400 sale points
Business Overview
Key Products
Sales Mix
Leaf Chains & Roller Chains
Conveyor Chains
Agricultural Chains Sprockets & Wheels
France & Italy, 67%
Rest of World,
33%

45
Key Financial Trend
178 176
216 228247
2009 2010 2011 2012 2013
Sales
7%
9%
14%
4%3%
2009 2010 2011 2012 2013
ROCE %
67 55 49 57 54 59 63 71
1%
-2%
1%
7%
-1%
3%1%
3%
Q1 Q2 Q3 Q4 Q1 Q2 Q3 Q4
Sales & PBIT Margin
Sales PBIT%
2012 2013
7 6 9 4 4
4%3%
4%
2%1%
2009 2010 2011 2012 2013
PBIT & PBIT Margin
PBIT PBIT%
figures in ₹ Crores
Copyright TI | All Rights Reserved www.tiindia.com

46
Key Financials
Copyright TI | All Rights Reserved www.tiindia.com
figures in ₹ Crores
Particulars 2013 2012 % Growth
Net Sales 247 228 8%
EBITDA 13 6 108%
5.3% 2.8%
PBT 2 2
0.7% 0.9%
PAT 3 3
1.1% 1.3%
APPLICATION OF FUNDS
Net Fixed Assets (Incl. CWIP) 45 37
Net Working Capital 55 53
Total Capital Employed 100 90
Sales/NWC 4.5 4.30
ROCE% 3.6% 4.5%

47
Gears & Gear Products
Shanthi Gears (SGL) - Strong Brand in Industrial Gears
Copyright TI | All Rights Reserved www.tiindia.com

48Copyright TI | All Rights Reserved www.tiindia.com
Began operations in 1969 at Coimbatore
Leader in custom-made gears & loose gears
~60% of revenues from customized products
Fully integrated operations with in-house
R&D team
Design and engineering capabilities
Foundry, Fabrication and forging unit
Comprehensive Heat treatment facilities
Tool room for manufacturing hobs, cutters
Business Overview
Shareholding Pattern
Key Products
% Jun-13 Sep-13 Dec-13 Mar-14
Promoter 70.1 70.1 70.1 70.1
FII 1.9 1.9 1.9 1.9
DII 3.2 3.2 2.7 2.4
Others 24.8 24.8 25.3 25.6
• Gears
• Gear boxes
• Geared motors
• Gear assemblies
TII holds 70.12% stake in the company

49
Business Strengths
High Quality Solution Provider
Healthy Financials Excellent facilities
Capacity available for Growth Reputed Clientele Strong Brand Equity
Copyright TI | All Rights Reserved www.tiindia.com

50
Business Highlights
Enhanced market presence through new sales organisation
First Vertical Rolling Mill gearbox dispatched marking entry into this
segment ; serviced another VRM gear box for cement industry
Strongly positioned in Planetary Gear box segment
Launched improved and competitive standard range- M series
Strong performance in exports
Increased focus on Service & Replacement Market
Organized 4 Industry focused Tech Days and over 40 customer meets
& service camps at various locations catering to varied applications
Copyright TI | All Rights Reserved www.tiindia.com

51
Key Financial Trend
121
162173
144 151
2009-10 2010-11 2011-12 2012-13 2013-14
Sales
26 45 42 22 26
22%
28%25%
16% 17%
2009-10 2010-11 2011-12 2012-13 2013-14
PBIT & PBIT Margin
PBIT PBIT%
11%
19%
16%
8%10%
2009-10 2010-11 2011-12 2012-13 2013-14
ROCE %
figures in ₹ Crores
Copyright TI | All Rights Reserved www.tiindia.com
31 38 39 36 33 41 40 37
17%21%
16%
7%
14%
22%18%
14%
Q1 Q2 Q3 Q4 Q1 Q2 Q3 Q4
Sales & PBIT MarginSales PBIT%
2012-13 2013-14

52
Key Financials
Copyright TI | All Rights Reserved www.tiindia.com
figures in ₹ Crores
Particulars 2013-14 2012-13 % Growth
Net Sales 151 144 5%
EBITDA 42 43 -4%
27.6% 30.1%
PBIT 26 22 16%
17.2% 15.6%
PBT 26 22 17%
17.2% 15.4%
PAT 18 15 19%
12.2% 10.8%
APPLICATION OF FUNDS
Net Fixed Assets (Incl. CWIP) 99 119
Investments 50 38
Net Working Capital 120* 113*
Total Capital Employed 269 270
Sales/NWC 1.3 1.3
ROCE% 9.6% 8.3%*Includes FD of ₹ 58 Cr. In 2013-14 & ₹ 53 Cr. In 2012-13

53
Financial Services
Cholamandalam Investment and Finance Company Ltd. (CIFCL)
Financing your Assets…since 1978
Copyright TI | All Rights Reserved www.tiindia.com
35

54Copyright TI | All Rights Reserved www.tiindia.com
Established in 1978, one of India’s leading NBFC’s,
focused in the rural and semi-urban sector with a market
capitalization of INR 41 bn*
Presence across vehicle finance, business finance, home
equity loans, stock broking and distribution of financial
products
Operates from 574 branches across 22 states and 90%
presence across Tier II and III cities
One of the leading NBFCs in rural / semi urban areas
Total Assets under Management of INR 256 bn as of Mar
2014 with Net NPA of 0.7% and a healthy RoA of 1.9%
Business Overview
*Market data as on March 31, 2014. Source: BSE Sensex and Conversion Rate of 1USD = ₹ 60.0998 as on March 31, 2014 Source; RBI
57
.72
%
57
.79
%
57
.84
%
57
.83
%
23.13% 23.15% 23.06% 23.40%
12.16% 11.60% 11.60% 9.84%
6.99% 7.46% 7.50% 8.93%
Jun-13 Sep-13 Dec-13 Mar-14
Promoter FII DII Others
Shareholding Pattern
Disbursement Mix
Vehicle Finance
77%
Home Equity22%
Others1%
TII holds 50.45% stake in the Company

55
Business Strengths
Brand equity Strong channel partnership Effective cost management
Exceptional Lineage (Murugappa Group)
Strong Geographical Presence
Robust Technology Platform
Copyright TI | All Rights Reserved www.tiindia.com

56
Business Highlights
Recorded growth rates better than the industry by leveragingits broad-based product offerings and a deeper penetration ofthe existing customer base
Disbursements for 2013-14 stood at ₹ 13,114 Cr, as against ₹12,118 Cr in 2012-13, a growth of 8%Company registered PAT growth of 19% over 2012-13
Company has expanded its presence to 574 branches as on31st March 2014 compared to 518 branches as on 31st March2013. 90% of branches are in Tier II and Tier III towns acrossIndia.
Copyright TI | All Rights Reserved www.tiindia.com
Strong Geographical Presence
Performance Highlights of FY – 13 Vs FY - 14
8% 19% 17% 11%
-6%
Disbursements PAT ROTA(PBT) Book Value EPS^ ROE*
₹ 13,114 Cr ₹ 364 Cr 2.8% ₹ 160.3 ₹ 25.4 17.1%
₹ 12,118 Cr ₹ 307 Cr 3.0% ₹ 137.3 ₹ 22.9 18.1%
^ EPS is
annualized and
*ROE is
calculated on
Profit after Tax
-5%

57
Key Financial Trend
3866
5731
8888
1211813114
2009-10 2010-11 2011-12 2012-13 2013-14
Disbursements
31 100 290 451 550
3%
8%
16%18% 17%
2009-10 2010-11 2011-12 2012-13 2013-14
PBT & PBT Margin
PBT PBT %
0.5%
1.4%
2.7%3.0%
2.8%
2009-10 2010-11 2011-12 2012-13 2013-14
ROTA (PBT)
9301202
1788
2556
3263
2009-10 2010-11 2011-12 2012-13 2013-14
Total Income
figures in ₹ Crores
Copyright TI | All Rights Reserved www.tiindia.com

58
Particulars 2013-14 2012-13 % Growth
Disbursements 13114 12118 8%
Total income from operations 3263 2556 28%
Finance Costs 1771 1411 26%
Total Expenses 658 570 15%
Profit before Loan Losses & Std Assets Provision 834 575 45%
% of Income 25.6% 22.5%
PBT 550 451 22%
% of Income 16.9% 17.6%
PAT 364 307 19%
% of Income 11.2% 12.0%
ROTA% - PAT 1.9% 2.0%
Capital Adequacy Ratio 17.23% 19.04%
Key Financials
Copyright TI | All Rights Reserved www.tiindia.com
figures in ₹ Crores

59
Insurance
Chola MS General Insurance
Copyright TI | All Rights Reserved www.tiindia.com

60Copyright TI | All Rights Reserved www.tiindia.com
Among the fastest growing general insurance companies in India
Market Presence: Over 101 offices, Over 9000 agents and 5 bancassurance channel partners
Business holds a market share of 2.62% as on March 31st, 2014 and is the top 7th private general insurance company in India
Product basket comprises accident, engineering, health, liability, marine, motor, property, travel and rural insurance for individuals, SMEs and corporates
Leading insurer for Japanese / Korean business interests in India
Business Overview
Shareholding
74%
26%
TII Mitsui Sumitomo
Key Financials
₹ Crore FY 12-13 FY 13-14
Revenue 1652 1872
PAT 60 70

61
Business Strengths
Strong Distribution PartnersRobust Underwriting
Capability and operating efficiencies
Tailor Made Products
Strong Chola Synergies High Rural Penetration State of the Art Technology
Copyright TI | All Rights Reserved www.tiindia.com

62
Business Highlights
Chola MS grew 14% as against the growth @ 11% by private
players.
GWP (Direct) Volumes of ₹ 1621 Cr in 2012-13 and ₹ 1855 Cr in
2013-14
Net Earned Premium Business growth of 34% over last year
(Industry Growth 15%)
Operating PBT @ ₹ 118 Cr in 2012-13, ₹ 156 Cr in 2013-14
Combined Ratio @ 101.3% for FY 2013-14
Motor Pool Losses absorption completed
Awards: Innovative Hero – CIO for Mobile strategy and implementation of various mobile initiatives (Dynamic CIO Forum, part of the international CIO Magazine)
Copyright TI | All Rights Reserved www.tiindia.com

63
Key Financials
Copyright TI | All Rights Reserved www.tiindia.com
figures in ₹ Crores
Particulars 2013-14 2012-13 % Growth
Gross Written Premium (Incl. RI Accept) 1872 1652 13%
Net Written Premium 1552 1350 15%
Operating PBT 156 118 33%
Net Impact from Motor, Declined & Terrorism Pool -55 -29
PBT 102 89 14%
PAT 70 60 16%
Total Investment 2328 1724 35%
Combined ratio (CoR%) - Excl IMTPIP 101.3% 99.5%
Investment Yield % 9.3% 9.0%

64
Contents
Tube Investments of India Ltd.
About Murugappa Group
Company Financials
Business Divisions Performance
Copyright TI | All Rights Reserved www.tiindia.com

65
Consolidated Performance Trends
3181
5068
6456
77528834
2009-10 2010-11 2011-12 2012-13 2013-14
Total Revenue
166
335
536
674789
2009-10 2010-11 2011-12 2012-13 2013-14
Profit Before Tax
6.08
10.58
14.4615.47
16.67
2009-10 2010-11 2011-12 2012-13 2013-14
Earnings Per Share (Basic) (₹)
1.50
3.00 3.00
2.00 2.00
2009-10 2010-11 2011-12 2012-13 2013-14
Dividend Per Share* (₹)
figures in ₹ Crores
*Standalone
Copyright TI | All Rights Reserved www.tiindia.com
#
# ₹ 1.50 Interim Dividend & ₹ 0.5 Proposed

66
Standalone Performance Trends
2346
2963
3464 3390 3352
2009-10 2010-11 2011-12 2012-13 2013-14
Sales
158
307 322
251 264
7%
10%9%
7% 8%
2009-10 2010-11 2011-12 2012-13 2013-14
PBIT & PBIT Margin
PBIT PBIT %
4.39
9.16 9.69
5.58 5.04
2009-10 2010-11 2011-12 2012-13 2013-14
EPS
11.5%
18.4%17.1%
11.1% 10.2%
2009-10 2010-11 2011-12 2012-13 2013-14
ROCE %
figures in ₹ Crores
Copyright TI | All Rights Reserved www.tiindia.com

67
Standalone Performance Trends
81
170180
10494
2009-10 2010-11 2011-12 2012-13 2013-14
PAT
96 87
165
217
169
2009-10 2010-11 2011-12 2012-13 2013-14
Capital Expenditure
128
198
115
298
217
2009-10 2010-11 2011-12 2012-13 2013-14
Free Cash Flow
262
345367
298 301
2009-10 2010-11 2011-12 2012-13 2013-14
EBITDA
figures in ₹ Crores
Copyright TI | All Rights Reserved www.tiindia.com
Free Cash Flow = PAT + Depreciation – ∆ Working Capital

68
Key Financials
Copyright TI | All Rights Reserved www.tiindia.com
Particulars Standalone Consolidated
2013-14 2012-13 2013-14 2012-13
Net Sales / Income from Operations 3,352 3,390 8,370 7,346
Growth % -1% -2% 14% 17%
Total Income from Operations (Net) 3,526 3,566 8,834 7,752
Growth % -1% -2% 14% 18%
EBITDA 301 298 1,044 889
% to Sales 9% 9% 12% 12%
PBIT 264 251 914 781
% to Sales 8% 7% 11% 11%
Profit Before Tax 141 147 789 674
% to Sales 4% 4% 9% 9%
Profit After Tax (before Minority Interest) 94 104 518 457
% to Sales 3% 3% 6% 6%
Net Profit 94 104 311 289
% to Sales 3% 3% 4% 4%
figures in ₹ Crores

69
Key Financials (Contd.)
Particulars
Standalone Consolidated
2013-14 2012-13 2013-14 2012-13
EQUITY AND LIABILITIES
Shareholders' Funds
(a) Share Capital 37 37 37 37
(b) Reserves and Surplus 1,201 1,144 1,914 1,622
1,239 1,181 1,951 1,659
Minority Interest 1,364 1,159
Non-Current Liabilities
(a) Long Term Borrowings 638 630 10,461 8,929
(b) Deferred Tax Liabilities (Net) 52 52 58 61
(c) Other Long Term Liabilities 1,258 1 ,007
(d) Long Term Provisions 114 92
690 683 11,891 10,090
Current Liabilities
(a) Short Term Borrowings 303 303 3,485 3,298
(b) Trade Payables 585 485 859 677
(c) Other Current Liabilities 517 441 7,537 6,024
(d) Short Term Provisions 42 44 272 254
1,446 1,274 12,153 10,253
TOTAL 3,375 3,138 27,359 23,162
Copyright TI | All Rights Reserved www.tiindia.com
figures in ₹ Crores

70
Key Financials (Contd.)
ParticularsStandalone Consolidated
2013-14 2012-13 2013-14 2012-13
ASSETS
Non-Current Assets
(a) Fixed Assets 891 791 1,167 1,071
(b) Goodwill on Consolidation 352 352
(c) Non-Current Investments 1,506 1,444 1,869 1,282
(d) Deferred Tax Assets (Net) 131 70
(e) Long Term Loans and Advances 65 79 225 623
(f) Receivable under Financing Activity 13,079 11,474
(g) Other Non-Current Assets 614 460
2,462 2,314 17,437 15,330
Current Assets
(a) Current Investments 0 0 247 406
(b) Inventories 370 357 495 463
(c) Trade Receivables 446 394 614 536
(d) Cash and Cash Equivalents 30 33 1,230 764
(e) Short Term Loans and Advances 67 39 553 100
(f) Receivable under Financing Activity 6,349 5,220
(g) Other Current Assets 434 343
913 824 9,922 7,831
TOTAL 3,375 3,138 27,359 23,162
Copyright TI | All Rights Reserved www.tiindia.com

Copyright TI | All Rights Reserved www.tiindia.com
Contact:
Corporate Office:
Tube Investments of India Ltd."Dare House", 234 N S C Bose Road,Chennai- 600 001, India.
+91 44 4217 7770
+91 44 4211 0404