tti report 1752-2 · college station, texas 77843-3135 ... (us dot), rockwell international,...
TRANSCRIPT

Technical Report Documentation Page
1. Report No. 2. Government Accession No. 3. Recipient's Catalog No.
FHWA/TX-98/1752-2 4. Title and Subtitle 5. Report Date
ITS DATA MANAGEMENT SYSTEM: YEAR ONE ACTIVITIES August 1997 6. Performing Organization Code
7. Author(s) 8. Performing Organization Report No.
Shawn M. Turner, Robert E. Brydia, Jyh C. Liu, and William L. Eisele Research Report 1752-2
9. Performing Organization Name and Address 10. Work Unit No. (TRAIS)
Texas Transportation InstituteThe Texas A&M University SystemCollege Station, Texas 77843-3135
11. Contract or Grant No.
Study No. 0-175212. Sponsoring Agency Name and Address 13. Type of Report and Period Covered
Texas Department of Transportation Research Report:Research and Technology Transfer Office September 1996 - August 1997P. O. Box 5080Austin, Texas 78763-5080
14. Sponsoring Agency Code
15. Supplementary Notes
Research performed in cooperation with the Texas Department of Transportation and the U.S. Department ofTransportation, Federal Highway Administration.Research Study Title: TransLink Research Program®
16. Abstract
This report documents research conducted in the development of an ITS data management system, hereafterreferred to as “ITS DataLink.” The objective of the ITS DataLink system is to retain, manage, share, and analyzeITS data for a variety of transportation analyses. A survey of selected traffic management centers found anumber of issues related to the retention and sharing of ITS data, including institutional communication and datamanagement issues. Initial sections of this report include these and other survey findings. Backgroundinformation is also provided on the definition and selection of transportation performance measures.
Later sections of this report contain specific information on the development of the ITS DataLink system. Basedupon the literature review, the report summarizes applicable performance measures that can easily be calculatedwith ITS data. The report includes examples of performance measure calculation using ITS data from theTransGuide center in San Antonio, Texas. The report documents the desirable features of an ITS datamanagement system. The final sections of the report contain documentation of the web browser-based ITSDataLink system, which has been undergoing online testing and refinement since early 1997. The reportconcludes with findings on ITS data management systems and contains recommendations for future refinementsof the ITS DataLink system.
17. Key Words 18. Distribution Statement
Data Warehouse, Data Management, Performance No restrictions. This document is available to theMeasures, Traffic Management Centers, Loop public through NTIS:Detectors, ITS, ATMS National Technical Information Service
5285 Port Royal RoadSpringfield, Virginia 22161
19. Security Classif.(of this report) 20. Security Classif.(of this page) 21. No. of Pages 22. Price
Unclassified Unclassified 66 Form DOT F 1700.7 (8-72) Reproduction of completed page authorized


ITS DATA MANAGEMENT SYSTEM: YEAR ONE ACTIVITIES
by
Shawn M. TurnerAssistant Research Engineer
Texas Transportation Institute
Robert E. BrydiaAssistant Research Scientist
Texas Transportation Institute
Jyh C. LiuAssistant Professor
Department of Computer ScienceTexas A&M University
and
William L. EiseleAssistant Research Scientist
Texas Transportation Institute
Research Report 1752-2Research Study Number 0-1752
Research Study Title: TransLink Research Program®
Sponsored by theTexas Department of Transportation
In Cooperation with U.S. Department of Transportation
Federal Highway Administration
August 1997
TEXAS TRANSPORTATION INSTITUTEThe Texas A&M University SystemCollege Station, Texas 77843-3135


v
DISCLAIMER
The contents of this report reflect the views of the authors, who are responsible for thefacts and the accuracy of the data presented herein. The contents do not necessarily reflect theofficial views or policies of the Texas Department of Transportation or the Federal HighwayAdministration. This report does not constitute a standard, specification, or regulation. ShawnTurner (Texas certification number 82781), Robert Brydia, Jyh (Steve) Liu, and William Eiseleprepared this report.

vi
ACKNOWLEDGMENTS
The authors wish to acknowledge the hard work and dedication of several graduatestudents in Texas A&M University’s Department of Computer Science who assisted indevelopment of the ITS DataLink system:
• Mr. Gang Feng: web pages, CGI-BIN;• Dr. Dongkyoo Shin: database tables design and implementation;• Mr. Mike Thomadakis: distributed process control, database, graphics; and,• Mr. Byeong-Ki Yoo: database SQL and CGI-BIN.
The authors wish to thank the numerous traffic management center (TMC) professionalscontacted throughout this study. Any misstatements of their ITS data applications or experiencewith managing and sharing ITS data are solely the responsibility of the authors.
This research is being performed in cooperation with the TransLink™ Research Center. The TransLink Partnership includes the Texas Department of Transportation (TxDOT),®
Metropolitan Transit Authority of Harris County (METRO), United States Department ofTransportation (US DOT), Rockwell International, Southwestern Bell-Technology Resources,and the Texas Transportation Institute (TTI).
The authors also acknowledge the support and assistance of Mr. Christopher Poe, whoprovides overall leadership and direction for the TransLink Research Program at TTI.®

vii
TABLE OF CONTENTS
PAGE
LIST OF FIGURES . . . . . . . . . . . . . . . . . . . . . . . . . . . . . . . . . . . . . . . . . . . . . . . . . . . . . . . . . ix
LIST OF TABLES . . . . . . . . . . . . . . . . . . . . . . . . . . . . . . . . . . . . . . . . . . . . . . . . . . . . . . . . . . x
1 INTRODUCTION . . . . . . . . . . . . . . . . . . . . . . . . . . . . . . . . . . . . . . . . . . . . . . . . . . . . . . . . . 11.1 Problem Statement . . . . . . . . . . . . . . . . . . . . . . . . . . . . . . . . . . . . . . . . . . . . . . . 11.2 Research Objectives and Scope . . . . . . . . . . . . . . . . . . . . . . . . . . . . . . . . . . . . . . 11.3 Organization of Report . . . . . . . . . . . . . . . . . . . . . . . . . . . . . . . . . . . . . . . . . . . . 2
2 BACKGROUND . . . . . . . . . . . . . . . . . . . . . . . . . . . . . . . . . . . . . . . . . . . . . . . . . . . . . . . . . . 32.1 Review of ITS Data Retention and Management Practices . . . . . . . . . . . . . . . . . 3
2.1.1 Phoenix Traffic Operations Center . . . . . . . . . . . . . . . . . . . . . . . . . . . . . 52.1.2 Los Angeles District 7 Traffic Management Center . . . . . . . . . . . . . . . . . 62.1.3 San Francisco Bay Area Traffic Management Center . . . . . . . . . . . . . . . . 72.1.4 Georgia DOT Advanced Transportation Management System . . . . . . . . . 72.1.5 Illinois Traffic Systems Center . . . . . . . . . . . . . . . . . . . . . . . . . . . . . . . . . 82.1.6 Montgomery County Transportation Management Center . . . . . . . . . . . . 82.1.7 Detroit, Michigan ITS Center . . . . . . . . . . . . . . . . . . . . . . . . . . . . . . . . . 82.1.8 Minneapolis, Minnesota Traffic Management Center . . . . . . . . . . . . . . . . 92.1.9 TRANSCOM . . . . . . . . . . . . . . . . . . . . . . . . . . . . . . . . . . . . . . . . . . . . 102.1.10 INFORM . . . . . . . . . . . . . . . . . . . . . . . . . . . . . . . . . . . . . . . . . . . . . . . 102.1.11 MetroCommute . . . . . . . . . . . . . . . . . . . . . . . . . . . . . . . . . . . . . . . . . . 112.1.12 TranStar Traffic Management Center . . . . . . . . . . . . . . . . . . . . . . . . . . 112.1.13 TransGuide Advanced Traffic Management System . . . . . . . . . . . . . . . . 112.1.14 North Seattle Advanced Traffic Management System (ATMS) . . . . . . . 122.1.15 Toronto’s COMPASS . . . . . . . . . . . . . . . . . . . . . . . . . . . . . . . . . . . . . . 122.1.16 Summary of Findings . . . . . . . . . . . . . . . . . . . . . . . . . . . . . . . . . . . . . . 14
2.2 Summary of Data Retention and Management Practices . . . . . . . . . . . . . . . . . . 152.3 Performance Measures Based Upon Goals and Objectives . . . . . . . . . . . . . . . . 172.4 Previous Research on Transportation Performance Measures . . . . . . . . . . . . . . 172.5 Summary of Performance Measure Research . . . . . . . . . . . . . . . . . . . . . . . . . . 28
3 APPLICATIONS AND PERFORMANCE MEASURES USING ITS DATA . . . . . . . . . . . 293.1 Identifying Needs and Potential Uses for ITS Data . . . . . . . . . . . . . . . . . . . . . . 293.2 Estimating Performance Measures from ITS Data . . . . . . . . . . . . . . . . . . . . . . . 323.3 Example Calculation of Performance Measures from ITS Data . . . . . . . . . . . . . 33

viii
TABLE OF CONTENTS (Continued)
PAGE
4 DEVELOPMENT OF AN ITS DATA MANAGEMENT SYSTEM . . . . . . . . . . . . . . . . . . 414.1 Background . . . . . . . . . . . . . . . . . . . . . . . . . . . . . . . . . . . . . . . . . . . . . . . . . . . 41
4.1.1 Data Storage . . . . . . . . . . . . . . . . . . . . . . . . . . . . . . . . . . . . . . . . . . . . . 414.1.2 Database Construction . . . . . . . . . . . . . . . . . . . . . . . . . . . . . . . . . . . . . 424.1.3 Access to Data . . . . . . . . . . . . . . . . . . . . . . . . . . . . . . . . . . . . . . . . . . . 424.1.4 Data Versus Information . . . . . . . . . . . . . . . . . . . . . . . . . . . . . . . . . . . . 434.1.5 Privacy . . . . . . . . . . . . . . . . . . . . . . . . . . . . . . . . . . . . . . . . . . . . . . . . . 43
4.2 Data Management System Features . . . . . . . . . . . . . . . . . . . . . . . . . . . . . . . . . 444.2.1 Data Storage . . . . . . . . . . . . . . . . . . . . . . . . . . . . . . . . . . . . . . . . . . . . . 444.2.2 Database Access . . . . . . . . . . . . . . . . . . . . . . . . . . . . . . . . . . . . . . . . . . 454.2.3 User Interface . . . . . . . . . . . . . . . . . . . . . . . . . . . . . . . . . . . . . . . . . . . . 454.2.4 Data Aggregation and Summarization . . . . . . . . . . . . . . . . . . . . . . . . . . 464.2.5 Calculate Performance Measures . . . . . . . . . . . . . . . . . . . . . . . . . . . . . . 474.2.6 Tabular and Graphical Output Formats . . . . . . . . . . . . . . . . . . . . . . . . . 47
4.3 Documentation of the Prototype Data Management System . . . . . . . . . . . . . . . 484.3.1 System Architecture . . . . . . . . . . . . . . . . . . . . . . . . . . . . . . . . . . . . . . . 484.3.2 ITS DataLink System Cost . . . . . . . . . . . . . . . . . . . . . . . . . . . . . . . . . . 50
5 FINDINGS AND CONCLUSIONS . . . . . . . . . . . . . . . . . . . . . . . . . . . . . . . . . . . . . . . . . . . 51
6 RECOMMENDATIONS . . . . . . . . . . . . . . . . . . . . . . . . . . . . . . . . . . . . . . . . . . . . . . . . . . . 53
7 REFERENCES . . . . . . . . . . . . . . . . . . . . . . . . . . . . . . . . . . . . . . . . . . . . . . . . . . . . . . . . . . 55

ix
LIST OF FIGURES
PAGE
Figure 2-1. Geographic Location of TMCs Interviewed in the Study . . . . . . . . . . . . . . . . . . . . . 5Figure 2-2. Performance-Based Planning Process . . . . . . . . . . . . . . . . . . . . . . . . . . . . . . . . . . 18Figure 3-1. Phase One of TransGuide, San Antonio, Texas . . . . . . . . . . . . . . . . . . . . . . . . . . . 34Figure 3-2. Example of Loop Detector Data from TransGuide . . . . . . . . . . . . . . . . . . . . . . . . 34Figure 4-1. Data Flow for ITS DataLink System . . . . . . . . . . . . . . . . . . . . . . . . . . . . . . . . . . . 49

x
LIST OF TABLES
PAGE
Table 2-1. Telephone Survey Used at Selected TMCs . . . . . . . . . . . . . . . . . . . . . . . . . . . . . . . . 3Table 2-2. Summary of TMCs Interviewed in the Study . . . . . . . . . . . . . . . . . . . . . . . . . . . . . . 4Table 2-3. Level of Permanent Data Aggregation at Selected TMCs in North America . . . . . . 14Table 2-4. Recommended Measures of Effectiveness for Various Objectives . . . . . . . . . . . . . . 19Table 2-5. Criteria for Goal-Achievement Evaluation . . . . . . . . . . . . . . . . . . . . . . . . . . . . . . . 20Table 2-6. Classification of Criteria . . . . . . . . . . . . . . . . . . . . . . . . . . . . . . . . . . . . . . . . . . . . . 21Table 2-7. Performance Measures for Congestion Management Systems . . . . . . . . . . . . . . . . . 24Table 2-8. Candidate Measures of Effectiveness . . . . . . . . . . . . . . . . . . . . . . . . . . . . . . . . . . . 26Table 2-9. Preferred Measures for Evaluating the Performance
and Impact of Transportation Improvements . . . . . . . . . . . . . . . . . . . . . . . . . . . . . 27Table 3-1. Example Matrix: Level of Aggregation for ITS Data Applications . . . . . . . . . . . . . 30Table 3-2. Example of Five-Minute Point Summaries of Twenty-Second
Loop Detector Data . . . . . . . . . . . . . . . . . . . . . . . . . . . . . . . . . . . . . . . . . . . . . . . 36Table 3-3. Example of Fifteen-Minute Link Summaries of Loop Detector Data . . . . . . . . . . . . 37Table 3-4. Example of Peak Hour Corridor Summaries from Loop Detector Data . . . . . . . . . 38Table 4-1. Approximate Storage Space and Costs for One Complete Year
of TransGuide Loop Detector Data . . . . . . . . . . . . . . . . . . . . . . . . . . . . . . . . . . . . 45Table 4-2. Performance Measures in ITS DataLink . . . . . . . . . . . . . . . . . . . . . . . . . . . . . . . . . 47

1
1 INTRODUCTION
Many intelligent transportation system (ITS) components are being installed in U.S.urban areas, and vast amounts of data are currently available through these ITS components. Vehicle detectors (e.g., inductance loop, video, infrared, sonic, or radar) collect informationabout vehicle volumes, speeds, and lane occupancies. Probe vehicle systems utilize technologiessuch as the global positioning system (GPS) and radio/cellular phone triangulation to determinevehicle positions at frequent time intervals. Automatic vehicle identification (AVI) usestransponder polling to collect vehicle information at instrumented locations, enabling thecollection of travel times and average speeds along roadway sections. This ITS data is often usedonly for real-time operations and then discarded. Some traffic management centers (TMCs) savethe data, but few have a mechanism for sharing the data resources among other transportationgroups or agencies within the same jurisdiction. Even when TMCs save data, they face issuesrelated to transforming the vast amounts of data into useful information for adjusting operatingstrategies, evaluating system performance, or making decisions about future transportationinvestments.
1.1 Problem Statement
Many transportation analysts and researchers struggle to obtain accurate, reliable dataabout existing transportation performance and patterns. Models rely heavily on existingconditions for calibration purposes, and decision-makers rely on models and the existingtransportation performance to make decisions about transportation investments. The importanceof accurate, reliable data in transportation analyses is paramount to sound decisions in planning,designing, operating, and maintaining the transportation system.
An opportunity exists to utilize the vast amounts of data available through ITS for a widevariety of planning, design, operation, and evaluation purposes. The problem lies in developing aframework for retaining, managing, sharing, and analyzing the data (i.e., transforming the“mountains” of data into useful information). The information can then be used for varioustransportation analyses.
1.2 Research Objectives and Scope
The primary objective of this research is to explore several issues relating to thedevelopment of ITS data management systems. These issues include the following:
• What are the needs and potential uses of ITS data beyond real-time applications?• What performance measures are needed for these applications, and can the
available ITS data be used to calculate these performance measures?• What computer hardware and software does an ITS data management system
require?• What are the considerations for storing and aggregating ITS data?

2
For the purposes of this study, ITS data include any data that are commonly collectedthrough ITS components. ITS data typically include, but are not limited to:
• vehicle volume;• vehicle speed;• lane occupancy;• vehicle classification;• travel time; and,• vehicle classification.
1.3 Organization of Report
This report contains the following chapters:
1. Introduction - outlines the issue of using ITS data for applications other thenreal-time, and summarizes the objectives of the research;
2. Background - provides a review of ITS data retention and management practicesat selected TMCs in North America, and summarizes previous research on theselection and use of performance measures;
3. Applications and Performance Measures Using ITS Data - presents a matrixof the potential uses for ITS data and includes typical data requirements andformats. The chapter also recommends several performance measures anddescribes how ITS data can be used to calculate these measures;
4. Development of an ITS Data Management System - describes the approachused in developing the ITS DataLink system for warehousing, accessing, andanalyzing ITS data;
5. Findings and Conclusions - summarizes the findings and conclusions of this pastyear’s research; and,
6. Recommendations - provides recommendations for advancing the state-of-the-artin managing and using ITS data for a wide variety of transportation analyses.

3
Data Management Questionnaire for Traffic Management Centers (TMCs)
1. How large is the monitored system in centerline-miles? What data are being collected (e.g.,volume, speed, occupancy, classification)?
2. How are the data collected (e.g., loops, AVI, CCTV, other types of technology)?
3. How often are data sent to the center or “polled” from the center? Is aggregation of the dataperformed at local controller units (i.e., a central or distributed system)?
4. Are data saved for future use? If so, for what future uses are data saved?
5. If data are saved, are they aggregated? What is the time increment over which the data areaggregated? How was this increment determined?
6. What are the most common uses of the data? Who are the most common users of the data?
7. What are the typical agencies (or people) making requests for the data (e.g., MPOs,universities)?
8. Does the TMC have policies established for data storage and/or data sharing?
9. What are the related privacy concerns that have been encountered or are anticipated with thedata storage or sharing?
2 BACKGROUND
This chapter provides a review of ITS data retention practices at selected trafficmanagement centers (TMCs) and summarizes previous research on the selection and use ofperformance measures. Researchers surveyed selected TMCs on their retention and use of ITSdata for non-real-time applications. The first part of this chapter summarizes the results of thisTMC survey. The second part of the chapter presents various research on selection and use ofperformance measures in transportation analyses.
2.1 Review of ITS Data Retention and Management Practices
To better understand the current practices of retaining ITS data for future transportationanalyses, the research team surveyed selected TMCs across North America. The surveyquestions shown in Table 2-1 were developed and administered by telephone to determine thedata management strategies in existence and the opportunities that may exist for utilizing ITSdata.
Table 2-1. Telephone Survey Used at Selected TMCs

4
Table 2-2 shows the TMCs that the researchers interviewed in this study. The tableprovides the center name, location, web site, and contact information. Figure 2-1 shows thegeographic location of the TMCs contacted for the study.
Table 2-2. Summary of TMCs Interviewed in the Study
Location Name Internet Site AgencyContact
Person/Phone
Phoenix, Traffic Operations Phil Carter Arizona Center (602) 255-7754
http://www.azfms.com Arizona DOT
Los Angeles, Los Angeles District http://www.scubed.com/ David LauCalifornia 7 TMC caltrans/la/la_transnet.html (213) 897-4385
Caltrans
Oakland, San Francisco Bay http://www.dot.ca.gov/ Jack AllenCalifornia Area TMC dist4/links.htm (510) 286-5761
Caltrans
Atlanta, http://www.georgia- Dennis ReynoldsGeorgia traveler.com (404) 635-1031
Georgia DOT ATMS Georgia DOT
Oak Park, Traffic Systems http://www.ai.eecs.uic.edu/ Tony CioffiIllinois Center GCM/GCM.html (708) 524-2145
Illinois DOT
Rockville, Montgomery County John Riehl County Dept. ofMaryland TMC (301) 217-2190 Public Works and
http://www.dpwt.com
Montgomery
Transportation
Detroit, http://campus.merit.net/ Ross BrehmerMichigan mdot/its.html (313) 256-9800
Michigan ITS Center Michigan DOT
Minneapolis, http://www.dot.state.mn.us/ Ron DahlMinnesota tmc (612) 341-7269
Minnesota TMC Minnesota DOT
Jersey City, Sanjay PatelNew Jersey (201) 963-4033
TRANSCOM csnj/issues/ TRANSCOMhttp://www.travroute.com/
apr96transcom.html
Long Island, http://metrocommute.com/ Ray SchiemesNew York LI/inform.html (516) 952-6872
INFORM New York DOT
New York City, Dan BroeNew York (212) 406-9610
MetroCommute http://metrocommute.com MetroCommute
Houston, Carlton AllenTexas (713) 881-3285
TranStar TMC http://traffic.tamu.edu Texas DOT
San Antonio, http://www.transguide.dot. David Kingery SouthwestTexas state.tx.us/overview.html (210) 731-5154 Research Institute
TransGuide ATMS
Seattle, Mahrokh ArefiWashington (206) 440-4462
North Seattle ATMS regions/northwest/nsatms/ Washington DOThttp://www.wsdot.wa.gov/
atmsmain.htm
Toronto, David Tsui Ontario MinistryOntario, Canada (416) 235-3538 of Transportation
COMPASS http://compass.gov.on.ca

5
Figure 2-1. Geographic Location of TMCs Interviewed in the Study
2.1.1 Phoenix Traffic Operations Center
Phoenix was one of four cities chosen for deploying ITS technology for the FederalHighway Administration (FHWA) funded Model Deployment Initiative (MDI). Other areas thatwere chosen include TRANSCOM (New Jersey), San Antonio, Texas, and Seattle, Washington. Upcoming sections describe facilities in these other MDI locations. The Traffic OperationsCenter (TOC) in Phoenix is used for many purposes including freeway management. The systemmonitors 67 km (41.5 miles) of freeway and began operation in September 1995.
Inductance loops and close-caption television (CCTV) are the two primary methods usedto monitor the system. Due to privacy concerns, the Phoenix TOC does not record CCTVimages. Loop stations are located approximately every 0.54 km (0.33 mile) throughout thecoverage area with one loop in each lane of traffic, and the loop data are archived. The loopscollect volume, vehicle length, speed, and lane occupancy. This information is sent to the TOCevery 20 seconds. The TOC has saved all 20-second data in a UNIX format since the opening ofthe Center. The TOC has also saved data in a five-minute format for each lane for one year. This five-minute summary is much easier to access according to TOC personnel. Freeway speedmaps on their web site utilize fifteen-minute real-time summaries of the loop data.

6
The developers of the TOC in Phoenix realized that the 20-second data would inevitablybe valuable information for transportation applications and research. In addition, since theCenter has not been in operation long, data storage has not become a significant concern. Currently, a majority of the users of the data are DOT or TMC personnel; however, somerequests have been made by universities for research purposes. Generally, operational requestsdesire five-minute data. Fifteen-minute summaries of the data are often desired for simple trafficcounts to estimate construction impacts and for typical design work.
TOC personnel discussed several issues relating to data management considerations anduses for transportation analyses. The first consideration is that the large amounts of data are verydifficult to manage with most spreadsheet and database software. In one year, the Phoenix TOCgenerates 15 million lines of data. This often requires that the disaggregate (e.g., 20-second) databe put into an aggregated form (e.g., 5 or 15 minutes) to perform analyses. The issue of adequateanalysis tools should be considered in the planning stage of the data management system.
Another important point made was the interest in a larger system of ITS data collection,aggregation, and dissemination. The point was made that a National ITS database (e.g., similarto the Highway Performance Monitoring System, or HPMS) may be more appropriate than onethat simply evaluates a single location or metropolitan area. Although local systems are clearlyvaluable, a National database or repository would allow for a central storage of data from severalurban areas. Eventually, such a system might allow for comparisons to be made between urbanareas.
2.1.2 Los Angeles District 7 Traffic Management Center
The Los Angeles Traffic Management Center (TMC) has been in operation for severalyears and monitors 1,204 directional km (748 directional miles) of roadway. The TMC isprimarily used to monitor and verify incidents in the freeway coverage area. Both inductanceloops and CCTV are in operation in the monitoring system. DOT personnel use the CCTVs forverifying incidents and do not record the video for future use due to motorist privacy and liabilityconcerns. Two television stations have a connection to the CCTVs as well. The media do nothave control over the cameras; they simply have a connection to the CCTVs for simple viewing.
The TMC polls the loop stations every 30 seconds and data from these inductance loopsare saved for future use. Over 1,000 loop stations placed at approximately 0.8 km (0.5 mile)spacings in each lane provide volume and lane occupancy data. The loop stations consist ofsingle loops, and speed is estimated from the volume and lane occupancy data. The TMC savesthree days of 30-second data and four days of five-minute summaries into temporary storage. The TMC has saved the 30-second data onto circular tapes since the opening of the Center. Thedata saved to temporary storage is much easier to retrieve than the data stored on tapes on themainframe computer. DOT personnel developed special software that is necessary for dataretrieval from the mainframe computer.

7
Typical users of the data include a local cable channel that provides a map of thefreeways with incident information. In addition, this information is posted to the World WideWeb site. Local universities have also used the data for research purposes.
2.1.3 San Francisco Bay Area Traffic Management Center
In the near future, the San Francisco Traffic Management Center (TMC) will cover all thefreeways in the nine-county bay area. The TMC uses loops to obtain volume, speed, and laneoccupancy data. They estimate vehicle class based upon the volume, speed and lane occupancydata. The TMC does not currently utilize CCTVs but anticipates them to be part of the futuresystem for monitoring freeway conditions. Loop data are sent to the TMC every 30 seconds in abinary format and eventually converted to an ASCII-text format.
The TMC in San Francisco does not archive data. The San Francisco Bay Area TMCpersonnel recognize the importance of the data for future transportation applications. Unfortunately, the contract for the TMC development did not provide consideration for thesaving of data. An effort is underway within the TMC to develop procedures for archiving andsummarizing the data in a desired format. This effort is being lead by the Office ofEnvironmental Engineering and Modeling and Forecasting. Currently, their staff is evaluatingmethods to aggregate the data into the five-minute level and to peak hours per lane. They wish tohave the system aggregating and producing five- and fifteen-minute summaries within the nextsix months. The TMC personnel commented that for planning and modeling purposes, five-minute data summaries are most desirable. Requests at the TMC from researchers tend to be formuch more detailed data. Other area transportation agencies, including the MetropolitanTransportation Commission (MTC), have expressed an interest in the development of an ITSdata management system.
One difficulty in the development of the system appears to be the large quantity of dataavailable for use. The size alone makes the large amount of data difficult to manage. Determining the type of aggregation level to provide is also a concern since different usersappear to desire different levels of aggregation for different applications.
2.1.4 Georgia DOT Advanced Transportation Management System
The Georgia DOT opened their Advanced Transportation Management System (ATMS)in May 1996. This system utilizes 360 video detection cameras to monitor 101 km (63 miles) offreeway in the Atlanta metropolitan area. The cameras obtain vehicle volume and laneoccupancy data and estimate speed information. The video detection cameras are locatedapproximately every 0.54 km (0.33 mile) in the monitored system.
Data are sent to the ATMS from the loop stations every 20 seconds and are not currentlyarchived at the Center. DOT personnel use the data for monitoring the system and investigatingincidents and accidents. The DOT has begun efforts to save the data at hourly and 15-minute

8
time periods. To date, most data requests have been from Georgia DOT personnel. However,DOT personnel anticipate that requests from outside individuals and agencies will increase. Therefore, they are considering methods to aggregate the data for future use and ease of access.
2.1.5 Illinois Traffic Systems Center
The Traffic Systems Center (TSC) currently monitors 219 km (136 miles) of freeway andthe system will be expanded in the near future to 241 km (150 miles). The system includesapproximately 2,250 loops (approximately 0.8 km (0.5 mile) spacing) at to collect volume andlane occupancy data. The Center also operates three CCTV cameras for monitoring purposes. The loop data is recorded in real-time (i.e., each “pulse” is sent to the Center when a vehiclepasses over a loop detector). At the Center, the individual data points are aggregated to the 20-second, one-minute, and five-minute aggregation levels.
The Center personnel store the data in five-minute binary format on nine-mm tapes, andmake the data available to individuals who express interest. The tape storage and binary formatmakes data retrieval rather difficult. The Center personnel are seeking funding to upgrade thedata storage and management process. Most requests for data are internal for local work;however, under the Freedom of Information Act, there are requests from outside the DOT for thedata. The Center personnel desire a new mechanism for data management since the currentsystem makes data retrieval difficult.
2.1.6 Montgomery County Transportation Management Center
The Transportation Management Center (TMC) located in Montgomery County monitorsarterial facilities only. Currently, 46 CCTVs are in operation, but future plans will utilize 200CCTVs. In addition, the TMC includes about 1,000 loop detectors. Currently, the TMCpersonnel save none of the data that is used in real-time at this Center. The interrupted flow ofthe arterial streets being monitored by this TMC may make the loop detector data lessmeaningful for non-real-time applications.
2.1.7 Detroit, Michigan ITS Center
The Michigan ITS Center began operation in 1981 and currently monitors 52 km (32miles). The Center is expecting to have 225+ km (140+ miles) in the system within the nextyear. There are about 1,300 detector loops and 12 CCTV cameras in the field. Loops are locatedat approximately a 0.54 km (0.33 mile) spacing. As with all the TMCs contacted, the MichiganCenter uses CCTVs to monitor and verify incidents in the field and do not save the video. Thesystem collects average vehicle length, volume, and lane occupancy data and estimates averagespeeds. Double-loop detector stations located every 4.8 km (3.0 mi) along the system providebetter estimates of speed. The Center personnel aggregate the data to the one-minute level forspeed maps displayed on the World Wide Web. Since 1994, the Center has stored one-hour

9
summaries of volume data. Due to budgetary constraints, this is the only data that is being savedat the Center.
There are several users for the data including internal DOT requests (e.g., planning andoperations divisions), nearby universities, and the Southeast Michigan Council of Governments(the local Metropolitan Planning Organization).
A major concern at the Michigan ITS Center is the accuracy of the loop data that arebeing collected. This issue is not unique to the Michigan Center as detector reliability is oftenquestioned and maintenance is high. Algorithms have been created and implemented into theprograms that create the flow maps by comparing determined or reported speeds to adjacentsections. Software that provides a reasonable estimate of “smoothed” speeds along a roadway isa useful technique to address this concern.
2.1.8 Minneapolis, Minnesota Traffic Management Center
The Minnesota Traffic Management Center (TMC) monitors 282 km (175 miles) (75percent) of the freeways in the twin cities metropolitan area. Approximately 3,000 loop detectorsare in place at 0.8 km (0.5 mile) spacings. In addition, there are 180 CCTVs throughout thesystem at a 0.6 km (1.0 mi) spacing. TMC personnel use the CCTVs to monitor incidents andverify algorithms. The loop detectors collect average volume per lane across lanes at a givenlocation, occupancy (presence), and vehicle length. Average speed is estimated from this data. Center personnel note that this estimated speed is an adequate estimate for most uses, includingspeed maps on the World Wide Web.
Loop stations are polled from the Center every 30 seconds as an average across lanes. Every five minutes, the data are aggregated and saved. The TMC software compress the five-minute data from 2.3 MB to 1.5 MB and save it on the hard disk every day. The process isautomatic and the data have been saved since the Center opened in 1993. In addition, the 30-second mainlane loop data are also archived and logged. A seven-day “wrap around” file is keptin readily accessible computer disk storage for easy access. The decision to save the data at the30-second level was made since the space was available and the lowest level of disaggregationseemed necessary for the requests of the data being made. In addition, summaries of 5 minutes,15 minutes, or other time periods can easily be obtained from the 30 second data. Most requestsare from the DOT for traffic analysis, construction impact determination, and planningapplications. Researchers from local universities often request the data as well. Due to manydata requests from agencies and individuals external to the Center, a data distribution service(DDS) has been developed. This service allows interested individuals and agencies to receive the30-second data stream through the Internet.

10
2.1.9 TRANSCOM
TRANSCOM (the Transportation Operations Coordinating Committee) opened in 1986to coordinate traffic management in New York, New Jersey, and Connecticut. TRANSCOM wasone of four TMCs in the United States to be selected for funding for the Model DeploymentInitiative. Several agencies in the tri-state area supply traffic management information toTRANSCOM.
A project of particular interest is TRANSCOM’s System for Managing Incidents andTraffic (TRANSMIT). The TRANSMIT system is using vehicles with automatic vehicleidentification (AVI) transponders installed on the vehicles. These “E-Z Pass” tags are used fortoll collection and also allow for using the vehicles as probes of the traffic flow. TheTRANSMIT system collects speed and travel time data for use in incident detection. TheTRANSCOM system also uses CCTVs for verification of the AVI system and incidentmanagement, but does not save CCTV video. The tag “reads” come into the Center in real-timeas they occur in the field. The TMC software aggregates and saves this information into 15-minute time periods. The system does not save real-time tag reads for each vehicle. Furthermore, privacy concerns are eliminated since readings of the tag account numbers are notsaved by the system. A tag number is read; however, it is a dummy tag number that cannot beused to trace individual vehicles. The system has been in operation for six months andTRANSCOM operators are pleased with its performance. TRANSCOM personnel claim that thesystem costs much less than loop installation and maintenance, especially since lane closure isnot necessary for routine repairs and maintenance. Requests for the AVI data have been fororigin-destination surveys and planning for construction.
The AVI data is the only data that TRANSCOM saves. Centers throughout the tri-statearea simply send information regarding incidents to TRANSCOM but not the raw data that isused in their algorithms. TRANSCOM personnel save text files which describe the incidents thathave occurred and been managed by the Center.
2.1.10 INFORM
INFORM (INformation FOR Motorists) monitors 56 km (35 miles) of the central corridorof the Long Island Expressway (Route 495). The Center polls the 2,400 loop detectors 60 timesper second. The data are then aggregated to 1/4 second, one minute, and 15 minutes at theCenter. The loops are located at 0.8 km (0.5 mile) spacings, one per lane, and collect volume,lane occupancy, and vehicle length data. Vehicle speeds are estimated from this data. The 15-minute data are saved every day in a compressed ASCII text file in a 15-minute format. Thesedata are archived for a three month period and then the tapes are overwritten.
The data management system was developed due to budget and space constraints. Typical data requests are internal and are from planning, operations, and design groups. Ofparticular interest is the fact that the planning department would like the data in a five minute

11
format to be consistent with the data produced by their count stations, which are separate fromthose feeding the INFORM system. Requests for data are also on the increase from researchersfor algorithm development and accident prediction models.
2.1.11 MetroCommute
MetroCommute is a private company in New York that provides traveler information toNew York commuters and travelers. They obtain their data through a link to the INFORMsystem. MetroCommute adds incident and construction information to the INFORM data. Detours are also provided to commuters. MetroCommute has archived their data in one-minuteintervals since June 1996. MetroCommute personnel are analyzing the data as well andsearching for daily trends in travel times. In addition, analytical tools and models for correlatingaccidents and evaluating incidents are being studied. MetroCommute personnel stress theimportance of research to evaluate and analyze the information being brought into the Centersince it is too large a task for private industry to adequately evaluate. MetroCommute provides agood example of a private company that is utilizing a feed to real-time travel information forenhanced traveler information for motorists.
2.1.12 TranStar Traffic Management Center
The Houston TranStar Traffic Management Center (TMC) provides traffic managementfor 257 km (160 miles) of the Houston freeway system. By 1998, TranStar expect to cover 370km (230 miles). Currently, loop detectors spaced at 0.8 km (0.5 mile) provide real-timeindications of traffic flow by providing volume, lane occupancy, and speed data. CCTVs are alsoused for surveillance, but the video is not recorded. Loop data, which cover approximately 48km (30 miles), are sent to the Center every 20 seconds, but are not archived.
Houston also has an extensive AVI system in operation. Approximately 175,000 tags arein circulation in the metropolitan area, and reads on the tags are sent to the Center in real-time asthey occur. AVI data are stored in 15-minute summaries for future use. Currently, the HoustonTranStar system utilizes the ITS data that are available for real-time applications includingfreeway management and operations. The AVI data are also used to update the speed map on theWorld Wide Web site. In addition, AVI data have been used for research applications includingquantifying the benefits of HOV lanes and ramp metering in Houston.
2.1.13 TransGuide Advanced Traffic Management System
The City of San Antonio is another of the four cities selected for the national deploymentof the intelligent transportation infrastructure (ITI). The TransGuide Advanced TrafficManagement System (ATMS) currently covers 42 km (26 miles) of freeways with loop detectorsplaced at 0.8 km (1/2 mile) spacings. This year, the system will be expanding to 85 km (53miles). The loop detector stations collect volume, lane occupancy, and speed data. In addition,an AVI system is planned for San Antonio and will cover 157 km (97.5 miles) on different
12
facilities than the 85 km (53 miles) with loop detectors. The AVI system will produce vehicletravel time and average speeds. The AVI tag reads will be scrambled so that the reads cannot betraced to an individual driver.
TransGuide computer servers poll the loop stations every 20 seconds. The TMC save thisdata in disaggregate form and make it available on their Internet site. Providing data via theInternet site reduces the time spent finding data that is requested. The TMC also stores the loopdata in 15-minute summaries on their Internet site. Users of the data that TransGuide collectshave included researchers and requests internal to the Department. Research requests for the datahave been for incident detection algorithm development. Additional research at the TexasTransportation Institute (TTI) is developing an ITS data management system using theTransGuide loop detector data (described in this report). The system will allow the user to clickon the roadway facilities, time of day, level of aggregation, and performance measures (e.g.,travel time, average speed). The system will then query a database to obtain summary reports ofthe information requested by the user. In addition, users access the ITS data management systemthrough a web site for use by individuals in different areas.
2.1.14 North Seattle Advanced Traffic Management System (ATMS)
Seattle is the forth city selected for the MDI. The North Seattle ATMS monitorsapproximately 161 km (100 miles) of freeway system in the Seattle area. Loop detectors placedat 0.8 km (0.5 mile) spacings collect volume, lane occupancy, and speed data. The data fromthese detectors are sent to the Center every 20 seconds automatically. The TMC also operatesCCTVs but uses them for monitoring purposes only. They do not record any video.
The North Seattle ATMS stores loop detector data at the five-minute aggregation level. Six months are saved on a CD, and data exists in this form for the last five years. Data were alsosaved in the early 1980s, but it is not in CD form. Requests for the data are from other agencies,consultants, media for five or ten year trends, universities, and from within the Department. Dataare provided to those who request it under the Freedom of Information Act. The North SeattleATMS personnel pointed out the large amount of public support that the traffic information onthe World Wide Web generates. The public appreciates the information, which aids in makingthe initiative a success.
2.1.15 Toronto’s COMPASS
COMPASS is a traffic management system that monitors portions of Highway 401 inToronto, Canada. Loop detectors are located in 35 km (22 miles) of the roadway and 56 CCTVsare located along 45 km (28 miles) of the roadway. There are approximately 400 detectorstations spaced from 600 to 800 meters apart. This includes about 1,700 loops. The loopsprovide volume, occupancy (presence), average speed, and average vehicle length data to theCenter as they are polled every 20 seconds. The 20-second data comes into the Center and isaggregated in the five-minute, 15-minute, one hour, daily, and monthly time periods.

13
The TMC archives all data for 20-second and five-minute time increments. For datasummaries of 15 minutes or more, only volume data are saved. Data are archived on 8 mm datacartridges. In addition, the COMPASS computer systems can hold 2 days of 20-second loopdata, 30 days of five-minute and 15-minute data, and about 200 days of hourly data. The five-minute time increment was selected because it appeared to provide a convenient time incrementthat many users could utilize. Common users and uses of the data include researchers desiring20-second data for simulation and algorithms, Internet flow maps, real-time incident detectionCOMPASS algorithm, and in-house requests. In-house requests account for about 60 percent ofdata requests (traffic forecasts, roadway impact analyses).

14
2.1.16 Summary of Findings
Table 2-3 summarizes the level of permanent data aggregation and storage at the TMCsthat were interviewed in this study. Three of the 15 TMCs interviewed are not currently storingany of the ITS data that are collected. Furthermore, there does not appear to be a consistentaggregation level or levels among the TMCs that are saving data. Most TMCs save data at timeperiods ranging from less than one minute to 15 minutes. Based upon the interviews conducted,this does not appear to be the result of different uses and users of the data at the different TMCs. The interviews revealed that the requests for data were consistent among the TMCs. Users anduses for all the TMCs include requests within the DOT, research requests, and private firmrequests. Internal requests include traffic management and monitoring, planning applicationssuch as demand estimation and forecasting, and construction impact analyses (e.g., laneclosures). Research requests are for uses such as simulation and model or algorithmdevelopment (e.g., accident prediction, incident detection algorithms).
Table 2-3. Level of Permanent Data Aggregation at Selected TMCs in North America
TMC < 1 min. 1 min. 5 min. 15 min. Data Not Stored
Phoenix TOC U U U
Los Angeles (Caltrans District 7) U
San Francisco Bay Area U
Georgia DOT, Atlanta U
Illinois Traffic Systems Center U
Montgomery County (MD) U
Michigan ITS Center, Detroit U
Minnesota TMC, Minneapolis U U
TRANSCOM U
INFORM U U U
MetroCommute U
TranStar U
TransGuide U U
North Seattle ATMS U
COMPASS, Toronto U U
Note: Stored data for the TMCs indicated in this table are from inductance loop detectors exceptTRANSCOM (AVI) and TranStar (AVI).

15
2.2 Summary of Data Retention and Management Practices
The results of this survey provide valuable insight into data management and archivingissues, concerns, and experiences from some of the more advanced TMCs in North America. The following conclusions can be drawn:
• Planning for Data Retention and Management - A common theme throughoutthe surveys is that adequate consideration be given to the data management andanalysis capabilities in the TMC. This includes ensuring prior planning for dataneeds and storage space. Consideration should also be given to ensuring that thesystem operates efficiently. This will reduce the cost of obtaining data forrequests. A full-time data management staff and/or an individual who isresponsible for the data management and archiving is also an important element toevaluate when developing the system.
• Identify Appropriate Levels of Detail - Many TMCs recognized early in theirdevelopment the importance and value of obtaining and archiving detailed datafrom field detectors (i.e., at every 20 or 30 seconds). However, many of theseTMCs still struggle with identifying what aggregation levels are necessary fordifferent applications. Table 2-3 provides some insight into this based upon theexperiences of the TMCs surveyed.
• Storage Capacity and Management - ITS data potentially requires largeamounts of data storage capacity. With modern computing technology this can besupplied at a moderate cost; however, the data can become difficult to managewithout an efficient data management strategy. With data in a disaggregate form(e.g., 20 second), this consideration becomes more critical.
• Regional Data Repository - There is often a desire by transportation agencies(e.g., Metropolitan Planning Organizations) for ITS data in a given region. Aregional data repository could allow data management to occur at a centrallocation on a regional level. The TRANSCOM system in New Jersey provides anexample of the first step in the development of such a system that covers a tri-state area.
• Relation to ITS National Architecture - Another issue that arose was therelationship between these ITS data management systems and the ITS NationalArchitecture. The Architecture does include some provisions for the storage andmanagement of data in planning subsystems. However, TMCs need additionalguidance with these “planning subsystems” and related data dictionaries.

16
• Use of CCTV - TMCs generally use CCTVs only for incident monitoring andsystem verification in real-time. The images produced from the cameras arerarely, if ever, recorded due to liability and privacy concerns.
• Public and Professional Support - Public and professional support of dataretention and management is important. Fundamentally, TMCs are established forensuring the efficient and safe mobility of a community. The benefits of TMCsmust be apparent to the general public. The public has generally looked veryfavorably upon the traveler information that is provided via the Internet from thedata coming into the TMCs.
Further, professional support is also important. There are many benefits to havingdata from TMCs available for future transportation analyses. Benefits can beshown in many transportation applications. For example, planning and operationsprofessionals can obtain valuable information from the data entering TMCs. Inaddition, decision-makers can receive assistance with the increased data forbenefit/cost estimates and analyses. To ensure that data are provided for thesepurposes, cross-disciplinary coordination and communication is essential (e.g.,ITS operations personnel communicating with planning personnel).
Many of the issues summarized above are common to several of the TMCs currently inoperation. There is a strong desire for systems that can manage the large amounts of data in amanner that permits easy access to the data at different aggregation levels.
The remainder of this chapter provides background information on the selection andapplication of performance measures. There is an opportunity to use the ITS data being saved inthe TMCs for the calculation of a number of performance measures.

17
2.3 Performance Measures Based Upon Goals and Objectives
The first step in transportation analyses, even before selecting performance measures, isto define goals and objectives of the transportation plan or improvement (Figure 2-2). Thesegoals and objectives clearly define the desired outcome of the plan or improvement. Once thedesired outcome has been specified, then the appropriate performance measures can be selected. Examples of goals and objectives statements that are rather broad include:
“To reduce congestion and increase economic productivity . . .”“To provide a high quality of transportation service . . .”“To provide accessibility to jobs, retail shopping, and public services . . .”
Goals and objectives may also be more focused for particular types of analyses orprograms, such as:
“To minimize the noise impacts along the transportation corridor . . .”“To increase the safety of commuters . . .”“To increase the operating efficiency . . .”
2.4 Previous Research on Transportation Performance Measures
The literature contains several examples of selecting performance measures based uponspecified goals and objectives. Abrams and DiRenzo (1) developed a list of measures ofeffectiveness for comparing multimodal transportation alternatives, which is shown in Table 2-4. The table illustrates that a number of different measures can be used for different goals andobjectives.
Stuart and Weber (2) suggested the use of a goal-achievement methodology forcomparing a large number of multimodal alternatives. In other words, alternatives are contrastedto one another by comparison of how well each achieves a defined goal for the transportationimprovement. Table 2-5 lists goals, objectives, and evaluation measures from a case studyexamining the Los Angeles/San Diego intercity corridor.

18
Figure 2-2. Performance-Based Planning Process (Adapted from Reference 3)

19
Table 2-4. Recommended Measures of Effectiveness for Various Objectives (Adapted from Reference 1)
Objective: Minimize Travel Time Objective: Maximize Pedestrian and Bicycle TravelPerson-Hours of Travel Bicycle CountsPoint-to-Point Travel Time Pedestrian CountsResponse Time for Dial-a-Ride TransitVehicle DelayVehicle-Hours of Travel Critical Lane VolumeVehicle Stops Level of Service
Objective: Minimize Travel CostsParking CostPoint-to-Point Out-of-Pocket Travel CostsPoint-to-Point Transit Fares Active Revenue Vehicles
Objective: Maximize SafetyAccidents Operating Cost per Passenger TripAccident Rate Operating Cost per Revenue Vehicle-Km (Mi)Freeway Incident Rate Operating Revenue/Operating CostsTraffic Violations Passengers per Revenue Vehicle-Hour
Objective: Maximize SecurityCrimes
Objective: Maximize Comfort and ConvenienceActive Revenue Vehicles with Working A/C & Heat Operating DeficitsFrequency of Transit Service Operating RevenueHours of Transit OperationsParking AccumulationComfort & Convenience Capital CostsTransfers per Transit PassengerTransit Load FactorTransit Transfer Time Noise LevelsTrip DistanceWalking Distance from Parking Location to Dest.
Objective: Maximize ReliabilityFreeway Incident DelayPerceived Reliability of ServiceSchedule Adherence Energy ConsumptionVariance of Average Point-to-Point Travel Time
Objective: Minimize Auto Usage RidershipIntersection Vehicle Turning Movements Transportation Disadvantaged RidershipNumber of Car PoolsNumber of Vehicles by OccupancyPerson-Km (Mi) of Travel Dollar SalesPerson Trips EmploymentTraffic VolumeVehicle-Km (Mi) of Travel
Objective: Maximize Transit UsageInformation Requests Population within 0.4 km (0.25 mi) of Bus RoutePassenger-Km (Mi) of TravelTransit Passenger
Objective: Maximize Capacity
Parking SupplyVolume/Capacity Ratio
Objective: Maximize Productivity
Inspection & Maintenance Cost per Labor HourLength of Queue
Passengers per Revenue Vehicle-Km (Mi)Revenue Vehicle-Km (Mi) per Active Revenue Vehicle
Objective: Minimize Operating CostsOperating and Maintenance Costs
Objective: Minimize Capital Costs
Objective: Minimize Noise Impacts
Objective: Minimize Air PollutionConcentration of PollutantsTons of Emissions
Objective: Minimize Energy Consumption
Objective: Maximize Transportation Disadvantaged
Objective: Minimize Economic Impacts
Objective: Maximize EquityPoint-to-Point Travel Costs to Major Activity CentersPoint-to-Point Travel Time to Major Activity Centers
Objective: Minimize DisplacementAcres of Land AcquiredStructures Displaced

20
Table 2-5. Criteria for Goal-Achievement Evaluation (Adapted from Reference 2)
Goal Objective Evaluation Measure
Improve multimodal balance
Ridership levels Number of weekday person tripsWeekday mode-split percentage
Revenue-cost viability Annual revenue to operating cost ratio
Investment efficiency Annual operating cost per passenger-kmAnnual capital cost per passenger-km
Implementation feasibility Future revenue to operating cost ratioFuture revenue to total cost ratio
Geographic balance Modal improvement costs by county
Modal coordination Number of multimodal terminalsJudgmental rating if improvement staging
Effectively meet interregionaltravel demands
Multimodal rights-of-way Bimodal route distanceTrimodal route distance
Collection-distribution Judgmental rating by modeinterfaces
Capacity-demand balance Volume-capacity ratios on peak links(public modes)
Minimize undesired social,economic, and environmentalimpacts
Coastal environment Judgmental rating by mode
Open space resources Designated open space and parksconsumed
Ecological and historical Number of intrusions on historical orresources archaeological sites
Agricultural resources Agricultural land consumedVacant land consumed
Transportation noise Noise level at 15 mMaximum frequency of service
21
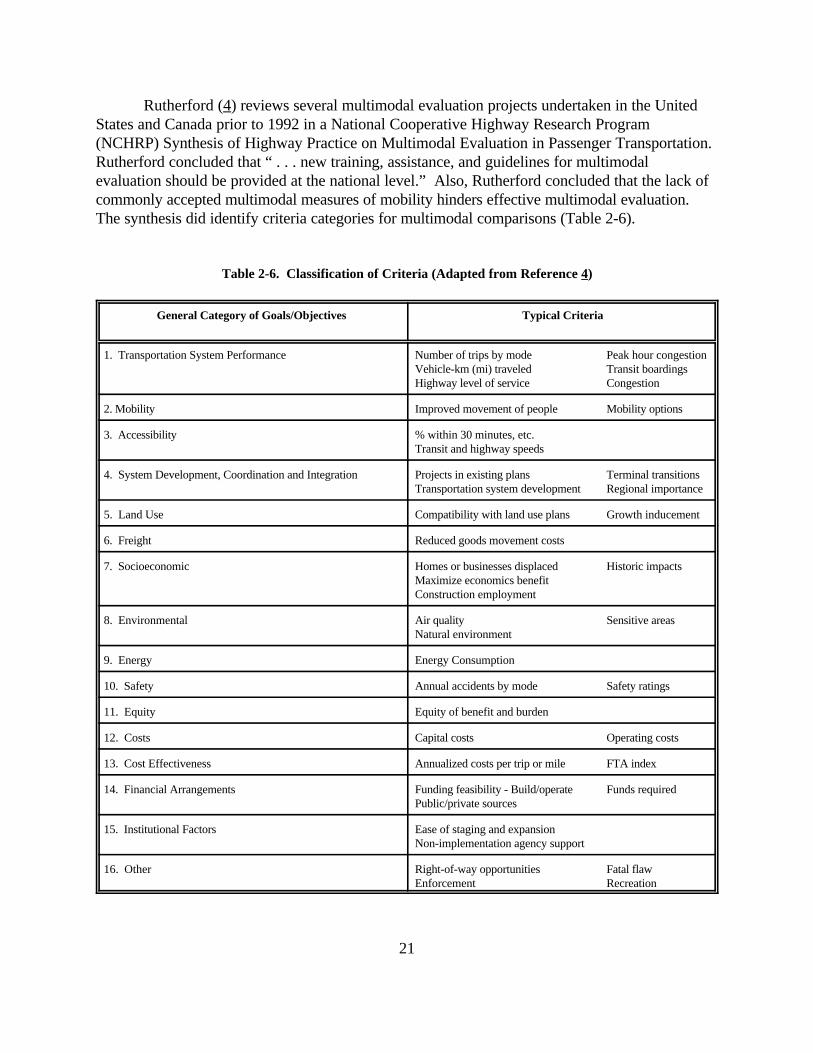
Rutherford (4) reviews several multimodal evaluation projects undertaken in the UnitedStates and Canada prior to 1992 in a National Cooperative Highway Research Program(NCHRP) Synthesis of Highway Practice on Multimodal Evaluation in Passenger Transportation. Rutherford concluded that “ . . . new training, assistance, and guidelines for multimodalevaluation should be provided at the national level.” Also, Rutherford concluded that the lack ofcommonly accepted multimodal measures of mobility hinders effective multimodal evaluation. The synthesis did identify criteria categories for multimodal comparisons (Table 2-6).
Table 2-6. Classification of Criteria (Adapted from Reference 4)
General Category of Goals/Objectives Typical Criteria
1. Transportation System Performance Number of trips by mode Peak hour congestionVehicle-km (mi) traveled Transit boardingsHighway level of service Congestion
2. Mobility Improved movement of people Mobility options
3. Accessibility % within 30 minutes, etc.Transit and highway speeds
4. System Development, Coordination and Integration Projects in existing plans Terminal transitionsTransportation system development Regional importance
5. Land Use Compatibility with land use plans Growth inducement
6. Freight Reduced goods movement costs
7. Socioeconomic Homes or businesses displaced Historic impactsMaximize economics benefitConstruction employment
8. Environmental Air quality Sensitive areasNatural environment
9. Energy Energy Consumption
10. Safety Annual accidents by mode Safety ratings
11. Equity Equity of benefit and burden
12. Costs Capital costs Operating costs
13. Cost Effectiveness Annualized costs per trip or mile FTA index
14. Financial Arrangements Funding feasibility - Build/operate Funds requiredPublic/private sources
15. Institutional Factors Ease of staging and expansionNon-implementation agency support
16. Other Right-of-way opportunities Fatal flaw Enforcement Recreation

22
Cambridge Systematics (5) presents performance measures for the NationalTransportation System that are based upon the following broad objectives:
• Economy: effects of transportation on the level of economic growth andproductivity, employment, and profitability of American business at home andabroad;
• Social Well-Being: impacts of transportation on access to opportunity, mobility,and quality of life, particularly in consideration of disadvantaged marketsegments;
• National Security: maximum capability to mobilize armed forces or police tointervene in international or domestic disturbances which threaten the generalwelfare; maximum capability to respond to public safety in times of nationalemergency or natural disasters;
• Safety: impact of transportation actions on the safety of the traveling public, intransport of goods, or in relation to those persons/activities affected bytransportation accidents;
• Environment: impact of transportation programs, actions, or use on levels of airpollution, noise, or toxic spills; and,
• Natural Resources: transportation’s drain on non-renewable resources such asenergy, parklands, and nature habitats.
Cambridge Systematics then develops performance measures that fall within thefollowing topology:
I. Transportation System Performance Measures
• Effectiveness: measures of access and quality of service, primarily from auser perspective;
• Efficiency: measures of the cost-effectiveness and utilization efficiencyof the transportation system, primarily from the perspective of suppliersand society; and,
• Descriptors: key statistics on extent and condition of the transportationsystem, and levels of usage.

23
II. Societal Impact Performance Measures
• Types of Societal Goal/Concern: - Economic activity, productivity- Social well-being, freedom of choice, equity- Safety and security- Environmental impact and preservation- Consumption of energy and non-renewable resources
• Effectiveness: degree to which the goal/concern is increased or decreasedas a result of transportation initiatives; and,
• Efficiency: direct cost to provide the transportation initiative, and thesocietal efficiency or “tradeoff” in relation to changes in the condition ofother social goals.
The study contains numerous performance measures that fit into this evaluationframework, both for passenger and freight transportation systems.
Related research presents performance measures for various categories or specificimpacts and applications. A study performed by Cambridge Systematics (6) for FHWAexamined the performance measure needs for congestion management systems. CambridgeSystematics found a wide range of measures in their review of the practice for corridor analyses(Table 2-7).

24
Table 2-7. Performance Measures for Congestion Management Systems(Adapted from Reference 6)
Measure Category Performance Measure
Time-Related average travel speedaverage travel timeaverage travel ratetravel time contoursorigin-destination travel timepercent travel time under delay conditionspercent of time average speed below “X”
Volume VMT/lane-km (mi)traffic volume
Congestion Indices congestion indexroadway congestion indexTTI’s suggested congestion indexexcess delay
Delay delay per tripdelay per vehicle-km (mi) of travelminute-km (mi) of delaydelay due to construction/incidents
Level-of-Service lane-km (mi) at/of LOS “X”VHT/VMT at/of LOS “X”predominant intersection LOSnumber of congested intersections
Vehicle Occupancy/Ridership average vehicle ridershipvehicle occupancy

25
NCHRP Project 7-13, Quantifying Congestion, found that travel time-based measureswere most appropriate for measuring congestion, and that travel time-based congestion measureswere applicable for a wide range of single-mode and multimodal analyses (7,8). The report listedthe following measures as applicable for multimodal corridor analyses:
• average travel rate;• delay rate;• total delay;• relative delay rate;• delay ratio;• person-speed; and,• corridor mobility index.
Meyer (9) presents a similar case for travel time-based measures in a performance-basedplanning process. In his study, Meyer concludes that mobility and accessibility should beimportant measures of system performance, and that travel time and related measures andavailability of alternative modes should be the foundation of mobility measures. Ewing (10) alsosuggests transportation performance measures such as VMT/VHT, emissions per hour,accessibility (based upon travel time), average vehicle occupancy, average speed for areawideanalyses, and average walk-bike share of modal travel.
Turner, Best, and Schrank (11) designate five categories of performance measures for usein major investment studies:
• Transportation system performance;• Financial/economic performance;• Social impacts;• Land use/economic development impacts; and,• Environmental impacts.
The report developed a list of candidate performance measures (Table 2-8), which werequantitatively evaluated for use in major investment studies. Turner et al. selected a preferred setof measures based upon the quantitative evaluation (Table 2-9).

26
Table 2-8. Candidate Measures of Effectiveness (Adapted from Reference 11)
Transportation Financial/Economic Social Impacts Land Use/Economic Environmental ImpactsPerformance Performance Development Impacts
• average travel time • benefit-to-cost ratio (cost- • number of displaced • number and value of • noise levels (dB)• total delay effectiveness) persons displaced businesses • mobile source• average travel rate • financial feasibility • number and value of • accessibility to emissions/air quality• person-km (mi) of travel • cost per new person-trip displaced homes employment • energy consumption
in congestion ranges • total or “full” costs • accessibility to • accessibility to retail • visual quality/aesthetics• person movement • user benefits community services (e.g., shopping • water resources• person-hours of travel in • equity hospital, school, fire, • accessibility to • wetlands/flood plain
congestion ranges • staged improvement police) new/planned development • wildlife/vegetative habitat• person movement speed feasibility • neighborhood cohesion sites • parklands/open/green• accident reduction (increased traffic on local • tourism benefits space• average speed streets) • agriculture/forest• corridor mobility index • neighborhood quality resources• average vehicle • construction traffic and • cultural (historic,
occupancy disruption archaeological) resources• mode split • public lands/facilities • geological resources• intermodal or system • recreation benefits • hazardous wastes
connectivity/continuity • vibration• average delay rate• enforceability• vehicle-km (mi) of travel
in congestion ranges• hours of congestion• relative delay rate• delay ratio• average daily traffic• trip time reliability• level of service• lane-km(mi)-hours of
congestion• volume-to-capacity ratio• queue length

27
Table 2-9. Preferred Measures for Evaluating the Performance and Impact of Transportation Improvements (Adapted from Reference 11)
Transportation Performance• average travel time• total delay (vehicle, person or ton-hours)• average travel rate• person-km (mi) of travel (PMT), or PMT in congested ranges• person movement• person-hours of travel (PHT), or PHT in congested ranges• person movement speed• accident reduction
Financial/Economic Performance• benefit-to-cost ratio (using total or full cost analysis)• financial feasibility• cost per new person-trip
Social Impacts• number of displaced persons• number and value of displaced homes• accessibility to community services• neighborhood cohesion
Land Use/Economic Development Impacts• number and value of displaced businesses• accessibility to employment• accessibility to retail shopping• accessibility to new/planned development sites
Environmental Impacts• noise levels (dB)• mobile source emissions (NO , HC, CO, and PM-10)x
• energy consumption• visual quality/aesthetics • water resources (Option II MIS only)• wildlife/vegetative habitat (Option II MIS only)• parkland/open/green space (Option II MIS only)• agriculture/forest resources (Option II MIS only)• cultural resources (Option II MIS only)• geologic resources (Option II MIS only)• hazardous wastes (Option II MIS only)• vibration (Option II MIS only)
28
2.5 Summary of Performance Measure Research
The previous sections included substantial information on the definition and selection oftransportation performance measures. The researchers identified several key points from theliterature review:
• Performance measures should be based upon goals and objectives fortransportation plans or improvements.
• Many performance measures in the literature were based upon two basicquantities irrespective of transportation mode: travel time and person movement.
• To adequately capture all desirable goals of a transportation system, performancemeasures should characterize more than just traditional notions of mobility orefficiency. Safety, accessibility, and equity are non-traditional measures thatshould be considered in selection of performance measures.

29
3 APPLICATIONS AND PERFORMANCE MEASURESUSING ITS DATA
This chapter contains a discussion of the needs and potential uses for ITS data intransportation analyses and decision-making processes. Specific applications are summarized inregard to the level of detail and data format. The chapter emphasizes the importance ofidentifying the needs and potential uses of the data, and then adapting the data managementprocesses. The chapter also presents numerous performance measures that can be calculatedfrom ITS data. The chapter also provides examples to illustrate the calculation of theseperformance measures from ITS data obtained from the TransGuide TMC in San Antonio, Texas.
3.1 Identifying Needs and Potential Uses for ITS Data
Data collected by ITS components are based upon the needs and specific functions of thegiven system component. For example, inductance loops and other point detection devices aredesigned to provide information about traffic conditions on a frequent basis. As such, inductanceloops and other point detection devices typically report lane-by-lane volumes, occupancies, andspeeds every 20 to 30 seconds. Transportation professionals use this detailed information abouttraffic conditions in real-time for a variety of applications that include, but are not limited to:
• Verification of and response to incidents;• Operation of ramp metering strategies;• Operation of changeable message and lane assignment signs;• Operation of traffic-adaptive signal control strategies; and,• Provision of traffic condition information to travelers.
Each specific application of ITS data has certain requirements in terms of level of detailand format. For the previous example, the real-time operational applications require detailedinformation (e.g., typically lane-by-lane detectors every 0.8 km or 0.5 mile) that is updated on afrequent basis (e.g., every 20 to 30 seconds). Secondary uses or applications of ITS data relatedto transportation planning, programming, or evaluation typically require less detailed information(e.g., corridor or system) for extended periods of time (e.g., monthly or annual averages). Thusit is important to consider the needs and potential uses of ITS data prior to developing anITS data management system, as they control the level of detail for data storage.
Table 3-1 provides a perspective on the various potential applications of ITS data and thedesirable level of detail for each application. The table illustrates the following important points:
• Different uses of ITS data require different levels of detail;• Design and operational applications commonly require detailed data for shorter
sections and roadway and small intervals of time;• Planning applications commonly require historical data over extended sections of
roadway and periods of time; and,• Evaluations require a range of detail levels for both time and space.

30
Table 3-1. Example Matrix: Level of Aggregation for ITS Data Applications
ITS Data Applications
Level of Aggregation
Time Space
No Less than 5 5 to 15 Hourly or Point Sub-area orAggregation minutes minutes Multi-Hour Daily (by Lane or Segment Corridor Region(Ind. Veh.) Screenline)
Design and Operations
Design future ITS components D,W,M D,W,M
Develop historical travel time database D,W D,W
Input/calibration for traffic models D,W D,W D,W(traffic, emissions, fuel consumption)
Real-time freeway and arterial street D,W D,W D,Wtraffic control
Route guidance and navigation D,W D,W D,W
Traveler information D D
Incident detection D D
Congestion pricing D,W D,W
Planning
Develop transportation policies and M,Y M,Yprograms
Perform needs studies/assessments M,Y M,Y
Rank and prioritize transportation M,Y M,Yimprovement projects for funding
Evaluate project-specific transportation M,Y M,Yimprovement strategies
Input/calibration for mobile source D M,Y M,Yemission models

Table 3-1. Example Matrix: Level of Aggregation for ITS Data Applications (Continued)
ITS Data Applications
Level of Aggregation
Time Space
No Less than 5 5 to 15 Hourly or Point Sub-area orAggregation minutes minutes Multi-Hour Daily (by Lane or Segment Corridor Region(Ind. Veh.) Screenline)
31
Input/calibration for travel demand M,Y M,Yforecasting models
Calculate road user costs for economic M,Y M,Yanalyses
Evaluation
Congestion management M,Y M,Ysystem/performance measurement
Establish and monitor congestion trends M,Y M,Y M,Y(extent, intensity, duration, reliability)
Identify congested locations and D,M,Y D,M,Ybottlenecks
Measure effectiveness and benefits of M,Y M,Yimprovements (before-and-after studies)
Communicate information about M,Y M,Ytransportation problems and solutions
Input/calibration for traffic models D,W D,W D,W D,W(traffic, emissions, fuel consumption)
Notes: Shaded cells of the table represent applicable aggregation levels.D = Daily; W = Weekly; M = Monthly; Y = Yearly (Annual).

32
3.2 Estimating Performance Measures from ITS Data
Chapter 2 contained many measures that quantified different performance aspects orimpacts of transportation. The primary performance aspects of transportation that can be derivedfrom ITS data are related to efficiency and quality of service. Thus, ITS data can be used tocalculate various transportation performance measures related to efficiency and quality ofservice. The use of ITS data for these two performance aspects does not imply that these are theonly performance measures that should be considered in transportation policies, plans, andprograms. In fact, many other performance measures are critical to fully understanding theimpacts of transportation on users and society as a whole. It is with regard to these twoperformance aspects (efficiency and quality of service) that ITS data can contribute to acomprehensive performance-based planning process.
Performance measures related to the efficiency and quality of service that can becalculated or estimated using readily available ITS data include:
Point Measures - associated with a particular point on the transportation system.• spot speed (kilometers per hour); and,• person volume or throughput (persons per hour).
Link-Based Measures - associated with a small sub-portion of a person trip ortransportation facility.
• travel time (seconds or minutes);• average speed (kilometers per hour);• person volume or throughput (persons per hour);• person-movement speed (person-kilometers per hour); and,• person delay (person-hours).
Corridor or System Measures - associated with a large sub-portion of a person trip ortransportation facility.
• average person speed (person-kilometers per hour);• total person delay (person-hours);• person-km (mi) of travel in congestion (total and percent);• person-hours of travel in congestion (total and percent);• corridor mobility index; and,• roadway congestion index.
The research team identified these measures from Chapter 2 (which summarizedperformance measures research), which are primarily based upon two quantities: travel time andperson movement. The following sections provide examples of how these measures can becalculated using ITS data from the TransGuide TMC in San Antonio, Texas.

33
3.3 Example Calculation of Performance Measures from ITS Data
The TransGuide system currently collects traffic data by inductance loop detectors. PhaseOne of TransGuide includes 42 km (26 mi) of freeway that encircles downtown San Antonio(Figure 3-1). Loop detectors for Phase One are located in every lane and spaced approximatelyevery 0.8 km (0.5 mi). The TransGuide system also includes loop detector stations on allentrance and exit ramps for the 42 km of freeway in Phase One. Each loop detector station onthe main freeway lanes is located in a trap, or double-loop configuration, where two loops arespaced about 10 m (30 ft) apart. The first loop detector collects vehicle counts and laneoccupancy (e.g., percent of time that the loop is occupied by vehicles). The arrival timedifference between consecutive loops is used with assumptions about vehicle length to calculatea spot speed at the loop detector station. Local controller units (LCUs) in the field store andaggregate the collected information, and two computer servers at the TransGuide center poll, orretrieve, the aggregated data from the LCUs in a sequential pattern. The system gathers thefollowing from each lane loop detector station every 20 seconds:
• average spot speed (mph);• vehicle volume (number of vehicles); and,• lane occupancy (percent of time loop is occupied).
An example of the data obtained from each loop detector station is shown in Figure 3-2. Recent data are posted to a computer (file transfer protocol, or FTP) server at“ftp://www.transguide.dot.state.tx.us/lanedata/”, and is available to anyone with Internet access. The TransGuide loop detector data is currently being archived for a number of purposes,although most are related to research at this time. The TransGuide loop detector data filescontain a date and time stamp, a location code, and the corresponding speed, volume, andoccupancy measurements. The location code (e.g., L1-0U35N-155.252) consists of three partsseparated by a dash:
1. Lane location and designation (e.g., L1):L = main freeway lanes, EN = entrance lanes, and EX = exit lanesSequential numbering starts from the median and goes to outside lanes
2. Freeway and direction designation (e.g., 0U35N):0010 = I-10 and N = North0L10 = I-10, lower deck E = East0U10 = I-10, upper deck S = South0035 = I-35 W = West0L35 = I-35, lower deck0U35 = I-35, upper deck0037 = I-370090 = US 900281 = US 281
3. Milepost: freeway milepost of loop detector station (e.g., 155.252)

34
DATE TIME LOCATION SPEED VOLUME OCCUPANCYa b
07/15/97 07:00:03 L1-0L10E-568.241 Speed=75 Vol=009 Occ=00707/15/97 07:00:03 L1-0U10E-568.248 Speed=64 Vol=007 Occ=00507/15/97 07:00:03 L2-0L10E-568.241 Speed=63 Vol=006 Occ=00607/15/97 07:00:03 L2-0U10E-568.248 Speed=72 Vol=006 Occ=00407/15/97 07:00:03 L3-0U10E-568.248 Speed=57 Vol=006 Occ=00607/15/97 07:00:04 EN1-0U10E-568.845 Speed=-1 Vol=006 Occ=01807/15/97 07:00:04 EX1-0U10E-568.764 Speed=-1 Vol=002 Occ=00307/15/97 07:00:04 L1-0L10E-568.802 Speed=67 Vol=005 Occ=00407/15/97 07:00:04 L1-0U10E-568.807 Speed=62 Vol=006 Occ=00507/15/97 07:00:04 L2-0L10E-568.802 Speed=67 Vol=001 Occ=00107/15/97 07:00:04 L2-0U10E-568.807 Speed=60 Vol=008 Occ=00707/15/97 07:00:04 L3-0U10E-568.807 Speed=46 Vol=008 Occ=00807/15/97 07:00:04 EN1-0010E-569.671 Speed=-1 Vol=003 Occ=006
Figure 3-1. Phase One of TransGuide, San Antonio, Texas
Notes: Speed=-1 means that no speed has been measured (single loop detector).a
Occupancy is the percentage of time the loop detector is occupied.b
Figure 3-2. Example of Loop Detector Data from TransGuide

35
The first measures to be calculated in this example are the point measures of average spotspeed and person volume. For this first example, Table 3-2 summarizes these measures for afive-minute time period. Person volume for all these examples can be estimated by assuming anaverage corridor or sub-regional average. Although the assumed average vehicle occupancy maybe the same for freeways in an urban area if no public transit, HOV, or rail facilities exist, the useof person-related performance measures recognizes and emphasizes the importance ofmultimodal facilities and solutions. In all examples, researchers assumed the average vehicleoccupancy to be 1.20 persons per vehicle.
The far right columns in Table 3-2 contain average spot speeds and estimated personvolumes on a 20-second basis, whereas the bottom row contains lane-by-lane averages for a 5-minute time period. It should be noted that in the calculation of average speeds, researchersweighted the spot speed observations by the number of persons (which provides a statisticallytrue average speed).
Table 3-3 provides an example of a 15-minute summary that is related to a specificsection of freeway. In this example, it has been assumed that the spot speeds obtained at loopdetector stations are approximately equivalent to the average travel speeds halfway to the nextdetector station. In free-flow traffic conditions, this assumption may provide reasonably accurateestimates for link-based measures, but for congested traffic operations and stop-and-go traffic,the assumption may produce inaccurate results.
In Table 3-3, five-minute average speeds and total person volumes are shown, and havebeen calculated as illustrated in the previous example (Table 3-2). Person movement speed iscalculated as the product of person volume and average speed (Equation 3-2). Researchersestimated travel time for the link based upon the average spot speed and the distance to the twoadjacent loop detector stations. Finally, researchers calculate person delay by selecting athreshold at which delay or congestion occurs; in this example, researchers selected a congestionthreshold at 88.5 kph (55 mph).
Table 3-4 illustrates how data from individual links can be aggregated to obtain corridorperformance measures. Average speed and person volume per lane serve as the basic inputs formost corridor performance measures. The corridor mobility index is simply the person speednormalized by a value that represents a typical freeway lane operating at capacity (12). In thisexample, the normalizing value is 161,000, which represents a typical freeway lane operating atcapacity. Index values greater than 1.0 indicate conditions where the speed of person movementis more efficient than regular freeway mainlanes (e.g., HOV lanes or rail lines). Estimated traveltimes and person delay are calculated as shown in the previous example (Table 3-3). Finally, theperson-kilometers and person-hours of travel in congestion are calculated by using the samecongestion threshold that was used in calculating person delay. These two corridor/systemperformance measures relate to the extent of congestion, in that they provide an estimate of howmuch person travel and time is affected by congestion.

average spot speed, S i 'j spot speed × persons
j persons(weighted by persons)
x x x x
36
(3-1)
Table 3-2. Example of Five-Minute Point Summaries of Twenty-Second Loop Detector Data
Time Lane 1 Lane 2 Lane 3 Avg. Est.Starting Spot Person(a.m.) Speed Volume
(kph)Spot Vehicle Est. Spot Vehicle Est. Spot Vehicle Est.
Speed Volume Person Speed Volume Person Speed Volume Person(kph) Volume Volume Volume
7:40:00 42 12 14 40 10 12 56 11 13 46 397:40:19 29 9 11 24 10 12 40 8 10 31 337:40:39 31 10 12 29 10 12 47 6 7 34 317:41:00 32 12 14 40 10 12 42 8 10 37 367:41:20 37 11 13 35 9 11 39 12 14 37 387:41:40 50 11 13 32 12 14 34 8 10 39 377:41:59 39 10 12 29 9 11 47 8 10 38 337:42:20 39 14 17 35 8 10 53 8 10 42 377:42:40 34 10 12 32 12 14 47 7 8 36 347:43:00 39 7 8 18 7 8 34 7 8 30 247:43:20 40 13 16 27 8 10 32 7 8 34 347:43:39 43 10 12 37 9 11 39 7 8 40 317:44:00 42 14 17 35 10 12 42 8 10 40 397:44:20 45 13 16 32 10 12 53 8 10 43 387:44:40 39 11 13 35 10 12 42 8 10 38 35
Average =39 3=167 3=200 =32 3=144 3=173 =43 3=121 3=146 =38 3= 5197:40-7:45
Source: San Antonio TransGuide (Station 0035N-152.590), July 15, 1997.

person movement speed 'person volume
(persons per hour per lane) × average speed (kph)
estimated travel time (sec.) '
3,600 × equivalentlink length (km)
average speed (kph)
person delay(person&hr) '
1 hour3,600 sec
× estimatedtravel time (sec) &
travel time atcongestion threshold(sec) × person
volume
x x x
37
(3-2)
(3-3)
(3-4)
Table 3-3. Example of Fifteen-Minute Link Summaries of Loop Detector Data
Starting Time Average Est. Person Person Movement Est. Travel Person Delay(a.m.) Speed (kph) Volume Speed (person- Time (sec) (person-hr)a
kphpl)
b
c
7:45 to 7:50 37 506 n.a. 82 6.75
7:50 to 7:55 66 472 n.a. 46 1.57
7:55 to 8:00 91 383 n.a. 33 0.00
Average = 62 kph 3 = 1,361persons = 112,530 = 49 sec 3 = 8.327:45 to 8:00 am or 1,815 pers/phpl person-kphpl person-hr
Source: San Antonio TransGuide (Station 0035N-152.590), July 15, 1997.
Notes: Average spot speed calculated for each 5-minute period using Equation 3-1.a
Assumes that spot speed approximates time-mean speed over section link length of 0.84 km.b
Assumes that delay is incurred at speeds less than 88.5 kph (travel time greater than 34 sec).c

x x x x
38
Table 3-4. Example of Peak Hour Corridor Summaries from Loop Detector Data
Freeway and Equiv. Link Lane-km Average Est. Person Person Speed Corridor Est. Travel Person Delay PKT in PHT inMilepost Length (km) Speed Volume (per-kphpl) Mobility Index Time (sec) (person-hr) Congestion Congestion
(kph) per Lane
0035N-152.005 0.472 1.415 68 2,040 137,945 0.86 25 10.07 2,887 42.69
0035N-152.590 0.840 2.521 63 1,960 122,859 0.76 48 22.82 4,933 78.57
0035N-153.048 0.824 2.473 74 1,930 142,689 0.89 40 10.50 4,765 64.33
0035N-153.614 0.918 2.753 92 1,760 161,821 1.01 36 0.00 0 0.00
0035N-154.187 0.914 3.658 89 1,350 119,100 0.74 37 0.00 0 0.00
0U35N-154.738 0.858 1.716 72 1,860 134,757 0.84 43 7.99 3,192 44.06
0L35N-154.750 0.858 1.716 71 1,560 110,510 0.69 44 7.54 2,677 37.79
0U35N-155.252 0.906 2.719 79 1,190 93,879 0.58 41 4.45 3,236 41.02
0L35N-155.252 0.897 1.794 77 1,500 115,920 0.72 42 4.41 2,690 34.81
0035N-155.863 0.847 4.234 90 1,190 107,831 0.67 34 0.00 0 0.00
0U35N-156.304 0.662 1.323 81 1,620 130,410 0.81 30 2.41 2,144 26.63
0L35N-156.304 0.596 1.191 85 1,500 127,568 0.79 25 0.75 1,781 20.87
0L35N-156.603 0.726 1.452 89 1,460 129,726 0.81 30 0.00 0 0.00
0U35N-156.684 0.668 2.004 92 910 84,123 0.52 26 0.00 0 0.00
0U35N-157.134 0.720 2.159 89 900 79,990 0.50 29 0.00 0 0.00
0L35N-157.206 0.786 1.571 81 1,410 113,103 0.70 35 2.48 2,208 27.43
0035N-157.578 0.668 3.341 69 1,190 82,522 0.51 35 12.52 3,982 57.52
0035N-158.036 0.736 2.207 76 1,790 135,449 0.84 35 7.57 3,951 52.21
0035N-158.492 0.734 2.937 84 1,310 109,045 0.68 32 2.47 3,825 45.69
0035N-158.947 0.367 1.468 93 1,240 116,025 0.72 14 0.00 0 0.00
Corridor 3 = 15.00 3 = 44.65 = 79.9 = 1,483 = 117,764 = 0.73 3 = 680 3 = 95.99 3= 42,272 3 = 573.64

lane&km 'equivalent link
length (km) × numberof lanes
person&km of travel(PKT) in congestion '
person volume(persons) × equivalent
link length
when average speeds dropbelow congestion threshold
(e.g., 88.5 kph)
corridormobility index '
person speed (person&kphpl)161,000 (normalizing value)
person&hours of travel(PHT) in congestion
'person volume
(persons)× est. travel
time (sec)× 1 hour
3,600 sec
when average speeds dropbelow congestion threshold
(e.g., 88.5 kph)
39
(3-5)
(3-6)
(3-7)
(3-8)
Table 3-4. Example of Peak Hour Corridor Summaries from Loop Detector Data (Continued)


41
4 DEVELOPMENT OF AN ITS DATA MANAGEMENT SYSTEM
This chapter documents the development of an ITS data management system (referred toas ITS DataLink) that is used to store, access, analyze, and present data from the TransGuidecenter in San Antonio, Texas. Introductory sections present desired features of an ITS datamanagement system which helped guide the researchers in development of a prototype version ofITS DataLink. The chapter provides background information on data warehouses and how theyhave been applied in enterprise computing environments. The chapter concludes withinformation and documentation about the prototype version of ITS DataLink.
4.1 Background
The previous chapter illustrated the calculation of performance measures from theTransGuide loop detector data. The calculation of performance measures was shown to bestraightforward, but there are several issues that arise in retaining, managing, and analyzing ITSdata for any purpose:
• Data storage - because of the enormous volumes of ITS data being collected,innovative storage and/or aggregation strategies are necessary to keep costs to areasonable level and within the reach of a typical agency;
• Database construction - the potentially large ITS databases cannot be built withmost traditional desktop computer-based spreadsheet or database applications;
• Access to data - the ITS databases cannot be accessed without using specializedapplications or query languages to interact with the database engine;
• Data versus information - the sheer size of ITS databases may make it difficultto transform vast amounts of data into smaller, easy-to-understand information;and,
• Privacy - the possibility of having ITS data that records the location or travelingpatterns of an individual vehicle or person raises some privacy concerns.
Some TMCs do not retain ITS data because of one or more of these issues, or because theyhaven’t recognized the usefulness of the data (see state-of-the-practice review in Chapter 2). The following sections discuss these issues.
4.1.1 Data Storage
The enormous volumes of ITS data being collected require innovative storage and/oraggregation strategies. As of August 1997, the loop detector data is being archived as

42
compressed ASCII-text files on a computer workstation. Each day of compressed data requiresapproximately 12 megabytes (MB) of storage space (uncompressed storage requires about 120MB per day). At this rate of storage, a month of compressed data requires 360 MB (3.6gigabytes (GB) uncompressed) and a full year of compressed data requires 4.4 GB (44 GBuncompressed). Also, these storage requirements are only for 42 km (26 mi) of freeway in PhaseOne of TransGuide. Phase Two will more than double the amount of freeway coverage and willnecessarily increase the data storage space by roughly the same multiplier. Although database orother formats may slightly decrease the storage space required, it is unlikely that current desktopdatabase applications managing tens of gigabytes of data can be used as an effective data storageand management solution. In addition, the choice of the computer operating system OS for theapplication is important, as some operating systems are better designed for data intensive tasksthan others.
Many large businesses and corporations use large “enterprise-class” relational databaseson computer workstations to manage data requiring more than about 5 GB. These largedatabases are now commonly referred to as “data warehouses” or “data marts.” The SASInstitute defines a data warehouse as a “separate data store in which the data is stored in a formatsuitable for business intelligence and decision support systems, in which these systems don’tinterfere with the performance requirements of operational systems” (13,14). A data mart is ascaled-down version of a data warehouse and typically contains between 5 and 15 GB of data,whereas a data warehouse typically contains more than 30 GB of data. Several softwaredevelopers (e.g., SAS, Oracle, Sybase, Informix, etc.) are currently marketing data warehouseproducts that help to manage data marts or data warehouses.
4.1.2 Database Construction
Because of the potential for large ITS databases (greater than 30 GB), most traditionaldesktop computer-based spreadsheet or database applications cannot be used to build a datawarehouse. Questions of speed, transaction processing time, machine resources, and many othersmust all be considered when determining the system components for the physical construction ofthe database.
4.1.3 Access to Data
Most relational databases require knowledge of a special programming language (e.g.,SQL, or structured query language). Ideally, the data warehouse should be accessible to anyonewith a desktop computer, without requiring knowledge of programming languages. Again,several software developers have created access interfaces to data warehouses that do not requirea specialized programming language. A simple, easy-to-use access interface to a data mart orwarehouse enables a wide variety of users to access and analyze the ITS data.

43
4.1.4 Data Versus Information
The sheer size of ITS databases may make it difficult to convert gigabytes of data tosmaller, easy-to-understand information. In many planning applications with ITS data, users maybe trying to find patterns or trends over several months or years for the entire freeway systemwithin an urban area. The challenges with large data marts or warehouses are finding andanalyzing the appropriate data, then being able to summarize megabytes or gigabytes of data intoone useful page of information for managers or decision-makers. This process of finding andsummarizing useful information from large databases is referred to as “data mining” (i.e., auseful piece of information is analogous to a small nugget of precious metal).
In a popular computer periodical, Gray elaborates on the future of data management (15):
“Perhaps the most challenging problem is understanding the data. There is littlequestion that most data will be on-line--because it is both inexpensive and convenient tostore it in computers. Organizing these huge data archives so that people can easily findthe information they need is the real challenge. Finding patterns, trends, anomalies, andrelevant information from a large database is one of the most exciting areas of datamanagement.”
4.1.5 Privacy
Many privacy advocates are concerned that the advent of the information age means aloss of personal freedom. These advocates are concerned that large databases containingpersonal information are kept by government agencies, and that the potential exists forindividuals or agencies to merge information from different databases and construct a detailedaccount of their personal information and daily activities or habits, including travel activities. Most advocates are not paranoid enough to think that agencies or individuals are currentlymisusing existing databases, only that the potential exists for the databases to be misused.
Privacy issues are an important consideration when TMCs collect information aboutindividual vehicles or persons. These tend to be either individual vehicles (e.g. probe vehicleswith AVI transponders or GPS receivers) or persons (e.g. smart cards). Typically in the past,information on an individual level was gathered in relation to toll road operations or perhaps onspecific studies where drivers have agreed to be probe vehicles or test subjects for datacollection. In the future, people may not be aware that vehicle tracking information is beingutilized. In all of these cases, information about individual vehicles or persons should either bestored in an anonymous manner (i.e., no way to connect an identification number with a personor vehicle) or not stored at all.
In the current case of TransGuide loop detector data, privacy is not an issue because thesystem collects no information about individual vehicles or persons. However, the ModelDeployment Initiative (MDI) in San Antonio includes the deployment of AVI transponders to

44
gather link travel times from participating commuters. The travel times collected by these probevehicles are a potentially rich source of information to transportation planners; however, storageof the data should make the individual probe vehicle transactions anonymous or aggregate thedata. Efforts to incorporate this vehicle-based information into the current ITS data managementsystem for San Antonio should protect the privacy of commuters with AVI transponders.
4.2 Data Management System Features
With the above issues in mind, the research team began the design of a prototype ITS datamanagement system (ITS DataLink) that would utilize TransGuide loop detector data. Therewere several desirable features or attributes for ITS DataLink:
• Ability to store and manage large amounts of data;
• Ability to access the database from remote locations without burdensome or costly software requirements;
• A user-friendly, point-and-click query interface that does not require knowledgeof special programming languages or relational database applications;
• Ability to aggregate and summarize data in point, section, and corridor/facilityformats;
• Ability to calculate and summarize a given set of performance measures and;
• Ability to output results in a number of different tabular and graphical formats.
The following sections elaborate on these desirable features of the ITS DataLink system.
4.2.1 Data Storage
The researchers agreed that the initial design of the ITS DataLink system should becapable of storing one full year of TransGuide loop detector data. Based on the intended uses ofthe ITS DataLink system, a decision was made to store the data into five-minute intervals(aggregated from twenty-second periods from the raw data). These design decisions, in additionto the need for additional database application and temporary file storage space, prompted theresearch team to select a design specification of 20 GB for the ITS DataLink system. At thistime, the cost of computer storage has become relatively inexpensive ($100-200 per GB in 1997dollars, depending on the computer platform). Table 4-1 contains estimates of approximate datastorage space and costs for future expansions of the TransGuide system.

45
4.2.2 Database Access
It was desirable to have access to the ITS DataLink system from any location withoutrequiring proprietary database software. Many databases require special software to access thesystem and have licensing requirements for each user. The research team decided to provideaccess to ITS DataLink using Internet protocols (TCP/IP), so that anyone with Internet accesscould use the system. Password login procedures are desirable for the ITS Data Link system souser privilege levels can be established.
Table 4-1. Approximate Storage Space and Costs for One Complete Year of TransGuide Loop Detector Data
System Extent Approx. Storage Space (GB) Approx. Storage Cost (1997 $)a b
Compressed Uncompressed Compressed Uncompressed
Phase One, 4.4 44 $660 $6,60042 km (26 mi)
Phase Two, 9.0 90 $1,350 $13,50085 km (53 mi)
Complete System, 32.3 323 $4,845 $48,450308 km (191 mi)
Notes: Assumes that 20-second data is saved in ASCII-text format for an entire year.a
Assumes that computer storage costs are $150 per GB (1997 dollars).b
4.2.3 User Interface
The ITS DataLink user interface is very important for enabling novice database users toperform a wide range of data queries, from very simple to complex. The research team decidedthat database users should not be required to know programming or query languages, and that theinterface should be a fairly simple, easy-to-use, point-and-click interface. The research teamselected a web browser as the interface to ITS DataLink because of its popularity and simplicityof use. Web browsers are increasingly being used to perform complex tasks over the Internet,and even novice computer users generally have experience with using a web browser. Also,Microsoft offers web browser software free of charge on their web site(http://www.microsoft.com), and Netscape offers web browser software free of charge toeducational and non-profit users (http://home.netscape.com).

46
The Internet is increasingly being recognized as a legitimate tool and location forconducting business. The fastest growing segment of Internet applications is to “web-enable”relational databases which merely means allowing query and/or update capabilities via a webbrowser interface to the database.
There are thousands of examples of web-enabled databases on the Internet. Some of themore well known transportation examples are the Houston and San Antonio real-time trafficmaps. These systems are accessing a database of speed data and displaying it via a graphicalsummary. Many more examples could be listed but the volume of information makes doing sooutside the scope of this report.
4.2.4 Data Aggregation and Summarization
As described earlier in discussions related to data storage, the loop detector data is storedin the ITS DataLink system in five-minute time periods. The research team agreed that it wasdesirable to be able to aggregate the data into a number of different time periods forsummarization purposes. Researchers selected several aggregation time periods for the queryinterface, including:
• 5 minutes;• 10 minutes;• 15 minutes;• 20 minutes;• 30 minutes; and,• 60 minutes;
In addition to aggregating the data over various time periods, truly useful analyses dependon aggregating the data across freeway facilities as well. As output from the loop detectors in thesystem, the data represents the smallest spatial resolution--that of a single point on a single laneon the system. To meet the data requirements of multiple applications or uses of the data, thedatabase should have the ability to aggregate to other spatial resolutions, including:
• cross lane;• corridor, and;• facility.
The provision of this ability provides the database with the power to serve a number ofdifferent purposes, from real-time point analysis to corridor operations and even to long-termplanning and congestion monitoring applications.

47
4.2.5 Calculate Performance Measures
The research team designed the ITS DataLink system to calculate and summarize theperformance measures shown in Table 4-2. The table indicates that performance measure can becalculated for three different spatial levels: point, link, and corridor or system. Because the loopdetector stations only provide point data, assumptions about homogenous traffic conditions werenecessary to convert the point data to link, corridor, and system measures. These assumptionsare usually reasonable in free-flow traffic conditions but may be questionable for congested orstop-and-go traffic.
Table 4-2. Performance Measures in ITS DataLink
Analysis Level Performance Measures
Point Measures spot speed (kilometers per hour)person volume or throughput (persons per hour)
Link-Based Measures travel time (seconds or minutes)average speed (kilometers per hour)person volume or throughput (persons per hour)person-movement speed (person-kilometers per hour)person delay (person-hours)
Corridor or System Measures average person speed (person-kilometers per hour)(not yet implemented) total person delay (person-hours)
person-km (mi) of travel in congestion (total and percent)person-hours of travel in congestion (total and percent)corridor mobility indexroadway congestion index
4.2.6 Tabular and Graphical Output Formats
Any analysis system should be capable of providing performance measure summaries in anumber of different formats that are easily interpreted and understood. Tabular formats are fairlycommon in data summaries and should be made available through this system. Graphicaloutputs, though, can better illustrate relationships and trends for large volumes of data. It wasalso desirable to output data in an intermediate format that could be imported into traditionaldesktop computer-based spreadsheet or database applications. The researchers selected thefollowing output formats as being desirable to include in the ITS DataLink system:
• Tabular or columnar data (viewed in web browser);

48
• Comma-delimited ASCII text (can be imported into spreadsheet or otherdatabase); and,
• Graphical charts in postscript format or portable document format (PDF).
4.3 Documentation of the Prototype Data Management System
The ITS DataLink system is currently online at “http://dasher.cs.tamu.edu” and has beenin “alpha” testing since early 1997 (the site was moved to “http://vixen.cs.tamu.edu in early1998). The ITS DataLink system interface on the web page has undergone several majorrefinements relating to page organization and query interfaces since going online, and theresearch team will continue to refine the system interface over the next year (seerecommendations in Chapter 6). The web site interface is password-protected at this time, butinterested users should contact Mr. Robert Brydia to access the system. Interested users can alsosubmit a request electronically by going to the site and choosing the button labeled “ObtainSystem Access.”
4.3.1 System Architecture
The ITS DataLink system consists of five major components:
1. Oracle database management system (DBMS);2. Common Gateway Interface (CGI);3. Gnuplot graphics software;4 E-mail service; and,5. Apache web server.
The Oracle DBMS or relational database is the key component of the system. Thedatabase serves as the application which stores the loop detector data. The database alsoprovides some basic statistical and aggregation functions. These functions are supplemented byexternal programs or scripts that are accessed via CGI, which is an Internet method of calling oneprogram from within another. This is an important capability of the system as it greatly increasesthe aggregation, statistical, and data manipulation capabilities beyond what is available in thebase Oracle software. The programs called from the CGI gateway are truly the heart of thesystem as they provide the links to all of the various elements. The Gnuplot graphics software,which runs on various Unix computer platforms, is a public domain software which enables thesystem to produce 1-D, 2-D, and 3-D graphics. The integration of electronic mail service into thesite allows users to mail query results to any valid Internet e-mail address and also allows usersof the site to provide feedback to the researchers. The entire package is operated through theApache web server, a public domain Unix-based web server software package.
The research team organized the ITS DataLink system across two Unix workstations fromSun Microsystems. One machine is dedicated to the database, while the other handles the webserver functions. In addition to the disk storage requirements of the five-minute data, the Oracle

49
Figure 4-1. Data Flow for ITS DataLink System
DBMS occupies about 2 GB of disk space, The external scripts written for the system takeapproximately 0.5 GB of storage space. Temporary processing space for the queries requires anadditional 4 GB of disk storage space. Figure 4-1 shows the physical arrangement of the system. The left side of the drawing, representing the database and web site, shows the various softwarepackages in use. CGI scripts control the interaction between the various packages. The right sideof the drawing represents the user side of the system. The only requirements are a web browserwith Internet access and the Adobe Acrobat Reader software, both of which are free.

50
4.3.2 ITS DataLink System Cost
The ITS DataLink system is highly scalable. The hardware resources utilized by theresearch team were Sun Sparc workstations configured with 64 megabytes of RAM and a 2 GBhard disk. Typical cost for this configuration is approximately $6,000 (1997 dollars). While theprototype system employs two workstations, it is possible to use a single workstation toaccommodate all of the system software and loop detector data. Increasing the number ofworkstations helps to distribute the load across various functions and increases the overall systemresponse speed. In addition to two workstations, researchers utilized two external 9 GB diskdrives to store the loop detector data. External drives have the advantage of being readilytransportable from one workstation to another, depending on system requirements. A tapebackup unit capable of backing up the entire system software and data completes the physicalhardware setup. Total cost for these items of equipment is approximately $22,000 (1997dollars).
Any commercial database server, such as Oracle, Sybase, Informix, and dB2, whichsupports standard SQL (Structured Query Language) can support the database needs. Thechoice of Oracle for this application was a choice of prior experience to the researchers as well asattractive pricing versus other available products. With any of the database applications, there isno need for additional programming tools. The researchers do not recommend traditionaldesktop databases, such as Microsoft Access or Corel Paradox, for this application due to theirlimitations in handling very large amounts of data.
51
5 FINDINGS AND CONCLUSIONS
This chapter presents the findings and conclusions from this first year of research activityin developing the ITS DataLink system. The research team developed these findings andconclusions based upon their experience in developing and testing the web browser-based datamanagement system.
The findings and conclusions are as follows:
• Need for a Better Understanding of Data Needs and Uses - The process ofretaining, managing, sharing, and analyzing ITS data for planning and evaluationpurposes is not well established among many of the TMCs in the U.S. Thisresearch found a disconnect between ITS designers and transportation planners. Improved communication and coordination among these two groups should helpto address ITS data retention and sharing issues.
• Plan for Full Breadth of Performance Measures - The performance measurestypically calculated through ITS data only relate to the efficiency and quality oftransportation performance. There are several other important components oftransportation performance that should be included in evaluating transportationplans or improvements, such as safety, accessibility, and social equity. Althoughexisting ITS components do not readily collect data for these performancemeasures, development of future systems should recognize the data needsnecessary to develop the full breadth of transportation performance measures.
• Query Interface Easy to Use - The research team found that the ITS DataLinkweb browser interface made data queries substantially easier to perform for novicecomputer or database users. The web browser interface is essentially point-and-click, which most novice users found substantially simpler than similar SQL-based data queries. However, additional input on the query interface would bedesirable for future refinements of the system.
• Map Query Interface Needed - The current query interface refers to the freewaylocations by abbreviated name (e.g., 0U35N) and milepost (e.g., 152.590). Mostusers are unfamiliar with the TransGuide Phase One system and needsupplemental maps and diagrams to interpret queries and data summaries. Amap-based interface could improve users’ ability to perform and interpret dataqueries related to specific locations. The research team was unable to implementthis desirable feature because of time constraints during the first year of research.

52
• Corridor and System Analyses Needed - The ITS DataLink system currentlyperforms queries and presents results for point and link-based performancemeasures. Tools for aggregating data into corridor and system performancemeasures should be incorporated into future refinements of the ITS DataLinksystem. These corridor and system measures provide useful information aboutregional or sub-regional freeway system performance for managers and decision-makers. The research team was unable to implement this desirable featurebecause of time constraints during the first year of research.
• Relationship to Data Dictionary Efforts - Recent research efforts related to theNational ITS Architecture have established a data dictionary that defines dataelements used or produced by ITS components. There is a need to investigate therelationship of this data dictionary effort to the ITS DataLink system. It was notpossible to investigate this relationship during the past year because the datadictionary has been established only recently.

53
6 RECOMMENDATIONS
This chapter summarizes the recommendations for this research, which are based uponthe major findings and conclusions presented in Chapter 5. The research team offers theserecommendations here as suggestions for future refinements of the ITS DataLink system duringthe next fiscal year of research activity. The recommendations include the following:
• Operational Test for TxDOT Users in San Antonio - The research teamrecommends that the ITS DataLink system be made accessible to interestedTxDOT users in the San Antonio District as an operational test. With a smallamount of training and the required passwords, these TxDOT users could haveaccess to the data contained in the ITS DataLink system. The TxDOT users couldalso provide comments and feedback to refine the web site and query interfaces.
• Provide Map-Based Query Interface - The current prototype of the ITSDataLink system identifies loop detector locations by an abbreviated freewayname and milepost. Most users, however, may not be familiar with the freeway ormilepost designations. The research team recommends that a map-based queryinterface be provided to simplify ITS DataLink queries. A map-based queryinterface would allow users to select links or corridors on a plan view of theTransGuide freeway network.
• Develop Link Aggregation/Dynamic Segmentation Tools - The currentprototype of the ITS DataLink system provides data summaries on a point andlink basis. However, the research team has selected numerous performancemeasures that are corridor or system-based. Link aggregation or dynamicsegmentation tools would enable users to summarize data from selected or allfreeways into a single performance measure. These corridor and system measuresprovide useful information about regional or sub-regional freeway systemperformance for managers and decision-makers.
• Investigate Relationship to Data Dictionary Efforts - The research team shouldensure that the ITS DataLink system is consistent with national efforts related tothe ITS Architecture and data dictionaries.


55
1. Abrams, C.M. and J.F. DiRenzo. Measures of Effectiveness for Multimodal Urban TrafficManagement, Volume 2: Development and Evaluation of TSM Strategies. Report No.FHWA-RD-79-113. FHWA, U.S. Department of Transportation, Washington, DC, 1979.
2. Stuart, D.G. and W.D. Weber. Accommodating Multiple Alternatives in TransportationPlanning. In Transportation Research Record 639, TRB, National Research Council,Washington, DC, 1977, pp. 7-13.
3. Czerniak, R., S. Gaiser, and D. Gerard. The Use of Intermodal Performance Measures byState Departments of Transportation. Report DOT-T-96-18. U.S. Department ofTransportation, Washington, DC, June 1996.
4. Rutherford, G.S. Synthesis of Highway Practice 201, Multimodal Evaluation of PassengerTransportation. National Cooperative Highway Research Program, National AcademyPress, Washington, DC, 1994.
5. Cambridge Systematics, Inc. National Transportation System Performance Measures.Report DOT-T-97-04. U.S. Department of Transportation, Washington, DC, April 1996.
6. Cambridge Systematics, Inc. “Task B--Initial Performance Measures,” In MetropolitanPlanning Technical Report. Report No. 2. Federal Highway Administration, Washington,DC, July 1994.
7. Lomax, T.J., S.M. Turner, G. Shunk, H.S. Levinson, R.H. Pratt, P.N. Bay, G.B. Douglas.Quantifying Congestion: Final Report. National Cooperative Highway Research Program,Washington, DC, March 1997.
8. Lomax, T.J., S.M. Turner, G. Shunk, H.S. Levinson, R.H. Pratt, P.N. Bay, G.B. Douglas.Quantifying Congestion: User’s Guide. National Cooperative Highway Research Program,Washington, DC, March 1997.
9. Meyer, M.D. Alternative Performance Measures for Transportation Planning: EvolutionToward Multimodal Planning. Report No. FTA-GA-26-7000-95-1. Georgia Institute ofTechnology, Atlanta, GA, December 1995.
10. Ewing, R. Measuring Transportation Performance. Transportation Quarterly, Vol. 49, No.1, Eno Transportation Foundation, Lansdowne, VA, Winter 1995.
11. Turner, S.M., M.E. Best, and D.L. Schrank. Measures of Effectiveness for Major InvestmentStudies. Report No. SWUTC/96/467106-1. Texas Transportation Institute, SouthwestRegion University Transportation Center, College Station, TX, November 1996.
7 REFERENCES
56
12. Lomax, T.J. Transportation Corridor Mobility Estimation Methodology. Research Report1131-1. Texas Transportation Institute, Texas A&M University System, College Station,TX, August 1988.
13. “Rapid Warehousing Methodology: An Iterative Approach to Building Your Organization’sData Warehouse.” White Paper, SAS Institute, Cary, NC, 1996.
14. “The SAS Data Warehouse: Information Systems Management and the Data WarehouseConcept.” White Paper, SAS Institute, Cary, NC, 1996.
15. Gray, Jim. “Evolution of Data Management,” In Computer, October 1996, pp. 38-46.