tt cross-sectionin thelepton+jetschannelin p pp...
TRANSCRIPT

ATL
AS-
CO
NF-
2017
-054
10Ju
ly20
17
ATLAS CONF NoteATLAS-CONF-2017-054
6th July 2017
Measurement of the inclusive t t̄ cross-section inthe lepton+jets channel in pp collisions at√
s = 8 TeV with the ATLAS detector
The ATLAS Collaboration
The inclusive tt̄ production cross-section is measured in the lepton+jets channel using20.2 fb−1 of proton–proton collision data at a centre-of-mass energy of 8 TeV recordedwith the ATLAS detector at the LHC. Major systematic uncertainties due to the model-ling of the jet energy scale and b-tagging efficiency are constrained by separating selec-ted events into three disjoint regions. In order to reduce systematic uncertainties in themost important background, the W+ jets process is modelled using Z+ jets events in a data-based approach. The inclusive tt̄ cross-section is measured with a precision of 5.7% tobe σt t̄ = 248.3 ± 0.7 (stat.) ± 13.4 (syst.) ± 4.7 (lumi.) pb, assuming a top-quark mass of172.5GeV. The result is in agreement with the Standard Model prediction.
© 2017 CERN for the benefit of the ATLAS Collaboration.Reproduction of this article or parts of it is allowed as specified in the CC-BY-4.0 license.

1 Introduction
The top quark is the most massive known elementary particle. Given that its Yukawa coupling to theHiggs boson is close to unity, it may play a special role in electroweak symmetry breaking [1, 2]. Studiesof top-quark production and decay are major research goals at the LHC, providing both a precise probeof the Standard Model (SM) [3] and a window for physics beyond the Standard Model (BSM) [4].The LHC supplies a large number of top-quark events to its precision detectors, offering an excellentenvironment for such studies.
In proton-proton collisions, the dominant production process of top quarks is pair production via thestrong interaction. The measurement of the production cross-section provides a stringent test of QCDcalculations with heavy quarks [5], allows for a determination of the top-quark mass in a well-definedrenormalisation scheme [6, 7], and can be sensitive to to potential new physics such as top-quark partnersdegenerate with the SM top quark [8].
The predicted inclusive tt̄ cross-section for a centre-of-mass energy of√
s = 8 TeV, assuming a top-quarkmass mtop = 172.5GeV, is
σ(pp→ tt̄) = 253+13−15 pb. (1)
It is calculated at next-to-next-to-leading order (NNLO) in QCD including resummation of next-to-next-to-leading logarithmic (NNLL) soft-gluon terms with Top++ (v2.0) [5, 9–13]. The uncertainties due tothe parton distribution functions (PDFs) and αS are calculated using the PDF4LHC prescription [14]where the uncertainties of MSTW2008 68% CL NNLO [15, 16], CT10 NNLO [17, 18] and NNPDF2.3 [19] PDF sets are added in quadrature to the scale uncertainty. Comparable results are obtainedusing a different resummation technique as reported in Ref. [20]. The total uncertainty of about 6%sets the current goal for the experimental precision.
Measurements of the tt̄ cross-section have been published for several centre-of-mass energies between1.96 and 13 TeV in pp̄ and pp collisions. At the Tevatron, a combination by the D0 and CDF collabora-tions of the tt̄ cross-section measurements at a centre-of-mass energy of 1.96 TeV is published with anuncertainty of 5.4% [21]. The most precise measurement for a centre-of-mass energy of 8 TeV, witha total uncertainty of 3.2%, is performed by the ATLAS collaboration in the dilepton channel, whereboth top quarks decay via t → `νb [22]. Further measurements at 7, 8 and 13TeV in the same finalstate are published by the ATLAS and CMS collaborations [23–25].
The measurement reported in this paper is performed in the semileptonic decay mode (lepton+jets),where one W boson decays leptonically and the other W boson decays hadronically, i.e.
tt̄ → `νb + qq̄′b̄. (2)
Here the final state charged lepton ` is either an electron or a muon1.
It is important to measure the tt̄ cross-section in different decay modes, in order to understand ifthe measured cross-sections are consistent with each other due to the different dependencies on theexperimental uncertainties. Furthermore, new physics processes can contribute in different ways to thedifferent decay modes.
1 Events involving W → τν decays with a subsequent decay of the τ lepton to either eνeντ or µνµντ are included in thesignal.
2

The analysis is based on data collected with the ATLAS detector at the LHC corresponding to anintegrated luminosity of 20.2 fb−1 at a pp centre-of-mass energy of
√s = 8 TeV. The most precise
cross-section measured in this channel at√
s = 8 TeV published by the CMS collaboration reachedan uncertainty of 6.8% [26]. This analysis supersedes the previous measurement from the ATLAScollaboration which achieved a total uncertainty of 9.4% using the same dataset [27]. This analysisimproves on the previous result by constraining important sources of the systematic uncertainty and bysplitting the overall sample of tt̄ candidates into three signal regions.
2 ATLAS detector
The ATLAS detector [28] is a multi-purpose particle physics detector with forward-backward symmetryand a cylindrical geometry2. The inner tracking detectors (ID) are surrounded by a thin superconductingsolenoid magnet, electromagnetic and hadronic calorimeters, and a muon spectrometer (MS) inside amagnetic field generated by three superconducting toroidal magnets of eight coils each. The innerdetector, in combination with the 2T magnetic field from the solenoid, provides precision momentummeasurements for charged particles within the pseudorapidity range |η | < 2.5. It consists of, fromthe interaction point to the outside, a silicon pixel detector and a silicon microstrip detector (togetherallowing a precise and efficient identification of secondary vertices), complemented with a straw-tubetracker contributing transition radiationmeasurements to electron identification. The calorimeter systemcovers the pseudorapidity range |η | < 4.9. A high-granularity liquid-argon (LAr) sampling calorimeterwith lead absorbers provides the measurement of electromagnetic showers within |η | < 3.2. In theID acceptance region, |η | < 2.5, the innermost layer has a fine segmentation in η to allow separationof electrons and photons from π0 and to improve the resolution of the shower position and directionmeasurements. Hadronic showers are measured by a steel/plastic scintillator tile calorimeter in thecentral region, |η | < 1.7, and by a LAr calorimeter in the end-cap region, 1.5 < |η | < 3.2. In the forwardregion, measurements of both electromagnetic and hadronic showers are provided by a LAr calorimetercovering the pseudorapidity range 3.1 < |η | < 4.9. The muon spectrometer combines trigger and highprecision tracking detectors, and allows measurements of charged particle trajectories within |η | < 2.7.The combination of all ATLAS detector sub-systems provides charged particle tracking, along withidentification for lepton and photons, in the pseudorapidity range |η | < 2.5.
A three-level trigger system is used to select interesting events [29]. An hardware-based first leveltrigger uses a subset of detector information to bring the event rate below 75 kHz. Two additionalsoftware-based trigger levels together reduce the event rate to about 400Hz on average, depending onthe data-taking conditions.
2 ATLAS uses a right-handed coordinate system with its origin at the nominal interaction point (IP) in the centre of thedetector and the z-axis along the beam pipe. The x-axis points from the IP to the centre of the LHC ring, and the y-axispoints upwards. Cylindrical coordinates (r, φ) are used in the transverse plane, φ being the azimuthal angle around thez-axis. The pseudorapidity is defined in terms of the polar angle θ as η = − ln tan(θ/2), and the distance ∆R in the η − φspace is defined as ∆R ≡
√(∆η)2 + (∆φ)2.
3

3 Data and simulated events
This analysis is performed using pp collision data recorded at a centre-of-mass energy of√
s = 8 TeV,corresponding to the full 2012 dataset. The data-taking periods in which all the subdetectors wereoperational are considered resulting in a data sample with an integrated luminosity of Lint = 20.2 fb−1.
Detector and trigger simulations are performed within the GEANT4 framework [30, 31]. The sameoffline reconstruction methods used on data are applied to the simulated events. Minimum bias eventsgenerated with Pythia8 [32] are used to simulate multiple pp interactions in the same and nearbybunch crossings (pile-up). The distribution of the number of pile-up interactions in the simulationis reweighted to match the corresponding distribution in the data. The simulated pile-up events arereweighted according to the instantaneous luminosity spectrum in the data.
Signal tt̄ events are simulated using the Powheg generator (r3026) [33] with the CT10 PDF sets [17].The renormalisation and factorisation scales are set to the value µ =
√m2top + p2
T(t) where pT(t) is thepT of the top quark, evaluated for the underlying Born configuration, i.e. before radiation. The hdampparameter, which controls the transverse momentum pT of the first additional emission beyond the Bornconfiguration, is set to mtop. The main effect of this is to regulate the high-pT emission against whichthe tt̄ system recoils. Parton showering, hadronisation and the underlying event are simulated withPythia (v6.428) [34] and the Perugia2011C set of tuned parameters [35].
For systematic studies of the tt̄ process, alternative generators and parameter variations in the set oftuned parameters of Pythia are used. The Powheg generator interfaced to Herwig (v6.5.20) [36] isused for hadronisation modelling studies, while MC@NLO (v4.09) [37, 38] interfaced to Herwig isused to study the dependence on the matching method between the next-to-leading order (NLO) matrixelement (ME) generation and the parton shower (PS) evolution. In case of Herwig showered events, theJimmy (v4.31) [39] model with the ATLAS AUET2 [40] set of tuned parameters is used to simulate theunderlying event. Variations of the amount of additional radiation are studied using events generatedwith the Powheg-Box + Pythia 6 generators after changing the hard-scatter scales and the scales inthe parton shower simultaneously. In these samples, a variation of the factorisation and renormalisationscales by a factor of 2.0 is combined with the Perugia2012radLo parameters and a variation of bothscale parameters by a factor of 0.5 is combined with the Perugia2012radHi parameters [35]. In the caseof the up-variation, the hdamp parameter is also changed and set to twice the top-quark mass [41].
For the generation of the associated production of an on-shell W boson and a top quark (Wt), and singletop-quark production in the s- and t-channel, the Powheg (r2819, r2556) [42–44] generator with theCT10 PDF sets interfaced to Pythia using the Perugia2011C set of tuned parameters is used. TheWt process has a predicted production cross-section of 22.3 pb [45], calculated at approximate NNLOaccuracy with an uncertainty of 7.6% including scale and PDF uncertainties. The cross-sections forsingle top-quark production in the s- and t-channels are calculated with the Hathor v2.1 [46] tool atNLO precision, based on work documented in Ref. [47]. Uncertainties in the hard scatter scales andthe PDFs are estimated using the same methodology as for tt̄ production. For t-channel production,this leads to a cross-section of 84.6 pb with a total uncertainty of 5%, while for s-channel production across-section of 5.2 pb with a total uncertainty of 4.2% is predicted.
All top-quark processes are simulated with a top-quark mass of 172.5GeV and a width of 1.32GeVmodelled using a Breit-Wigner distribution. The top quark decays via t → Wb 100% of the time.
4
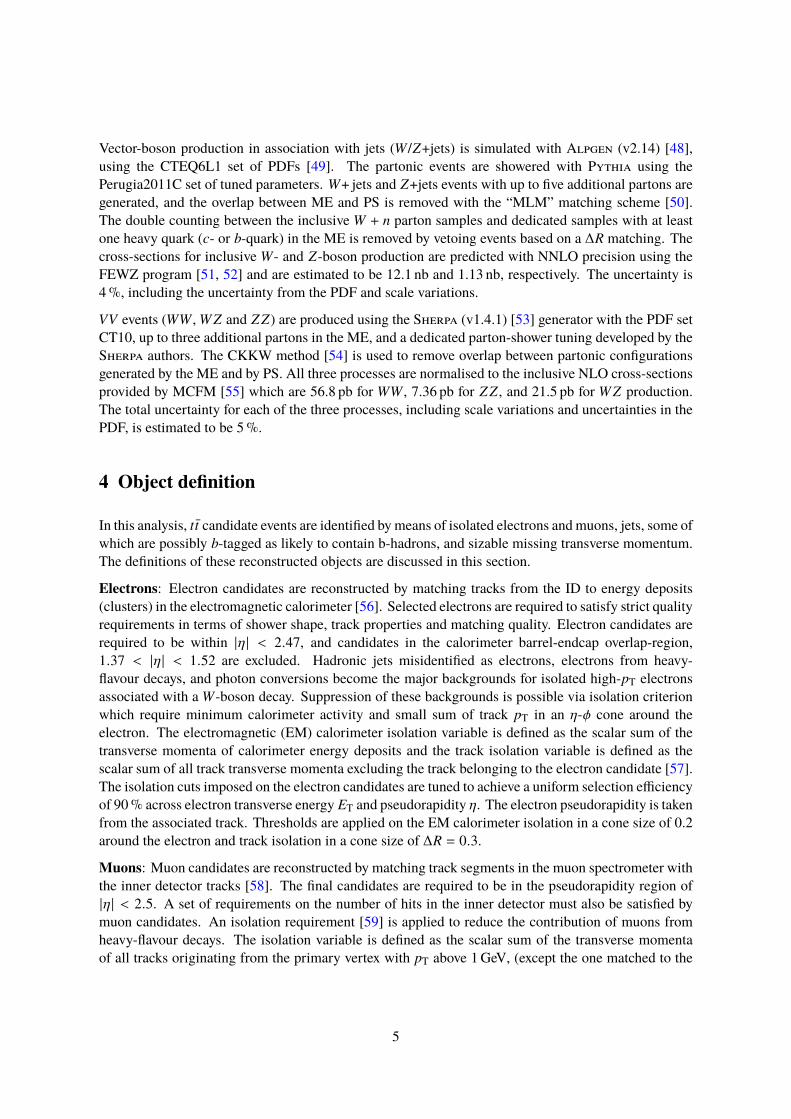
Vector-boson production in association with jets (W /Z+jets) is simulated with Alpgen (v2.14) [48],using the CTEQ6L1 set of PDFs [49]. The partonic events are showered with Pythia using thePerugia2011C set of tuned parameters. W+ jets and Z+jets events with up to five additional partons aregenerated, and the overlap between ME and PS is removed with the “MLM” matching scheme [50].The double counting between the inclusive W + n parton samples and dedicated samples with at leastone heavy quark (c- or b-quark) in the ME is removed by vetoing events based on a ∆R matching. Thecross-sections for inclusive W- and Z-boson production are predicted with NNLO precision using theFEWZ program [51, 52] and are estimated to be 12.1 nb and 1.13 nb, respectively. The uncertainty is4%, including the uncertainty from the PDF and scale variations.
VV events (WW , W Z and Z Z) are produced using the Sherpa (v1.4.1) [53] generator with the PDF setCT10, up to three additional partons in the ME, and a dedicated parton-shower tuning developed by theSherpa authors. The CKKW method [54] is used to remove overlap between partonic configurationsgenerated by the ME and by PS. All three processes are normalised to the inclusive NLO cross-sectionsprovided by MCFM [55] which are 56.8 pb for WW , 7.36 pb for Z Z , and 21.5 pb for W Z production.The total uncertainty for each of the three processes, including scale variations and uncertainties in thePDF, is estimated to be 5%.
4 Object definition
In this analysis, tt̄ candidate events are identified bymeans of isolated electrons andmuons, jets, some ofwhich are possibly b-tagged as likely to contain b-hadrons, and sizable missing transverse momentum.The definitions of these reconstructed objects are discussed in this section.
Electrons: Electron candidates are reconstructed by matching tracks from the ID to energy deposits(clusters) in the electromagnetic calorimeter [56]. Selected electrons are required to satisfy strict qualityrequirements in terms of shower shape, track properties and matching quality. Electron candidates arerequired to be within |η | < 2.47, and candidates in the calorimeter barrel-endcap overlap-region,1.37 < |η | < 1.52 are excluded. Hadronic jets misidentified as electrons, electrons from heavy-flavour decays, and photon conversions become the major backgrounds for isolated high-pT electronsassociated with a W-boson decay. Suppression of these backgrounds is possible via isolation criterionwhich require minimum calorimeter activity and small sum of track pT in an η-φ cone around theelectron. The electromagnetic (EM) calorimeter isolation variable is defined as the scalar sum of thetransverse momenta of calorimeter energy deposits and the track isolation variable is defined as thescalar sum of all track transverse momenta excluding the track belonging to the electron candidate [57].The isolation cuts imposed on the electron candidates are tuned to achieve a uniform selection efficiencyof 90% across electron transverse energy ET and pseudorapidity η. The electron pseudorapidity is takenfrom the associated track. Thresholds are applied on the EM calorimeter isolation in a cone size of 0.2around the electron and track isolation in a cone size of ∆R = 0.3.
Muons: Muon candidates are reconstructed by matching track segments in the muon spectrometer withthe inner detector tracks [58]. The final candidates are required to be in the pseudorapidity region of|η | < 2.5. A set of requirements on the number of hits in the inner detector must also be satisfied bymuon candidates. An isolation requirement [59] is applied to reduce the contribution of muons fromheavy-flavour decays. The isolation variable is defined as the scalar sum of the transverse momentaof all tracks originating from the primary vertex with pT above 1GeV, (except the one matched to the
5

muon) within a cone with radius Riso = 10GeV/pT(µ), where pT(µ) is the transverse momentum of themuon. Muon candidates are accepted when the isolation divided by the pT(µ) is less than 0.05. Muonsoverlapping with a jet within ∆R < 0.4 are removed from the event.
Jets: Jets are reconstructed using the anti-kt algorithm [60] with a radius parameter of 0.4, usingtopological clusters calibrated with the local cluster weighting (LCW) method [61] as inputs to the jetfinding algorithm. Jets are calibrated using a combination of an energy- and η-dependent simulation-based scheme and an in-situ correction scheme based on data [62]. Additionally a pileup correction isapplied on both data and MC before selection to further calibrate the jets [63]. Jets overlapping withidentified electron candidates within a cone of ∆R < 0.2 are removed from the list of jets, as the jet andthe electron are very likely to correspond to the same physics object. After the overlap removal, if thereare still electrons within ∆R < 0.4 distance to a jet, the electron is removed from the event. To rejectjets likely to have originated from pile-up, a quantity called jet vertex fraction (JVF) is defined as theratio of
∑pT,i∈PV of all tracks of the jet originating from the primary vertex to the
∑pT,i of all tracks
of the jet:
JVF =∑
pT,i∈PV∑pT,i
(3)
Jets with |η | < 2.4 and pT < 50GeV are required to have |JVF| > 0.5.
Identification of b-quark jets: One of the most important selection criteria for the analysis of eventscontaining top quarks is the identification of jets likely to contain b-hadrons, called b-tagging. Identi-fication of b-jets is based on the long lifetime of b-hadrons resulting in a significant flight path length,leading to reconstructable secondary vertices and tracks with large impact parameters relative to theprimary vertex. In this analysis, a neural network-based algorithm is used at a working point corres-ponding to a b-tagging efficiency in the simulated tt̄ events of 70%, a c-jet rejection factor of 5 andlight-flavour jet rejection factor of 140 [64]. Correction factors applied to simulated events compensatefor differences between data and simulation in the tagging efficiency for b, c and light flavour jets.The correction for b-jets is derived from tt̄ events in the dilepton channel and dijet events, and thecorrections are consistent with unity with uncertainties at the level of a few percent over most of the jetpT range [64].
Missing Transverse Momentum: The missing transverse momentum is a measure of the momentumof the escaping neutrinos. It also includes energy losses due to detector inefficiencies and its resolution,leading to the mis-measurement of the true transverse energy ET of the final interacting objects. Thevector of the transverse components of the missing energy, ®Emiss
T is calculated as the vector sum overall topological clusters in the event, and is further refined by applying object level corrections for thecontributions which arise from identified electrons, muons and jets [65]. The magnitude of the missingtransverse momentum vector is defined as Emiss
T = | ®EmissT |.
5 Event selection and classification
This section describes the selection of tt̄ candidate events. The data sets used in this analysis are obtainedfrom high-pT single-electron or single-muon triggers. For the electron channel, a calorimeter energycluster needs to be matched to a track and the trigger electron candidate is required to have ET > 60 GeVor ET > 24 GeV with additional isolation requirements [29]. The single-muon trigger [66] requireseither an isolated muon with pT > 24GeV or a muon with pT > 36GeV.
6

Each event is required to have at least one vertex reconstructed from at least five tracks. The vertex withthe largest sum of p2
T of the associated tracks is chosen as the primary vertex. Events containing anyjets with pT > 20 GeV failing to satisfy quality criteria defined in Ref. [67] are rejected, in order tosuppress background from beam gas or beam halo interactions, cosmic rays and calorimeter noise.
Depending on the accepted trigger, events are selected which contain exactly one isolated electron ormuon with pT > 25GeV. In addition to the requirements explained in Sect. 4, the ∆R between thereconstructed lepton and the trigger-lepton has to be less than 0.15. Events containing an electroncandidate and a muon candidate sharing an ID track are discarded.
Furthermore, events must have at least four jets with pT > 25GeV and |η | < 2.5. At least one of the jetshas to be b-tagged. To enhance the fraction of events with a leptonically decaying W boson, events arerequired to have Emiss
T > 25GeV and the transverse mass mT(W) of the lepton - EmissT pair is required to
be
mT(W) =√
2pT(`) · EmissT
[1 − cos
(∆φ
(®̀, ®Emiss
T
))]> 30GeV, (4)
with pT(`) the transverse momentum of the charged lepton and ∆φ the angle in the transverse planebetween the charged lepton and the ®Emiss
T .
The measurement of the tt̄ cross-section is performed by splitting the selected sample into three disjointsignal regions. These have different sensitivities to the various backgrounds, to the production ofadditional radiation, and to detector effects.
• SR1 : ≥ 4 jets, 1 b-tagIn this region, events with at least four jets of which exactly one is b-tagged are selected. Thisregion has the highest background fraction of all three signal regions, with W+ jets being thedominat background. The number of selected events is the highest of the signal regions.
• SR2 : 4 jets, 2 b-tagsIn this region, events with exactly four jets of which exactly two are b-tagged are selected.Small background is expected in this region and it provides an unambiguous association of thereconstructed objects to the top-quark decay-products. In particular, the two untagged jets arelikely to originate from the hadronically decaying W boson. The reconstructed W boson mass issensitive to the jet energy scale and to additional radiation.
• SR3 : ≥ 4 jets, ≥ 2 b-tags (excluding events from SR2 )In the third region, events are required to have at least four jets with at least two b-taggedjets. Events with four jets and exactly two b-tags are assigned to SR2. This region includes tt̄events with extra jet radiation including extra tt̄ + heavy flavour production and is sensitive tothe efficiency of identifying c-jets, originating mainly from the W → cs decay, as b-jets. Theexpected background is the smallest of the signal regions.
For the determination of the tt̄ cross-section a discriminant variable in each signal region is defined.The number of tt̄ events is extracted using a simultaneous fit of all three discriminant distributions toobserved data. In order to reduce systematic uncertainties due to the jet energy scale and b-taggingefficiency, their effects on the signal and background distributions are parametrised with nuisanceparameters, which are included in the fit.
7

6 Background modelling and estimation
The dominant background to tt̄ pair production is W+ jets production. This analysis uses a sampledefined from collision data to model the discriminant distribution shapes for this background, whilethe normalisation in each signal region is determined in the final fit. The multijet background process,which is difficult to model in the simulation, is also modelled using collision data but normalised usingcontrol regions. All remaining backgrounds are determined using simulated events and theoreticalpredictions.
The method to obtain a modelling of the W+ jets background shape from data is based on the similarityof the production and decay of the Z boson to that of the W boson.
First, an almost background-free Z+ jets sample is selected in the following way:
• Events are required to contain exactly two opposite charged leptons of the same flavour, i.e. e+e−
or µ+µ−.
• The dilepton invariant mass m(``) has to match the Z-boson mass (80 ≤ m(``) ≤ 102GeV).
These events are then ‘converted’ into W+ jets events. This is achieved in a first step by boosting theleptons of the Z-boson decay into the Z boson rest-frame, scaling their momenta to that of a leptondecay from aW boson by the ratio of the boson masses and boosting the leptons back into the laboratorysystem.
®p′∗`i =mW
mZ
®p∗`i (5)
where ®p∗`i is the momentum vector of lepton i in the Z-boson rest frame, mW and mZ are the masses ofthe W- and Z-bosons respectively and ®p′∗`i is the scaled momentum vector of lepton i in the Z-bosonrest frame.
After this conversion, one of the leptons is randomly chosen to be removed, and the ®EmissT is re-calculated.
Finally, the event selection cuts discussed in Sect. 5 are applied, except for the b-tagging requirement.In the following, this sample is referred to as the ZtoW sample.
Detailed studies are performed in simulation and in validation regions, e.g. requiring exactly twojets instead of four, to show the applicability of this method for the extraction of the tt̄ cross-section.As an example two important variables, discriminating between W+ jets and tt̄ events, are comparedbetween simulated W+ jets events with at least one b-tag and ZtoW events derived from a simulatedZ+ jets sample with no b-tagging requirement. Fig. 1 shows these variables: the event-shape variableaplanarity and the mass of the hadronically decaying top-quark candidate. Details about the top-quarkreconstruction are given in Sect. 7. The aplanarity is defined as
A =32λ3, (6)
where λ3 is the smallest eigenvalue of the sphericity tensor, defined by
Sαβ =
∑i pαi pβi∑i | pi |2
.
Here, α, β correspond to the x,y and z momentum components of final state object i in the event, i.e.the jets, the charged lepton and the reconstructed neutrino (see Sect. 7).
8

Fra
ctio
n of
eve
nts
/ 0.0
2
0
0.1
0.2
Simulation PreliminaryATLAS = 8 TeVs
W+Jets
ZtoW
MC stat. uncertainty
aplanarity0 0.1 0.2 0.3
rel.
diff.
-0.5
0
0.5
(a)
Fra
ctio
n of
eve
nts
/ 20
GeV
0
0.05
0.1
Simulation PreliminaryATLAS = 8 TeVs
W+Jets
ZtoW
MC stat. uncertainty
) [GeV]bjjm(0 100 200 300 400 500
rel.
diff.
-0.5
0
0.5
(b)Figure 1: Probability densities of (a) the aplanarity and (b) the mass of the hadronically decaying top quarkdistributions for simulated W+ jets events with at least four jets and at least one b-tag and ZtoW events derivedfrom a simulated Z+ jets sample with at least four jets and no b-tagging requirement. The relative differencebetween the numbers of ZtoW and W+ jets events in each bin is shown in the lower histogram. The gray errorband represents the Monte Carlo statistical uncertainty of the W+ jets sample. Events beyond the x-axis range areincluded in the last bin.
Residual differences between the shapes of the W+ jets and ZtoW templates are accounted for as asystematic uncertainty in the analysis. Since the method only provides shape information, the numberof expected events for the W+ jets process in the signal regions is obtained from the acceptance ofsimulated samples using Alpgen + Pythia and normalised to the inclusive NNLO W+ jets cross-section as described in Sect. 3. These numbers are only used as starting points for fit in the finalstatistical analysis and to provide an pre-fit event yield.
Multijet events may be selected if a jet is misidentified as an isolated lepton or if the event has a non-prompt lepton that appears to be isolated (fake lepton). The normalisation of the multijet backgroundis obtained from a fit to the observed Emiss
T in the electron channel or mT(W) distribution in the muonchannel in the signal regions. In order to construct a sample of multijet background events, differentmethods are adopted for the electron and muon channels.
The ‘jet-lepton’ method [68] is used to model the background due to fake electrons using a dijetsample simulated with the Pythia8 event generator [32]. A jet that resembles the electron has tohave ET > 25GeV and be located in the same η region as the signal electrons. The fraction of theelectromagnetic energy of the jet has to be between 0.8 and 0.95. The event is accepted if exactly one‘jet-lepton’ is found, and if the event passes all other selection cuts as described above, except that onEmissT . The yield of the multijet background in the electron-triggered data sample is estimated using
a binned maximum-likelihood fit to the EmissT distribution as detailed later in this section. In order to
improve the modelling of the η(`) distribution of the ‘jet-lepton’ model in SR1, the fit is done separatelyin the barrel region (|η | ≤ 1.37) and in the end-cap region (|η | > 1.52). The fits for SR2 and SR3 areperformed inclusively in |η | due to the lower number of selected events.
The ‘anti-muon’ method [68] uses a dedicated selection on data to enrich a sample in events thatcontain fake muons in order to build a multijet model for muon triggered events. A few of the muonidentification cuts are changed compared to signal muon candidates. The calorimeter isolation isinverted, while keeping the total energy loss of the muon in the calorimeters below 6GeV, and the cut
9

on the impact parameter is omitted. Applying additionally all other event selection cuts mentioned inSection 5 results in a sample that is highly enriched in fake muons frommultijet events, but contains onlya small amount of prompt muons from Z- and W-boson decays. The yield of the multijet background inthemuon triggered data sample is estimated from amaximum-likelihood fit to the mT(W) distribution.
In both methods to obtain the multijet background normalisation, the multijet template is fitted togetherwith templates derived from MC simulation for the tt̄ and W+ jets processes; their rate uncertainties,obtained from theoretical cross-section uncertainties, are accounted for in the fitting process in theform of constrained normalisation factors. The rates for Z+ jets, single top-quark processes, and VVprocesses are fixed. For the fits in SR2 and SR3, the W+ jets process is fixed as well, since the predictedyield is very small in these signal regions. The resulting fitted rate of tt̄ events is in agreement withinthe statistical uncertainty with the result of the final estimation of the tt̄ cross-section and therefore doesnot bias the result. Distributions of the fitted observable, normalised to the fit results, are shown inFig. 2.
The Matrix Method [68] is used as an alternative method to evaluate systematic uncertainties in themultijet background estimate. It provides template distributions and estimates of the number of multijetevents in SR1 . Differences between the two methods are taken into account as systematic uncertaintiesyielding a normalisation uncertainty of 67%. Due to the lack of statistics for the Matrix Method inSR2 and SR3 an uncertainty of 50% is assigned, based on comparisons of the rates obtained usingalternative methods described in previous analyses [68].
The resulting fractions of the multijet background for EmissT > 25 GeV and mT(W) > 30 GeV are
4.5 % ± 3.0 % in SR1, 2.5 % ± 1.3 % in SR2 and 1.5 % ± 0.8 % in SR3. All other processes, namely tt̄and single-top-quark production, Z+ jets and VV production, are modelled using simulation samples asdescribed in Sect. 3.
Table 1 summarises the event yields in the three signal regions for the tt̄ signal process and each ofthe background processes. The yields, apart from the multijet background, are calculated using theacceptance from MC samples normalised to their respective theoretical cross-sections as discussed inSect. 3.
Table 1: Event yield for the three signal regions. The multijet background is estimated from the mT(W) or EmissT
fit to data and the uncertainty is calculated as explained in the Section 6. All the other expectations are derivedusing theoretical cross-sections, and the corresponding uncertainties arise from Monte Carlo statistics only.
Process SR1 SR2 SR3
tt̄ 133 310± 370 63 060± 250 59 310± 240Single top 11 020± 110 3728± 61 2593± 51W+ jets 29 870± 170 2382± 49 1592± 40Z+ jets 3569± 60 406± 20 270± 16Diboson 1339± 37 135± 12 112± 11Multijet 10 300± 6 900 1 940± 970 1 050± 530
Total expected 189 400± 6 900 71 700± 1 000 64 920± 580
Observed 192 686 72 978 70 120
10

[GeV]missTE
Eve
nts
/ 5 G
eV
0
2000
4000
6000
[GeV]missTE
0 50 100 150 200
Pre
d.D
ata
0.81
1.2
|<1.5η| 4 jets 1 tag, electrons≥
PreliminaryATLAS -1 20.2 fb,=8 TeVsDatatt
Single topW+JetsZ+JetsDibosonMultijetMC stat. + syst.
(a)
(W) [GeV]Tm
Eve
nts
/ 5 G
eV
0
5000
10000
(W) [GeV]Tm0 50 100 150 200
Pre
d.D
ata
0.81
1.2
4 jets 1 tag, muons≥ PreliminaryATLAS -1 20.2 fb,=8 TeVs
Datatt
Single topW+JetsZ+JetsDibosonMultijetMC stat. + syst.
(b)
[GeV]missTE
Eve
nts
/ 5 G
eV
0
1000
2000
3000
[GeV]missTE
0 50 100 150 200
Pre
d.D
ata
0.81
1.2
4 jets 2 tag, electrons PreliminaryATLAS -1 20.2 fb,=8 TeVs
Datatt
Single topW+JetsZ+JetsDibosonMultijetMC stat. + syst.
(c)
(W) [GeV]Tm
Eve
nts
/ 5 G
eV
0
1000
2000
3000
4000
(W) [GeV]Tm0 50 100 150 200
Pre
d.D
ata
0.81
1.2
4 jets 2 tag, muons PreliminaryATLAS -1 20.2 fb,=8 TeVs
Datatt
Single topW+JetsZ+JetsDibosonMultijetMC stat. + syst.
(d)
[GeV]missTE
Eve
nts
/ 5 G
eV
0
1000
2000
[GeV]missTE
0 50 100 150 200
Pre
d.D
ata
0.81
1.2
2 tag, electrons≥ 4 jets ≥ PreliminaryATLAS -1 20.2 fb,=8 TeVs
Datatt
Single topW+JetsZ+JetsDibosonMultijetMC stat. + syst.
(e)
(W) [GeV]Tm
Eve
nts
/ 5 G
eV
0
1000
2000
3000
4000
(W) [GeV]Tm0 50 100 150 200
Pre
d.D
ata
0.81
1.2
2 tag, muons≥ 4 jets ≥ PreliminaryATLAS -1 20.2 fb,=8 TeVs
Datatt
Single topW+JetsZ+JetsDibosonMultijetMC stat. + syst.
(f)Figure 2: Observed and simulated (left) Emiss
T distributions in the electron channel for the barrel region and (right)mT(W) distributions in the muon channel, normalised to the result of the binned maximum-likelihood fit, (a)-(b)in SR1, (c)-(d) in SR2, and (e)-(f) in SR3. The hatched error band represents the uncertainty due to the samplesize and the normalisation of the multijet background. The ratio of observed to predicted (Pred.) number ofevents in each bin is shown in the lower histogram. Events beyond the x-axis range are included in the last bin.
11

Table 2: The seven input variables of the NN, ordered by their discriminating power.Variable Definitionm12 The smallest invariant mass between jet pairs.cos(θ∗)bj j Angle between the hadronic top-quark momentum and the beam direction
in the tt̄ rest frame.m(`νb) Mass of the reconstructed semileptonically decaying top quark.A Aplanarity, as defined in Eq. 6m(bj j) Mass of the reconstructed hadronically decaying top quark.m`1 The smallest invariant mass between the charged lepton and a jet.m23 The second smallest invariant mass between jet pairs.
7 Discriminating observables
In order to further separate the signal events from background events in SR1 and SR3 , the outputdistribution of an artificial neural network (NN) [69, 70] is used. A large number of potential NNinput variables are studied for their discriminating power between W+ jets and tt̄ and the consistency oftheir distributions between simulated W+ jets events with at least one b-tag and ZtoW events with nob-tagging requirement. The observables investigated are based on invariant masses between jets andleptons, event shape observables and properties of the reconstructed top quarks.
In SR1 and SR3 , the semileptonically decaying top quark is reconstructed. First the semileptonicallydecaying W boson four-momentum is reconstructed from the identified charged lepton four-momentumand the Emiss
T , the latter representing the transverse momentum of the neutrino. The unmeasured z-component of the neutrino momentum pz(ν) is inferred by imposing a W-boson mass constraint on thelepton-neutrino system, leading to a two-fold ambiguity. In the case of two real solutions, the one withthe lower |pz | is chosen. In the case of complex solutions, which can occur due to the Emiss
T resolution,a fit is performed that rescales the neutrino px and py such that the imaginary radical vanishes, atthe same time keeping the transverse components of the neutrino as close as possible to the x- andy-components of Emiss
T . To reconstruct the semileptonically decaying top quark, the four jets with thehighest pT are selected and the one with the smallest ∆R to the charged lepton is chosen to be the b-jet.The semileptonically decaying top quark is then reconstructed by adding the four-vector of the W bosonand the chosen b-jet. The hadronically decaying top quark is reconstructed by adding the four-vectorsof the remaining three highest-pT jets.
Seven observables are finally chosen as input variables to the NN (see Table 2). The NN infrastructureconsists of one input node for each input variable plus one bias node, eight nodes in the hidden layer,and one output node, which gives a continuous output oNN in the interval [0, 1]. For the training of theNN, an equal number of simulated tt̄ events and ZtoW events is used. The discriminating power of theNN between ZtoW and tt̄ events can be seen in Fig. 3 for SR1 and SR3.
Since in SR2 the background contribution is very small, a different distribution is used as the discriminantin the final fit. In measurements of the top quark mass, the invariant mass of the two untagged jetsm( j j) is frequently utilised to reduce the impact of the jet energy scale (JES) uncertainty [71–74]. Thisapproach is also followed here. The normalised distribution of m( j j) is shown in Fig. 4(a) with thebinning used in the final fit, while the dependency on the JES is shown in Fig. 4(b) using simulated
12

NNo0 0.2 0.4 0.6 0.8 1
Fra
ctio
n of
eve
nts
0
0.05
0.1
0.15 tt
ZtoW data
4 jets 1 tag≥ PreliminaryATLAS -1 20.2 fb,=8 TeVs
(a)
NNo0 0.2 0.4 0.6 0.8 1
Fra
ctio
n of
eve
nts
0
0.05
0.1
0.15tt
ZtoW data
2 tag≥ 4 jets ≥ PreliminaryATLAS -1 20.2 fb,=8 TeVs
(b)
Figure 3: Probability densities of the neural-network discriminant oNN for the simulated tt̄ signal process and theW+ jets background process derived from data using converted Z+ jets events (a) for SR1 and (b) for SR3.
tt̄ events with modified JES correction factors. Here the energy of the jets are scaled by a constantscaling factor of 1.00± 0.04. Additionally, the mean of the m( j j) distribution is sensitive to the amountof additional radiation. A comparison of the mean value of a Gaussian distribution fitted to the m( j j)distribution in the range of 60GeV < m( j j) < 100GeV for different generator setups is presentedin Fig. 4(c). It can be seen that the mean value is consistent between different generator setups, butdifferent for different settings of the parameters controlling the initial and final state radiation. For thesereasons, the m( j j) is used as discriminant in SR2.
Finally the ratio of single to double b-tagged events, i.e. the ratio of events in SR1 and the sum of eventsin SR2 and SR3 together is sensitive to the b-tagging efficiency. A small sensitivity to heavy flavourproduction in the parton shower is obtained through the inclusion of events with more than two b-tagsin SR3.
13

m(jj) [GeV]0 50 100 150 200
Fra
ctio
n of
eve
nts
/ 8 G
eV
0
0.05
0.1
0.15
tt
4 jets 2 tag Simulation PreliminaryATLAS = 8 TeVs
(a)
m(jj) [GeV]60 70 80 90 100
Fra
ctio
n of
eve
nts
/ GeV
0
0.01
0.02
%4+ global JEStt
%4- global JEStt
tt
4 jets 2 tag Simulation PreliminaryATLAS = 8 TeVs
(b)
<m(jj)> [GeV]73 74 75 76 77 78 79 80 81
t = mdamp
Powheg+Pythia h
Powheg+Herwig
MC@NLO+Herwig
Powheg+Pythia radHi
Powheg+Pythia radLo
=8 TeV s Simulation Preliminary ATLAS4 jets 2 tag
(c)
Figure 4: Probability densities for the tt̄ signal process of the m( j j) distribution (a) as used in the analysis, whereevents beyond the x-axis range are included in the last bin, (b) for three different values of the JES, where eventsbeyond the x-axis range are not shown and the range is restricted to show the peak. (c) Mean value of a fit to them( j j) distribution using a Gaussian distribution for different signal generator setups. The uncertainties shownare statistical only.
14

8 Sources and evaluation of systematic uncertainties
Several sources of systematic uncertainties affect the tt̄ cross-section measurement. In addition to theluminosity determination, they are related to the modelling of the physics objects, the modelling oftt̄ production and the understanding of the background processes. All of them affect the yields andkinematic distributions (shape of the distributions) in the three signal regions.The uncertainties are split into the following categories:
Physics object modellingSystematic uncertainties due to the residual differences between collision data and Monte Carlo simu-lations on jets, electron and muon reconstruction after calibration, and uncertainties in corrective scalefactors are propagated through the entire analysis.
Uncertainties due to the lepton trigger, lepton reconstruction and selection efficiencies in simulation areestimated from measurements of the efficiency in data using Z → `` decays. The same processes areused to evaluate uncertainties in the lepton momentum scale and resolution and correction factors andassociated uncertainties are derived to match simulated to observed distributions [57, 58, 75].
The jet energy scale JES is derived using information from test-beam data, collision data and simulation.The uncertainty is parametrised in pT and η of the reconstructed jet [62, 76]. The JES uncertainty isbroken down into various components originating from the calibrationmethod, the calorimeter response,the detector simulation, and the set of parameters used in the MC event generator. Furthermore,contributions from the modelling of pile-up effects, differences between b-quark and light-quark orgluon-induced jets are included. A large source of uncertainty in the JES originates from the unknownrelative fractions of quark-induced and gluon-induced jets in a generic sample, which is normallyassumed to be 50 ± 50 %. Because the actual fraction of gluon-induced jets in events consideredby this analysis is known, the uncertainty is reduced. The fraction of gluon-induced jets is obtainedfrom simulated events, considering all selected jets apart from b-jets and it is between 15% to 30%depending on the pT and η of the jet. The uncertainty in this fraction is estimated by comparing differenttt̄ samples, namely Powheg +Pythia, Powheg +Herwig, and MC@NLO +Herwig as well as sampleswith varied scale settings in the Powheg +Pythia setup. To evaluate the systematic uncertainty of theJES, a parametrisation with 25 uncorrelated components is used, as described in Ref. [76]. For thepurpose of the extraction of the tt̄ cross-section, a single correction factor for the JES is included in thefit as a nuisance parameter (see Sect. 9). In this procedure, the dependence of the acceptance and theshape of the m( j j) template distribution on the JES is parametrised using the single JES uncertaintycorrection factor corresponding to the total JES uncertainty. Fig. 5 shows the the ±1σ deviation of theJES correction factor for the m( j j) distribution. When estimating the systematic uncertainty in the tt̄cross-section due to JES in the statistical procedure all 25 components are considered and evaluated asdescribed in Sect. 9.
Smaller uncertainties come from modelling of the jet energy resolution [77, 78] and missing transversemomentum [65] to account for contributions from calorimeter cells not matched to any jets, soft jets,and pile-up. Uncertainties from the scale and resolution corrections on leptons and jets are propagatedinto the calculation of the missing transverse momentum as well. The effect of uncertainties associatedwith the jet-vertex fraction is also considered for each jet.
Since the analysis makes use of b-tagging, the uncertainties in the b-tagging efficiencies and the c-jetand light-jet mistag probability are taken into account [79, 80]. Similar to the JES, the correction factor
15

Fra
ctio
n of
eve
nts
/ 8 G
eV0
0.05
0.1
0.154 jets 2 tag
Simulation PreliminaryATLAS = 8 TeVstt
σ1+global JESσ1-global JES
MC stat. uncertainty
m(jj) [GeV]0 50 100 150 200
rel.
diff.
-0.10
0.1
Figure 5: Probability density of the m( j j) distribution of simulated tt̄ events in SR2 for the nominal JES and the±1σ deviation. The hatched error band represents the statistical uncertainty of the sample. Events beyond thex-axis range are included in the last bin.
of the b-tagging efficiency is included as a nuisance parameter in the fit for the extraction of the tt̄cross-section. The parametrisation of the correction factor is obtained from the total uncertainty on theb-tagging efficiency.
Signal Monte Carlo modelling and parton distribution functionsSystematic effects from MC modelling are estimated by comparing different generators and varyingparameters for the event generation of the signal process.
The uncertainty due to the choice of the factorisation scale, renormalisation scale, and amount ofadditional radiation in the parton shower is evaluated using the Powheg generator interfaced to Pythiaby varying these scales and using alternative sets of tuned parameters for the parton shower as describedin Section 3. Systematic effects due to the matching of the NLO matrix element calculation andthe parton shower for tt̄ is estimated by comparing MC@NLO with Powheg, both interfaced to theHerwig parton shower. An uncertainty related to the modelling of parton-shower, underlying eventand hadronization effects, is estimated by comparing samples produced with Powheg +Herwig andPowheg +Pythia. More details about these sample were given in Sect. 3.
Systematic uncertainties related to the PDF sets are taken into account for the signal process. Theuncertainty is calculated following the PDF4LHC recommendation [81] using the PDF4LHC15_NLOPDF set. In addition, we consider the acceptance difference between PDF4LHC15_NLO and CT10,since the latter PDF set is not covered by the uncertainty obtained with PDF4LHC15_NLO and it is usedin the simulation of tt̄ events. Finally the larger of the two uncertainties is used in the final analysis.
Finally, the statistical uncertainty of the MC samples as well as the ZtoW data sample is included.
Background normalisation for non-fitted backgroundsUncertainties in the normalisation of the non-fitted backgrounds, i.e single top-quark production, VV ,and Z+ jets, are estimated using the uncertainties in the theoretical cross-section predictions. In thecase of Z+ jets, an uncertainty of 24% per additional jet is added to the uncertainty of the inclusivecross-section. The uncertainty in the multijet background is obtained in SR1 from the comparison
16

between the fitting method and the matrix method as detailed in Section 6. For the other two regions,an uncertainty of 50% is used.
Background modellingUncertainties in the shape of the W+ jets and multijet backgrounds are taken into account for thediscriminating observables used in the analysis. For the W+ jets background, shape uncertainties areextracted from the differences between Z-boson and W-boson production. Although their productionmodes are very similar, differences exist in the details of the production and decay. There are differencesin heavy-flavour production and in the different helicity structures of the decay vertices. Shape variationsare built from a comparison of theNNdiscriminant and them( j j) distribution between simulatedW+ jetsevents, described in detail in Section 3, and ZtoW events derived from a simulated Z+ jets sample. Theuncertainty in the multijet background kinematics is determined from the differences between thepredictions from the ‘jet-lepton’ or ‘anti-muon’ method and the matrix method in SR1.
Luminosity The absolute luminosity scale is derived from beam-separation scans performed inNovember 2012. The uncertainty in the integrated luminosity is 1.9% [82].
Beam energy The beam energy of the LHC was determined at 4 TeV based on the LHC magneticmodel together with measurements of the revolution frequency difference of proton and lead-ion beamswith an uncertainty of 0.1% [83]. The impact of the uncertainty of the beam energy on the measuredcross section is negligible.
9 Extraction of the t t̄ cross-section
To extract the tt̄ cross-section, a binned maximum-likelihood fit is performed in the three signal regionsdefined in Sect. 5. For SR1 and SR3 the distribution used in the fit is the NN discriminant, while theinvariant-mass distribution m( j j) of the two untagged jets is used in SR2. Electron and muon triggeredevents are combined in these templates.
Scale factors for the signal βt t̄ , for the W+ jets background, βWj , and two nuisance parameters δi,namely the b-tagging efficiency correction factor δb−tag and the JES correction factor δJES, are fitted inall three signal regions simultaneously. The δi are defined such, that 0 corresponds to the nominal valueand ±1.0 to a deviation of ±1σ of the corresponding systematic uncertainty.
In order to account for differences in the flavour composition of theW+ jets background, two uncorrelatedscale factors are used: one in SR1 (βW1) and one in the two other signal regions (βW2,3). The event yieldsof the other backgrounds are not allowed to vary in the fit, but instead are fixed to their predictions. Thelikelihood function is given by the product of the Poisson likelihoods in the individual bins M of thehistograms. A Gaussian prior is incorporated into the likelihood function to constrain δb−tag within theassociated uncertainty:
L(βt t̄, βW1, βW2,3, δb−tag, δJES) =M∏k=1
e−µk · µnkk
nk!· G(δb−tag; 0, 1) (7)
17

with
µk = βs · ν̃s · αsk +
2∑j=1
βWj · ν̃Wj · αWj
k+
4∑b=1
ν̃b · αbk ,
βs = βt t̄
{1 +
2∑i=1|δi | · (H(δi) · εi+ + H(−δi) · εi−)
},
αsk = αt t̄
k
2∑i=1|δi | ·
{(α+ki − αk) · H(δi) + (α
−ki − αk) · H(−δi)
}.
(8)
The number of expected events µk in bin k is the sum of the expected number of events for the signaland the background processes. These are given by the product of the predicted events ν̃p of eachprocess and the fraction of events αp
kin bin k of the normalised distribution. Here p denotes the
signal s and background processes Wj, b, where b represents the background processes which are notvaried in the fit. The number of observed events in bin k is denoted by nk . For tt̄ signal, the scalefactor βs contains the acceptance uncertainties for positive εi+ and negative εi− variations of the twoprofiled systematic uncertainties, multiplied by their nuisance parameter δi. H denotes the Heavisidefunction. The signal template shape for each profiled systematic variation are calculated by interpolatingin each bin k between the standard template αk and the systematically altered histograms α±
kiusing
the systematic nuisance parameter δi as a weight. Linearity and closure tests are done to validate thestatistical procedure.
The fit finds the minimum of the negative log-likelihood function for the parameter values shown inTable 3. The estimators for the nuisance parameters, which parametrise their optimal shift relative tothe default value 0 in terms of theirs uncertainty, are found to be δ̂ = 0.62± 0.09 for the b-taggingefficiency correction factor and 0.68±0.07 for JES correction factor. These deviations of the b-taggingefficiency correction factor from the nominal values of the simulated sample corresponds to a shift ofthe acceptance in SR1 of 1% and 2.6% in SR2 and SR3. The deviations for the JES correction factorcorresponds to a shift of the acceptance of 2.9% in SR1 , of 1.4% in SR2 , and of 4.4% in SR3. Thedeviation of JES scale factor also accounts for differences in the modelling of additional radiation in theMC generator. Finally the fitted scale factor of theW+ jets process in SR2 and SR3 yields a significantlyhigher value then the expected one from MC simulation, consistent with underestimating additionalheavy-flavour production in the simulation.
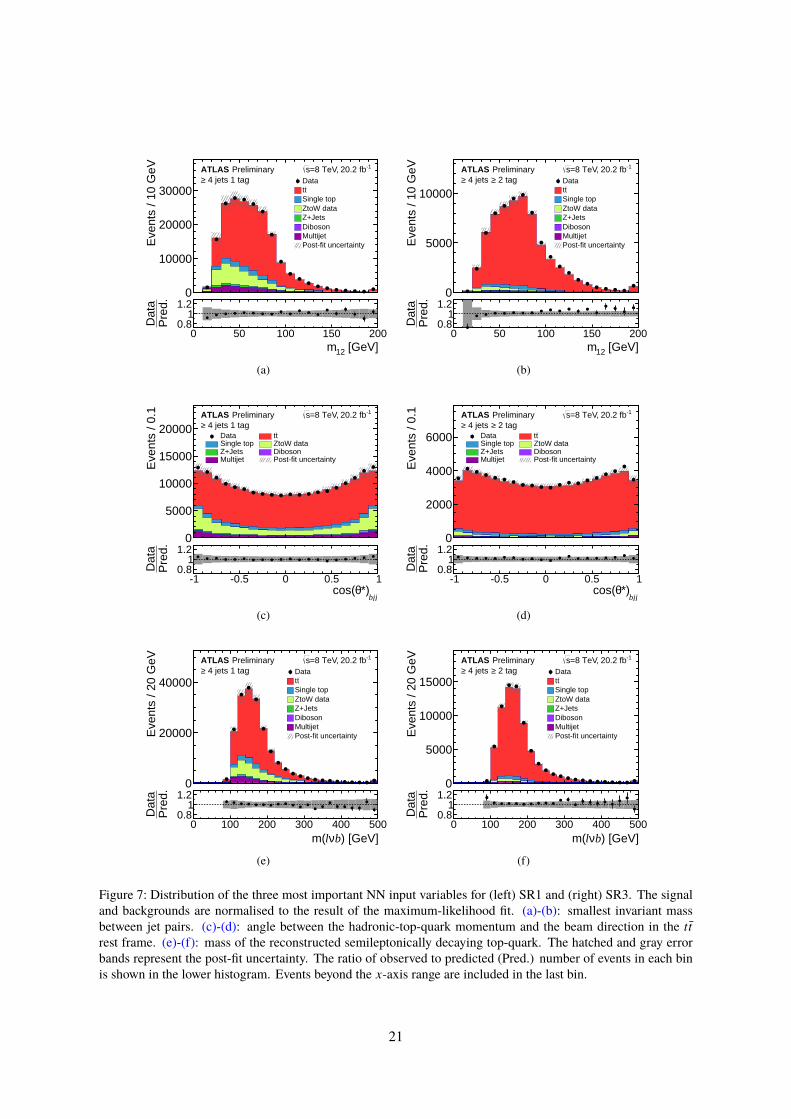
The signal and background processes scaled and morphed to the fitted values are compared to theobserved distributions of the NN discriminant distribution in SR1 and SR3 and the m( j j) distribution inSR2, shown in Fig. 6. Comparisons of the data and the fit results are shown for the three most importantinput variables of the NN in Fig. 7 for SR1 and for SR3.
The systematic uncertainties in the cross-section measurements are determined using pseudo experi-ments. In each of these experiments, the detector effects, background contributions and model uncer-tainties are varied within their systematic uncertainties. They impact the yields of the processes andshapes of the template distributions used to create the pseudo datasets in the the three signal channels.Correlations between rate and shape uncertainties for a given component are taken into account. Theentire set of pseudo experiments can thereby be interpreted as a replication of the sample space of allsystematic variations given the systematically limited knowledge. By performing the measurement ofthe tt̄ cross-section an estimator of the probability density of all possible outcomes of the measurementis obtained. The RMS of this estimator distribution is itself an estimator of the observed uncertainties.
18

Table 3: Result of the maximum-likelihood fit to data. Estimators of the parameters of the likelihood function,the scale factor β̂ for the tt̄ and the two W+ jets channels and the derived contributions of the various processesto the three signal regions. The quoted uncertainties are statistical only for tt̄ and W+ jets and they contain for allother processes normalisation uncertainties.
Process β̂ SR1 SR2 SR3
tt̄ 0.982 ± 0.005 133 390± 630 64 360± 300 62 380± 280
W+ jets 1 tag 1.08 ± 0.02 32 150± 480 – –W+ jets ≥ 2 tags 1.41 ± 0.08 – 3 370± 190 2 250± 130Single top – 11 020± 660 3 730± 220 2 590± 160Z+ jets – 3 600± 1 700 410± 200 270± 130Diboson – 1 300± 640 135± 65 112± 54Multijet – 10 300± 6 900 1 940± 970 1 050± 530
Total sum – 191 700± 7 200 73 900± 1 100 68 660± 650Total observed – 192 686 72 978 70 120
Using the measured tt̄ cross-section and the estimated nuisance parameters, the uncertainty of the actualmeasurement is estimated.
The total uncertainty in the inclusive tt̄ cross-section is presented in Table 4 and is determined to be±5.7 %. The breakdown of the contributions from individual or categories of systematic uncertaintiesare also listed. In this case only the considered source or group of sources is varied in the generationof the pseudo experiments. The largest uncertainty is due to the uncertainty in the PDF sets and theMC modelling of the signal process. The uncertainties in the JES and the b-tagging efficiency havebeen significantly reduced by including them as nuisance parameters together with the choice of thesignal regions and the discriminant distributions. Additionally the uncertainty in additional radiation isreduced by a factor of three due to inclusion of the m( j j) distribution in the analysis.
10 Results
After performing a binned maximum-likelihood fit to the NN discriminant distributions and the m( j j)distribution, and estimating the total uncertainty, the inclusive tt̄ cross-sections is measured to be:
σt t̄ = 248.3 ± 0.7 (stat.) ± 13.4 (syst.) ± 4.7 (lumi.) pb
assuming a top-quark mass of mtop = 172.5GeV.
The dependence of the cross-section measurements on the assumed value of mtop is mainly due toacceptance effects and is found to be expressed by the function:
σt t̄ (mtop) = σt t̄ (172.5GeV) + p1 · ∆mtop + p2 · ∆m2top (9)
with ∆mtop = mtop − 172.5GeV. The parameters p1 = −2.07 ± 0.07 pb/GeV and p2 = 0.07 ±0.02 pb/GeV2 are determined using dedicated signal samples with different mtop values and repeatingto fit to data.
19

NNo
Eve
nts
0
10000
20000
30000
40000
NNo0 0.2 0.4 0.6 0.8 1
Pre
d.D
ata
0.81
1.2
4 jets 1 tag≥ PreliminaryATLAS -1 20.2 fb,=8 TeVs
Data ttSingle top ZtoW dataZ+Jets DibosonMultijet Post-fit uncertainty
(a)
m(jj) [GeV]
Eve
nts
/ 8 G
eV
0
5000
10000
m(jj) [GeV]0 50 100 150 200
Pre
d.D
ata
0.81
1.2
4 jets 2 tag PreliminaryATLAS -1 20.2 fb,=8 TeVs
Datatt
Single topZtoW dataZ+JetsDibosonMultijetPost-fit uncertainty
(b)
NNo
Eve
nts
0
5000
10000
15000
20000
NNo0 0.2 0.4 0.6 0.8 1
Pre
d.D
ata
0.81
1.2
2 tag≥ 4 jets ≥ PreliminaryATLAS -1 20.2 fb,=8 TeVs
Data ttSingle top ZtoW dataZ+Jets DibosonMultijet Post-fit uncertainty
(c)
Figure 6: Neural network discriminant oNN and the m( j j) distributions normalised to the result of the maximum-likelihood fit for (a) SR1, (b) SR2, and (c) SR3. The hatched and gray error bands represent the post-fit uncertainty.The ratio of observed to predicted (Pred.) number of events in each bin is shown in the lower histogram. Eventsbeyond the x-axis range are included in the last bin.
11 Conclusions
A measurement of the inclusive tt̄ cross-section at√
s = 8 TeV in the semileptonic decay modeis presented using data collected in 2012 with the ATLAS detector corresponding to an integratedluminosity of 20.2 fb−1.
In order to reduce major uncertainties coming from the jet energy scale and the heavy flavour contentof the dominant W+ jets background, the analysis makes use of a data-driven approach to model thisbackground. The approach is based on splitting the selected data sample into three disjoint signal
20
[GeV]12m
Eve
nts
/ 10
GeV
0
10000
20000
30000
[GeV]12m0 50 100 150 200
Pre
d.D
ata
0.81
1.2
4 jets 1 tag≥ PreliminaryATLAS -1 20.2 fb,=8 TeVs
Datatt
Single topZtoW dataZ+JetsDibosonMultijetPost-fit uncertainty
(a)
[GeV]12m
Eve
nts
/ 10
GeV
0
5000
10000
[GeV]12m0 50 100 150 200
Pre
d.D
ata
0.81
1.2
2 tag≥ 4 jets ≥ PreliminaryATLAS -1 20.2 fb,=8 TeVs
Datatt
Single topZtoW dataZ+JetsDibosonMultijetPost-fit uncertainty
(b)
bjj*)θcos(
Eve
nts
/ 0.1
0
5000
10000
15000
20000
bjj*)θcos(
-1 -0.5 0 0.5 1
Pre
d.D
ata
0.81
1.2
4 jets 1 tag≥ PreliminaryATLAS -1 20.2 fb,=8 TeVs
Data ttSingle top ZtoW dataZ+Jets DibosonMultijet Post-fit uncertainty
(c)
bjj*)θcos(
Eve
nts
/ 0.1
0
2000
4000
6000
bjj*)θcos(
-1 -0.5 0 0.5 1
Pre
d.D
ata
0.81
1.2
2 tag≥ 4 jets ≥ PreliminaryATLAS -1 20.2 fb,=8 TeVs
Data ttSingle top ZtoW dataZ+Jets DibosonMultijet Post-fit uncertainty
(d)
) [GeV]bνlm(
Eve
nts
/ 20
GeV
0
20000
40000
) [GeV]bνlm(0 100 200 300 400 500
Pre
d.D
ata
0.81
1.2
4 jets 1 tag≥ PreliminaryATLAS -1 20.2 fb,=8 TeVs
Datatt
Single topZtoW dataZ+JetsDibosonMultijetPost-fit uncertainty
(e)
) [GeV]bνlm(
Eve
nts
/ 20
GeV
0
5000
10000
15000
) [GeV]bνlm(0 100 200 300 400 500
Pre
d.D
ata
0.81
1.2
2 tag≥ 4 jets ≥ PreliminaryATLAS -1 20.2 fb,=8 TeVs
Datatt
Single topZtoW dataZ+JetsDibosonMultijetPost-fit uncertainty
(f)
Figure 7: Distribution of the three most important NN input variables for (left) SR1 and (right) SR3. The signaland backgrounds are normalised to the result of the maximum-likelihood fit. (a)-(b): smallest invariant massbetween jet pairs. (c)-(d): angle between the hadronic-top-quark momentum and the beam direction in the tt̄rest frame. (e)-(f): mass of the reconstructed semileptonically decaying top-quark. The hatched and gray errorbands represent the post-fit uncertainty. The ratio of observed to predicted (Pred.) number of events in each binis shown in the lower histogram. Events beyond the x-axis range are included in the last bin.
21
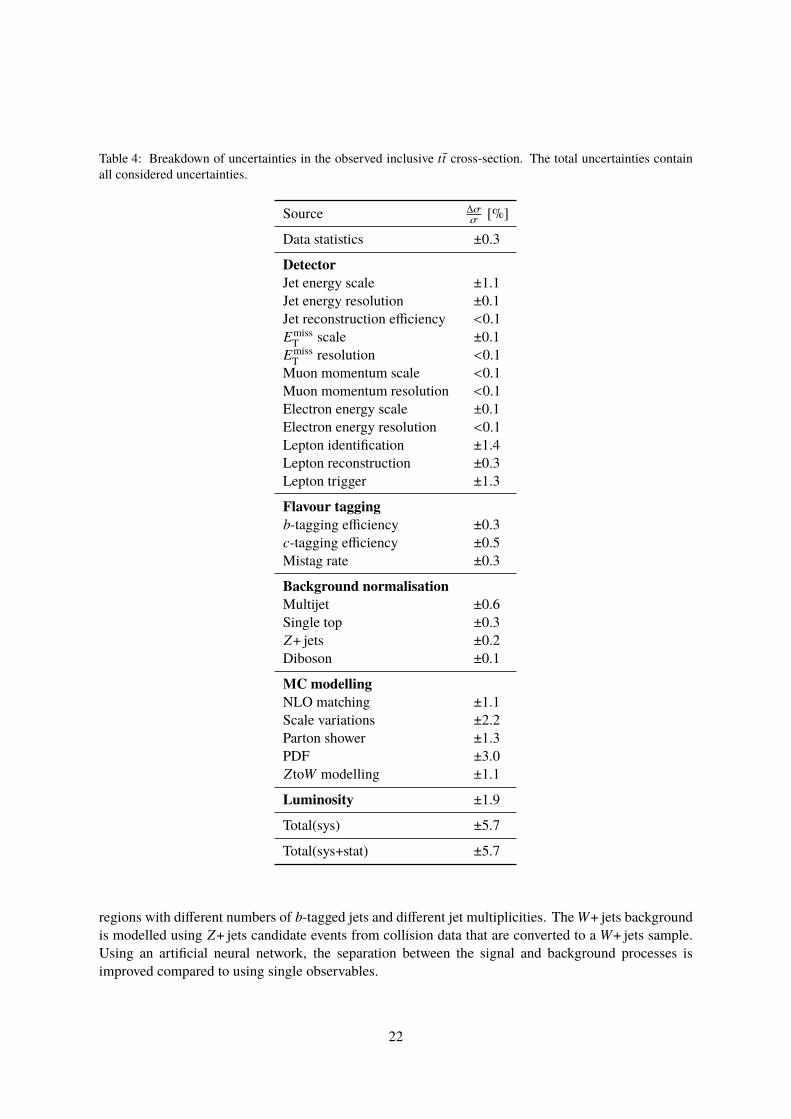
Table 4: Breakdown of uncertainties in the observed inclusive tt̄ cross-section. The total uncertainties containall considered uncertainties.
Source ∆σσ [%]
Data statistics ±0.3
DetectorJet energy scale ±1.1Jet energy resolution ±0.1Jet reconstruction efficiency <0.1EmissT scale ±0.1
EmissT resolution <0.1
Muon momentum scale <0.1Muon momentum resolution <0.1Electron energy scale ±0.1Electron energy resolution <0.1Lepton identification ±1.4Lepton reconstruction ±0.3Lepton trigger ±1.3
Flavour taggingb-tagging efficiency ±0.3c-tagging efficiency ±0.5Mistag rate ±0.3
Background normalisationMultijet ±0.6Single top ±0.3Z+ jets ±0.2Diboson ±0.1
MC modellingNLO matching ±1.1Scale variations ±2.2Parton shower ±1.3PDF ±3.0ZtoW modelling ±1.1
Luminosity ±1.9
Total(sys) ±5.7
Total(sys+stat) ±5.7
regions with different numbers of b-tagged jets and different jet multiplicities. The W+ jets backgroundis modelled using Z+ jets candidate events from collision data that are converted to a W+ jets sample.Using an artificial neural network, the separation between the signal and background processes isimproved compared to using single observables.
22

The tt̄ cross-section is determined using a binned maximum-likelihood fit to the three signal regions,constraining correction factors for the jet energy scale and the b-tagging efficiency. The measuredcross-section has an uncertainty of 5.7%.
This result improves significantly with respect to the previous ATLASmeasurement at√
s = 8 TeV in thesemileptonic decay mode [27] and is in agreement with measurements of the inclusive tt̄ cross-sectionin other decay modes and the theoretical prediction.
References
[1] P. W. Higgs, Broken Symmetries and the Masses of Gauge Bosons,Phys. Rev. Lett. 13 (1964) 508.
[2] F. Englert and R. Brout, Broken Symmetry and the Mass of Gauge Vector Mesons,Phys. Rev. Lett. 13 (1964) 321.
[3] M. Baak et al., The global electroweak fit at NNLO and prospects for the LHC and ILC,Eur. Phys. J. C 74 (2014) 3046, arXiv: 1407.3792 [hep-ph].
[4] A. Buckley et al., Constraining top quark effective theory in the LHC Run II era,JHEP 1604 (2016) 015, arXiv: 1512.03360 [hep-ph].
[5] M. Czakon, P. Fiedler and A. Mitov,The total top quark pair production cross-section at hadron colliders through O(α4
S),Phys. Rev. Lett. 110 (2013) 252004, arXiv: 1303.6254 [hep-ph].
[6] U. Langenfeld, S. Moch and P. Uwer, Measuring the running top-quark mass,Phys. Rev. D 80 (2009) 054009, arXiv: 0906.5273 [hep-ph].
[7] S.-Q. Wang, X.-G. Wu, Z.-G. Si and S. J. Brodsky, Top-quark pair hadroproduction and aprecise determination of the top-quark pole mass using the principle of maximum conformality,(2017), arXiv: 1703.03583 [hep-ph].
[8] R. Franceschini, ‘Wish-list for Run II top quark measurements (for BSM)’, 2016,arXiv: 1601.02684 [hep-ph].
[9] M. Cacciari et al., Top-pair production at hadron colliders with next-to-next-to-leadinglogarithmic soft-gluon resummation, Phys. Lett. B 710 (2012) 612,arXiv: 1111.5869 [hep-ph].
[10] P. Bärnreuther, M. Czakon and A. Mitov, Percent Level Precision Physics at the Tevatron: FirstGenuine NNLO QCD Corrections to qq̄→ tt̄ + X , Phys. Rev. Lett. 109 (2012) 132001,arXiv: 1204.5201 [hep-ph].
[11] M. Czakon and A. Mitov, NNLO corrections to top-pair production at hadron colliders: theall-fermionic scattering channels, JHEP 1212 (2012) 054, arXiv: 1207.0236 [hep-ph].
[12] M. Czakon and A. Mitov,NNLO corrections to top pair production at hadron colliders: the quark-gluon reaction,JHEP 1301 (2013) 080, arXiv: 1210.6832 [hep-ph].
[13] M. Czakon and A. Mitov,Top++: A program for the calculation of the top-pair cross-section at hadron colliders,Comput. Phys. Commun. 185 (2014) 2930, arXiv: 1112.5675 [hep-ph].
23

[14] M. Botje et al., The PDF4LHC Working Group Interim Recommendations, 2011,arXiv: 1101.0538 [hep-ph].
[15] A. D. Martin, W. J. Stirling, R. S. Thorne and G. Watt, Parton distributions for the LHC,Eur. Phys. J. C 63 (2009) 189, arXiv: 0901.0002 [hep-ph].
[16] A. D. Martin, W. J. Stirling, R. S. Thorne and G. Watt, Uncertainties on αS in global PDFanalyses and implications for predicted hadronic cross sections, Eur. Phys. J. C 64 (2009) 653,arXiv: 0905.3531 [hep-ph].
[17] H.-L. Lai et al., New parton distributions for collider physics, Phys. Rev. D 82 (2010) 074024,arXiv: 1007.2241 [hep-ph].
[18] J. Gao et al., CT10 next-to-next-to-leading order global analysis of QCD,Phys. Rev. D 89 (2014) 033009, arXiv: 1302.6246 [hep-ph].
[19] R. D. Ball et al., Parton distributions with LHC data, Nucl. Phys. B 867 (2013) 244,arXiv: 1207.1303 [hep-ph].
[20] C. Muselli et al., Top quark pair production beyond NNLO, JHEP 1508 (2015) 076,arXiv: 1505.02006 [hep-ph].
[21] CDF and D0 Collaborations, T. A. Aaltonen et al., Combination of measurements of thetop-quark pair production cross section from the Tevatron Collider,Phys. Rev. D 89 (2014) 072001, arXiv: 1309.7570 [hep-ex].
[22] ATLAS Collaboration, Measurement of the tt̄ production cross-section using eµ events withb-tagged jets in pp collisions at
√s = 7 and 8 TeV with the ATLAS detector,
Eur. Phys. J. C 74 (2014) 3109, [Addendum: Eur. Phys. J. C 76 (2016) 642],arXiv: 1406.5375 [hep-ex].
[23] ATLAS Collaboration, Measurement of the tt̄ production cross-section using eµ events withb-tagged jets in pp collisions at
√s = 13 TeV with the ATLAS detector,
Phys. Lett. B 761 (2016) 136, arXiv: 1606.02699 [hep-ex].
[24] CMS Collaboration, Measurement of the tt̄ production cross section in the eµ channel inproton–proton collisions at
√s = 7 and 8 TeV, JHEP 08 (2016) 029,
arXiv: 1603.02303 [hep-ex].
[25] CMS Collaboration, Measurement of the tt̄ production cross section using events in the eµ finalstate in pp collisions at
√s = 13 TeV, Eur. Phys. J. C 77 (2017) 172,
arXiv: 1611.04040 [hep-ex].
[26] CMS Collaboration, Measurements of the tt̄ production cross section in lepton+jets final statesin pp collisions at 8 TeV and ratio of 8 to 7 TeV cross sections, Eur. Phys. J. C 77 (2017) 15,arXiv: 1602.09024 [hep-ex].
[27] ATLAS Collaboration, Measurement of the top pair production cross section in 8 TeVproton–proton collisions using kinematic information in the lepton+jets final state with ATLAS,Phys. Rev. D 91 (2015) 112013, arXiv: 1504.04251 [hep-ex].
[28] ATLAS Collaboration, The ATLAS Experiment at the CERN Large Hadron Collider,JINST 3 (2008) S08003.
[29] ATLAS Collaboration, Performance of the ATLAS Trigger System in 2010,Eur. Phys. J. C 72 (2012) 1849, arXiv: 1110.1530 [hep-ex].
24

[30] ATLAS Collaboration, The ATLAS Simulation Infrastructure, Eur. Phys. J. C 70 (2010) 823,arXiv: 1005.4568 [hep-ex].
[31] S. Agostinelli et al., GEANT4: A simulation toolkit, Nucl. Instrum. Meth. A 506 (2003) 250.
[32] T. Sjöstrand et al., An introduction to PYTHIA 8.2, Comput. Phys. Commun. 191 (2015) 159,arXiv: 1410.3012 [hep-ph].
[33] S. Frixione, P. Nason and G. Ridolfi,A Positive-weight next-to-leading-order Monte Carlo for heavy flavour hadroproduction,JHEP 0709 (2007) 126, arXiv: 0707.3088 [hep-ph].
[34] T. Sjostrand, S. Mrenna and P. Z. Skands, PYTHIA 6.4 physics and manual,JHEP 0605 (2006) 026, arXiv: hep-ph/0603175.
[35] P. Z. Skands, Tuning Monte Carlo generators: The Perugia tunes,Phys. Rev. D 82 (2010) 074018, arXiv: 1005.3457 [hep-ph].
[36] G. Corcella et al., HERWIG 6: An Event generator for hadron emission reactions withinterfering gluons (including supersymmetric processes), JHEP 0101 (2001) 010,arXiv: hep-ph/0011363.
[37] S. Frixione and B. R. Webber,Matching NLO QCD computations and parton shower simulations, JHEP 0206 (2002) 029,arXiv: hep-ph/0204244.
[38] S. Frixione, P. Nason and B. R. Webber,Matching NLO QCD and parton showers in heavy flavor production, JHEP 0308 (2003) 007,arXiv: hep-ph/0305252.
[39] J. M. Butterworth, J. R. Forshaw and M. H. Seymour,Multiparton interactions in photoproduction at HERA, Z. Phys. C 72 (1996) 637,arXiv: hep-ph/9601371.
[40] ATLAS Collaboration, New ATLAS event generator tunes to 2010 data,ATL-PHYS-PUB-2011-008, 2011, url: https://cds.cern.ch/record/1345343.
[41] ATLAS Collaboration, Comparison of Monte Carlo generator predictions to ATLASmeasurements of top pair production at 7 TeV, ATL-PHYS-PUB-2015-002, 2015,url: https://cds.cern.ch/record/1981319.
[42] S. Alioli, P. Nason, C. Oleari and E. Re, A general framework for implementing NLOcalculations in shower Monte Carlo programs: the POWHEG BOX, JHEP 1006 (2010) 043,arXiv: 1002.2581 [hep-ph].
[43] S. Alioli, P. Nason, C. Oleari and E. Re,NLO single-top production matched with shower in POWHEG: s- and t-channel contributions,JHEP 0909 (2009) 111, [Erratum: JHEP02,011(2010)], arXiv: 0907.4076 [hep-ph].
[44] E. Re,Single-top Wt-channel production matched with parton showers using the POWHEG method,Eur. Phys. J. C 71 (2011) 1547, arXiv: 1009.2450 [hep-ph].
[45] N. Kidonakis, Two-loop soft anomalous dimensions for single top quark associated productionwith a W− or H−, Phys. Rev. D 82 (2010) 054018, arXiv: 1005.4451 [hep-ph].
25

[46] P. Kant et al., HatHor for single top-quark production: Updated predictions and uncertaintyestimates for single top-quark production in hadronic collisions,Comput. Phys. Commun. 191 (2015) 74, arXiv: 1406.4403 [hep-ph].
[47] J. M. Campbell, R. Frederix, F. Maltoni and F. Tramontano,Next-to-Leading-Order Predictions for t-Channel Single-Top Production at Hadron Colliders,Phys. Rev. Lett. 102 (2009) 182003, arXiv: 0903.0005 [hep-ph].
[48] M. L. Mangano et al.,ALPGEN, a generator for hard multiparton processes in hadronic collisions,JHEP 0307 (2003) 001, arXiv: hep-ph/0206293.
[49] J. Pumplin et al.,New generation of parton distributions with uncertainties from global QCD analysis,JHEP 0207 (2002) 012, arXiv: hep-ph/0201195.
[50] J. Alwall et al., Comparative study of various algorithms for the merging of parton showers andmatrix elements in hadronic collisions, Eur. Phys. J. C 53 (2008) 473,arXiv: 0706.2569 [hep-ph].
[51] R. Gavin, Y. Li, F. Petriello and S. Quackenbush,FEWZ 2.0: A code for hadronic Z production at next-to-next-to-leading order,Comput. Phys. Commun. 182 (2011) 2388, arXiv: 1011.3540 [hep-ph].
[52] R. Gavin, Y. Li, F. Petriello and S. Quackenbush, W Physics at the LHC with FEWZ 2.1,Comput. Phys. Commun. 184 (2013) 208, arXiv: 1201.5896 [hep-ph].
[53] T. Gleisberg et al., Event generation with SHERPA 1.1, JHEP 0902 (2009) 007,arXiv: 0811.4622 [hep-ph].
[54] S. Hoeche, F. Krauss, S. Schumann and F. Siegert,QCD matrix elements and truncated showers, JHEP 0905 (2009) 053,arXiv: 0903.1219 [hep-ph].
[55] J. M. Campbell, R. K. Ellis and C. Williams, Vector boson pair production at the LHC,JHEP 1107 (2011) 018, arXiv: 1105.0020 [hep-ph].
[56] ATLAS Collaboration, Electron efficiency measurements with the ATLAS detector using 2012LHC proton–proton collision data, Eur. Phys. J. C 77 (2017) 195,arXiv: 1612.01456 [hep-ex].
[57] ATLAS Collaboration,Electron and photon energy calibration with the ATLAS detector using LHC Run 1 data,Eur. Phys. J. C 74 (2014) 3071, arXiv: 1407.5063 [hep-ex].
[58] ATLAS Collaboration, Measurement of the muon reconstruction performance of the ATLASdetector using 2011 and 2012 LHC proton–proton collision data,Eur. Phys. J. C 74 (2014) 3130, arXiv: 1407.3935 [hep-ex].
[59] K. Rehermann and B. Tweedie,Efficient identification of boosted semileptonic top quarks at the LHC, JHEP 1103 (2011) 059,arXiv: 1007.2221 [hep-ph].
[60] M. Cacciari, G. P. Salam and G. Soyez, The anti-kt jet clustering algorithm,JHEP 0804 (2008) 063, arXiv: 0802.1189 [hep-ph].
26

[61] ATLAS Collaboration,Topological cell clustering in the ATLAS calorimeters and its performance in LHC Run 1,(2016), arXiv: 1603.02934 [hep-ex].
[62] ATLAS Collaboration, Jet energy measurement and its systematic uncertainty in proton–protoncollisions at
√s = 7 TeV with the ATLAS detector, Eur. Phys. J. C 75 (2015) 17,
arXiv: 1406.0076 [hep-ex].
[63] ATLAS Collaboration, Performance of pile-up mitigation techniques for jets in pp collisions at√s = 8 TeV using the ATLAS detector, Eur. Phys. J. C 76 (2016) 581,
arXiv: 1510.03823 [hep-ex].
[64] ATLAS Collaboration, Performance of b-Jet identification in the ATLAS Experiment,JINST 11 (2016) P04008, arXiv: 1512.01094 [hep-ex].
[65] ATLAS Collaboration, Performance of algorithms that reconstruct missing transversemomentum in
√s = 8 TeV proton–proton collisions in the ATLAS detector,
Eur. Phys. J. C 77 (2017) 241, arXiv: 1609.09324 [hep-ex].
[66] ATLAS Collaboration, Performance of the ATLAS muon trigger in pp collisions at√
s = 8 TeV,Eur. Phys. J. C 75 (2015) 120, arXiv: 1408.3179 [hep-ex].
[67] ATLAS Collaboration,Jet energy measurement with the ATLAS detector in proton–proton collisions at
√s = 7 TeV,
Eur. Phys. J. C 73 (2013) 2304, arXiv: 1112.6426 [hep-ex].
[68] ATLAS Collaboration, Estimation of non-prompt and fake lepton backgrounds in final stateswith top quarks produced in proton–proton collisions at
√s = 8 TeV with the ATLAS Detector,
ATLAS-CONF-2014-058, 2014, url: https://cds.cern.ch/record/1951336.
[69] M. Feindt, A Neural Bayesian Estimator for Conditional Probability Densities, 2004,arXiv: physics/0402093 [physics.data-an].
[70] M. Feindt and U. Kerzel, The NeuroBayes neural network package,Nucl. Instrum. Meth. A 559 (2006) 190.
[71] ATLAS Collaboration, Measurement of the top quark mass in the tt̄ → lepton+jets andtt̄ → dilepton channels using
√s = 7 TeV ATLAS data, Eur. Phys. J. C 75 (2015) 330,
arXiv: 1503.05427 [hep-ex].
[72] CMS Collaboration,Measurement of the top quark mass using proton–proton data at
√s = 7 and 8 TeV,
Phys. Rev. D 93 (2016) 072004, arXiv: 1509.04044 [hep-ex].[73] D0 Collaborations, V. M. Abazov et al.,
Precise measurement of the top quark mass from lepton+jets events at D0,Phys. Rev. Lett. 101 (2008) 182001, arXiv: 0807.2141 [hep-ex].
[74] CDF Collaborations, T. Aaltonen et al., Precision Top-Quark Mass Measurements at CDF,Phys. Rev. Lett. 109 (2012) 152003, arXiv: 1207.6758 [hep-ex].
[75] ATLAS Collaboration, Electron reconstruction and identification efficiency measurements withthe ATLAS detector using the 2011 LHC proton–proton collision data,Eur. Phys. J. C 74 (2014) 2941, arXiv: 1404.2240 [hep-ex].
27

[76] ATLAS Collaboration, Jet energy scale and its systematic uncertainty in proton–protoncollisions at
√s = 7 TeV with ATLAS 2011 data, ATLAS-CONF-2013-004, 2013,
url: https://cds.cern.ch/record/1509552.
[77] ATLAS Collaboration, Data-driven determination of the energy scale and resolution of jetsreconstructed in the ATLAS calorimeters using dijet and multijet events at
√s = 8 TeV,
ATLAS-CONF-2015-017, 2015, url: https://cds.cern.ch/record/2008678.
[78] ATLAS Collaboration, Determination of the jet energy scale and resolution at ATLAS usingZ/γ-jet events in data at
√s = 8 TeV, ATLAS-CONF-2015-057, 2015,
url: https://cds.cern.ch/record/2059846.
[79] ATLAS Collaboration,Calibration of the performance of b-tagging for c and light-flavour jets in the 2012 ATLAS data,ATLAS-CONF-2014-046, 2014, url: https://cds.cern.ch/record/1741020.
[80] ATLAS Collaboration, Calibration of b-tagging using dileptonic top pair events in acombinatorial likelihood approach with the ATLAS experiment, ATLAS-CONF-2014-004,2014, url: https://cds.cern.ch/record/1664335.
[81] J. Butterworth et al., PDF4LHC recommendations for LHC Run II, 2015,arXiv: 1510.03865 [hep-ph].
[82] ATLAS Collaboration,Luminosity determination in pp collisions at
√s = 8 TeV using the ATLAS detector at the LHC,
Eur. Phys. J. C 76 (2016) 653, arXiv: 1608.03953 [hep-ex].
[83] J. Wenninger and E. Todesco, Large Hadron Collider momentum calibration and accuracy,2017, url: https://cds.cern.ch/record/2254678.
28