tsx equity compensation trends - shareworks · solium capital inc. and lane caputo compensation...
TRANSCRIPT

March 2017 | $995.00
TSX Equity Compensation TrendsAn Equilar Publication March 2017
Featuring Commentary from Solium Capital Inc. and Lane Caputo Compensation

TSX Equity Compensation Trends
2
Data.Equilar is the #1 provider of board intelligence solutions, collecting information on more than 150,000 executives and board members from thousands of public companies.
Decisions.Our cloud-based platforms organize board intelligence data into easily digestible formats, delivering executive compensation benchmarking, board recruiting and shareholder engagement tools with accuracy and integrity to inform better business decisions.
Results.
Our intelligence solutions bring together companies, shareholders, and third-party advisors and service providers to drive exceptional results.
Find out why institutional investors with more than $13 trillion in assets, more than 60% of the Fortune 500, and the world’s top media outlets such as The New York Times, Bloomberg, Forbes, Associated Press, CNN Money, CNBC and The Wall Street Journal trust Equilar.
Learn more at: www.equilar.com
Education Forums Learn from the experts.
Knowledge Center Stay updated on today’s governance topics.
Equilar Market Peers No art. Just science.
EquilarTrueView Benchmark with the best.
Equilar Pay for Performance Win your Say on Pay vote.
Equilar BoardEdge Build a high-performing board.
Custom Research Custom data. On demand.

CONTENTSExecutive Summary 4Methodology 5
Key Findings 5
Equity Grant Practices 6TSX Equity Compensation Mix 7
S&P 500 Equity Compensation Mix 7
Average Grants by Companies Granting Stock and Options 9
Stock Granted 10
Median Stock Granted, 2015 by Sector 11
Options Granted 12
Median Options Granted, 2015 by Sector 13
Performance Equity 15Performance Equity vs. Options to Named Executive Officers 16
Performance Equity, by Sector 17
LTIP Performance Metrics, 2015 19
Dilution 21Total Dilution Overhang 22
Run Rates 24
About the Contributors 25Solium Capital Inc. 25
Lane Caputo Compensation Inc. 26
Appendix A 27Stock Outstanding 28
Options Outstanding 29
Appendix B 30Options Dilution Overhang 31
Stock Dilution Overhang 32
TSX Equity Compensation Trends | Table of Contents
3

Executive SummaryThere are notable differences in how Canadian companies use equity as a means of compensation for executives and employees when compared to public companies in the U.S. Most notably, TSX Composite companies rely more heavily on options grants and less on restricted stock awards or units (restricted stock) and performance equity than S&P 500 companies. Varying grant practices are due to a confluence of factors, including but not limited to differences in tax treatment and the size and maturity of companies within the two indices.
Despite the divergence in grant practices, Canadian companies are subject to many of the same pressures as U.S. companies, perhaps most notably the influence of proxy advisory firms that emphasize performance-based equity (and do not consider time-vesting stock options as performance-based) and oppose the dilutive effects of large, long-term stock option grants. The growing influence of proxy advisors coincides with a sizable increase in the prevalence of performance-based equity, usually in the form of performance shares or units, at TSX companies over the past five years.
It is worth noting that the TSX Composite index is largely composed of basic materials companies, making up more than 40% of the index, while the S&P 500 is more diversified. As such, grant practices between the two indices also likely differ due to sector-specific considerations.
TSX Equity Compensation Trends examines equity compensation design and granting practices at TSX Composite companies over the last five fiscal years, and provides side-by-side comparisons with the S&P 500. Overall, TSX companies are increasingly including restricted stock grants and performance-based equity in their executive compensation programs. In context with increasing performance grants to executives, the most common long-term incentive award metrics were relative total shareholder return (TSR), earnings per share and return on capital in both indices.
Equity compensation achieves many objectives, including employee recruitment and retention, as well as pay for performance and alignment with shareholder interests. Despite persisting differences in grant practices between TSX Composite and S&P 500 companies, many of the same trends are evident in both indices. As more companies introduce performance-based equity compensation, boards must decide both how best to structure these programs and which performance metrics are appropriate.
Editor-in-Chief Dan Marcec
Managing Editor Matthew Goforth
Contributing Authors Colin Briskman Beini Chen Amy Jiang
Design & Layout Mike White Elizabeth Vellutini
©2017 Equilar, Inc. The material in this report may not be reproduced or distributed in whole or in part without the written consent of Equilar, Inc. This report provides information of general interest in an abridged manner and is not intended as a substitute for accounting, tax, investment, legal or other professional advice or services. Readers should consult with the appropriate professional(s) before acting on information contained in this report. All data and analysis provided in this report are owned by Equilar, Inc.
Reports are complimentary for Equilar subscribers. Non-subscribers may purchase individual reports for $995.
For more information, please contact us at [email protected]
Equilar provides up-to-date data and analysis on executive compensation and corporate governance issues to help executives and boards align with their shareholders. Visit the Equilar Knowledge Center to learn more about annual research reports, webinars, daily blog updates, newsletters, C-Suite magazine and more.
equilar.com/knowledge-center
TSX Equity Compensation Trends | Executive Summary
4

Methodology Key Findings
1. TSX Composite companies are increasingly utilizing restricted stock awards or units (restricted stock) as part of their compensation programs, with 67.4% of companies granting shares in fiscal 2015 vs. 50.0% in 2011—meanwhile, the prevalence of S&P 500 companies granting restricted stock has remained above 95% for the past five years.
2. The prevalence of TSX companies granting options has decreased slightly from 79.9% in 2011 to 75.0% in 2015. Over the same period, usage of options declined from 80.4% of S&P 500 companies in 2011 to 64.4% in 2015.
3. Basic materials companies granted the most options and stock of all TSX Composite sectors, with medians of 976,876 and 533,850, respectively.
4. Performance-based equity became more prevalent at TSX Composite companies over the last five years, rising from 26.1% of companies in fiscal 2011 to 42.9% in 2015—this remained substantially below the prevalence at S&P 500 companies, of which 83.1% awarded performance equity in 2015.
5. Relative TSR and return on capital were the only performance metrics used by more than one in 10 TSX Composite companies.
6. Dilution overhang was 2.7% in 2015 for TSX Composite companies at the median—similar to 2.9% for S&P 500 companies—though dilution overhang fell more sharply across the study period for the S&P 500.
TSX Equity Compensation Trends, an Equilar publication, examines equity compensation design and granting practices of TSX Composite companies over the last five fiscal years, and provides side-by-side comparisons with S&P 500 data. Fiscal years are defined by proxy filings dates between July 1 and June 30, and companies are included if they provided compensation data in management information circulars (MIC) or proxy filings (DEF 14A) for the past five years. As a result, 184 TSX Composite companies and 481 S&P 500 companies were included in the study, with sector breakdowns as follows:
The “Equity Grant Practices” and “Dilution” sections include company-wide equity grants, while the “Performance Equity” section references equity grants to named executive officers (NEOs). The term “stock” used throughout the report comprises all full-value shares, including restricted stock and restricted stock units. “Options” comprise stock options and stock-appreciation rights (SARs). Performance equity comprises any equity compensation vehicle linked to the achievement of a performance metric. Return on capital (ROC) represents the aggregation of return on capital, return on invested capital, return on capital employed, return on investment and return on equity performance metrics.
The narrative portion of this report identifies trends in how companies award and design equity compensation to their management teams and employees. Solium Capital Inc. and Lane Caputo Compensation have offered independent commentary to provide color and context to how companies structure equity pay and the primary drivers behind equity-compensation design.
*TSX Composite and S&P 500 conglomerates and the TSX healthcare sectors are excluded from sector comparisons due to small sample size.
TSX Composite Sample Size: 184 companiesBasic Materials 80
Conglomerates* 0
Consumer Goods 14
Financial 33
Healthcare* 4
Industrial Goods 10
Services 25
Technology 12
Utilities 6
S&P 500 Sample Size: 481 companiesBasic Materials 49
Conglomerates* 5
Consumer Goods 57
Financial 82
Healthcare 46
Industrial Goods 42
Services 101
Technology 67
Utilities 31
TSX Equity Compensation Trends | Methodology
5

Equity Grant PracticesTSX Equity Compensation Trends

Equity Compensation Mix
Restricted stock award or unit (restricted stock) grants are
becoming more common among Toronto Stock Exchange (TSX) Composite companies, evidenced by two trends in equity compensation practices. First, the percentage of companies offering exclusively restricted stock or restricted stock units (RSUs) to their employees increased from 9.8% in 2011 to 16.3% in fiscal year 2015, the most recent year of complete data available. (Most Canadian companies were in the process of filing their 2016 compensation data as this report was released in March 2017.) Second, a majority of TSX companies now offers a mix of restricted stock and options packages, with the percentage of companies doing so growing from 40.2% in fiscal year 2011 to 51.1% in 2015.
These trends were concurrent with the percentage of companies offering options exclusively falling from 39.7% in 2011 to 23.9% in 2015 as those firms shift to more balanced equity granting practices. While TSX companies have not experienced a shift away from options to the same degree as S&P 500 companies, among which only 1.5% granted solely options in 2015, companies in both indices have shown a propensity to grant a mix of equity vehicles.
Figure 1a TSX Composite Equity Compensation Mix
Figure 1b S&P 500 Equity Compensation Mix
Data Points
► Stock options grants decreased slightly for the TSX over the past five years—from 79.9% of companies to 75.0%—while the prevalence of companies granting restricted stock overall increased from 50.0% to 67.4% over the same period (Fig. 1a)
► 97.6% of S&P 500 companies offered restricted stock, vs. 64.4% offering options in fiscal 2015 (Fig. 1b)
► The percentage of TSX companies granting no equity declined slightly over the study period, decreasing 1.6 percentage points from 10.3% in 2011 to 8.7% in 2015—meanwhile, just 0.8% of S&P 500 companies offered no equity (Figs. 1a and 1b)
► The prevalence of TSX companies granting a mix of both restricted stock and options increased to 51.1% in 2015, compared to 62.9% in the S&P 500— despite the trend upward in the TSX but downward in the S&P 500 (Figs. 1a and 1b)
0
20
40
60
80
100
20152014201320122011
39.7%
9.8%
33.7% 29.3% 24.5%23.9%
7.6% 12.0% 13.0% 16.3%
40.2%48.4% 51.1% 54.3% 51.1%
10.3% 10.3% 7.6% 8.2% 8.7%
Stock Only Both NeitherOptions Only
Perc
enta
ge
0
20
40
60
80
100
20152014201320122011
Stock Only Both NeitherOptions Only
0.6%
3.9%2.9%
19.1%
76.4%
1.0%
23.0%
73.1%
2.1%
0.8%
25.5%
71.6%
1.9%
1.0%
32.0%
65.0%
1.5%
0.8%
34.7%
62.9%
TSX Equity Compensation Trends | Equity Grant Practices
7

Solium Commentary
Canadian issuers compete for global capital and as such, are subject to the same forces as global peers. The most dominant force in the move towards restricted stock relates to the growing influence of Corporate Governance Advisory Service Providers, such as Glass Lewis and Institutional Shareholder Services, in areas that relate to management Say on Pay, pay for performance and corporate votes on compensation. As governance policies for proxy voting among these service providers continue to advocate moves away from stock options, issuers face an uphill battle maintaining or growing option programs for fear of a negative vote recommendation.
A second (albeit lesser) consideration for TSX companies relates to tax uncertainty created by the Liberal government in 2016, which threatened to remove the long-standing favorable tax treatment in Canada from stock option awards. Any move by tax authorities in this direction would likely accelerate the use of restricted stock. As a result of these forces, we have seen and will likely continue to see pressure on TSX companies to use compensation programs awarding restricted shares, particularly those using performance criteria.
Lane Caputo Compensation Commentary
The shift away from stock options and to full value equity-based incentives such as restricted share units (RSUs) and performance share units (PSUs), and to a lesser extent, deferred share units (DSUs) and restricted stock, is driven by two overarching factors:
1. Pressure from institutional investor and proxy advisory firms to reduce shareholder dilution due to equity-based incentives. The grant date value of RSUs and PSUs is generally greater than that for stock options, requiring smaller awards to plan participants. Proxy advisory firms are also pushing for more performance-linked incentives and, despite their inherent linkage to share price performance, these firms do not consider stock options to be performance-linked unless performance restrictions are attached to their vesting.
2. The cyclical nature of resource-based sectors (more than 40% of the TSX Composite Index comprises companies operating in the energy or mining sectors) often results in stock options remaining underwater for the majority of their terms, all but eliminating the retention and incentive elements of these vehicles for plan participants. Companies in these sectors are shifting to vehicles that will deliver some form of value to plan participants.
TSX Equity Compensation Trends | Equity Grant Practices
8

While the S&P 500 saw a decrease in the average number of stock and options granted as the stock market recovered over the last five years, the average number of restricted stock and options granted at TSX companies generally increased over the same period. Among TSX companies that granted each equity type, the average amount of restricted stock granted was 1.1 million shares in 2015, and the average number of options granted was just under 2.0 million. Those average grants represented an increase from 793,126 and 1.7 million in 2011, respectively.
Data Points
► Both the average restricted stock and options granted in the TSX experienced a slight dip from 2013 to 2014, but increased again in 2015 (Fig. 2a)
► S&P 500 companies that granted each vehicle awarded fewer options than stock each year with an average discrepancy of about 480,000 shares over the past five years. TSX companies granted significantly more options than stock, with an average discrepancy of about 860,000 shares over the past five years (Figs. 2a and 2b)
Figure 2a TSX Composite Average Grants by Companies Granting Stock and Options
Figure 2b S&P 500 Average Grants by Companies Granting Stock and Options
0
0.5
1.0
1.5
2.0
2.5
20152014201320122011
1.7
0.81.0
2.0
1.1
1.8
1.0
1.8
1.1
2.0
38.5%
Stock Options
0
1.0
2.0
3.0
4.0
5.0
20152014201320122011
3.7 3.6
4.1
4.6
$2.03.7
3.4 3.43.2 3.2
2.7
Stock Options
TSX Equity Compensation Trends | Equity Grant Practices
9
Restricted Stock Grants
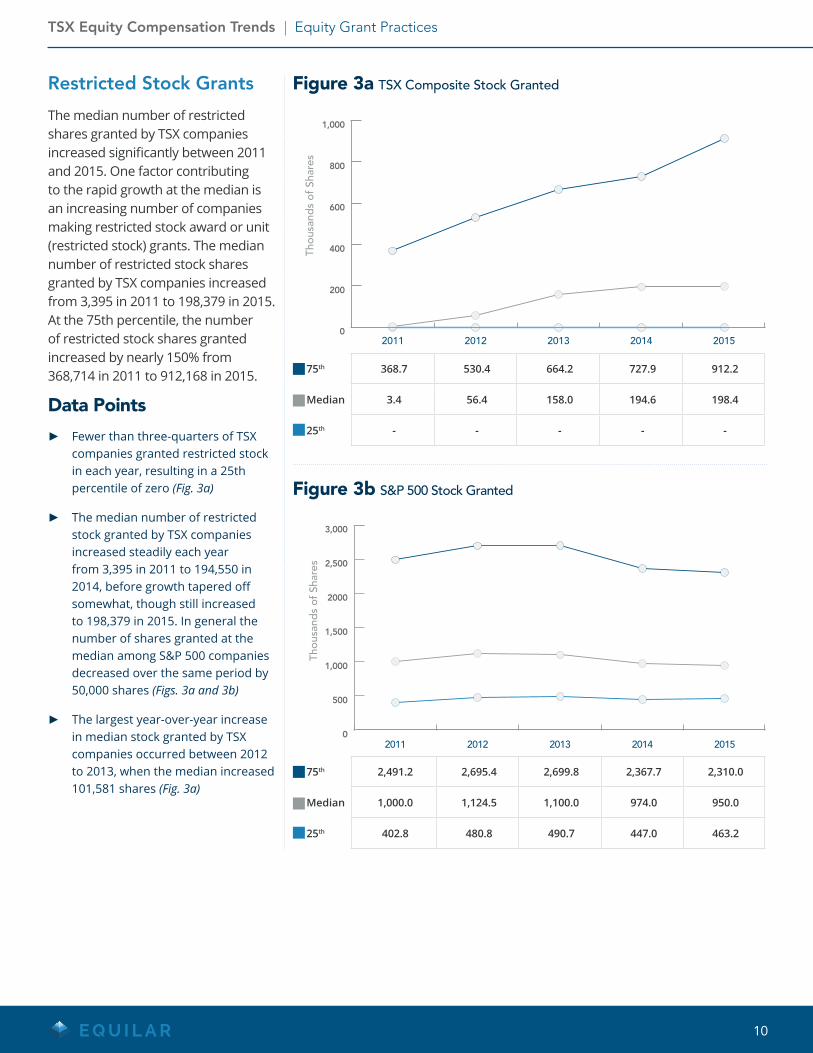
The median number of restricted shares granted by TSX companies increased significantly between 2011 and 2015. One factor contributing to the rapid growth at the median is an increasing number of companies making restricted stock award or unit (restricted stock) grants. The median number of restricted stock shares granted by TSX companies increased from 3,395 in 2011 to 198,379 in 2015. At the 75th percentile, the number of restricted stock shares granted increased by nearly 150% from 368,714 in 2011 to 912,168 in 2015.
Data Points
► Fewer than three-quarters of TSX companies granted restricted stock in each year, resulting in a 25th percentile of zero (Fig. 3a)
► The median number of restricted stock granted by TSX companies increased steadily each year from 3,395 in 2011 to 194,550 in 2014, before growth tapered off somewhat, though still increased to 198,379 in 2015. In general the number of shares granted at the median among S&P 500 companies decreased over the same period by 50,000 shares (Figs. 3a and 3b)
► The largest year-over-year increase in median stock granted by TSX companies occurred between 2012 to 2013, when the median increased 101,581 shares (Fig. 3a)
Figure 3a TSX Composite Stock Granted
Figure 3b S&P 500 Stock Granted
0
200
400
600
800
1,000
20152014201320122011
25th Percentile 50th Percentile 75th Percentile
0
500
1,000
1,500
2000
2,500
3,000
20152014201320122011
Thou
sand
s of
Sha
res
25th Percentile Median 75th Percentile
TSX Equity Compensation Trends | Equity Grant Practices
10
75th 368.7 530.4 664.2 727.9 912.2
Median 3.4 56.4 158.0 194.6 198.4
25th - - - - -
75th 2,491.2 2,695.4 2,699.8 2,367.7 2,310.0
Median 1,000.0 1,124.5 1,100.0 974.0 950.0
25th 402.8 480.8 490.7 447.0 463.2

Similar to their counterparts in the S&P 500, TSX companies in the financial sector appeared to rely less heavily on equity than companies in other sectors. Breaking the parallels between the two indices, basic materials companies in the S&P 500 granted fewer shares of restricted stock at the median relative to most sectors. This represents a substantial deviation from the TSX basic materials sector, where companies granted the most equity of any sector. Also of note, 43.4% of TSX Composite companies in the study are in the basic materials sector, suggesting the Canadian basic materials market is particularly concentrated and competitive.
Data Points
► TSX basic materials companies granted more than twice as many shares of restricted stock at the median compared to other sectors, granting 533,850 shares in fiscal 2015 (Fig. 4a)
► TSX consumer goods companies granted the second highest number of restricted stock at the median—252,080 shares—followed by the technology and utilities sectors with medians of approximately 200,000 shares (Fig. 4a)
► S&P 500 technology companies were outliers in granting far more restricted stock than their counterparts, whereas the TSX tech sector was closer to the sector median (Figs. 4a and 4b)
Figure 4b S&P 500 Median Stock Granted, 2015 by Sector
Lane Caputo Compensation Commentary
Basic materials companies have traditionally provided equity-based incentives to all employees in the organization, often causing dilution issues in times of economic uncertainty as underwater options remain outstanding while unexercised. To ease some of that pressure, many companies are shifting their long-term incentive mix to include less-dilutive instruments such as RSUs. Given that the majority of the basic materials sector participants are located in one or two areas of the country, the pressure to offer market-competitive equity-based incentives is amplified in order to retain key personnel.
0
100
200
300
400
500
600
UtilitiesTechnologyServicesIndustrialGoods
FinancialConsumerGoods
BasicMaterials
Thou
sand
s of
Sha
res 533.9
252.1
67.428.0
140.6
200.9 199.5
0
500
1,000
1,500
2,000
2,500
3,000
HealthcareUtilitiesTechnologyServicesIndustrialGoods
FinancialConsumerGoods
BasicMaterials
Thou
sand
s of
Sha
res
1,129.0
866.0958.0 913.6
578.7
889.2
2,801.6
656.4
TSX Equity Compensation Trends | Equity Grant Practices
11
Figure 4a TSX Composite Median Stock Granted, 2015 by Sector
Solium Commentary
All issuers regardless of sector are susceptible to the competitive pressures in the labor market, and as talent and the search for talent becomes more global, employers are constantly looking for ways to outdo peers (or at the very least keep up).

Stock Options Grants
The median number of options granted by TSX companies increased from 2011 to 2012, and has generally decreased since 2012. Over the same period, S&P 500 companies granted fewer options each year, declining by more than 55% at the median from 2011 to 2015. The median annual options granted at TSX companies dropped from 873,150 in 2012 to 621,620 in 2014. Although the number of options granted at the TSX 25th and 75th percentiles continued to decline in 2015, the median option grant increased slightly to 677,902. The largest option grants at the 25th percentile, median and 75th percentile all occurred in 2012.
Data Points
► The lowest median options granted in the TSX occurred in 2014, while lows at the 25th and 75th percentiles occurred in 2015 (Fig. 5a)
► The median number of options granted in the TSX fell 22.4% between 2012 and 2015 (Fig. 5a)
► More than one quarter of companies in the S&P 500 did not grant any options from 2013 to 2015, while in the TSX, at least a quarter of companies granted options over the entire study period (Figs. 5a and 5b)
Figure 5a TSX Composite Options Granted
Figure 5b S&P 500 Options Granted
75th 1,762.2 2,107.7 1,886.9 1,712.9 1,627.7
Median 645.4 873.2 725.1 621.6 677.9
25th 162.9 217.3 206.9 113.0 39.8
75th 2,999.6 2,575.0 2,170.6 1,782.9 1,574.7
Median 1,018.5 868.5 734.9 520.0 456.1
25th 98.4 12.8 0.0 0.0 0.0
0
500
1,000
1,500
2,000
2,500
20152014201320122011
Thou
sand
s of
Sha
res
0
500
1,000
1,500
2,000
2,500
3,000
20152014201320122011
Thou
sand
s of
Sha
res
TSX Equity Compensation Trends | Equity Grant Practices
12

In addition to granting the highest number of restricted stock awards or units (restricted stock) at the median, the TSX basic materials sector also granted the highest median number of options—over 30% more than the services sector. That considered, other sectors lagged basic materials by a smaller margin with regards to options than with restricted stock. In 2015, TSX services companies granted 742,600 options and financial companies granted 641,875 options at the median. These same sectors lagged behind all others, excepting industrial goods, in median restricted stock granted, suggesting these companies rely more heavily on options. The majority of TSX industrial goods companies did not grant options in 2015. Given that these same companies granted the fewest shares of restricted stock at the median, the industrial goods sector appears to leverage equity compensation to a lesser degree than other sectors.
Figure 6a TSX Composite Median Options Granted, 2015 by Sector
Figure 6b S&P 500 Median Options Granted, 2015 by Sector
Data Points
► The TSX basic materials sector granted the highest number of options at the median, totaling 976,876 in fiscal 2015, contrasting with the S&P 500 where healthcare companies outpaced all other sectors (Fig. 6a and 6b)
► Fewer than half of TSX industrial goods companies granted options in 2015, resulting in a median of zero (Fig. 6a)
► TSX basic materials, services, financial and technology companies each granted more than 500,000 options at the median in 2015 (Fig. 6a)
► S&P 500 financial and technology companies granted fewer options relative both to other sectors within the index and to financial and technology companies within the TSX Composite (Figs. 6a and 6b)
0
200
400
600
800
1,000
UtilitiesTechnologyServicesIndustrialGoods
FinancialConsumerGoods
BasicMaterials
Thou
sand
s of
Sha
res
0.0
976.9
499.3
641.9
742.6
536.0
290.9
0
300
600
900
1,200
1,500
HealthcareUtilitiesTechnologyServicesIndustrialGoods
FinancialConsumerGoods
BasicMaterials
Thou
sand
s of
Sha
res
0.0
700.0704.0
1,383.0
98.3
802.9
2.3
521.0
TSX Equity Compensation Trends | Equity Grant Practices
13

Solium Commentary
We believe there are several reasons companies may prefer options, namely:
► The tax treatment for stock option benefits in Canada is only 50% of the tax obligation of restricted shares, creating a significant tax advantage to employees
► Option awards are typically granted at a ratio of up to 4-to-1 relative to restricted stock awards, which gives the perception of better value to employees who do not have a thorough understanding of equity
► Competitive forces in some sectors, particularly in technology startups or bio-technology, compels companies to be more engaged in option granting in order to compete for talent against global peers
► Smaller organizations face inertia due to cost and lack of expertise when it comes to changes in plan design and will often take a “if it’s not broken, don’t fix it” approach to changes—the majority of companies on the TSX are significantly smaller in size and scale than their S&P peers
Lane Caputo Compensation Commentary
Some companies are bucking the trend and sticking with stock option awards for several reasons:
► Stock options still provide the greatest shareholder alignment for junior companies where most investors are looking for significant share price appreciation along with the associated risks
► RSU awards that contain the ability to be settled in cash are essentially limited to a term of three years in Canada, creating more of a medium-term incentive, rather than the long-term focus of stock options which typically have terms of five years but have historically had terms of up to ten years
► Some plan participants prefer the additional leverage of stock options (RSU and PSU awards are often fractions of what an equivalent stock option award would be—typically one RSU or PSU is equal to three or four stock options) and would accept the additional risk if it is associated with additional reward
TSX Equity Compensation Trends | Equity Grant Practices
14

TSX Equity Compensation Trends
Performance Equity

As corporate governance stakeholders call for better
pay for performance alignment, performance equity awards—where amounts earned are dependent on achievement of predefined goals—have become increasingly popular. The percentage of TSX companies granting performance equity increased every year during the study period, from 23.8% in fiscal 2011 to 39.1% in 2015.
Concurrently, the prevalence of time-vesting option awards has waned, decreasing slightly from 79.9% in 2011 to 75.0% in 2015 among TSX companies. Meanwhile, 83.1% of S&P 500 companies granted performance equity to their named executive officers (NEOs) in 2015, while options usage decreased from 80.4% of companies to 64.4%.
20
40
60
80
100
20152014201320122011
Perc
enta
ge
42.9%
82.1%79.9% 80.4% 78.8%75.0%
39.1%
33.2%29.3%
26.1%
Performace Equity Options
50
55
60
65
70
75
80
85
90
95
100
20152014201320122011
Perc
enta
ge 83.1%
79.9%77.2%76.0%
80.4%
73.7%
66.9%64.4%
71.2%
65.4%
Performace Equity Options
Figure 7a TSX Composite Performance Equity vs. Options to Named Executive Officers
Figure 7b S&P 500 Performance Equity vs. Options to Named Executive Officers
Lane Caputo Compensation Commentary
The growth in performance equity is a natural evolution of the shift to a greater prevalence of RSUs and PSUs within TSX companies. While most investors and proxy advisors do not consider stock options to be ‘performance pay’, stock options are inherently performance-oriented in that, unless the underlying share price increases, stock options are worthless.
Since the Great Recession, and over the past several years in the basic materials sector, many stock option awards have expired underwater, and shareholders have therefore not incurred dilution through the exercise of these stock options. RSUs, unless performance-vested, cannot expire underwater and will always have some value. Without performance restrictions, RSUs will dilute shareholders and will provide some value to executives and employees, regardless of the shareholder experience. As RSUs will always carry some inherent value, institutional investors and proxy advisors are pushing for performance restrictions to ensure that minimum levels of performance are achieved prior to these vehicles vesting to executives.
Despite investor pressure for performance equity there is little correlation between equity plan design and Say on Pay voting. There is a curiously high incidence of Say on Pay proposals receiving resounding support at Annual General Meetings while performance equity plan proposals are rejected at the very same meeting. Proxy advisory firms tend to look at these two items in isolation and often provide conflicting voting recommendations even though the topics are inextricably linked.
TSX Equity Compensation Trends | Performance Equity
16

The prevalence of performance equity grants to NEOs generally increased in the TSX over the past five years, though not all sectors saw the same magnitude of growth. Companies in the TSX basic materials sector increased their reliance on performance equity, growing from 25.0% in 2011 to 42.5% in 2015. The technology sector stood alone as the prevalence of performance equity dipped from 58.3% in 2014 to 50.0% in 2015.
Data Points
► The prevalence of performance equity grants increased for TSX financial companies more than any other sector between 2014 and 2015, rising 12.1 percentage points from 24.2% of companies in 2014 to 36.4% in 2015 (Fig. 8a)
► While the industrial goods sector had the lowest percentage of companies granting performance equity among the TSX in fiscal 2015—at 30.0%—the percentage of companies that granted performance equity in the S&P 500 was lowest in the tech sector, at 79.1% (Figs. 8a and 8b)
Figure 8a TSX Composite Performance Equity, by Sector
Figure 8b S&P 500 Performance Equity, by Sector
2011 25.0% 35.7% 21.2% 20.0% 24.0% 25.0% 50.0%
2012 27.5% 28.6% 24.2% 20.0% 28.0% 41.7% 66.7%
2013 30.0% 42.9% 27.3% 20.0% 28.0% 58.3% 66.7%
2014 38.8% 42.9% 24.2% 20.0% 40.0% 58.3% 83.3%
2015 42.5% 42.9% 36.4% 30.0% 40.0% 50.0% 83.3%
2011 54.9% 78.7% 49.9% 64.3% 68.3% 64.2% 87.1% 69.6%
2012 65.0% 76.9% 64.5% 69.1% 71.3% 68.7% 93.6% 73.9%
2013 73.2% 78.7% 75.4% 73.8% 78.2% 71.6% 93.6% 82.6%
2014 81.3% 80.4% 75.4% 76.2% 80.2% 76.1% 93.6% 87.0%
2015 83.3% 80.4% 82.7% 85.7% 83.2% 79.1% 90.3% 84.8%
0
20
40
60
80
100
UtilitiesTechnologyServicesIndustrialGoods
FinancialConsumerGoods
BasicMaterials
2011 2013 2014 20152012
0
20
40
60
80
100
HealthcareUtilitiesTechnologyServicesIndustrialGoods
FinancialConsumerGoods
BasicMaterials
2011 2013 2014 20152012
TSX Equity Compensation Trends | Equity Grant Practices
17

Lane Caputo Compensation Commentary
Smaller companies in select sectors (high-tech, junior mining, junior oil & gas) tend not to have a lot of performance equity plans for two main reasons:
► Lack of significant institutional investor ownership and hence less pressure from these investors and their proxy advisors to adopt performance equity plans; and
► The investors in early-stage, high risk/high growth companies are above all else, interested in the capital appreciation of their investment. Executives in these high growth companies are most closely aligned with the fortunes of shareholders through participation in stock option plans, rather than RSUs.
TSX Equity Compensation Trends | Equity Grant Practices
18

The performance metrics used by companies in determining executive long-term incentive award payouts can shed some light on which market, financial and strategic indicators boards consider important to long-term company health and which indicators boards believe may be influenced, directly or indirectly, by executives’ actions. In line with S&P 500 companies, TSX Composite companies most commonly utilized relative total shareholder return (TSR) by a significant margin over any other metric. More than three times as many TSX companies used relative TSR than the next metric in fiscal 2015, at 37.5% versus 11.9% of companies for return on capital (ROC).
Data Points
► Relative TSR and ROC were the only metrics employed by more than 10% of TSX companies in 2015, at 37.5% and 11.9%, respectively. More than 5% of companies linked long-term incentives to EPS, absolute TSR and other non-financial metrics (Fig. 9a)
► Relative TSR was the most popular metric within every sector in the TSX except for consumer goods, where only one of 14 companies leveraged it
► The TSX Composite showed a strong preference for relative TSR (37.5% of companies) over other metrics, with ROC being the next most popular metric at only 11.9%. The S&P 500 data revealed a more even distribution of performance metrics, with relative TSR used by 45.6% of companies and EPS at 23.6%, only slightly higher than ROC at 22.8% (Figs. 9a and 9b)
Figure 9a TSX Composite LTIP Performance Metrics, 2015
Figure 9b S&P 500 LTIP Performance Metrics, 2015
Index Performance Metric Prevalence
TSX Composite Relative TSR 37.5%
ROC 11.9%
EPS 9.2%
Other Non-Financial 5.4%
Absolute TSR 5.4%
Cash Flow 4.9%
Cost/Cost Ratio 4.9%
Revenue 4.3%
EBITDA 4.3%
Index Performance Metric Prevalence
S&P 500 Relative TSR 45.6%
EPS 23.6%
ROC 22.8%
Revenue 18.0%
Operating Income / Margin 14.4%
Cash Flow 9.6%
EBITDA 6.4%
Net Income 5.6%
Absolute TSR 5.2%
TSX Equity Compensation Trends | Equity Grant Practices
19

Solium Commentary
A key reason for the lower frequency of total shareholder return (TSR) as a performance metric is likely related to the maturity of performance share plans in Canada relative to the U.S., where award programs are more mature in terms of how long the plans have been in existence. The fact there are no other strong alternatives to TSR in the TSX data lends further credibility to this belief. As a result, Canadian issuers may not yet have decided on the “right” metric, but with TSR being easily calculated and used most broadly by S&P peers, it becomes a practical measure to use. We suspect that its usage will likely grow as the usage of performance plans continues to grow, but as plans mature we could see new or alternative measures being used.
One other possibility is that TSX issuers have not seen exactly the same level of scrutiny on equity practices as issuers on other exchanges and therefore have had slightly greater flexibility in terms of defining performance measures that are relevant to that issuer. We have seen performance metrics relating towards Operating “Netback” or Reserves by issuers in the oil & gas sector for example, which although not absolutely aligned to TSR, is positively correlated to return shareholders.
Lane Caputo Compensation Commentary
Institutional investors and proxy advisor firms advocate for the use of performance metrics relative to a peer group of companies or an index. Companies find it difficult to select operational or financial measures for relative comparison purposes given the different business strategies of peer companies. Additionally, the limited diversification of the TSX makes it difficult to find many direct comparables for this purpose. Relative TSR is the fallback option for most companies as it is a more standardized approach and ultimately, companies are measured by their shareholders predominantly on TSR performance.
As mentioned earlier, the materials sectors comprise nearly half of the TSX Composite Index. These companies have very little control over the price they receive for the underlying commodity (witness the current oil price crash), making the use financial metrics also very tricky. While milestone measures can be very effective in motivating performance to organizational objectives, payouts can be very hard to justify if performance is achieved in times of poor TSR performance.
TSX Equity Compensation Trends | Equity Grant Practices
20

TSX Equity Compensation Trends
Dilution

Dilution overhang is a key metric used to measure the potential diminution in value of the common shares owned by company shareholders due to share-based compensation of company employees. Shareholders are typically willing to divide ownership of the company into more slices, understanding equity pay is an effective tool to grow the overall size of the pie. Still, shareholders want their portfolio companies to keep dilution within reasonable bounds and may vote their shares against new equity incentive plans if those conditions are not met. Dilution overhang is calculated by taking stock and options, granted as compensation, outstanding as a percentage of the total common share pool. In the TSX Composite, median dilution overhang decreased 0.4 percentage points over the past five years, from 3.1% to 2.7%. Meanwhile, the dilution overhang at the median among S&P 500 companies decreased 2.3 percentage points over the same period to 2.9% in fiscal 2015, down from 5.2%.
Data Points
► Median total dilution overhang decreased slightly over each of the past five years with the exception of a marginal increase from fiscal 2013 to 2014 among TSX companies (Fig. 10a)
► At the 75th percentile, total dilution overhang in the TSX Composite peaked in 2013 at 5.2% (Fig. 10a)
► The largest year-over-year decrease in median dilution overhang among TSX companies was 0.2 percentage points from 2011 to 2012 and again from 2012 to 2013 (Fig. 10a)
1
0
3
4
5
6
20152014201320122011
0
2
3
4
5
6
7
8
20152014201320122011
Figure 10a TSX Composite Total Dilution Overhang
Figure 10b S&P 500 Total Dilution Overhang
75th 4.8% 4.8% 5.2% 4.7% 4.6%
Median 3.1% 2.9% 2.7% 2.8% 2.7%
25th 1.6% 1.6% 1.6% 1.5% 1.4%
75th 7.4% 6.5% 5.6% 4.9% 4.5%
Median 5.2% 4.5% 4.0% 3.3% 2.9%
25th 2.8% 2.4% 2.0% 1.7% 1.6%
TSX Equity Compensation Trends | Equity Grant Practices
22

TSX Equity Compensation Trends | Equity Grant Practices
23
Solium Commentary
One of the prime reasons for lower overhang is likely due to the rise of smaller equity pools being authorized by compensation committees due to broader concerns about dilution or as a result of advisory service recommendations. As issuance from treasury to fund stock-based compensation plans continues to face challenges, and companies are looking at creative alternatives to retain talent.
One trend we see more in Canadian issuers than U.S. peers continues to be Stock Appreciations Rights (SARs or phantom options). This is likely due to the maturity of these plans where SAR issuances have historically been a good alternative to equity issuances.
A second trend we’re seeing in Canada is the rise of net-settled transactions where the net value of an award is being paid out after withholding shares where the fair market value of those shares is equal to the employee tax obligation. The type of strategy shifts the tax liability to the employer and works well when the issuer has cash available.
A third trend that had been on the rise in the past few years but has recently tapered off has been the settlement of awards in shares purchased on the open market (either pre- or more often post-vesting). In more sophisticated cases, companies have used a flexible approach in plan design which allows them to use cash payments, share payments or a combination of both.

Run rate is another key metric used to measure equity plan dilution, representing shares granted under equity compensation plans during the year as a percentage of common shares outstanding. In other words, shareholders use run rate to measure the dilutive effects of equity pay on an annual basis. In concert with dilution overhang, run rates can be used by shareholders to determine how to vote their shares when deciding whether to approve equity incentive plans. Run rates among TSX companies increased slightly from 0.8% in fiscal 2011 to 1.0% in 2015 at the median and from 1.5% to 1.8% at the 75th percentile.
Data Points
► Median run rates among TSX companies increased 0.2 percentage points from 0.8% to 1.0% over the past five years (Fig. 11a)
► From 2012 to 2015, run rates in the TSX Composite remained at 0.4% at the 25th percentile (Fig. 11a)
► Run rates experienced mild fluctuations, but were relatively stable overall during the past four years in both the TSX Composite and S&P 500 at all three percentiles (Figs. 11a and 11b)
Figure 11a TSX Composite Run Rates
Figure 11b S&P 500 Run Rates
75th 1.5% 1.8% 1.6% 1.8% 1.8%
Median 0.8% 0.9% 0.9% 0.9% 1.0%
25th 0.3% 0.4% 0.4% 0.4% 0.4%
75th 2.0% 2.4% 2.2% 2.1% 2.0%
Median 1.4% 1.5% 1.4% 1.3% 1.4%
25th 0.8% 0.9% 0.9% 0.8% 0.8%
0
0.5
1.0
1.5
2.0
20152014201320122011
0.5
1.0
1.5
2.0
2.5
20152014201320122011
TSX Equity Compensation Trends | Equity Grant Practices
24

TSX Equity Compensation Trends | About the Contributors
25
Luca CutroneDirector, Client Service ManagementSolium Capital, Inc. Suite 1500, 8006 Avenue SW, Calgary, AB T2P 3G3 403-351-6312 [email protected]
Luca Cutrone joined Solium in 2012 as a Relationship Manager and is currently responsible for relationship management and service delivery for Canadian clients. Before joining Solium, Luca spent more than 10 years in various sales and customer service roles at a large public company and was involved in enterprise-level IT system renewals.
About Solium Capital Inc.
Solium Capital Inc. (TSX: SUM) provides cloud-enabled services for global equity administration, financial reporting and compliance. From offices in the United States, Canada, the United Kingdom, Europe and Australia, our innovative software-as-a-service (SaaS) technology powers share plan administration and equity transactions for more than 3,000 corporate clients with employee participants in more than 100 countries. Follow us @Solium and visit us at solium.com.
Contributor

TSX Equity Compensation Trends | About the Contributors
26
Michael CaputoManaging PartnerLane Caputo CompensationCalgary, AB: 210, 1702 4 Street SW, T2S 3A8 403-233-7033 ext: [email protected]
Michael Caputo advises boards of directors in the energy, energy services, mining and life sciences industries. For almost 20 years, Michael has advised the boards of directors and management teams of both publicly traded and privately held companies on executive and board of director compensation. In 2006, he founded Lane Caputo Compensation with a partner to help businesses deal with the complex executive compensation environment. Michael has an MBA from the University of Calgary and a B.Sc. from the University of Alberta.
About Lane Caputo Compensation Inc.
Lane Caputo Compensation Inc. (Lane Caputo) is an executive compensation consulting firm specializing in executive and board of director compensation reviews, strategic short- and long-term incentive design and executive retention issues along with compensation and executive contract issues surrounding mergers and acquisitions.
As a specialty executive compensation firm, we start with a thorough understanding of business strategy, corporate values and an understanding of how executive and management positions can affect strategy. Using this top-down approach, we delve into the client’s business strategy, operations and key milestones, allowing us to incorporate the company’s short and long-term goals and objectives into a well-defined compensation philosophy that will guide the design of their compensation programs.
Our consultants have been providing independent compensation advice for over 20 years, serving the Canadian market from offices in both Vancouver and Calgary.
Contributor

TSX Equity Compensation Trends
Appendix A Equity Outstanding
Appendix A Equity Outstanding
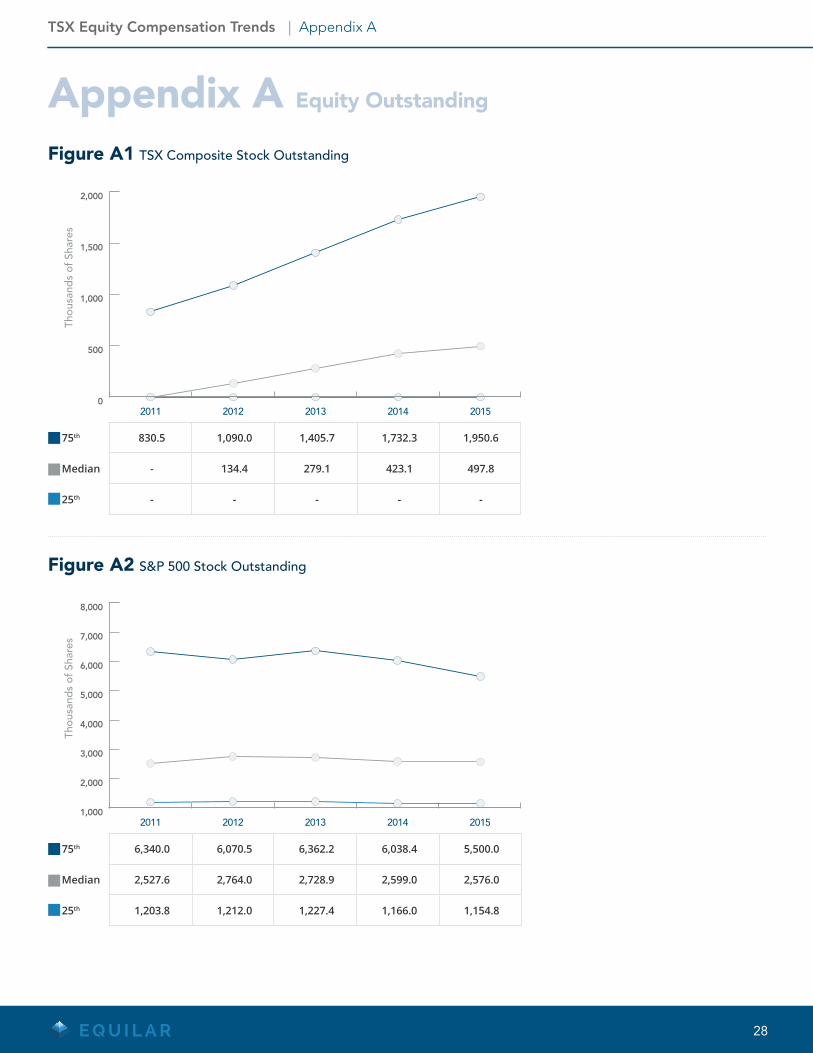
Figure A1 TSX Composite Stock Outstanding
75th 830.5 1,090.0 1,405.7 1,732.3 1,950.6
Median - 134.4 279.1 423.1 497.8
25th - - - - -
Figure A2 S&P 500 Stock Outstanding
75th 6,340.0 6,070.5 6,362.2 6,038.4 5,500.0
Median 2,527.6 2,764.0 2,728.9 2,599.0 2,576.0
25th 1,203.8 1,212.0 1,227.4 1,166.0 1,154.8
0
500
1,000
1,500
2,000
20152014201320122011
Thou
sand
s of
Sha
res
1,000
2,000
3,000
4,000
5,000
6,000
7,000
8,000
20152014201320122011
Thou
sand
s of
Sha
res
TSX Equity Compensation Trends | Appendix A
28

Appendix A Equity Outstanding
Figure A3 TSX Composite Options Outstanding
Figure A4 S&P 500 Options Outstanding
75th 8,545.4 8,633.5 8,395.3 8,324.2 8,350.1
Median 3,479.5 3,626.5 3,391.6 3,239.7 3,317.9
25th 1,482.8 1,454.5 1,408.1 1,378.4 1,292.6
75th 24,544.3 19,719.5 15,855.9 13,437.6 11,887.0
Median 10,512.4 8,935.3 6,986.0 5,622.0 4,800.0
25th 4,250.0 2,914.3 2,215.8 1,626.7 957.0
0
2,000
4,000
6,000
8,000
10,000
20152014201320122011
Thou
sand
s of
Sha
res
0
5,000
10,000
15,000
20,000
25,000
20152014201320122011
Thou
sand
s of
Sha
res
TSX Equity Compensation Trends | Appendix A
29

TSX Equity Compensation Trends
Appendix B Stock and Options Overhang

Appendix B Stock and Options Overhang
Figure B1 TSX Composite Options Dilution Overhang
Figure B2 S&P 500 Options Dilution Overhang
75th 4.5% 4.3% 4.3% 3.6% 3.8%
Median 2.7% 2.4% 2.3% 2.1% 2.0%
25th 1.2% 1.1% 1.1% 1.0% 0.8%
75th 6.1% 5.4% 4.4% 3.8% 3.5%
Median 3.9% 3.1% 2.5% 2.0% 1.7%
25th 1.6% 1.1% 0.9% 0.6% 0.5%
0
1
2
3
4
5
20152014201320122011
0
1
2
3
4
5
6
7
8
20152014201320122011
TSX Equity Compensation Trends | Appendix B
31

32
Appendix B Stock and Options Overhang
Figure B3 TSX Composite Stock Dilution Overhang
Figure B4 S&P 500 Stock Dilution Overhang
75th 0.5% 0.6% 0.7% 0.8% 0.8%
Median 0.0% 0.1% 0.2% 0.3% 0.3%
25th 0.0% 0.0% 0.0% 0.0% 0.0%
75th 1.6% 1.6% 1.6% 1.5% 1.4%
Median 0.9% 0.9% 0.9% 0.8% 0.8%
25th 0.4% 0.5% 0.5% 0.5% 0.4%
0
0.2
0.4
0.6
0.8
1.0
20152014201320122011
0
0.5
1.0
1.5
2.0
20152014201320122011
TSX Equity Compensation Trends | Appendix B

TSX Equity Compensation Trends | Section Name Here
33
Learn more at www.equilar.com
Board Intelligence Solutions ► Board Succession Planning
► Shareholder Engagement
► Executive Compensation
► Director EducationData. Decisions. Results.
Data to NavigateYour Most Important
Board Decisions

1100 Marshall Street Redwood City, CA 94063 Phone: (650) 241-6600 Fax: (650) 701-0993 E-mail: [email protected] www.equilar.com