tsunami scour and sedimentation
TRANSCRIPT

1
TSUNAMI SCOUR AND SEDIMENTATION
Harry YEH1 and Wenwen LI2
1Professor, School of Civil & Construction Eng., Oregon State University (Corvallis, Oregon 97331-3212)
E-mail: [email protected] 2Graduate Student, School of Civil & Construction Eng., Oregon State University
(Corvallis, Oregon 97331-3212) E-mail: [email protected]
…
Tsunami-induced scour and sediment-motion characteristics are quantitatively evaluated by imposing a hypothetical but typical tsunami on idealized beach condition, viz. tsunami runup onto a plane beach with a uniform slope and uniform sediments. Using this model, it is demonstrated that the tsunami is capable of inducing significant sediment bedload and suspension in the nearshore area. The model tsunami also demonstrates that momentary liquefaction is possible to result during the drawdown phase. The analytic predictions for pore-pressure-induced scour depths are in agreement, at least within an order of magnitude, with past field observations. To help elucidate the mechanisms of sediment pickup and deposit, the fundamental characteristics of flow separation and attachment at the bed are discussed. The backwash flow against the incident tsunami plays a crucial role in triggering separation of the flow at the bed. This implies that the leading depression wave followed by a large elevation wave can induce sediment suspension effectively. Flow attachment happens during the flow reversal near the maximum inundation area, which promotes sediment deposition. Keywords: Tsunami scour; sediment motion; runup and drawdown; momentary liquefaction; Shields parameter, Rouse number, flow separation, flow attachment.
1. INTRODUCTION Mega tsunamis such as the 2004 Indian Ocean Tsunami are rare. Because forewarning of such events is now possible (even though the lead time might be short for some regions), the primary tsunami hazard mitigation strategy has been evacuation. Hence, most of the effort has been aimed at developing effective warning systems, inundation maps, and tsunami awareness. However, the devastating damage to buildings and infrastructure causes not only economic setbacks, but also triggers additional hazardous situations and threatens additional human lives. The accelerating rate of construction of critical infrastructure in the coastal zone demands a reliable design methodology for tsunami-resistant structures. The causes of structural failure subject to tsunami attack can be categorized into four groups: 1) hydrodynamic forces, 2) impact forces by water-borne missiles, 3) fire spread by floating materials (including burning oil), and 4) scour and foundation failure. This paper
focuses on the last category, i.e. tsunami-induced scour and sediment response to tsunami actions.
2. BACKGROUND Many field surveys conducted from the 1992 Nicaragua tsunami to the recent 2004 Indian Ocean tsunami have recorded abundant evidence of scour around damaged buildings and bridge foundations. For example, Fig. 1a shows scour damage at the seaward corner of the schoolhouse at Kalapakkom, India, where the runup height was 4.1m; the house was inundated at a depth of 0.95 m above the floor level. The scour depth is approximately 1.5 m with a horizontal span of 5m. Fig. 1b shows an undermined patio in Devanaanpattinam, India, where the runup height was 3.0 m. Judging from the failure pattern, the undermining must have resulted from swift channelized flows during the drawdown. Note that unlike the tsunami runup process, the drawdown tends to take place in low and weak locations by
95
K-7 Fourth International Conference on Scour and Erosion 2008

2
concentrating the flow, which progressively forms drainage channels. During the 1993 Okushiri tsunami attack, a scour depth of 4 m was created between the breakwaters at the entrance of Okushiri Port, Japan1) causing the breakwater to capsize because of foundation failure (Fig. 1c). On a larger scale, the flow conditions resulting from the 1960 Chilean tsunami created a scour hole more than 8 m deep at the entrance to Kesen-numa port, Japan.2) Although the mechanisms for scour formation under tsunami loading seem similar to those induced by storm-generated waves, there are some differences. Storm waves have many cycles with a period of less than tens of seconds. Tsunamis typically have one or a few cycles with a period in minutes or tens of minutes. Tsunami timescales, on the other hand, are shorter than hours to days typical of slope instability problems associated with rapid drawdown in reservoirs and tidal inlets. Furthermore, a typical tsunami inundation distance is a few hundred meters – in some cases, it extends more than a kilometer – much greater than storm-wave penetration. In general, scour describes the movement of granular sediments subject to shear forces induced by ambient turbulent flow. High water velocity, generating high shear stress on the seabed, is the primary cause of scour. For non-cohesive soils (e.g. sands), the Mohr-Coulomb failure criterion indicates that soil failure occurs when the ratio of the shear stress to normal effective stress, τ/σ’n, becomes greater than the tangent of the friction angle. Consequently, shear failure can occur by increasing the shear stress τ and/or by decreasing the effective stress, σ’n. The shear stress can be increased evidently by the flow. It is also induced by sloping ground surfaces as well as non-uniform vertical loads beneath wave crests and troughs. The effective stress can be reduced by several mechanisms: 1) buildup of pore pressures in the soil through cyclic shear stress (this
mechanism is called “residual liquefaction3)” 2) rapid reduction in the vertical total stress (called “momentary liquefaction4)” and 3) drainage of water from regions of high to low excess pore pressure through subsurface seepage paths that result in transient “seepage erosion5)”; seepage erosion is related to rapid drawdown6, 7, 8). Recently, Sumer9) (as editor) reviewed liquefaction associated with offshore structures. When a structure is in coastal water, the flow field around it becomes complex. Flow separation and turbulence in the vicinity of the structure play a role in determining the loading on the seabed. Large pore-pressure gradients can occur at various locations, leading to liquefaction potential, scour, and foundation instability. Residual liquefaction under cyclic wave loading is caused by cyclic shear stress associated with the oscillating vertical stress due to spatial pressure variability. The seabed is compressed under the wave crest and expanded under the wave trough; the resulting cyclic shear stress deforms the soil skeleton at the midpoint between the crest and trough of the wave. If the soil has low permeability, high pore pressures may persist and accumulate with the repetitious wave loading. A second kind of liquefaction, momentary liquefaction, discussed by Zen and Yamazaki10, 11), can be described as follows. When the vertical total stress is rapidly reduced under a wave trough, high pore pressures in the seabed persist for a short time. Persisting excess pore pressure may become greater or equal to the submerged weight of the soil, resulting in zero effective normal stress. Although the mechanisms of scour and sediment motions under tsunami-like loadings are not fully understood, it is unlikely that residual liquefaction is the primary cause of excessive tsunami scour, because tsunamis have only a few long-period oscillations. However, during the drawdown phase of a tsunami attack, a vertical gradient of excess
Figure 1. Typical scour holes at building foundation: a) approximately 1.5 m deep in India, 2004 tsunami (photo by Yeh); b) 1.4 m
deep in India (photo by Yeh, PI); c) foundation failure of the breakwater by the tsunami (Okushiri, Japan, 1993; photos by Yeh).
(a) (b) (c)
96
3
pore-pressure can be generated which can lead to a failure mechanism similar to momentary liquefaction. This hypothesis is supported by the laboratory experiments of Yeh et al.12, 13) and by the analysis given by Tonkin et al.14) The mechanisms of scour and sediment-bed instability under tsunami-like loadings are not sufficiently understood. In this paper, scour and sediment-motion characteristics are quantitatively evaluated by imposing the condition of a hypothetical but typical tsunami.
3. ANALYSES A model tsunami is selected so that forcing parameters represent realistic hydrodynamic conditions (e.g. flow velocities and depths) of a typical tsunami. As expected, there is no adequate field data available to provide complete temporal and spatial variations of the flow field. Unfortunately, no laboratory experiments can produce such data. This is because a real tsunami is very long (a few hundred kilometers) in shallow water (a few kilometers deep offshore) with a small amplitude (a few meters) – the resulting extreme distortion in the horizontal to vertical length scales makes the downscaled laboratory experiments formidable, if not impossible. Consequently, we must resort to numerical or analytical models to yield the data. (1) Model Tsunami.
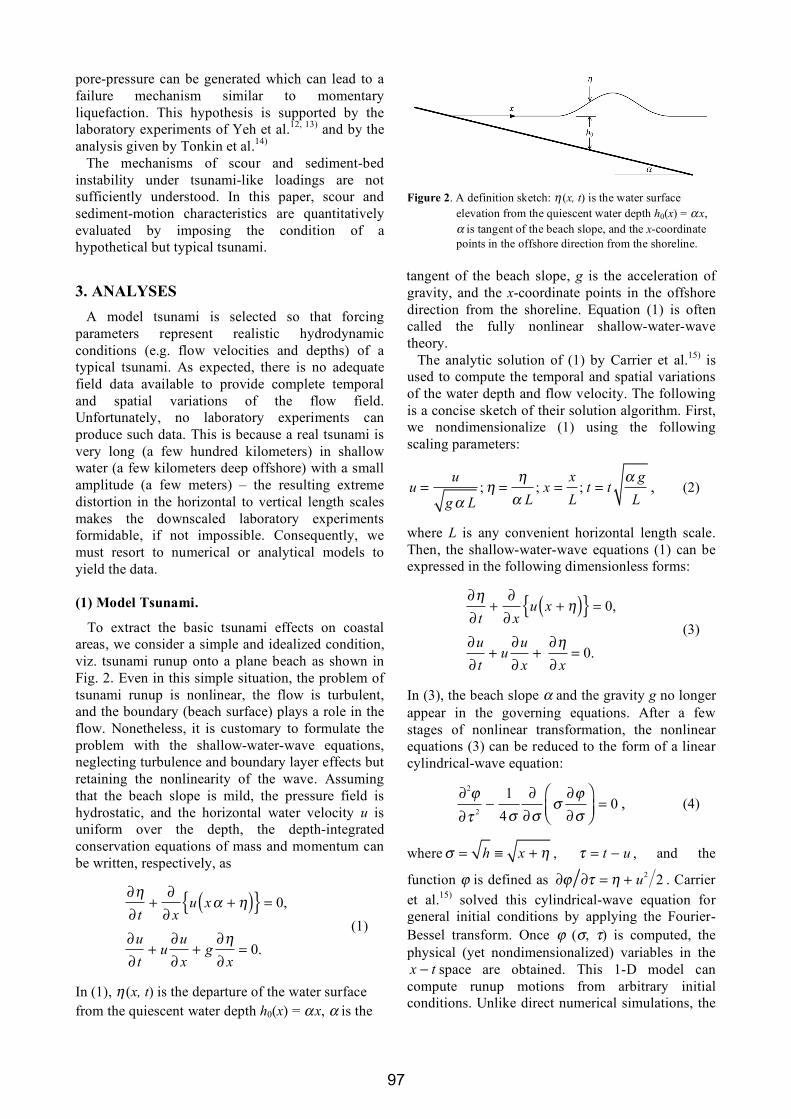
To extract the basic tsunami effects on coastal areas, we consider a simple and idealized condition, viz. tsunami runup onto a plane beach as shown in Fig. 2. Even in this simple situation, the problem of tsunami runup is nonlinear, the flow is turbulent, and the boundary (beach surface) plays a role in the flow. Nonetheless, it is customary to formulate the problem with the shallow-water-wave equations, neglecting turbulence and boundary layer effects but retaining the nonlinearity of the wave. Assuming that the beach slope is mild, the pressure field is hydrostatic, and the horizontal water velocity u is uniform over the depth, the depth-integrated conservation equations of mass and momentum can be written, respectively, as
!"
! t+
!
! xu x# + "( ){ } = 0,
!u
! t+ u
!u
! x+ g
!"
! x= 0.
(1)
In (1), η (x, t) is the departure of the water surface from the quiescent water depth h0(x) = α x, α is the
Figure 2. A definition sketch: η (x, t) is the water surface
elevation from the quiescent water depth h0(x) = α x, α is tangent of the beach slope, and the x-coordinate points in the offshore direction from the shoreline.
tangent of the beach slope, g is the acceleration of gravity, and the x-coordinate points in the offshore direction from the shoreline. Equation (1) is often called the fully nonlinear shallow-water-wave theory. The analytic solution of (1) by Carrier et al.15) is used to compute the temporal and spatial variations of the water depth and flow velocity. The following is a concise sketch of their solution algorithm. First, we nondimensionalize (1) using the following scaling parameters:
u =u
g! L;" =
"
! L; x =
x
L; t = t
! g
L, (2)
where L is any convenient horizontal length scale. Then, the shallow-water-wave equations (1) can be expressed in the following dimensionless forms:
!"
! t
+!
! x
u x + "( ){ } = 0,
!u
! t
+ u!u
! x
+!"
! x
= 0.
(3)
In (3), the beach slope α and the gravity g no longer appear in the governing equations. After a few stages of nonlinear transformation, the nonlinear equations (3) can be reduced to the form of a linear cylindrical-wave equation:
!2"
!# 2$
1
4%
!
!%%!"
!%
&'(
)*+= 0 , (4)
where ! = h " x + # ,
! = t " u , and the
function ϕ is defined as !" !# = $ + u
2
2 . Carrier et al.15) solved this cylindrical-wave equation for general initial conditions by applying the Fourier-Bessel transform. Once ϕ (σ, τ) is computed, the physical (yet nondimensionalized) variables in the x ! t space are obtained. This 1-D model can compute runup motions from arbitrary initial conditions. Unlike direct numerical simulations, the
97

4
algorithm can obtain a very accurate solution for any arbitrarily selected time and location without computing the rest of the computational domain. This is because no time stepping is involved in the analytic algorithm. To establish the model tsunami that will be utilized for our subsequent analyses, we set L = 20 km and α = 1/250. The tsunami source condition is shown in Fig. 3, which is a leading depression N-wave with the maximum positive displacement a0 = 1.4 m and a breadth of approximately 60 km – a typical tsunami source generated by a subduction-type earthquake. The resulting tsunami actions in velocity and inundation depth are shown in Fig. 4a and b, respectively. The maximum inundation distance is 1160 m with a maximum runup height of 4.6 m; the runup/drawdown process takes approximately 16 minutes, yielding a very realistic runup condition of a locally generated tsunami. (2) Initiation of Sediment Motion, Bed Load, and Suspension.
The Shields parameter is a fundamental dimensionless number that represents the ratio of shear stress to buoyant sediment weight. The parameter is used to determine incipient sediment motion on a bed, as well as for evaluation of sediment bed-load and sheet flow (sheet flow is a type of sediment motion where sediment particles are traveling in a dense layer near the bed supported by inter-granular collisions rather than by fluid turbulence). The Shields parameter θ can be written as
! ="
0
# g d s $ 1( )=
f u2
8 g d s $ 1( ), (5)
Figure 3. Initial waveform of the model tsunami – leading
depression N-wave formation. where τ0 is the bed shear stress, ρ is the water density, g is the gravitational acceleration, d is the diameter of the sediment grains (the median diameter, d50, is often used), s is the specific gravity of the sediment grains (
s = !
s! : ρs is the sediment
grain density), f is the Darcy friction factor, and u is the flow velocity obtained from the foregoing shallow-water-wave theory. By expressing (5) with the friction factor f, we assumed that the tsunami flow was quasi steady. This assumption can be justified because of its long-period current-like flow: the exception would be in the narrow region of the broken wave (bore) front that is formed when the tsunami approaches the shore. Temporal and spatial variations of the Shields parameter are computed for the model tsunami. Here, we use f = 0.01, s = 2.64, and d50 = 0.35 mm. Justification for the value of the friction factor f is presented in the Appendix. Note that our model is based on the following assumptions: a) uniform beach slope α = 1/250, b) uniform sediments in the entire domain with d50 = 0.35 mm, and c) no alongshore variation in both topography and flow
Figure 4. Temporal and spatial variations of a) flow velocities and b) inundation depths of the model tsunami generated from
the initial tsunami source shown in Fig. 3. The beach slope α = 1/250.
(a) (b)
98

5
conditions. In spite of such an idealized condition, we believe that adequate characteristics and behaviors of sediment response to typical tsunami loading can be studied through this exercise. Computed spatial and temporal variations of the Shields parameter are presented in Fig. 5a. The threshold of sediment-particle motion is identified with the critical Shields parameter, θc, which is approximately constant (θc = 0.04 ~ 0.06) although it is a weak function of the Reynolds number. The results in Fig. 5a demonstrate that the tsunami is capable of initiating sediment particles in motion in the entire domain x < 2.5 km. The value θ = 2.0 in Fig. 5a represents the transition from no suspension sheet-flow to a suspension sheet-flow regime. A substantial amount of bed-load transport would be anticipated in the region of θ > 2.0. During the runup process, this occurs in the range 450 m > x > –900 m. During the drawdown process, significant bed-load θ > 2.0 can occur in the broader area, –900 m < x < 800 m. More than 77% of the total inundation distance (1160 m) from the initial shoreline can be subject to significant sediment transport in the form of bed load. It is a common practice to classify the modes of sediment transport based on the Rouse number, which is the ratio of particle settling velocity ws to
shear velocity u
*= !
0" :
RO=
ws
! k u*
, (6)
where β is the ratio of sediment diffusion to momentum diffusion coefficients (1/β is the
turbulent Schmidt number) that is close to unity16), k = 0.4 is von Karman’s constant, and the particle settling velocity, ws, can be computed, for example by Julien17):
ws=
8!
ds
1 +s " 1( )g d
s
3
72! 2" 1
#
$%%
&
'((
, (7)
which yields ws = 52 mm/sec for our model sediments (i.e. ds = 0.35 mm): ν is the kinematic viscosity of water. The suspended sediments can be maintained when RO < 2.5; the entire water column would be filled with suspended sediments when RO < 1.0 16). Figure 5b shows computed spatial and temporal variations of the Rouse number for the model tsunami. Based on the Rouse number criteria, sediment suspension is possible (RO < 2.5) even far offshore, say x ~ 2.0 km, although the suspension must be limited near the bed. During the runup phase, full suspension can occur (RO < 1.0) when the tsunami approaches close to shore, x ~ 50 m, and such sediment suspension can be maintained by turbulence up to x ~ –750 m. Observing the results in Fig. 5b, the suspended sediments can presumably be deposited beyond this location up to near the maximum inundation point: the Rouse number is maintained RO < 2.5 until almost the maximum inundation. Drawdown flows are capable of inducing more severe sediment suspension as shown in Figure 5b.
Figure 5. Temporal and spatial variations of a) the Shields parameter θ and b) the Rouse number R0 for the model tsunami
shown in Fig. 3 with the beach slope α = 1/250. The critical values of Shields parameter for incipient sediment motion θc = 0.05 and for the suspended sediments θsc = 2.0 are shown. Sediment suspension can occur when R0 < 2.5 and the entire water column can be filled with suspended sediments when R0 < 1.0. The dark blue indicates where R0 > 7.0.
(a) (b)
99

6
It should be emphasized that the results in Fig. 5 are based on our 1-D tsunami model that assumes no lateral (alongshore) variation. As we stated earlier, in the case of real world situations, tsunami runup tends to flood uniformly over a coastal area, whereas its drawdown process is influenced by the lateral variations in the onshore terrain. This tendency results from the fact that the water-surface profile increases offshore during runup, but it decreases during drawdown as shown in Fig. 6. In other words, the runup takes place with the flood of a thick water body, and the drawdown forms a thin and swift current. This observation leads to a hypothesis that sediments carried from offshore are deposited evenly in the runup area. On the other hand, severe scour and channeling can result by eroding weak spots during drawdown. (3) Scour and Momentary Liquefaction
To investigate the scouring mechanisms associated with a tsunami impinging on a cylindrical structure, a set of experiments was performed by Yeh et al.12) The scouring process was recorded with miniature CCD video cameras inside a transparent cylinder; one image frame is shown in Fig. 7. The experiments revealed at least two different scouring mechanisms. During the runup stage, a moderate degree of scour occurred due to bed shear stresses. The maximum scour occurred during the drawdown stage. The video images and the pore pressure data indicate that the sediments around the cylinder became liquefied, removing or severely diminishing their ability to withstand even small bed shear stresses. Based on the experimental results, Tonkin et al.14) hypothesized that as the water level and velocity subside during the tsunami drawdown process, the pressure on the seabed decreases,
creating a vertical pressure gradient that decreases the effective stress within the soil. Fundamentally, the sediment liquefies, with no effective stress between the sediment grains, if the vertical gradient in the pore pressure p exceeds the buoyant specific weight of the saturated soil skeleton, γb:
!p
!zz= z
0
> " # $sat" $( )g % " #&
b, (8)
where ρsat is the bulk density of the saturated soil skeleton, ρ is the water density, Λ is the scour enhancement parameter that was introduced by Tonkin et al.14), the coordinate z is directed vertically upward, and z0 is the elevation of the movable sediment bed. If the sediment liquefies, no resisting forces remain, and the sediment readily scours. The scour enhancement parameter, Λ, represents the fraction by which the pore pressure gradient decreases the frictional forces resisting scour, or equivalently the fraction of the buoyant weight of soil supported by the pore pressure gradient. The quantity Λ is equivalent to the pore pressure ratio used in the geotechnical literature, that is, the ratio of excess pore pressure to initial effective vertical stress; Λ = 1 represents zero effective stress. For any given flow characteristics (velocity and depth, turbulence, 3-D effects), there is some value of Λ for which the remaining frictional forces are small enough that scour occurs very rapidly. This threshold value of Λ must lie between 0 and 1. Based on the laboratory experiments on scour around a vertical cylinder, Tonkin et al.14) reported that significant soil instability results when Λ exceeds one-half (Λ ≥ 0.5). (Although it is a different physical situation,
Figure 6. The water-surface profiles a) in the runup phase and b) in the drawdown phase. The deeper flow depth in the flood stage
and thin layer of the receding water are evident.
100

7
Figure 7. Video snapshot showing soil liquefaction around the
cylinder (50 cm diameter) observed at the end of the tsunami drawdown14). While the upper right-hand panel was recorded directly above the cylinder, the upper left-hand panel is a side view. The wave is running down from right to left. The two lower panels were recorded from inside the cylinder. Each panel shows approximately a 90° horizontal field of view. The arrows are used to illustrate the flow field, and the line indicates the stationary sediment surface.
Sumer et al.18) found that pipes tend to settle into a sediment (silt) bed when a cyclic buildup of pore pressures reaches a gradient approximately half of that required for liquefaction). Terzaghi’s 1-D model19) for the pore-pressure dissipation p can be written as
! p
!t= c
v
!2
p
! z2
, (9)
where cv is Terzaghi’s coefficient of consolidation:
cv=
k
! g
1 + e0
av
, (10)
where k is the hydraulic conductivity in Darcy’s Law, ρ is the water density, e0 is the initial void ratio, and av is the coefficient of compressibility (i.e. av = –de/dσ, where σ is the vertical effective stress). Note that in hydrodynamics, it is more common to use the terminology “porosity” φ, instead of void ratio (φ = e0/(e0+1)), and “bulk modulus of elasticity” K, instead of the compressibility (K ≈ 1/av). The exact solution to (9) for infinite soil thickness, assuming that the surface pressure decreases linearly by Δ p over time ΔT, can be derived analytically20). Combining the analytic solution with the soil stability condition given by (8) yields the quantitative prediction for the movable soil depth ds of tsunami-induced scour:
ds=
! p
"b#
1$ 4i2erfc
ds
2 cv!T
%
&''
(
)**
+
,--
.
/00
, (11)
where i2erfc[ • ] is the second integral of the complementary error function. The scour depth ds is implicit in (11). The limiting condition, as ds → 0, yields a measure of whether any soil instability due to the pore-pressure gradient can occur:
! 0( ) =2
"
# p
$b
cv#T
. (12)
The critical value of Λ (≈ 0.5) being less than 1.0 (the condition of nil effective stress) is attributed to shear stresses and turbulence exerted by the flow and three-dimensional effects (i.e. horizontal pore-pressure gradients developing around the cylinder in their experiments). To evaluate (11) and (12) for our model tsunami, we use the following sediment properties: the specific gravity of sediment grain s = 2.64, the void ratio e0 = 0.77, and the bulk density of the saturated soil ρsat = 1.93×10³ kg/m3. The pore-pressure vertical gradient required for liquefaction is –9.12 kPa/m; the corresponding vertical gradient in the pore-pressure head is 0.93. The value of the consolidation coefficient, cv, is unlikely constant under transient loading conditions. Yeh et al.13) used an apparatus that mimics the rapid pressure relief on the soil surface in a controlled manner, allowing the values of cv to be determined by (9) with direct measurements of the pore-pressure field. Their experimental data show that the value of cv decreases in time. The average value of cv for sand was found to be 750 cm2/sec, with a range from 400 to 1200 cm2/sec. We use this average value cv = 750 cm2/sec for our computation. In order to identify the area where momentary liquefaction can be responsible for scour and sediment motions, we apply the foregoing theory to our model tsunami. Recall that the analytical solutions (11) and (12) assume a linear decrease in the bed-surface pressure Δp over time ΔT. However, the pressure relief during the drawdown process is not exactly linear. For example, see Fig. 8 for the temporal variations in water-surface elevation and velocity. For approximation, we take the maximum values of Λ(0) that are computed from (12) with pairs of Δp (equivalently Δh) and ΔT by connecting straight lines from the maximum drawdown stage to various earlier drawdown stages.
101

8
Figure 8. Temporal variations of a) water-surface elevations and b) velocities at x = 800 m.
Figure 9 shows the results of the spatial variations of the scour enhanced parameter Λ(0) computed by (12). The value of Λ(0) can be used to judge whether any soil instability due to pore-pressure gradient is possible. As we discussed earlier, we anticipate that the threshold value of Λ in both (11) and (12) is Λ ≈ 0.5. Figure 9 indicates that the region where Λ > 0.5 is –300 m < x < 1200 m. At x = 450 m, the value of Λ(0) exceeds unity which means momentary liquefaction occurs because of variation of pore pressure only without flow action being considered. Using the value Λ = 0.5, the enhanced scour depths were computed by (11) and plotted in Fig. 10. The values of Δp and ΔT are determined using the same procedure to determine Λ(0). Figure 10 shows that the maximum scour depth in the onshore area would be less than 3 m (at the shoreline); perhaps less than 2 m scour might be a better estimate considering that the structures are located inshore away from the shoreline. No pore-pressure driven scour occurs farther inland than x = –300 m. The maximum scour depth is found to be 6.2 m deep at 450m offshore. This implies that any offshore coastal structures (breakwaters, oil/gas berth terminals) could be vulnerable from liquefaction-induced scours. The pore pressure effect remains important more than 1.2 km from the shore. The results in Fig. 10 also imply that substantial amounts of sediments near the shore can be washed offshore during the drawdown process. (4) Flow Separation and Attachment
Tsunamis can leave a significant amount of sediments in the runup zone. For example, tsunami deposits observed 10 days after the 1992 Nicaragua tsunami are shown in Fig. 11. About 20 years ago, geologists began to investigate tsunami deposits for
Figure 9. Spatial variation of the value of the scour
enhancement parameter Λ(0) computed by (12) for the model tsunami condition shown in Fig. 3. The effect of a pore-pressure gradient becomes important when Λ(0) > 0.5.
Figure 10. Spatial variation of scour depth computed by (11)
for the model tsunami condition shown in Fig. 3 using the threshold value Λ = 0.5.
scientific and hazard assessment purposes21, 22). The hypothesis was that tsunami deposits preserved in the geologic record could be used to identify paleotsunami occurrences. This type of research has contributed to reassessment of the earthquake and tsunami potential in the Pacific Northwest of the U.S., which now relies on geologic evidence and tsunami modeling to define its tsunami hazards. Recently, Huntington et al.23) raised an important question about the magnitude of past events and whether it can be quantified by modeling onshore
102

9
Figure 11. Sediment deposits observed at El Ostional, immediately after the 1992 Nicaragua tsunami. The left photo is from the
beach forest approximately 200 m inland from that shown in the right photo.
flow depth and speed from tsunami deposits. Although it is a difficult question to answer, flow separation and attachment associated with tsunami runup motions should play a role in sediment pickup and deposition mechanisms. For 2-D flows on a stationary boundary, the flow separates from the boundary surface when the bed shear stress vanishes, τ0 = 0, or equivalently the vorticity on the bed vanishes:
!0= µ
"u
" z
= 0; # ="u
" z
= 0 , (13)
where the z coordinate points upward normal to the beach surface, and the x-axis points inshore along the beach surface (note that for convenience, we define the x-direction opposite from that used in the foregoing analyses). By continuity, the flow velocity in the z-direction, w, near the bed can be expressed as
w x, z( ) = !1
2
"#
" x
z2 , (14)
using Taylor-series expansion at z = 0 and no-slip boundary conditions. Hence the flow separates from the bed when the bed vorticity ω = 0 and the vertical velocity, w, near the bed is positive (i.e.
!" ! x < 0 ). On the other hand, the flow attaches
to the bed when ω = 0 and !" ! x > 0 .
Now the Navier-Stokes equation can be written on the no-slip stationary bed at z = 0 as
µ!"
! z=! p
e
! x, (15)
where p
e= p + ! g z cos" is the excess pressure
(also called ‘reduced’ pressure). It is noted that Lighthill24) was the one who interpreted (15) as the
source of vorticity at a stationary and plane boundary. Suppose a single wave – it can be a bore – approaches the shore into the quiescent water ahead of the wave (bore) front. As depicted in Fig. 12a, the pressure gradient in the x-direction is negative; hence the gradient of vorticity in the z-direction must be negative along the bed according to (15). Because the water in front of the wave (bore) is quiescent and hence irrotational, the positive vorticity (clockwise) must be generated at the boundary (no-slip condition) that diffuses out and upward. Thus,
!" ! z < 0 . The sign of vorticity is
monotonic along the bed as the pressure increases in the offshore direction. Therefore, there cannot be any place where ω = 0 at the bed under the wave front and the flow cannot separate at the bed. On the other hand, if the incident tsunami formation were a leading depression N-wave (i.e. like our model tsunami described in Fig. 3), the main elevation wave (bore) would approach the shore against the opposing offshore current as shown in Fig. 12b. The backwash current in front of the advancing wave (bore) has negative vorticity (counterclockwise) at the bed. The generation of positive vorticity (i.e. negative vorticity gradient in the z-direction) that is induced by the negative pressure gradient in the x-direction results in
!" ! x < 0 along the bed. This can create a spot where ω = 0 and w > 0 at the bed under the wave front, causing flow separation to result. Therefore, the existence of backflow plays a crucial role in triggering flow separation under the wave (bore) front. The strength of separation depends on the backwash and the pressure gradient at the wave (bore) front. Nonetheless, tsunamis in the form of a leading depression N-wave should be more effective in sediment pickup by flow separation than the equivalent leading elevation tsunamis.
103

10
Figure 12. Vorticity generation at the boundary during runup motion; a) no backwash flow and no flow separation, b) the backwash
flow causing flow separation. When a tsunami approaches its maximum flood stage, flow reversal takes place starting offshore, while the leading surge still climbs inland. Consequently, the water mass near the inundation front will be stretched as depicted in Fig. 13. For this flow condition, the gradient of excess pressure, pe, is positive in the x-direction. Thus the vorticity gradient in the z-direction should be positive according to (15) and the generated vorticity along the bed is negative (counterclockwise). This vorticity generation should cause creation of a bed condition where ω = 0 and
!" ! x > 0 . A positive
vorticity gradient at the bed in the x-direction leads to a negative velocity in the z-direction (w < 0) according to (14), causing flow attachment results. Obviously, the formation of flow attachment promotes sediment deposition. It is cautioned that the foregoing analyses are for 2-D flows; 3-D flows can separate from (or attach to) the boundary by the lateral flow convergence (divergence) from the third dimension. Nonetheless, our 2-D analyses should provide general trends of flow separation and attachment for tsunami runup, which in turn provides implications for tsunami deposit patterns.
3. CONCLUSIONS AND RESEARCH NEEDS Tsunami sediment motion and scour are discussed using a hypothetical but typical tsunami condition. The imposed tsunami loadings represent those of a locally generated tsunami triggered by a subduction earthquake; such subduction faulting often creates a leading depression N-wave that approaches nearby land. The model tsunami causes a maximum inundation distance of about 1 km, a maximum
Figure 13. Vorticity generation at the flow reversal stage; flow
attachment should result.
runup height of 4 ~ 5 m, and an inundation period of about 16 minutes, all of which are very typical tsunami conditions. For this model exercise, we assumed the beach to be a plane with a uniform slope and uniform sediments throughout the study domain. It was demonstrated that a tsunami is capable of causing sediment motion even far offshore in both the runup and drawdown phases, and that the drawdown process is slightly stronger than the runup. Significant sediment motion in the form of bed load and suspension can occur nearshore close to the maximum runup penetration. Approximately 80% of the total inundation distance from the initial shoreline can be subject to significant bed-load transport, and 65% of the inundation area is subject to fully suspended flows. In the offshore area, significant sediment motions are anticipated up to the location of the maximum drawdown. The model also demonstrated that momentary liquefaction may result during the drawdown phase. The offshore area is more susceptible to
104
11
liquefaction, especially near the maximum drawdown location. The estimated scour depth, approximately 6 m at the offshore location and less than 2 m in the inshore area, are in good agreement with past field observations. The condition that causes flow separation at the wave (bore) front was discussed based on Lighthill’s vorticity source at a solid boundary24, 25). The backwash flow against the approaching wave (bore) plays a crucial role in triggering separation of the flow at the bed. This implies that a leading depression wave followed by a large elevation wave can effectively induce sediment suspension. On the other hand, flow attachment likely takes place during flow reversal near the maximum inundation area, which promotes sediment deposition. Those analytical considerations may help physical interpretations of tsunami deposits. There are several critical factors remaining unexplored for tsunami related sediment problems. First, for tsunami runup problems, the soil is initially dry and suddenly becomes wet on the surface with a substantial amount of water pressure. The soil lacks moisture and likely remains non-cohesive, which would make it particularly vulnerable to erosion by swift tsunami currents. Momentary liquefaction is more significant for unsaturated seabed soils26, 27, 28); due to the compressibility of air trapped in unsaturated soil pores, the pore pressure does not immediately respond to the change in wave height. Another important physical feature of tsunami is the steep wave front associated with the formation of a bore during its runup phase. Even during drawdown, a backward breaking wave can occur29). This sudden change in water depth creates a large horizontal pressure gradient on the seabed. In an analysis of sand bed instability under breaking waves, Madsen30) suggested that momentary failure occurs when the horizontal pore-pressure gradient exceeds a critical value. Flow separation and a sheltering effect due to the presence of a structure should create a similarly large horizontal pressure gradient around the foundation. These problems are important, but evidently challenging.
ACKNOWLEDGMENT This work was supported by the U.S. National Science Foundation (SBE-0527699). HY is grateful to Japan Society for the Promotion of Science for the JSPS Shirt-Term Invitation Fellowship for Research, and the Edwards endowment through Oregon State University
APPENDIX – DARCY’S FRICTION FACTOR, f For most numerical models designed for tsunami inundation (without consideration of sediments), the Manning n is often used to account for friction effects for convenience; Manning’s coefficient n itself is usually used independent of the flow depth, although that is not exactly the case. The range of Manning’s coefficient n used in the numerical models is from 0.01 ~ 0.025, which is equivalent to f = 0.006 ~ 0.039 if we assume a flow depth of 2 m. Manning’s coefficient n can be empirically estimated for a given sediment particle size d by
n = 0.041d
1/ 6
or equivalently f = 0.014 g d
h( )1/ 3
. (A-1)
According to Henderson31), this empirical equation was proposed by Stricker in 1923. The original form of this empirical equation is expressed by d in feet, but converted into the SI unit system here. Note that the numerical coefficients in (A-1) have dimensions. Equation (A-1) yields f = 0.0077 for d = 0.35 mm and the flow depth h = 2 m. Analytical values of the friction factor f can be obtained from turbulent boundary-layer theory. For a smooth plane plate, Schlichting32) derived boundary stress τ0 based on the assumption of the 1/7th power law. His solution to boundary stress τ0 can be expressed by the friction factor f as
f = 0.237 R
x
!1/5, (A-2)
where
Rx=
u x
! is the Reynolds number. A
reasonable range of Reynolds number in tsunami runup – say, Rx = 107 ~ 108, (A-2) gives f = 0.009 ~ 0.006, respectively. Schlichting32) also gave the resistance formula for a uniformly rough plate in a completely rough flow regime. In terms of friction factor, his formula can be written as:
f = 4 2.87 + 1.58log x k
s( )!" #$
%2.5
, (A-3)
where x is the distance from the tip of the flat plate and ks is the roughness. Taking the roughness ks = d = 0.35 mm, we found f = 0.015 ~ 0.009 for x = 5 m ~ 100 m, respectively. Based on the foregoing estimations, we conclude that it is reasonable to use the value of friction factor f = 0.01 for our model tsunami condition.
105

12
REFERENCES 1) Hokkaido Development Bureau. 1994. Report on the
Reconstruction of Port Facilities Damaged in the Hikkaido Nansei-Oki Earthquake. Hakodate Development and Construction Department, 30pp
2) Takahashi T., Imamura, F. and Shuto, N. 1992. Research on flows and bathymetry variations by tsunami: the Case of Kesen-numa Bay, Japan, due to the 1960 Chilean Tsunami (in Japanese). Tsunami Engineering Technical Report No. 9, Tohoku University, 185−201.
3) Seed, H. B. and Rahman, M. S. 1978. Wave-induced pore pressure in relation to ocean floor stability of cohesionless soils”. Mar. Geothech., 3(2), 123−150.
4) Clukey, E.C., Kulhawy, F.H., Liu, P. L.-F. and Tate, G.B. 1985. The impact of wave loads and pore water pressure generation on initiation of sediment transport. Geo-Marine Letters, 5: 177−83.
5) Lobkovsky, A. E., Jensen, B., Kudrolli, A., and Rothman, D. H. 2004. Threshold phenomena in erosion driven by subsurface flow. J. Geophys. Res. 109, F04010.
6) Kramer, S.L. 1988. Triggering of Liquefaction Flow Slides in Coastal Soil Deposits. Engineering Geology, 26, 17−31.
7) Kramer, S.L., Seed, H.B. 1988. Initiation of Soil Liquefaction under Static Loading Conditions. J. Geotech. Engrg., 114, 412−430.
8) Duncan, J.M., Wright, S.G., Wong, K.S. 1991. Slope Stability during Rapid Drawdown. H. Bolton Seed Memorial Symposium, BiTech Publishers, Vol. 2, 253−272.
9) Sumer, B. M. (Ed) 2007. Special issue on Liquefaction around Marine Structures. Journal of Waterway, Port, Coastal, and Ocean Engineering, 133, No. 1.
10) Zen, K. and Yamazaki, H. 1990. Mechanism of wave-induced liquefaction and densification in seabed”. Soils Found., 30(4), 90−104.
11) Zen, K. and Yamazaki, H. 1991. Field observation and analysis of wave-induced liquefaction in seabed. Soil Found., 31(4), 161−179.
12) Yeh, H., Kato, F., and Sato, S. 2001. Tsunami scour mechanisms around a cylinder. Tsunami Research at the End of a Critical Decade (Ed: G.T. Hebenstreit), Kluwer Academic Publishers. 33−46.
13) Yeh, H., Tonkin, S., Heller, E., Arduino, P., Kato, F., and Sato, S. 2004. Mechanisms of scour induced by tsunami runup. Proceedings of Seccond International Conference on SCOUR and EROSION, Singapore. Vol. 2, 464−471.
14) Tonkin, S., Yeh, H., Kato, F., and Sato S. 2003. Tsunami Scour around a Cylinder: an Effective Stress Approach. Journal of Fluid Mechanics, 496, 165−192.
15) Carrier, G.F., Wu, T.T. and Yeh, H. 2003. Tsunami Runup and Drawdown on a Plane Beach. Journal of Fluid Mechanics, 475, 79−99.
16) Vanoni, V.A. 1975. Suspension of sediment. In: Sedimentation Engineering, V.A. Vanoni, Ed., ASCE, Manuals and Reports on Engineering Practice No. 54, 66−91.
17) Julien, P.Y. 2002. River Mechanics. Cambridge University Press, Cambridge, 434pp.
18) Sumer, B.M., J. Fredsøe, S. Christensen and M. T. Lind. 1999. Sinking/floatation of pipelines and other objects in liquefied soil under waves. Coastal Engineering 38: 53−90.
19) Terzaghi, K. 1956. Varieties of Submarine Slope Failures. Harvard Soil Mechanics Series 52, Cambridge, MA.
20) Carslaw, H.S. and Jaeger, J.C. 1959. Conduction of Heat in Solids. Oxford University Press, Oxford, 510pp.
21) Atwater, B. F. 1987. Evidence for Great Holocene Earthquakes Along the Outer Coast of Washington. Science, 236, 942−944.
22) Bourgeois, J., Hansen,T.A., Wiberg, P.L., and Kauffman, E.G. 1988. A tsunami deposit at the Cretaceous-Tertiary boundary in Texas. Science, 241, 567−570.
23) Huntington, K., Bourgeois, J., Gelfenbaum, G., Lynett, P., Yeh, H., and Weiss, R. 2007. Sandy signs of a tsunami’s onshore depth and speed. EOS, Trans. Amer. Geophys. Union, 88, 577−578.
24) Lighthill, M. J. 1963. Introduction. Boundary Layer Theory. In Laminar Boundary Layer (Ed: Rosenhead, L.), Oxford University Press, 46−113.
25) Lighthill, M. J. 1986. An Informal Introduction to Theoretical Fluid Mechanics. Clarendon Press, Oxford. 260 pp.
26) Okusa, S. 1985. Wave-induced stress in unsaturated submarine sediments. Geotechnique, 35, 517−532.
27) Rahman, M. S. 1991. Wave-induced instability of seabed: Mechanism and condition. Mar. Geotech., 25, 771−787.
28) Jeng, D. S. 2003. Wave-induced Sea Floor Dynamics. Appl. Mech. Review, ASME, 56 (4), 407−429.
29) Hibberd, S, and Peregrine, D.H. 1979. Surf and run-up on a beach: a uniform bore. J. Fluid Mech., 95, 323−345.
30) Madsen, O. S. 1974. Stability of a Sand Bed under Breaking Waves. Proceedings of International Conference for Coastal Engineering, ASCE, Chapter 45, 776−794.
31) Henderson, F.M. 1966. Open Channel Flow. Macmillan Publishing Co., New York, 522pp.
32) Schlichting, H. 1979. Boundary-Layer Theory (7th Ed). McGraw Hill Book Co., New York, 817pp.
106