tssp abad fillone developing a public transit scheduling
TRANSCRIPT

TSSP
2014
22nd Annual Conference of the Transportation Science Society of the Philippines
Iloilo City, Philippines, 12 Sept 2014
Developing a Public Transit Scheduling Tool for Metro Manila Bus Operators
Raymund Paolo B. ABAD Science Research Specialist 1 Civil Engineering Department De La Salle University 2401 Taft Avenue, Manila, 1004 E-mail: [email protected]
Alexis M. FILLONE Assistant Professor Civil Engineering Department De La Salle University 2401 Taft Avenue, Manila, 1004 E-mail: [email protected]
Abstract: Philippine public land transport services are regulated by authorities through granting of franchises and setting of routes and fares. The operating structure enables a competitive environment among various operators with a wide range of operating schemes. Metro Manila bus operators would normally run their entire fleet since they perceive that this would generate the highest possible revenue. However, operating the entire fleet usually results to an unscheduled service. The lack of theoretical knowledge on bus service scheduling hinders local transport service providers in improving their service. Hence, this paper proposes a public transport scheduling tool for bus operators as a solution to these present issues. The tool could be run on spreadsheet software such as Microsoft Excel. It would enable users to input on-board passenger counts, to analyze and graph travel characteristics of a transit line, and to generate an efficient operating schedule. The scheduling tool and the theoretical background considered in its construction are discussed in this paper. The tool was tested using actual sample data from buses operating along the busiest corridor in Metro Manila – Epifanio Delos Santos Avenue (EDSA). Data analysis shows that the routes evaluated have: (1) low utilization ranging from 56-66% of the service capacity; (2) an average passenger trip length that accounts to about 24% of the trip length; (3) travel delays are about 32% of the total travel time. With such results, it is therefore beneficial to adjust the service capacity of the selected routes. Finally, the limitations of this scheduling tool were examined and corresponding recommendations were made to further improve it.
Key words: transit scheduling, computer-aided scheduling, public transport 1. INTRODUCTION The role of public transportation is crucial to the development of any rapidly growing metropolis. In the case of the Philippine capital region, the economic and demographic growth of Metro Manila challenges and puts pressure to the existing public transport infrastructure and system. In order to maintain the growth and development of the economy, PT services should adapt to the growing demand for passenger travel within the metropolis. This paper discusses the development of a public transit scheduling tool that would provide transport operators a better understanding of their current transport service operations and provide an operating schedule to improve their level of service to transit users. Bus transport service is regulated through a franchising system by the Land Transportation Franchising and Regulatory Board (LTFRB). The LTFRB controls the bus operators by granting Certificates of Public Conveyance (also known as franchises) and transit fares by setting fare matrices on regular bus services. Under the current system, transit service providers have free-reign with the implementation of their operating schemes. Table 1 show that around 42% (5,343 of the 12,595) the buses in operation service the Metro Manila area. It also shows that buses operating EDSA have the greatest number of operating vehicles in the region. Among the routes in Metro Manila, the Alabang-SM Fairview via Lagro Commonwealth and the Baclaran-Novaliches via EDSA Mindanao Avenue were considered as the busiest inter-city routes. The franchising system, high number of operators and the highly perceived passenger demand for transport service have led to a competitive environment between transport operators and the practice of various illegal acts such as the operation of illegal or colorum buses or the

Proceedings of the 22nd Annual Conference of the Transportation Science Society of the Philippines (2014)
proliferation of “kabit system” (practice of illegally using a different company’s bus franchise to another company). Although the number of operating vehicles is high in the area, it neither translates to a highly utilized transport system nor good quality of service to transit users. It is known that inter-city bus operators do not practice scheduling of operations. The lack of information to commuters may lead to low satisfaction of transport service because of arbitrary arrival times at terminals or bus stops.
Table 1. Number of Bus Operators and Buses in Manila
Route Number of Operators
Number of Buses
Manila EDSA Route 266 3,711 Manila Non-EDSA Route 127 1,632 Manila Provincial North Bound 371 3,684 Manila Provincial South Bound 357 3,568 TOTAL 1,122 12,595
Source: LTFRB The planning process of public transport operation includes four sequential activities: (1) network route design, (2) timetable development, (3) vehicle scheduling, and (4) crew scheduling (Ceder, 2007). It is advised to conduct the four activities in sequential order to maximize the productivity and efficiency of the bus operation. Considering the complexities of each activity, each process can be individually accomplished with each output being fed to its successor. Despite the benefits of public transport planning, local bus operators rarely conduct these processes due to the lack of expertise in the field and due to the costs that are attributed to it. Hence, operations are based on passenger demand that is only based on perception and experience. In order to address the existing gap between methodologies in public transit scheduling and transport operators, a basic spreadsheet tool was developed. This tool would allow local transit providers record and analyze passenger data, and schedule departures of vehicles from a terminal or depot. Aside from the fact that almost all computers have spreadsheet programs such as Excel, spreadsheet programs have the ability to hold and analyze vast amounts of data while making it simple and user-friendly. The researchers believe that these tools would allow managers have a better understanding of the performance of their transit operations. They would also be adept in making informed decisions with regards to managing their bus fleet. In the end, commuters would benefit from this tool as it aims to make transport service more reliable in the form of consistent and scheduled departures and arrivals. This tool is tested in existing routes using actual passenger data and is shown in the succeeding sections. 2. LITERATURE REVIEW This paper focuses on the development of a spreadsheet tool that enables transit managers record passenger data, analyze travel characteristics of transit service along the route, and schedule operations based on recorded passenger data. The researchers pursue the idea that managers need to have a better understanding of their fleet operations in order to improve the quality of bus services. This section would note the various studies related in transit scheduling and timetabling. Scheduling of operations normally include the process of frequency setting and headway determination. For purposes of consistency, frequencies are set on specific time periods. Time periods are in accordance to the hour of the day and the day of the week (Guihaire & Hao, 2008) as demand may vary within the day and week. Four approaches were made by Furth and Wilson (1982) in determining headways of transit routes. The determined headways were policy headways, headways from maximum passenger load and vehicle capacity, headways wherein the ratio of revenues and expenses will not exceed a predetermined value, and headways designed to attain a desired passenger- or vehicle-miles. A heuristic method that included setting frequencies to a minimum in order to satisfy passenger demand and then uniformly increasing the

Proceedings of the 22nd Annual Conference of the Transportation Science Society of the Philippines (2014)
frequencies on different lines such that all vehicles would be used were proposed by Han and Wilson (1982). Four methods of frequency setting were suggested by Ceder (1984) depending on how data were gathered. Frequencies were determined by dividing the design load to the desired occupancy of the vehicle. The design loads can be the maximum daily load, the maximum hourly load, the average passenger load from the load profile diagram, or the passenger load at a certain percentage along the route. Finally, Vuchic (2007) proposed the use of peak hour coefficients in determining the hourly passenger volume used in frequencies setting. This coefficient takes into account the variability of the passenger volume within each time period. In the local setting, a variety of studies that focus on scheduling of transit services were conducted. The studies of Kang, et al.,(2011) and Dumalus, et al., (2012) adopted the methods of proposed by Ceder (1984) and Vuchic (2007) in the scheduling of jeepney services in Metro Manila and Iloilo City, respectively. Both researches used scheduling of transport service as a means of reducing the number of operating vehicles as it contributes to the congestion of roadways in their respective areas. Scheduling of services were also used to integrate transit operations and reduce passenger waiting times and transit dwell times at an intermodal terminal (Abad & Fillone, 2013). All of the cited researches made use of a programming language or a spreadsheet software in their validation of results and production of schedules. The results, however, cannot reach local transport providers due to the latter’s inability to interpret the actual results of the respective studies. The developed spreadsheet tool would address this gap by letting operators have actual control of producing their own schedule from their own data.
3. METHODOLOGY AND DEVELOPMENT OF THE SPREADSHEET TOOL
The program was developed from a spreadsheet program – Microsoft Excel. Aside from the fact that it is the most widely used spreadsheet software, Excel allows user to add programmable functions by running macros through an add-in called Visual Basic for Applications. The program was patterned after the three components of the scheduling process determined by Vuchic (2007). These components and its corresponding steps on the scheduling tool are shown in Figure 1.
Figure 1. Components of the Scheduling Process and Corresponding Steps in the Scheduling Tool
Proceedings of the 22nd Annual Conference of the Transportation Science Society of the Philippines (2014)
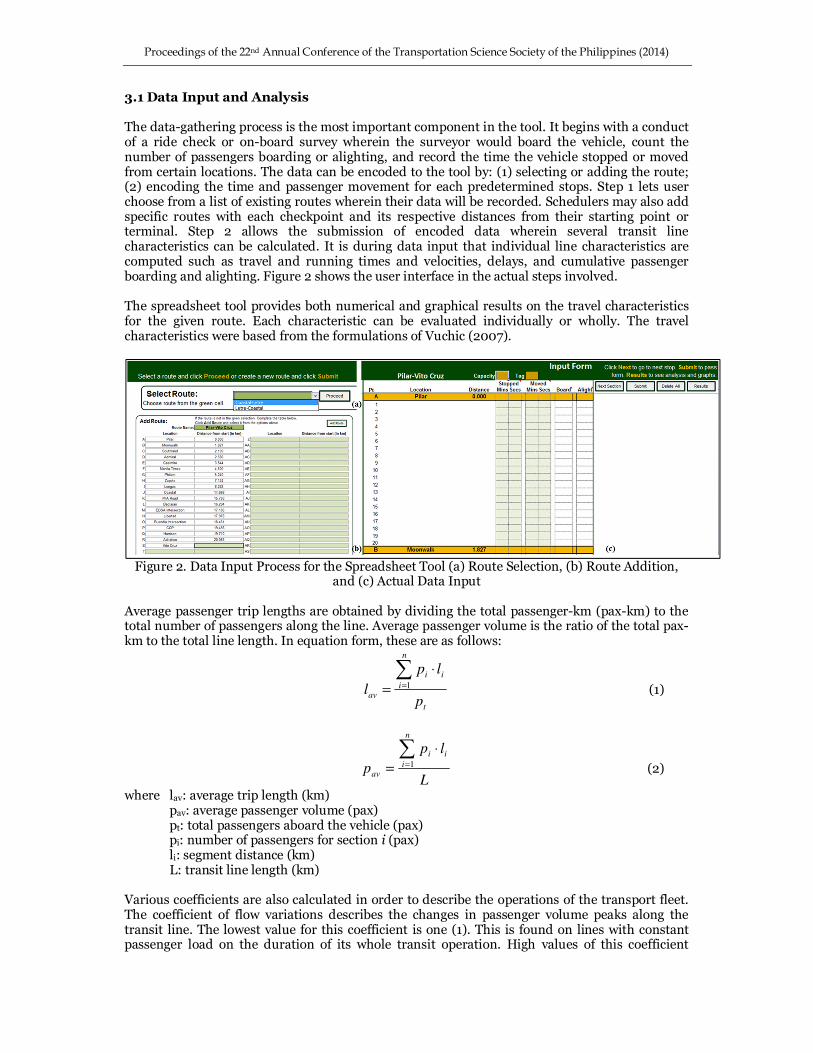
3.1 Data Input and Analysis The data-gathering process is the most important component in the tool. It begins with a conduct of a ride check or on-board survey wherein the surveyor would board the vehicle, count the number of passengers boarding or alighting, and record the time the vehicle stopped or moved from certain locations. The data can be encoded to the tool by: (1) selecting or adding the route; (2) encoding the time and passenger movement for each predetermined stops. Step 1 lets user choose from a list of existing routes wherein their data will be recorded. Schedulers may also add specific routes with each checkpoint and its respective distances from their starting point or terminal. Step 2 allows the submission of encoded data wherein several transit line characteristics can be calculated. It is during data input that individual line characteristics are computed such as travel and running times and velocities, delays, and cumulative passenger boarding and alighting. Figure 2 shows the user interface in the actual steps involved. The spreadsheet tool provides both numerical and graphical results on the travel characteristics for the given route. Each characteristic can be evaluated individually or wholly. The travel characteristics were based from the formulations of Vuchic (2007).
Figure 2. Data Input Process for the Spreadsheet Tool (a) Route Selection, (b) Route Addition, and (c) Actual Data Input
Average passenger trip lengths are obtained by dividing the total passenger-km (pax-km) to the total number of passengers along the line. Average passenger volume is the ratio of the total pax-km to the total line length. In equation form, these are as follows:
t
n
i
ii
avp
lp
l∑
=
⋅
= 1 (1)
L
lp
p
n
i
ii
av
∑=
⋅
=1
(2)
where lav: average trip length (km) pav: average passenger volume (pax) pt: total passengers aboard the vehicle (pax) pi: number of passengers for section i (pax) li: segment distance (km) L: transit line length (km) Various coefficients are also calculated in order to describe the operations of the transport fleet. The coefficient of flow variations describes the changes in passenger volume peaks along the transit line. The lowest value for this coefficient is one (1). This is found on lines with constant passenger load on the duration of its whole transit operation. High values of this coefficient
Proceedings of the 22nd Annual Conference of the Transportation Science Society of the Philippines (2014)
express low average load factors. This indicates that a desirable adjustment is needed to the offered service supply to existing passenger demand. Mathematically, the coefficient of flow variations is expressed as the ratio of the maximum volume to the average passenger volume shown as:
∑=
⋅
⋅==
n
i
iiav
f
lp
PL
p
P
1
maxmaxη (3)
where: ηf: coefficient of flow variations Coefficient of passenger exchange describes the portion at which passenger volumes are exchanged along the transit line. It is the ratio of the total passengers who embarked the bus along the line but did not replace alighting passengers. Mathematically, it is calculated as:
∑=
−−
=n
i
iit
tx
abP
P
1
η (4)
where: ηx: coefficient of passenger exchange bi, ai: number of passengers who boarded / alighted at segment i (pax) The lowest value of 1 is attained when there is no passenger exchange along the line. The greatest value of this coefficient is realized when all passengers are exchanged at each stop along the route (L/lav). Coefficient of work utilization shows the ratio of the utilized work to the offered transport work. The value simply represents how much of the offered capacity is actually utilized along the line. The load factor for each segment varies along the line and reaches its maximum at the maximum load section (MLS) where Pmax is found. The coefficient is expressed as:
LC
sp
w
wi
ii
o
p
⋅
⋅
==
∑α (5)
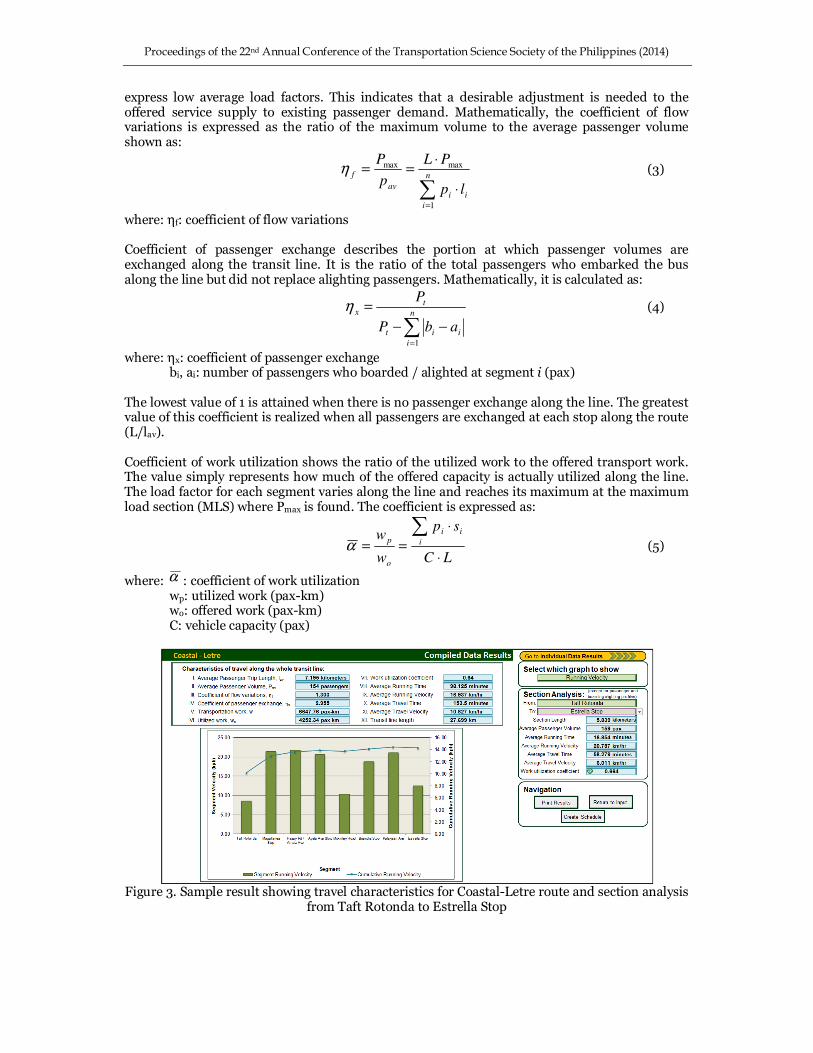
where: α : coefficient of work utilization wp: utilized work (pax-km) wo: offered work (pax-km) C: vehicle capacity (pax)
Figure 3. Sample result showing travel characteristics for Coastal-Letre route and section analysis
from Taft Rotonda to Estrella Stop

Proceedings of the 22nd Annual Conference of the Transportation Science Society of the Philippines (2014)
3.2. Scheduling Process and Output The scheduling process is divided into three crucial steps: (1) frequency and headway determination, (2) timetable construction, and (3) vehicle scheduling. Headways are calculated using Equation 6. Load factor for Equation 6 can have a value up to 1.2 to account for standing passengers which is estimated at 20% of the total seating capacity. The actual value resulting from Equation 6 is compared to existing policy headways (if available). The minimum value will be adopted and converted to the nearest clock headway (6, 7.5, 10, 12, 15, 20, 30, and 60). The rounding down to the nearest clock headway is done to make the schedule easier to remember. Frequencies of departures for each time periods are then calculated after determining the design headway. The tool evaluates the new load factor under the proposed condition using Equation 8. The evaluation is done to let transit operators assess if the proposed schedule would yield higher utilization of supply. Timetables are automatically generated by the program depending on the parameters (capacity, load factor, terminal time). In order to effectively schedule each operating vehicle (trip-blocking), the tool would calculate the number of operating vehicles for operation using Equation 9. The formulations for each process are as follows:
d
v
P
Cnh
⋅⋅⋅=
α60 (6)
h
f60
= (7)
v
d
Cn
hP
⋅⋅
⋅=
60α (8)
++
⋅=
=
60
Tf
h
TNTU (9)
where: h: headway (minutes) α: load factor, user-dependent (for equation 6 only) n: number of transit units, n = 1 for buses Cv: vehicle capacity (passengers) Pd: passenger design volume (passengers) f: frequencies of departures (vehicles/hour) T: cycle time or two-way operating time including time spent on terminals (minutes) 4. DATA ANALYSIS AND RESULTS The performance of the program was assessed by running sample data on various routes that operate along EDSA. As part of the analysis of this paper, transit service operations were evaluated using the program. Table 2 shows the summary results for the sample data.
Table 2. Travel characteristics for selected routes
Route (Sample Size) Line length, km
lav, km
Pav, pax
ηηηηf ηηηηx αααα
Fairview - Coastal via Commonwealth (12) 35.702 10.2 403 1.449 2.414 0.56 Coastal - Fairview via Commonwealth (14) 33.74 8.496 436 1.684 2.358 0.519
Alabang – Fairview (10) 43.342 10.765 396 1.76 2.287 0.66 Fairview – Alabang (9) 43.55 11.95 286 1.574 2.315 0.831 Letre – Coastal (4) 31.74 6.276 150 1.875 2.698 0.625 Coastal – Letre (4) 27.69 7.164 153 1.308 2.955 0.637
Letre - Coastal via Ayala (6) 33.345 5.84 193 1.774 3.219 0.537 Coastal - Letre via Ayala (6) 29.91 6.435 227 1.815 2.561 0.631
Coastal - Fairview via Mindanao (6) 31.08 8.089 214 1.725 2.227 0.596 Fairview - Coastal via Mindanao Ave (6) 32.42 7.687 219 1.926 2.19 0.609
Proceedings of the 22nd Annual Conference of the Transportation Science Society of the Philippines (2014)
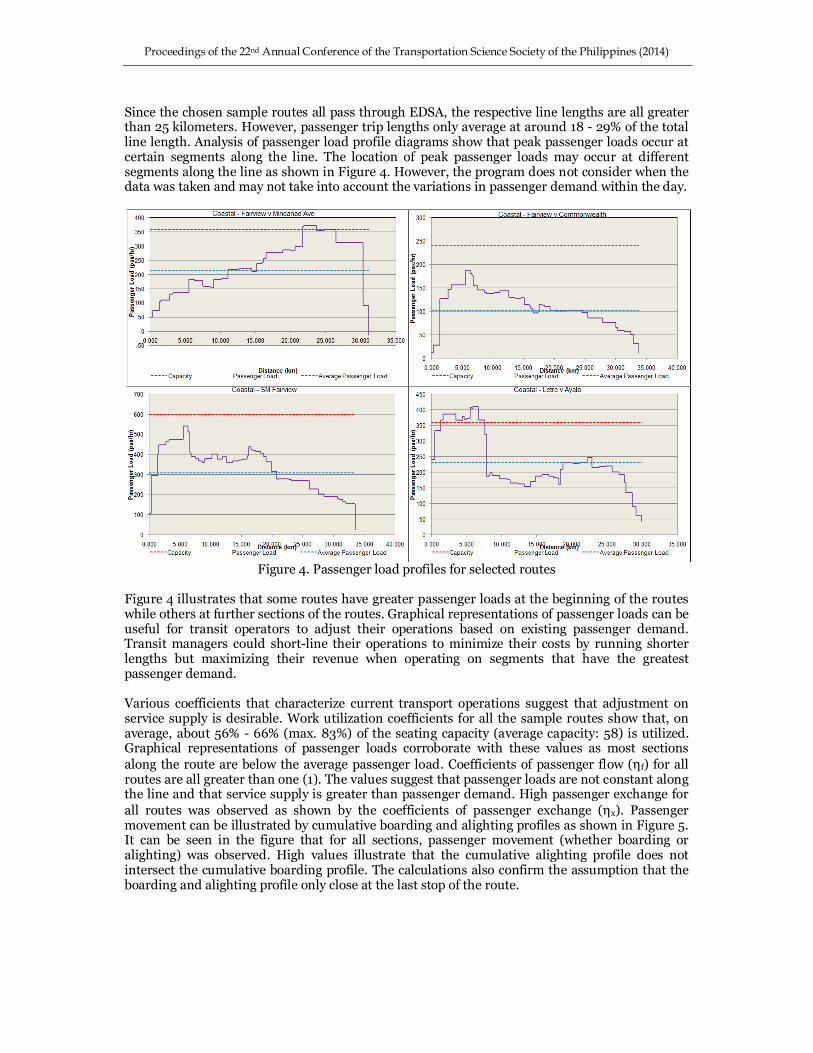
Since the chosen sample routes all pass through EDSA, the respective line lengths are all greater than 25 kilometers. However, passenger trip lengths only average at around 18 - 29% of the total line length. Analysis of passenger load profile diagrams show that peak passenger loads occur at certain segments along the line. The location of peak passenger loads may occur at different segments along the line as shown in Figure 4. However, the program does not consider when the data was taken and may not take into account the variations in passenger demand within the day.
Figure 4. Passenger load profiles for selected routes
Figure 4 illustrates that some routes have greater passenger loads at the beginning of the routes while others at further sections of the routes. Graphical representations of passenger loads can be useful for transit operators to adjust their operations based on existing passenger demand. Transit managers could short-line their operations to minimize their costs by running shorter lengths but maximizing their revenue when operating on segments that have the greatest passenger demand. Various coefficients that characterize current transport operations suggest that adjustment on service supply is desirable. Work utilization coefficients for all the sample routes show that, on average, about 56% - 66% (max. 83%) of the seating capacity (average capacity: 58) is utilized. Graphical representations of passenger loads corroborate with these values as most sections
along the route are below the average passenger load. Coefficients of passenger flow (ηf) for all routes are all greater than one (1). The values suggest that passenger loads are not constant along the line and that service supply is greater than passenger demand. High passenger exchange for
all routes was observed as shown by the coefficients of passenger exchange (ηx). Passenger movement can be illustrated by cumulative boarding and alighting profiles as shown in Figure 5. It can be seen in the figure that for all sections, passenger movement (whether boarding or alighting) was observed. High values illustrate that the cumulative alighting profile does not intersect the cumulative boarding profile. The calculations also confirm the assumption that the boarding and alighting profile only close at the last stop of the route.

Proceedings of the 22nd Annual Conference of the Transportation Science Society of the Philippines (2014)
Figure 5. Boarding and Alighting Profiles for Select Routes
Performance of operations can also be assessed by analyzing the time and speed it took for the vehicle to operate along the line. The average route running and travel times and velocities are presented in Table 3.
Table 3. Running and Travel Times and Velocities for Select Routes
Route Line length, km
Running time, mins
Running velocity, km/hr
Travel time, mins
Travel velocity, km/hr
Total Delay, mins
Fairview - Coastal via Commonwealth
35.702 85.63 25.02 125.4 17.08 39.77
Coastal - Fairview via Commonwealth
33.74 81.38 24.88 117.9 17.17 36.52
Alabang - Fairview 43.342 82.34 31.583 122.107 21.297 39.767 Fairview - Alabang 43.55 94.54 27.64 137.2 19.05 42.66 Letre - Coastal 31.74 108.8 17.5 163.1 11.68 54.3 Coastal - Letre 27.69 98.125 16.937 153.45 10.83 55.325
Letre - Coastal via Ayala 33.345 93.53 21.39 143.9 13.9 50.37 Coastal - Letre via Ayala 29.91 99.82 17.98 162 11.08 62.18 Coastal - Fairview via
Mindanao 31.08
76.89 24.25 107.7 17.31 30.81
Fairview - Coastal via Mindanao Ave
32.42 87.61 22.2 117.7 16.53 30.09
The values in Table 3 show that running times for the vehicles exceed one hour for one way operation. The excessive running time can be attributed to poor traffic conditions and the lengthy operating routes. The delays were accounted in the computed travel time. On the average, travel delays contribute to 32% of the travel time. Delays can be either a result of traffic flow, traffic controls, waiting at stops for passengers, or passenger boardings or alightings. The excessive running and travel times resulted to low running and travel velocities. Low velocities may lead to passengers being unsatisfied with bus transit performance and may consider shifting to alternate modes of transport such as private vehicles or rail transit (MRT3). The program allows transit providers to see the relationships between the times and velocities for the whole route or for selected segments along the route. In Figure 6, the time and velocity graphs are shown for the route Coastal – Letre via Ayala for the section with the maximum passenger load occurring in one of the stops. The graphs show that the greatest delay occurred at the beginning of the route. This is true since the main terminal for passengers going to EDSA is located along these segments. The high travel times on these sections result to significantly low travel velocities. Eventually, velocities increase along the Baclaran – DFA Libertad section wherein there is only minimal delays. The maximum passenger load section occurred at Mayapis section. From the terminal to the maximum load section, the work utilization coefficient is 1.041. The value shows that all seats in this section are utilized and around 4% of the total passengers are standing.

Proceedings of the 22nd Annual Conference of the Transportation Science Society of the Philippines (2014)
Figure 6. Passenger Load Profile, Running Time and Travel Delays for Coastal - Letre via Ayala
(Coastal to Mayapis Section) The spreadsheet tool allows the user to adjust the operating characteristics of their fleet in the scheduling of bus service operations. These characteristics include terminal time (time a vehicle is in the terminal before being dispatched for service), policy headway (headway that is being currently implemented, if any), utilization coefficient, and capacity of each vehicle (may vary if different bus manufacturers were used). Design passenger volume would depend on the data that was used in the program. Shown in Figure 7 is the interface for the scheduling of the route Coastal – Fairview via Mindanao Avenue. For this route, 6 buses per vehicle operating on 10-minute headways were suggested. Although the prescribed utilization coefficient for the route is 1.2, the anticipated coefficient of utilization for this kind of operation is 1.03. The difference could be a result of the variations in work utilization along certain sections in the route. Nevertheless, the operation ensures that almost all seats would be utilized in this type of operation. Scheduling results for the sample data are shown in Table 4.
Figure 7. User Interface for Transit Scheduling (Coastal - Fairview via Mindanao)

Proceedings of the 22nd Annual Conference of the Transportation Science Society of the Philippines (2014)
Table 4. Scheduling Results for Selected Routes
Route Current frequency,
veh αααα
Proposed frequency,
veh Headway
Estimated
αααα
Fairview - Coastal via Commonwealth
12 0.56 10 6 0.97
Coastal - Fairview via Commonwealth
14 0.519 10 6 1.2
Alabang - Fairview 10 0.66 10 6 1.16 Fairview - Alabang 9 0.831 8 7.5 0.94 Letre - Coastal 4 0.625 3 20 1.11 Coastal - Letre 4 0.637 4 15 1.2
Letre - Coastal via Ayala 6 0.537 5 12 1.14 Coastal - Letre via Ayala 6 0.631 6 10 1.14 Coastal - Fairview via
Mindanao 6 0.596 6 10 1.03
Fairview - Coastal via Mindanao Ave
6 0.609 6 10 1.17
Note: Schedules assume the following operating characteristics: terminal time: 5 minutes, policy headway: 30 minutes, utilization coefficient: 1.2, and seating capacity: 60
Tabulated above are the scheduling results for the selected EDSA routes. The scheduled service resulted to an equal or smaller number of frequencies. The adjustment on service frequencies is a result of the reduction on the offered capacity. Other routes have maintained their service frequencies but adjustments can be further made on the headways between vehicles. The resulting schedules also resulted to a high utilization of service (90 – 120%). The values show that the scheduled service increased the utilization coefficient by about 82%. 5. CONCLUSIONS AND RECOMMENDATIONS Bus transit operations should be improved in view of the high passenger volume passing through major thoroughfares especially EDSA. The researchers developed a public transit scheduling tool based on Microsoft Excel in order to address the gap between existing literature on public transport scheduling and the tools that local transport providers currently use. With this, transport providers can analyze and manage their own data and schedule their operations based on their own operating constraints. Sample results show that the program is very capable in handling extensive data input and analysis. The use of macros made repetitive tasks simpler and made analysis easier. Graphical and numerical results would let transit managers have an actual assessment of their current transport operations. The sample results also show the condition of bus operations for selected bus routes that pass through EDSA. First, utilization of buses along the whole line is limited to 40%-60% of the total service supply being offered. Second, average trip lengths of passengers are around 30% of the total trip length. Third, maximum load sections are concentrated on certain segments of the total route. At such points, passenger loads are above average while the remainder has low passenger volumes, often, below average. Fourth, delays account to around 33% of the total travel time which makes travel slow and unsatisfactory for passengers. Despite travel delays being a result of a variety of factors, transit operators can adjust their operations to minimize travel delays. The data show that bus operations are underutilized as a result of poor operating conditions. The short trip lengths can be viewed negatively since bus fares are higher than its rail (MRT) counterparts. As a result, there is a need to adjust or to improve the operations of current bus service providers. Proposed adjustments on service capacities resulted to the decrease in frequencies of service. The reduction of service capacity and provision of scheduled service yielded to an anticipated increase of utilization by 82%. The scheduling tool is still a work in progress and is being improved to add more features for operational analysis such as cost and revenue estimation and sustainability and co-benefit
Proceedings of the 22nd Annual Conference of the Transportation Science Society of the Philippines (2014)
analysis. There is also a need to address certain issues on the data-input stage of the spreadsheet tool such as data input for skipped segments or sections on on-board surveys. The researchers are also addressing certain compatibility issues in order to make sure that the program would run across all Excel platforms. The researchers highly suggest the creation of stand-alone executable programs using other programming languages. Other methods of performing transit scheduling that can be programmed are highly recommended.
ACKNOWLEGEMENT This paper is part of the ongoing PUBFix project which is being funded by the Philippine Council for Industry, Energy, and Emerging Technology Research and Development of the Department of Science and Technology (DOST-PCIEERD).
REFERENCES
Abad, R. & Fillone, A., 2013. Improved transport terminal utilization: The case of Jordan Wharf,
Guimaras, Philippines. Proceedings 6th ATRANS Young Researchers' Forum, Bangkok, Asian Transportation Society.
Ceder, A., 2007. Public Transit Planning and Operation: Theory, Modeling, and
Practice. Oxford, UK: Elsevier, Butterworth-Heinemann. Department of Transportation and Communications, 2012. Development of a Mega Manila
Public Transportation Planning Support System, Manila: DOTC. Dumalus, A., Go, A. & Samonte, R., 2012. Proposed scheduling scheme for public transport
system in Iloilo City. Manila: De La Salle University - Manila. Furth, P. G. & Wilson, N., 1982. Setting frequencies on bus routes: Theory and Practice.
Transportation Research Record, Issue 818, pp. 1-7. Guihaire, V. & Hao, J.-K., 2008. Transit Network Design and Scheduling: A Global Review.
Transportation Research - Part A, 42(10), pp. 1251-1273. Han, A. & Wilson, N., 1982. The allocation of buses in heavily utilized networks with overlapping
routes. Transportation Research - Part B, pp. 221-132.. Kang, H., Mascarina, K. & Padua, M., 2011. Proposed scheduling of jeepney operations in Malate
Area. Manila: De La Salle University - Manila. Office, N. S., 2014. National Capital Region Quickstat , Manila: National Statistics Office. Vuchic, V., 2005. Urban transit: Systems and Technology. New Jersey: John Wiley & Sons.