tsa data around the world · 2020-01-21 · paraguay), 3-6 october 2005, unwto launched a...
TRANSCRIPT

Capitán Haya, 42 ♦ 28020 Madrid ♦ España♦ Tel. (34) 91 567 81 00 ♦ Fax (91) 571 37 33 ♦ [email protected] ♦ www.unwto.org
TSA DATA AROUND THE WORLD
WORLDWIDE SUMMARY
Statistics and Tourism Satellite Account (TSA) Programme
Madrid, June 2010

Table of contents
Pages Presentation........................................................................................................... 1-3 1. The TSA project around the world: overall comments .............................. 4-9 2. Present status ........................................................................................... 10-34 3. Selected aggregates and tables of results.............................................. 35-76 T.1. Basic aggregates ................................................................................. 36-38 T.2. TSA related indicators.......................................................................... 39-42 T.3. Internal tourism consumption ............................................................... 43-48 T.4. Domestic tourism consumption ............................................................ 49-55 T.5. Inbound tourism consumption .............................................................. 56-62 T.6. Tourism gross value added, by industry .............................................. 63-69 T.7. Tourism gross value added, by components..............................................70 T.8. Domestic supply................................................................................... 71-76 4. Complementary information ...................................................................77-109 5. Understanding and measuring tourism economic contribution:
basic glossary ........................................................................................110-113 Annex. Basic tourism data and macroeconomic aggregates.....................114-191

1
Presentation A few years ago, in fact during the preparation of the Fourth UNWTO International Conference on Tourism Statistics “The Tourism Satellite Account (TSA): Understanding Tourism and Designing Strategies” held in Iguazu (Argentina / Brazil / Paraguay), 3-6 October 2005, UNWTO launched a consultation among countries that had initiated a process of compilation of a TSA. In that opportunity, this initiative concerned around 60 countries that received a first questionnaire which answers were presented at this Conference. One of the consensus reached as a consequence of such presentation was that UNWTO should begin to disseminate TSA data and find the most practical way to request from countries (basically National Tourism Administrations _NTAs_ and National Statistical Offices _NSOs_) an assessment of the compliance of their TSA compilation methods to the TSA recommended methodological framework (in effect, a brand validation approach). After the Iguazú Conference, UNWTO requested a second set of clarifications and information about the TSA design from those countries that had answered the first questionnaire. In this occasion, this initiative was used to get some insights about potential misunderstandings regarding the TSA conceptual framework. The answers provided an important input for the updating process of the existing TSA official recommendations that lead finally to the TSA: RMF 2008. The richness of the information gathered by means of these two initiatives (partly reproduced in chapter 4 “Complementary information” of this document), as well as the identification of those issues that were attributable to different conceptual gaps between the different frameworks, namely the SNA, BPM and TSA, paved the way to a final contribution to the International Workshop on Tourism Statistics held in Madrid from July 17 to July 20, 2006. During the 2006/2007 period, the Interagency Coordination Group on Tourism Statistics integrated by UNSD, OECD, Eurostat, IMF, ILO, WTO, UNECLAC and UNWTO used this input to review and close most of the gaps that had been identified. This effort of the international community culminated with the approval in 2008 by the UN Statistical Commission of the new International Recommendations for Tourism Statistics 2008 and the updated Tourism Satellite Account: Recommended Methodological Framework 2008 document. Time has now come to present a new publication gathering a selective set of TSA data produced by different countries around the world. As most compilers and users of TSA data know, the formal structure of the TSA is determined by a set of predefined tables (10 tables) presenting basic statistical data of economic nature related to the activity of visitors and the industries supplying the goods and services that they acquire. Therefore, UNWTO has requested from countries, represented by both their National Tourism Administration and their National Statistical Office, to provide the official TSA results using the referred tables guaranteeing at the same time that the concepts used are along the line of those recommended internationally.

2
A significant number of countries (48) participated in this first attempt to collect TSA data, although only 39 have done so. In addition to those countries, a complementary ser of other thirteen (13) have been identified as having developed a TSA:
− Eurostat has published in 4 volumes, the research carried on during 2009/2010 entitled “Tourism Satellite Accounts in the European Union” (4 volumes). This research has identified eight (8) additional countries. (http://epp.eurostat.ec.europa.eu/portal/page/portal/tourism/methodology)
− Asia-Pacific Economic Cooperation (APEC) has also launched a research
on TSA implementation in APEC member countries. Based on the results of the 2009 APEC TSA survey, a set of five (5) additional countries have been identified. (http://publications.apec.org/publication-detail.php?pub_id=1025)
Consequently, a total of 60 countries have been identified by early 2010 as having already produced or are currently developing a TSA exercise. Other countries could also be added to this list in the coming two years.
Australia Austria Bahamas Belgium Brazil Canada Chile China Colombia Cuba Cyprus Czech Republic Denmark Dominican Republic Ecuador
Egypt El Salvador Estonia Finland France Germany Greece Guatemala Honduras Hong Kong, China Hungary India Indonesia Ireland Israel
Italy Jamaica Japan Kazakhstan Korea, Republic of Latvia Lithuania Malaysia Mexico Morocco Netherlands New Zealand Nicaragua Oman Peru
Philippines Poland Portugal Romania Saudi Arabia Singapore Slovakia Slovenia Spain Sweden Switzerland Taiwan, Prov. of ChinaUnited Kingdom United States Uruguay
“TSA data around the World” will be published regularly every three years and only in English. The second expected release (by the second quarter of 2012) should take into account the new TSA:RMF 2008 in terms of tables, terminology and other type of clarifications with respect to the former 2000 official document. This publication is the first step taken by UNWTO towards the design of a process of technical assistance on-line for the countries that have answered the questionnaire in which support will be provided to their national projects (either through the exchange of best practices, exchange of national experiences, responses to requests of clarification concerning the new 2008 Tourism Satellite Account: Recommended Methodological Framework, etc.). In the course of year 2010, we hope to be in the position to launch such initiative, as well as others to be defined, by which UNWTO would put into practice its responsibility as the custodian of the TSA brand.

3
The document is structured as follows:
- Chapter 1 provides some overall comments and observations on the TSA data collected.
- Chapter 2 offers the results from the questionnaire specifically designed
for this publication that obtained the participation of 48 countries in answering questions about their present status in TSA development.
- Chapter 3 presents, in a comparative manner, the collection of TSA data
submitted to UNWTO by those countries (39) which had initiated a TSA exercise by the time of completing the questionnaire and encompasses a subgroup of the countries covered in Chapter 2.
- Chapter 4 includes, for some of them, complementary information that
might be of interest for readers.
- A basic glossary explaining tourism and the measurement of its economic contribution is given in Chapter 5 after which an Annex provides some additional country-by-country information on basic macroeconomic aggregates and tourism data, as in the UNWTO Compendium of Tourism Statistics.

4
1. The TSA project around the world: overall comments1 As explicitly mentioned in the cover of the present document, UNWTO is presenting a preliminary draft of TSA data as compiled by countries around the world. These general comments are preliminary for three different types of reasons:
- Various additional countries have already carried out a TSA exercise or are in a very advanced stage towards releasing TSA data in the coming months (that would be the case of countries such as Brazil, the Dominican Republic, Greece, etc.). This will hopefully compensate the present bias by which the present 39 countries that provided data (the list of them is provided on page 35) refer mostly to statistically advanced countries, half of them being European countries;
- We hope also that these new responses help us to focus on some comments
regarding the advance of the TSA Project, on the basis of the answers to the six series of tables that have been used to structure chapter 2: “Present status”;
- Finally, UNWTO has already developed and would like to advance more with
respondents in a systematic review of the data provided as the present review has identified some inconsistencies or lack of understanding of the requested data as mentioned in the following paragraphs, some of which have already been corrected within the review process developed during May 2009, and others could easily be improved as a system of exchange of information is been put in place.
The fact that data was collected using a Word file, and not as an Excel file, explains many inconsistencies that may have derived from different processes of transcription and from difficulties in putting data in the proper category. With an Excel file, it is easier to check right away if the expected relationships between variables are met. This should be corrected from our part in the future, and we hope to be able to provide more guidance on how to derive the data in the requested tables from the standard TSA tables as some data reflect some misunderstanding in that respect. • For instance, internal tourism consumption is not always equal to the sum of
inbound tourism consumption and outbound tourism consumption. This might be conceptually correct as internal tourism consumption also includes non assigned conceptual adjustments associated with non market production, and imputed values such as second homes. Nevertheless, in some cases, the difference was excessively big to be assignable to these adjustments items.
• When confronting, in Table 2 of Chapter 3, the percentages of internal tourism
that inbound tourism consumption and domestic tourism consumption represent with the numerical data that had been provided in Table 1, the figures did not always match.
• In some cases, the data concerning employment could not be readily understood:
Table 1 asked for total employment in the economy (the unit of account used was not easily understandable, but was to be 1000) while Table 2 asked for the proportion of jobs in the tourism industries as related to total jobs in the economy,
1 This chapter has been drafted by Marion Libreros, UNWTO consultant

5
and there again, the data was not always clear nor consistent with other shares such as that of Gross value added of tourism industries in Gross Value added, or that of tourism gross value added in gross value added.
• Regarding the breakdowns by products or by forms of tourism for internal tourism
consumption, inbound tourism consumption and domestic tourism consumption, the breakdown provided not always summed up to 100% as expected, and, when inconsistent, often summed up to more than 100%.
• Table 6 focuses on getting information on tourism value added by industry, and
asks for Gross Value Added and Tourism Gross Value added, in both cases expressed as a % of the corresponding total (Total Gross Value Added for all the economy, Tourism Gross Value Added in the case of tourism) over all industries. Various countries seem to have had difficulties in understanding the table, and often the total percentages over all industries did not add to 100%.
Because of all these reasons, these overall comments are also preliminary and refer exclusively to those countries that provided the data included in chapter 3 “Selected aggregates and tables of results” and refer to those that passed the consistency checks. UNWTO can only thank and congratulate all the countries that, willingly, have provided their data for this first comparative exercise and thus put their work under public scrutiny in a feasible manner. We hope that countries will find it interesting to see how the structure of tourism within their economy is different (or similar) to that observed in others, and may be, derive conclusions, either on their compilation procedures, or on the particularities of their tourism activity. One first interesting conclusion can be derived from the analysis of the data of the 39 participating countries: All of them provided information on both inbound and domestic tourism consumption, although not all in absolute value (case of Sweden that only provided this information in % form), but not all calculated outbound tourism consumption. In fact, 7 out of 39 countries do not provide information on this variable. In most cases in which this estimation is not done, it is because it has no effect on the internal tourism activity that seems to be of major interest for most countries’ tourism policy. It is interesting to give a ranking of countries in terms of the number of requested data that have actually been provided: in that classification, Finland leads the pack with Australia, Mexico, Latvia, Poland and Lithuania following close by. The US trails behind, as well as Sweden, mainly because they do not compile the breakdown of tourism consumption between tourists and same day visitors, and their information on the Gross Value Added of the Tourism Industries is neither provided globally nor by industries. It is also interesting to rank countries taking into consideration the relative importance of inbound tourism consumption within internal tourism consumption. For 9 out of the 39 countries with fully consistent information, inbound tourism consumption represented more than 50% of internal tourism consumption, that is, inbound tourism consumption was more important than domestic tourism consumption. The leader within this category was Cyprus (with an 84%), a relatively small island country that is

6
an important international tourism destination. Important tourism destination such as Spain (42,9%), France (29,9%) or the United States (12,4%) did not meet this condition, showing that although leading international destination, and leaders in terms of total inbound tourism consumption, they have an important population, with a high level of income and that importantly takes domestic tourism trips. The case of Mexico is also worth mentioning as Inbound tourism consumption only represents 13,7% of internal tourism consumption, which shows the relative importance of domestic tourism for this economy. For Austria, a country with a relatively small population, the shares of domestic and of inbound tourism consumption were almost even, which tends to show also in this case that their domestic tourism is proportionally very high. Looking now at the importance of international tourism consumption as compared to the international trade of goods and services, the level of this relationship depends both on that of the numerator as well as that of the denominator. Countries might have an important level of inbound tourism consumption, but if they are strongly involved in international trade of goods and services, then this relationship might be lower than expected (case of the USA (7,8%), France (9,7%) or Ireland (4,0%) for example). The classification obtained is not wholly surprising: • Regarding the relationship between inbound tourism consumption and exports of
goods and services, here again Cyprus ranks first, with inbound tourism consumption representing 33% of the value of exports of goods and services; in second and third position come New Zealand and Spain, for which this relationship is 18,3 and 18,2 % respectively. Then comes Australia, with a 13,3%, followed by Israel (12,1%) and Austria (11%);
• Regarding the relationship between outbound tourism consumption and imports of
goods and services, taking into consideration that some countries do not compile outbound tourism consumption, the ranking is the following: Cyprus is still ahead, with a 11,0%, reflecting maybe the relative low level of other imports of goods and services, followed by Australia (10,2%); then come many different countries which share is between 5 and 8 %, with a great variety of situations: middle income level countries such as Ecuador or Colombia, reflecting may be the existence of high and middle income population, eager to travel abroad, high income countries such as France, Spain or Japan, reflecting both components, of relatively high propensity to travel abroad, combined with a high level of imports, followed very closely by Canada and the United States, with corresponding types of behaviours.
Looking now at the breakdown of tourism consumption by products, some comments need to be made: • Countries have shown difficulties in applying the classification of consumption
expenditure as recommended in TSA-RMF 2000, in particular in the case of miscellaneous tourism characteristic services, other services and goods as many countries have merged the three categories. Nevertheless, even the coverage of the remaining categories lacks the requested homogeneity to make comparisons globally consistent: for instance, the services provided by second homes are not in all cases measured, and when they are, they are not classified in the same category: for instance, in Australia, these services are classified as ”miscellaneous

7
tourism services”, while others usually consider such services within accommodation services; Canada includes vehicle fuel within transportation (within a functional type of classification, not according to the nature of the product) a view which is hardly shared by other countries. The classification of goods has been also different from country to country, so that it is not possible to compare what has been done. A more serious situation also occurs, serious because it has to do, not only with the structure of consumption, but also with its level, some countries have not been able to breakdown the value of packages used by inbound visitors into its different components: a part to be excluded from inbound tourism consumption as it does not concern any transaction between a non resident and a resident of the country of reference, and the remaining value that is part of inbound tourism consumption (case of the Czech Republic for instance);
• Some countries (Poland, the Philippines, and New Zealand) only consider the
consumption of tourism characteristic services within tourism consumption. As a consequence, not only are other non tourism characteristic services and goods missing from the measurement of tourism consumption, but the relative shares of the items that are shown in all cases are distorted in the comparison. Additionally, their overall level of tourism consumption is undervalued.
• From table 3, and notwithstanding the earlier considerations (in particular what
relates to second homes that might or might not be included under accommodation services), it is interesting to see the relative weight of the expenditure in accommodation services, in internal tourism consumption, in domestic tourism consumption and in inbound tourism consumption: it is expected that such share should represent an important portion of tourism consumption in all circumstances, and that the share for domestic consumption should be smaller than for inbound tourism consumption, taking into consideration that non-residents would more frequently use paying accommodation than non paying accommodation (with family and friends) or frequently use a more expensive (higher quality) type of accommodation. This is actually true in most countries, with a spread that might be quite high as for instance in the Kingdom of Saudi Arabia (50,4% for inbound tourism consumption vs. 17,4% in the case of domestic), Austria (46,8% (inbound) against 19,4% (domestic)), Cyprus (30,3% (inbound) against 10,0%(domestic)), Canada (23,9% (inbound) against 12,2%(domestic)) or India (17,8% (inbound) against 3,5% (domestic)). Nevertheless, there are some important tourism destination where this does not happen, as Spain (25,1% (inbound) against 31,6% (domestic)), France ((26,0% (inbound) against 28,1% (domestic)), Israel (20,1% (inbound) against 28,1% (domestic)), or the United States (15,0% (inbound) against 23,0% (domestic)), only to name a few. What could be the explanations for such differences?
o For each country, the difference might have different explanations: in
the case of Spain, when looking more closely at the structure of tourism consumption in each of the cases (inbound and domestic), it appears that passenger transport services, other services and goods represent a significantly higher share within inbound tourism as compared to domestic tourism, that can be used as an explanation to a lower fraction of expenditure dedicated to accommodation (as no comparison is possible, with the presently collected information, on the absolute level of per capita expenditure).

8
o In the case of France, the strong difference in the shares of consumption dedicated to cultural services (12,2% (inbound) (among the highest…) against 7,7%(domestic)), and goods (28,7% (inbound) against 18,3 %(domestic)), within inbound tourism consumption could be an explanation to the lower share dedicated to accommodation, as no comparison is possible, with the presently collected information, on the absolute level of per capita expenditure.
o In the case of Israel, it might be necessary to review the breakdown of
consumption by product, as there seems to be some anomalies, for instance in the share of travel agencies services (21,1% in the case of domestic tourism consumption) that might indicate that packages might not have been unbundled. Packages usually include accommodation plus other services.
• Regarding tables 4 and 5, asking for the breakdown of tourism consumption
between consumption by tourists and that by same-day visitors, it appears that many countries, either still have not included same-day visitors within their tourism statistics, because of the particularities attached to their estimation, or have not broken down the total expenditure of visitors between tourists and same-day visitors, or, as is the case of Australia, consider that the number of inbound same-day visitors might be negligible and do not intend any estimation neither of their flow, nor of their expenditure. In the end, there is only information for 19 countries in the case of domestic visitors, and 17 in the case of inbound visitors. Because same-day visitors do not usually spend in accommodation (with the exception of few countries, there is no consumption of these services, and when it exists, its share is very small), the structure of consumption of same-day visitors is structurally different from that of tourists. Structures vary considerably from country to country and no predominant pattern seems to emerge.
• Within the 26 countries that compiled table T6 showing, on the one hand, the
shares of the Value Added of Tourism Characteristic Activities within the total value added of the country, and the shares of each activity within Tourism Gross Value Added (TGVA), a certain number of country data were not consistent: either because the shares were clearly inconsistent, (adding to more than 100%) or being clearly unappropriate, or because only tourism characteristic activities provided goods and services to visitors, which is another type of inconsistencies. 2 of the “consistent ones” (the Philippines and New Zealand) were found in which tourism characteristic industries represented less than 50% of total Tourism Gross Value Added, which leads to questioning the relevance of tourism characteristic industries to tourism, or points rather to a lack of understanding of the aggregate. In other countries, the share of tourism characteristic industries was surprisingly high, often associated with a poor or lack of estimation of consumption of non tourism characteristic products. As a simple average of the validated responses (that, as have been said, is not a statistically representative sample…), the tourism value added of tourism industries would represent around 62% of tourism Gross Value added.

9
• On the other hand, a few countries clearly did not understand the question regarding the share of tourism characteristic activities and other activities providing goods and services to visitors within total Gross Value Added, as in some cases (3 countries) Tourism Characteristic Activities represented more than 50% of total Gross Value Added of the economy which is clearly an error of interpretation. In Cyprus and Spain, that have already been identified as countries for which tourism occupies an important place within their economy, this share amounts to 22,4% and 22,2 % respectively. As a simple average of the validated responses (that, as have been already said, is not a statistically representative sample…), the value added of tourism industries would represent around 9% of total value added of the economy.
• Countries providing data on the share of Tourism Gross Value Added (TGVA)
regarding total Gross Value Added (GVA) of tourism industries rank from 57% up to 83%, but only few of them (15) identified the components of Tourism value added, of which only 10 provided fully consistent information. Within these 10 countries, there is an important spread in the relative shares of compensation of employees, that ranges between 21,3% in Mexico, to 67,8% in Canada. Countries in which this share exceeds 50% are European countries, and Canada, whereas in all other regions represented within the validated data, this share is smaller than 50%. It should be interesting to be able to complement this with more information regarding the characteristics of employment, principally in tourism characteristic activities, but also in other activities, in particular the importance of non paid family workers as well as a comparison with the components of Gross Value Added of the country of reference, so as to be able to give an opinion on Tourism Gross Value Added as compared to the total economy.
• Finally, Table 8 focuses on the product breakdown of tourism consumption and
its share in the corresponding supply. It is evident that there is a need for metadata (i.e. all the related methodological information) and further refinement in some of the tourism shares presented. Consequently, the data provided show that as long as there is no full implementation of the product breakdown as indicated by the international recommendations on the TSA, comparisons must be made with great caution.
These results and the comments on the specific content of the variables provided by most of the countries that follow show that, despite the efforts that have been made over the years, both at international and national level, there is still a very large field of potential progress towards full international comparability of the TSA results among countries. Nevertheless, taking into consideration the emphasis of the new 2008 IRTS and TSA-RMF on the area of classifications of products and activities, and in recognizing more clearly the difference between internationally comparable tourism characteristic activities and products, and those products and activities, though tourism characteristic, that are country-specific, we hope that a future comparison will bring more conceptually close measurements.

10
2. Present status List of Countries2
Argentina ___________________________________________ ARG Australia ____________________________________________ AUS Austria______________________________________________ AUT Bahamas____________________________________________ BHS Belgium_____________________________________________ BEL Canada _____________________________________________ CAN Chile _______________________________________________ CHL China ______________________________________________ CHN Colombia____________________________________________ COL Costa Rica __________________________________________CRI Cuba _______________________________________________ CUB Cyprus _____________________________________________ CYP Czech Republic_______________________________________ CZE Denmark ____________________________________________ DNK Ecuador ____________________________________________ ECU Egypt ______________________________________________ EGY Finland _____________________________________________ FIN France______________________________________________ FRA Honduras ___________________________________________ HND India _______________________________________________ IND Indonesia________________________________________ IDN Ireland______________________________________________ IRL Israel_______________________________________________ ISR Italy ________________________________________________ ITA Jamaica ____________________________________________ JAM Japan ______________________________________________ JPN Kazakhstan __________________________________________KAZ Latvia ______________________________________________ LVA Lithuania ____________________________________________ LTU Malaysia ____________________________________________ MYS Mexico _____________________________________________MEX Morocco ____________________________________________ MAR Netherlands _________________________________________ NLD New Zealand_________________________________________NZL Oman ______________________________________________ OMN Philippines __________________________________________ PHL Peru _______________________________________________ PER Poland______________________________________________ POL Romania ____________________________________________ ROU Saudi Arabia _________________________________________ KSA Slovakia ____________________________________________ SVK Slovenia ____________________________________________ SVN South Africa _________________________________________ZAF Spain_______________________________________________ ESP Sweden_____________________________________________ SWE Switzerland __________________________________________CHE Trinidad and Tobago___________________________________TTO United States ________________________________________USA
2 UNWTO released a questionnaire proposed specifically for the design of the preliminary version of TSA data around the World. It was sent by August 2008 to 84 countries for which there was some type of information that a TSA was under construction: 48 countries sent their replies to this first module about their respective TSA present status (Indonesia has requested some extra time to complete them). Six questions were included: only the answers to Q1 and Q2 are tabulated following this table. Answers to the rest of the questions, as well as comments provided to Q1 and Q2, are presented after this table in “TSA present status: complementary information” (page 13).

11
AR
G
AU
S
AU
T
BH
S
BE
L
CA
N
CH
L
CH
N
CO
L
CR
I
CU
B
CY
P
(¶) (¶) (¶) (¶) (¶) (¶) (¶) (¶) (¶) (¶) (¶) (¶)
(¶) (¶) (¶) (¶) (¶) (¶) (¶) (¶) (¶) (¶) (¶) (¶)
(¶) 2005 2002 2003 2002 2000 2006Latest year available
Q.2
Comments
Check all boxes that apply.
Based on supply and use tables (SUT) and/or input-output tables (IO).
Interface between visitor consumption andcorresponding supply of goods and services has beenfully articulated and includes the correspondingreconciliation table (TSA:RMF Table 6).
General methodological approach
Publication of TSA data includes estimates of indirectand induced effects.
TSA is based on econometric or statistical modelingtechniques. If this is the case, please indicate theapproach and techniques used.
Q.1
Two or more exercises with no integration in NationalAccounts-- but going beyond the first experimentalexercise (or pilot study).
First experimental exercise (or pilot study)
Indicate which one of these cases applies to your presentTSA project.
Two or more exercises with integration in NationalAccounts annual programme of work. In this case,please provide length of TSA historical seriesavailable and completeness regarding TSA:RMFtables.
Comments
Present stage of implementation
CZ
E
DN
K
EC
U
EG
Y
FIN
FR
A
HN
D
IND
IDN
IRL
ISR
ITA
(¶) (¶) (¶) (¶) (¶) (¶) (¶) (¶) (¶) (¶) (¶)
(¶) (¶) (¶) (¶) (¶) (¶) (¶) (¶) (¶) (¶)
2006 2006 2003 2006 2005 2005 2000 2004Latest year available
Q.2
Comments
Check all boxes that apply.
Based on supply and use tables (SUT) and/or input-output tables (IO).
Interface between visitor consumption andcorresponding supply of goods and services has beenfully articulated and includes the correspondingreconciliation table (TSA:RMF Table 6).
General methodological approach
Publication of TSA data includes estimates of indirectand induced effects.
TSA is based on econometric or statistical modelingtechniques. If this is the case, please indicate theapproach and techniques used.
Q.1
Two or more exercises with no integration in NationalAccounts-- but going beyond the first experimentalexercise (or pilot study).
First experimental exercise (or pilot study)
Indicate which one of these cases applies to your presentTSA project.
Two or more exercises with integration in NationalAccounts annual programme of work. In this case,please provide length of TSA historical series availableand completeness regarding TSA:RMF tables.
Comments
Present stage of implementation

12
JAM
JPN
KA
Z
LV
A
LT
U
MY
S
ME
X
MA
R
NL
D
NZ
L
OM
N
PE
R
(¶) (¶) (¶) (¶) (¶) (¶) (¶)
(¶) (¶) (¶) (¶) (¶)
2007 2004 2006 2005 2007 (¶) 2007 2001Latest year available
Q.2
Comments
Check all boxes that apply.
Based on supply and use tables (SUT) and/or input-output tables (IO).
Interface between visitor consumption andcorresponding supply of goods and services has beenfully articulated and includes the correspondingreconciliation table (TSA:RMF Table 6).
General methodological approach
Publication of TSA data includes estimates of indirectand induced effects.
TSA is based on econometric or statistical modelingtechniques. If this is the case, please indicate theapproach and techniques used.
Q.1
Two or more exercises with no integration in NationalAccounts-- but going beyond the first experimentalexercise (or pilot study).
First experimental exercise (or pilot study)
Indicate which one of these cases applies to your presentTSA project.
Two or more exercises with integration in NationalAccounts annual programme of work. In this case,please provide length of TSA historical seriesavailable and completeness regarding TSA:RMFtables.
Comments
Present stage of implementation
PH
L
PO
L
RO
U
KS
A
SV
K
SV
N
ZA
F
ES
P
SW
E
CH
E
TT
O
US
A
(¶) (¶) (¶) (¶) (¶) (¶) (¶) (¶) (¶) (¶) (¶)
(¶)
(¶) (¶) (¶) (¶) (¶) (¶) (¶)
2007 2002 2001 2005 (¶) (¶) (¶) 2007 2005 (¶)Latest year available
Q.2
Comments
Check all boxes that apply.
Based on supply and use tables (SUT) and/or input-output tables (IO).
Interface between visitor consumption andcorresponding supply of goods and services has beenfully articulated and includes the correspondingreconciliation table (TSA:RMF Table 6).
General methodological approach
Publication of TSA data includes estimates of indirectand induced effects.
TSA is based on econometric or statistical modelingtechniques. If this is the case, please indicate theapproach and techniques used.
Q.1
Two or more exercises with no integration in NationalAccounts-- but going beyond the first experimentalexercise (or pilot study).
First experimental exercise (or pilot study)
Indicate which one of these cases applies to your presentTSA project.
Two or more exercises with integration in NationalAccounts annual programme of work. In this case,please provide length of TSA historical series availableand completeness regarding TSA:RMF tables.
Comments
Present stage of implementation
(█) No answer / (¶) Comments

13
TSA present status: complementary information
ARG
Q.1 Present stage of implementation: In August 2008 the Secretariat of Tourism of Argentina (SECTUR) and the National Statistics and Census Institute (INDEC)
signed an Addendum to the general agreement “Action Plan for the Development of the Tourism Satellite Account of Argentina (TSAA)” establishing actions leading up to the estimation of the TSA for Argentina. The timetable of the project was estimated as lasting from December 2008 to April 2010, and a joint working team comprising SECTUR and the National Accounts Directorate of INDEC was formed.
The preparation of the “Manual for the Implementation of the Argentina Tourism Satellite Account” prepared by National Accounts and Tourism experts and completed in 2006 was used as a background reference.
Q.2 General methodological approach: The TSAA will be estimated using the supply and use tables of the national accounts. 2004 will be the reference year. Q.3 Institution in charge for compilation: • Name: Secretariat of Tourism of Argentina and the National Statistics and Census Institute. • Comments: The estimation of the TSAA is to be carried out under an Interinstitutional Platform including SECTUR, INDEC, the Argentina
Tourism Chamber of Commerce and the National Directorate for Migrations. This platform is formalized in a framework cooperation agreement called “Action Plan for the Development of the TSAA”.
Within this framework, specific agreements (Addendums) are signed annually between SECTUR and INDEC, in which the objectives and the obligations of the parties are established. In the Addendums the statistical operations to be carried out during the year are set forth. • Survey on International Tourism • Survey on Hotel and Parahotel Occupancy • Household Survey on Tourism activity (conducted in 2006) • Estimation of the TSA (2009-2010)
The operations are coordinated and conducted through a joint team comprising SECTUR and INDEC. The funding of the annual operations is the responsibility of SECTUR and their technical execution is the responsibility of INDEC.
Q.4 Basic documentation: • TSA sources and methods documents: “Manual for the Implementation of the Argentina Tourism Satellite Account” • Other related publications and studies:
• Survey on International Tourism http://2016.turismo.gov.ar/wp_turismo/?page_id=520 – www.indec.gov.ar ) • Survey on Hotel and Parahotel Occupancy (http://2016.turismo.gov.ar/wp_turismo/?page_id=520 – www.indec.gov.ar ) • Household Survey on Tourism activity http://2016.turismo.gov.ar/wp_turismo/?page_id=520)
Q.6 Person in charge for TSA: • Name: Lic. Rodrigo Oliver. • Title: Coordinator of the Action Plan for the Development of the Argentina Tourism Satellite Account. • Organization: Secretariat of Tourism of Argentina. • E-mail: [email protected]
AUS
Latest year available of full scale ATSA: 2003-04 (1July 2003 to 30 June 2004 inclusive). Q.1 Present stage of implementation: Australian National Account: Tourism Satellite Account 1997-98 (ABS cat.no.5249.0), was the first Tourism Satellite Account
(TSA) for Australia and was released in October 2000. The TSA has since been published annually, with the most recent edition relating to 2006-07 (1 July 2006 to 30 June 2007 inclusive) released in April 2008. The next edition relates to the 2007-08 period and is scheduled for release in April 2009.
Given the detailed level of product and industry used in the Australian TSA (ATSA), it is not feasible to collect the detailed supply side data required to produce a full scale ATSA every year on a timely basis. A full scale benchmark using updated supply and use tables is conducted every 3 years. For the available TSA time series, benchmark years are 1997-98, 2000-01 and 2003-04. The next benchmark will be compiled with respect to 2006-07 in the production of the 2008-09 ATSA to be released in June 2010.
In the other years the demand side data combined with the supply relationships from the benchmark TSA are used to update the key results of the TSA.
Q.2 General methodological approach: As mentioned above, a full scale TSA compilation with a reconciliation between visitor consumption and the corresponding supply of goods and services is undertaken every three years with the benchmark compilation of the Australian TSA (ATSA). In the remaining years the demand side data combined with the supply relationships from the benchmark TSA are used to update the key results of the TSA.
Q.3 Institution in charge for compilation: • Name: Australian Bureau of Statistics. • Comments: Department of Resources, Energy and Tourism (RET) previously committed to provide ongoing funding for the compilation of
the TSA. The compilation of the TSA is resource expensive and has been supported by frequent Service Industry Surveys undertaken
by the ABS. e.g. for accommodation, cafes and restaurants, pubs and clubs etc. Q.4 Basic documentation - TSA sources and methods documents: • Explanatory notes for the Australian Tourism Satellite Account:
http://www.abs.gov.au/AUSSTATS/[email protected]/Lookup/5249.0Explanatory%20Notes12006-07?OpenDocument Q.5 Dissemination formats of TSA data: • Hard copy – Annual publication(/s):
• Title: Australian National Account: Tourism Satellite Account (ABS Cat. No. 5249.0). • Language(s): English. • Electronic – Internet - Website: http://www.abs.gov.au/AUSSTATS/[email protected]/DetailsPage/5249.02006-
07?OpenDocument Q.6 Person in charge for TSA: • Name: Darren Page. • Title: Assistant Director, Tourism Statistics Unit.

14
• Organization: Australian Bureau of Statistics. • E-mail: [email protected]
AUT
Q.1 Present stage of implementation: For years 1999 till 2005 TSA-data has been revised on a yearly basis. Since NA data for year (n) have been available in
August/September of year (n+1), provisional TSA results are available by November of the year (n+1), i.e., 2004 results were available in November 2005. The preliminary data are currently been revised within the scope of the most recent TSA-results (i.e. 2004 data within the 2005 results). Starting with year 2005 a 2-years-intervall has been envisaged (2007) and stated as being sufficient due to a rather stable development of the tourism industry in Austria.
Starting with year 2004 the economic analysis of the Austrian tourism was extended by estimating the direct and indirect effects of tourism on the overall employment (for the year 2003 only direct effects); results on the contribution of the tourism and leisure industry to the overall employment is available, therefore.
On a yearly basis a Working Group on tourism statistics, whose members are from local tourism and statistical authorities and other main data users, discusses issues related to tourism statistics in general, which also concern TSA-issues. On a more detailed level, TSA-relevant discussions occur within Statistics Austria (in particular NA-department) but also with other institutions, such as WIFO (as one of the compilers of TSA), the Austrian Central Bank (in view of TBoP) or the “Federal Ministry of Economics and Labour” (customer).
TSA for Austria does not deliver all the information for the 10 interlinked tables according to UN-TSA; the development has been concentrating on the “core TSA-Tables” which comprise: • TSA-Table 1: Inbound tourism consumption by products and categories of visitors • TSA-Table 2: Domestic tourism consumption by products and ad hoc sets of resident visitors • TSA-Table 4: Internal tourism consumption by products and types of tourism • TSA-Table 5: Production accounts of tourism industries and other industries • TSA-Table 6: Domestic supply and internal tourism consumption by products • TSA-Table 7: Employment in the tourism industries Mainly due to lack of data and lack of methodological guidelines the following TSA-Tables are not considered so far: • TSA-Table 8: Tourism gross fixed capital formation of tourism industries and other industries • TSA-Table 9: Tourism collective consumption by functions and levels of government Furthermore, the following TSA-Tables are not taken into account, but being planned for the near future: • TSA-Table 3: Outbound tourism consumption, by products and categories of visitors, since this Table is not part of the
internal tourism consumption; however, based on TBoP data (debit) and survey related outbound tourism respective calculations are going to be planned in 2009.
• TSA-Table 10: Non-monetary indicators Q.2 General methodological approach: As an extension of TSA concepts the “Austrian Institute of Economic Research” (WIFO)
is doing estimates related to the indirect effects of the tourism industry (including employment); furthermore, forecasting are done for the current year and the following year (i.e. based on data of year 2005, for 2006 and 2007). In addition, estimates are made regarding the direct and indirect leisure effects related to the overall economy (activities of residents within their usual environment).
Q.3 Institution in charge for compilation: • Name: Statistics Austria. • Comments: The development of a TSA for Austria is commissioned by the “Federal Ministry of Economic Affairs and Labour” (BMWA) on
a contractual basis which is also in charge of tourism. The project is undertaken in a joint project by Statistics Austria (STAT) and the “Austrian Institute of Economic Research” (WIFO) since 2001, starting with the reference year 1999.
The division of TSA tasks between both institutes is as follows: • Statistics Austria is mainly responsible for doing the basic TSA-calculation based on the UN-TSA, including mainly the
estimation of the direct effects of the tourism industry related to the overall economy (incl. employment effects) for the respective year (the most recent for 2005).
• As an extension of TSA concepts WIFO is mainly doing estimates related to the indirect effects of tourism (including employment), forecasts related to the current year and the coming year and estimates related to direct and indirect leisure effects.
Q.4 Basic documentation: • TSA sources and methods documents:
• A Tourism Satellite Account for Austria. The Economics, Methodology and Results. Statistics Austria and WIFO, Vienna 2001 (English only).
• A Tourism Satellite Account for Austria. The Economics, Methodology and Results 1999-2003. Statistics Austria and WIFO, ISBN 3-901400-55-9, Vienna 2002 (English only).
• A Tourism Satellite Account for Austria. Methods, Results and forecasting for the years 2000-2007, Statistics Austria/WIFO, Vienna 2006 (German only).
• Website link: http://www.statistik.at/web_de/static/ein_tourismus-satellitenkonto_fuer_oesterreich_020484.pdf. • Other related publications and studies: Franz A., Laimer P., "Tourism Economic Accounts and Real Net Output in
Tourism. Methods and Results", Tourism Journal (Lucius & Lucius, Stuttgart), 2nd year (1998), issue 3, pp. 313-334 (German).
Q.5 Dissemination formats of TSA data: • Hard copy:
• Annual publication: • Title:
A Tourism Satellite Account for Austria. Methods, Results and forecasting for the years 2000-2007, Statistics Austria/WIFO, Vienna 2006. Until reference year 2005: annually; 2007 onwards: biennially.
• Language(s): German (long version). English (summary version).
• Other (s):

15
• Title: Tourism in figures Austria 2007/08 (leaflet). • Periodicity: Annually. • Language(s): German/English (partly).
• Electronic - Internet: • Website:
http://www.statistik.at/web_de/statistiken/tourismus/tourismus-satellitenkonto/index.html (German). http://www.statistik.at/web_en/statistics/tourism/tourism_satellite_accounts/index.html (English).
• Table reference/title: (English; available in html, pdf and excel format): (1) The direct and indirect macroeconomic importance of tourism in Austria 2000 – 2007. (2) The direct macroeconomic importance of tourism in Austria 2000 – 2007. (3) Tourism consumption expenditure by non-resident and resident visitors in Austria 2000 – 2007.
• Language(s): German/English (partly). Q.6 Person in charge for TSA: • Name: Peter Laimer. • Title: Deputy Director, Directorate Spatial Statistics. • Organization: Statistics Austria. • E-mail: [email protected]
BHS
Q.1 Present stage of implementation: We had two preliminary exercises using National Accounts aggregates. The present stage involves the extraction of the TSA from the Supply and Use Tables.
Q.3 Institution in charge for compilation: The TSA in The Bahamas has a two-tiered inter-agency TSA Development Management Committee: a working committee and an approval committee. Agencies include the Department of Statistics, the Ministry of Tourism and Aviation and the Central Bank of The Bahamas. The TSA is mainly financed by the Ministry of Tourism.
Q.4 Basic documentation - TSA sources and methods documents: TSA Metadata document includes sources and methods of surveys used e.g. Business Establishments Surveys, Visitor Expenditure Surveys, BOP, Labour Force Reports, Bahamas Living Conditions Survey Government Treasury Accounts, etc.
Q.5 Dissemination formats of TSA data: • Hard copy - Annual publication:
• Title: The Bahamas Preliminary Tourism Satellite Account. (One issue) • Language(s): English.
• Electronic - Internet: • Website: tourismbahamas.org; centralbankbahamas.com • Table reference/title Tourism Satellite Account. • Language(s): English.
Q.6 Person in charge for TSA: • Name: Ms. Pamela Lowe. • Title: General Manager. • Organization: Ministry of Tourism. • E-mail: [email protected] • Name: Mrs. Clarice Turnquest. • Title: Assistant Director, Statistics. • Organization: Department of Statistics. • E-mail: [email protected]
BEL
Q.1 Present stage of implementation: Our last TSA project intended to compile regional TSAs for the 3 regions of Belgium. 5 TSA-tables (Tables 1, 2, 4, 5 and 6) will in the future be provided. A network of inter-institutional cooperation (National Bank
of Belgium, Regional Tourism Boards, Ministries responsible for Tourism…) has been put together for our last project. Q.2 General methodological approach: We used the national Supply-Use table for 2002 (regional Input-Output and Supply-Use
tables not available) as well as the regional accounts which compile production, intermediate consumption and value added. Q.3 Institution in charge for compilation: For the regional TSAs, there was an agreement between the two institutions responsible for the TSA compilation (Regional
Tourism Boards, that’s-to-say Toerisme Vlaanderen and Office de Promotion du Tourisme de Wallonie et de Bruxelles, and the Ministries in charge of Tourism) as well as an agreement between Office de Promotion du Tourisme de Wallonie et de Bruxelles and Toerisme Vlaanderen for the regional TSA compilation.
We are going to try to compile a TSA for each of the 3 regions (Brussels Region-Wallonia-Flanders) and on the basis of this, we will try to compile a TSA for Belgium.
Person in charge for TSA: • E-mail: franç[email protected] • E-mail: [email protected]
CAN
Q.1 Present stage of implementation: Canada has completed the national TSA for 1988, 1992, 1996, 1998, 2000 and 2002. Work on the 2004 TSA is underway.
For 1996 and 1998, a provincial/territorial TSA was done, with TSA tables for each of Canada’s 10 provinces and 2 territories (Canada has now 3 territories. The third territory of Nunavut was created in 1999 from the division of Northwest Territories).
TSA-RMF Tables 1-6 were completed in each exercise. Q.2 General methodological approach: Extensions of the TSA include:
1) The Provincial and Territorial Tourism Satellite Accounts for Canada (1996 and 1998) – a regional extension of the national TSA exercise to Canada’s 10 provinces and 2 territories (Canada has now 3 territories).
2) The National Tourism Indicators - a quarterly time series (1986Q1 +) of key indicators on tourism supply, demand, tourism gross value added - at current and constant prices - and tourism employment, all adjusted and unadjusted for seasonality, all benchmarked on the national TSA
3) The Government Revenue Attributable to Tourism – an annual time series (2000+) of revenue to all levels of government

16
in Canada from tax and non-tax sources that is directly attributable to tourism spending in Canada showing amounts due separately to resident and non-resident visitors
4) The Human Resource Module of the TSA – a detailed set of tables showing annual time series (1997+) on number of jobs, hours worked, and labour compensation (both, in total, and directly attributable to tourism spending) in tourism industries with breakdowns by occupation, full-time/part-time status, sex, age group and immigrant status
5) Work has started to link the TSA with Statistics Canada’s environmental accounts in order to estimate greenhouse gas emissions directly attributable to tourism.
Q.3 Institution in charge for compilation: • Name: Statistics Canada. • Comments:
The TSA is compiled by staff of the Income and Expenditure Accounts Division in the System of National Accounts Branch of Statistics Canada, Canada’s national statistical office, with funding from the Canadian Tourism Commission (CTC), Canada’s national tourism authority. The Canadian Tourism Commission also funds the National Tourism Indicators and the module on Government Revenue Attributable to Tourism. The linkage of the TSA with the environmental accounts and the work on the Human Resource Module of the TSA entail even broader partnerships among Statistics Canada and other national and regional government organizations and industry associations.
Q.4 Basic documentation: • TSA sources and methods documents.
Canadian Tourism Satellite Account Handbook National Tourism Indicators: Sources and Methods Revisions of the Canadian National Tourism Indicators
• Other related publications and studies. Canadian Tourism Satellite Account, 2002 National Tourism Indicators, Quarterly Estimates Human Resource Module of the Tourism Satellite Account, Update to 2006 Government Revenue Attributable to Tourism, 2000 to 2006 The 2001-2006 Revisions and Rebasing to 2002 of the National Tourism Indicators All these documents are available at Statistics Canada’s website: in English at: http://www.statcan.ca/english/nea-cen/pub/tour.htm in French at: http://www.statcan.ca/francais/nea-cen/pub/tour_f.htm
Q.5 Dissemination formats of TSA data- Electronic - Internet: • Website:
http://www.statcan.ca/english/nea-cen/pub/tour.htm http://www.statcan.ca/francais/nea-cen/pub/tour_f.htm
• Table reference/title: The Canadian Tourism Satellite Account. • Language(s): English and French. Q.6 Person in charge for TSA: • Name: Chris Jackson. • Title: Chief, Research and Development Projects and Analysis Section, Income and Expenditure Accounts Division, System
of National Accounts Branch. • Organization: Statistics Canada. • E-mail: [email protected]
CHL
Q.1 Present stage of implementation: The TSA in Chile does not form part of the national accounts programme because the institution that prepares the TSA,
SERNATUR, is distinct from those that prepare the latter. Nevertheless, the results of the TSA are reviewed in the light of those published by the Central Bank, Dept. of National Accounts. The difficulty lies in that these publications are not disaggregated and the breakdown for each tourism characteristic activity is not known. For example, Hotel and similar services as well as Restaurant and similar services appear together with Retail. The same is true of transport services, which are not broken down by type of transport.
Nevertheless, for the reference year of the TSA, it was possible to analyse it at the level of each Tourism Characteristic Activity, because the Central Bank was also compiling its reference year.
For the subsequent years, the Central Bank has been asked to share part of the basic information for the preparation of the national accounts which are also part of the production accounts of the Tourism Characteristic Activities, stated in Table 5.
The reference year is 2003, having made a projection for 2004 in a second exercise. An estimate for 2005 is available. Q.2 General methodological approach: The methodology applied in T6, assumes that all supply by TCA is for final consumption (no business tourism consumption).
Given that the TSA of Chile does not include an input-output framework, it is not possible to know intermediate demand for the output of such activities. In line with the work on national accounts, although this level is not large, it is necessary to state it explicitly.
Q.3 Institution in charge for compilation: • Name: SERNATUR. • Comments: The responsibility for preparing and publishing the TSA belongs to SERNATUR; the funding for it comes from
the Corporación de Promoción Turística de Chile. For the reference year 2003, there was an interinstitutional agreement with the Central Bank and the National Statistics Institute (INE). Both institutions continue to provide basic information requested yearly for the TSA compilation .
Q.4 Basic documentation: • TSA sources and methods documents: Tourism Satellite Account 2003, Projection 2004, Estimate 2005. Available at
www.sernatur.cl/portalinstitucional/estudios • Other related publications and studies: Inbound Tourism Behaviour, various years, same website. Q.5 Dissemination formats of TSA data: • Hard copy – Annual publication(s) – Title: Id. Q.4, August of 2007. • Electronic – Internet: Id. Q.4.

17
Q.6 Person in charge for TSA: • Name: Cecilia Arias De Pol. • Title: Commercial engineer. • Organization: SERNATUR. • E-mail: [email protected] • Name: Gabriela Morales Concha. • Title: Commercial engineer, consultant. • Organization: SERNATUR • E-mail: [email protected]
CHN
Q.1 Present stage of implementation: The Jiangsu TSA is a provincial TSA, using 2002 as the reference year, JSTSA-2002 is a full-fledged TSA, including all the accounts recommended by the TSA: RMF except tables 8 and 9. The JSTSA-2002 is an adaptation of the international guidelines to the Chinese context.
Q.3 Institution in charge for compilation: • Name: Jiangsu Provincial Tourism Bureau, & Xian Jiaotong University • Comments: Inter-institutional cooperation between the government and research institute is necessary. Q.4 Basic documentation - TSA sources and methods documents: • Research group for Jiangsu Provincial Tourism Satellite Account (2006). Report for Jiangsu Provincial Tourism Satellite
Account (JSTSA-2002). Nanjing: Jiangsu People’s Publishing House. • Research group for Regional TSA guidelines (2006). Guidelines for regional Tourism Satellite Account in China (2005).
Nanjing: Jiangsu People’s Publishing House. Q.6 Person in charge for TSA: • Name: H Name: Mingyao Li. • Title: Deputy Director. • Organization: Jiangsu Provincial Tourism Bureau. • E-mail: [email protected]
COL
Q.1 Present stage of implementation: A first exercise for year 2000 integrated with the national accounts annual program of work has been developed. A second exercise for year 2005 is underway. Q.3 Institution in charge for compilation: • Name: Departamento Administrativo Nacional de Estadística – DANE. Q.4 Basic documentation: • TSA sources and methods documents:
http://www.dane.gov.co/index.php?option=com_content&task=category§ionid=33&id=551&Itemid=1053 http://www.dane.gov.co/files/investigaciones/fichas/pib/ficha_sateli_turismo.pdf
• Other related publications and studies: Q.5 Dissemination formats of TSA data- Electronic – Internet: • Website: http://www.dane.gov.co/index.php?option=com_content&task=category§ionid=33&id=551&Itemid=1053 • Table reference/title http://www.dane.gov.co/files/investigaciones/pib/turismo/cst_00_00.xls • Language(s) Spanish. Q.6 Person in charge for TSA: • Name: Humberto Mora. • Title: Coordinator of Regional and Satellite Accounts. • Organization: DANE. • E-mail: [email protected]
CRI
Q.1 Present stage of implementation: The information of the tables of the Tourism Satellite Account is not available, as work is being done on the creation of an experimental account.
Q.3 Institution in charge for compilation: • Name: Costa Rica Tourism Board. • Comments: 1st Interinstitutional Committee: Institute for National Statistics and Census; Costa Rica Tourism Board; Central
Bank of Costa Rica and Directorate-General for Migrations. Q.4 Basic documentation: • TSA sources and methods documents: • Other related publications and studies: www.visitecostarica.com Q.5 Dissemination formats of TSA data- Comments: There has been no dissemination of the results. Q.6 Person in charge for TSA: • Name: Orlando Muñoz Recalde. • Title: Information Management. • Organization: Costa Rica Tourism Board. • E-mail: [email protected]
CUB
Q.1 Present stage of implementation: An exercise was carried out in 1997 and was part of the calculations of the change of the base year for the National Accounts. Since then, the collection of information has proceeded as well as the calculation of relative indicators that are used for different purposes, even when they are not, strictly speaking, placed within the format of TSA tables.
Q.2 General methodological approach: For the TSA the information collected as part of the System of Statistical Information (SIE-N) was used, as well as the accounting records of tourism entities, specific research on activities such as transport, private accommodation, and certain other specific studies, with the aim of complying with the TSA-RMF.
Q.3 Institution in charge for compilation: • Name: National Statistics Office (ONE). • Comments: The National Statistics Office provides the registry of all tourism related entities through its Registry of Budgeted
Enterprises and Units (REEUP), as well as the collection of the necessary data through forms prepared for that purpose and that form part of SIE-N. The ONE processes the information, and distributes it to its users in the form of a database or through consolidated information that is posted on ONE’s website. In this case it is the Ministry of Tourism that is responsible for the administrative platform that ensures the provision of the information, as well as for the decision-making based on the results.
Q.4 Basic documentation :

18
• TSA sources and methods documents: • International Movement of Passengers. • Receipts from International Tourism. • Accommodation at tourism facilities. • Selected Accounting Indicators. • Indicators of Average Occupancy.
• Other related publications and studies: • International visitor arrivals (Monthly). • Main International Tourism Indicators (Quarterly). • Tourism. Indicators by Territory (Biannual). • Cuba’s Statistical Yearbook (AEC)(Annual). • Economic and Social Outlook of Cuba (Annual).
• Comments: The forms, as well as the methodological indications and the publications are available on ONE’s website: http://www.one.cu/
Q.5 Dissemination formats of TSA data: • Hard copy - Annual publication:
• Title: Statistical Yearbook of Cuba (AEC). • Language(s): English and Spanish.
• Electronic – Internet – Website: http://www.one.cu/ Q.6 Person in charge for TSA: • Name: María Isabel Arocha Santana. • Title: National Statistician “A” • Organization: National Statistics Office (ONE) • E-mail: [email protected]
CYP
Q.1 Present stage of implementation: TSA tables 1 to 6 are available from 2003 to 2006 and we are currently working on the TSA tables 7 to 10 for the same years.
Q.3 Institution in charge for compilation: • Name: Statistical Service of Cyprus. • Comments: The TSA project was implemented with the cooperation of CTO (Cyprus Tourism Organisation) and the Central
Bank of Cyprus. Q.4 Basic documentation : • TSA sources and methods documents
• Survey On Passenger Departures – http://www.mof.gov.cy/mof/cystats • Survey On Passenger Arrivals – http://www.mof.gov.cy/mof/cystats • Survey On Outbound Arrival • Household Budget Survey • Supply And Use Tables
• Other related publications and studies: Q.6 Person in charge for TSA: • Name: Dora Kyriakides. • Title: Chief Statistics Officer. • Organization: Statistical Service of Cyprus. • E-mail: [email protected]
CZE
Q.1 Present stage of implementation: TSA tables 1 to 7 are fully covered whereas table 10 is only partially covered. TSA tables are compiled annually and data for years 2003 to 2006 are available. All data are preliminary and will be revised. In addition to the 10 tables recommended in the TSA, a Tourism Employment Module is compiled. Q.2 General methodological approach: TSA figures are calculated only at national level, no regional breakdown is available at the moment. Only direct effects are measured and published. Indirect effects are not calculated. Leisure activities are not considered
either. Q.3 Institution in charge for compilation: • Name: Czech Statistical Office. • Comments: The Czech TSA is compiled by Czech Statistical Office in cooperation with the Ministry for Regional
Development which finance border surveys for the measurement of inbound tourism Q.4 Basic documentation: • TSA sources and methods documents:
• The Czech TSA http://www.czso.cz/csu/redakce.nsf/i/tabulky_satelitniho_uctu_cestovniho_ruchu (Methodology of the Czech TSA is available only in Czech language; tables with results are available in Czech/English version).
• The Czech National Accounts http://www.czso.cz/eng/redakce.nsf/i/gdp_national_accounts_ekon • Other related publications and studies: Q.5 Dissemination formats of TSA data: • Hard copy – Other (s):
• Title: “Tourism Satellite Account in the Czech Republic 2003-2005”. (Methodology and tables of the Czech TSA; data in this publication have already been revised)
• Periodicity: Irregular. • Language(s): Czech.
• Electronic – Internet: • Website: http://www.czso.cz/csu/redakce.nsf/i/tabulky_satelitniho_uctu_cestovniho_ruchu (the most important source of
information on the Czech TSA; data are regularly updated). • Table reference/title: The Czech TSA.

19
• Language(s): Tables – Czech/English, Methodology – Czech. Q.6 Person in charge for TSA: • Name: Zdeněk Lejsek. • Title: Expert of tourism statistics. • Organization: Czech Statistical Office. • E-mail: [email protected]
DNK
Q.1 Present stage of implementation: The Danish TSA project started in 2003-2004. It was conducted by a research institute – AKF and was financed by the
national tourism council (official name is VisitDenmark). The first year TSA tables corresponded to 2000 and were published as an AKF report. For years 2000-2006, regional TSA data have been revised on a yearly basis. VisitDenmark publishes (in Danish) its official reports on tourism data, regional TSA, and tourism economic impact on the Danish regions, mainly on its home page on a yearly basis. For example, “Turismen i Danmark 2000-2004 – turismens økonomiske betydning: national og regionalt” was published by VisitDenmark in 2006 (also at www.visitdenmark.com).
The Danish TSA project has always been managed in close co-operation between the national accounts’ division and tourism statistical division of Statistics Denmark, VisitDenmark and a research institute (now it is CRT). TSA tables 1-7, (except 3) are available, also at a regional level.
Q.2 General methodological approach: 1) The Danish TSA tables are mainly compiled based on the national supply and use tables, the regional production
accounts and regional tourism survey data. It is possible for Denmark to start regional TSA directly from the start. 2) All the data sources are updated on a yearly basis. 3) The methodological approach is that the regional TSA accounting and modeling is merged into one system. 4) From its accounting part, the TSA tables by product can be presented. 5) From its modeling part, the tourism indirect and induced effects can be calculated.
Q.3 Institution in charge for compilation: • Name: Centre for Regional and Tourism Research (CRT). • Comments: VisitDenmark is still providing the financial support for the Danish regional TSA projects. In the last two years, it
has carried out a project for developing municipal TSA. Denmark has 98 municipalities and 5 regions. VisitDenmark is responsible for tourism data inputs, for controlling the tourism data and publishing the official TSA tables and the other tourism economic indicators. CRT is responsible for compiling the RTSA tables and providing the regional tourism model.
Q.4 Basic documentation - TSA sources and methods documents: • Zhang, Jie (2005): Documentation on Regional Tourism Satellite Accounts in Denmark, Publisher: AKF forlaget, ISBN/ISSN:
978-87-7509-783-4. Page 88, Copenhagen, March 2005 (English only): http://www.akf.dk/udgivelser/2005/pdf/rtsa.pdf/ • Language(s): English. Q.5 Dissemination formats of TSA data: • Hard copy - Annual publication(s):
• Title: Tourism in Denmark 2000-2004 – Tourism Economic Importance at National and Regional Level. Published by VisitDenmark, 2006.
• Language(s): Danish. • Electronic – Internet:
• Website: http://www.visitdenmark.com/danmark/da-dk/menu/danskturisme/tal/markedsanalyser/analyser-2006/analyser-2006.htm
• Language(s): Danish. Q.6 Person in charge for TSA • Name: Thomas Thessen. • Title: Chief advisor. • Organization: VisitDenmark. • E-mail: [email protected] • Name: Jie Zhang. • Title: Senior Researcher. • Organization: Centre for Regional and Tourism Research (CRT). • E-mail: [email protected]
ECU
Q.1 Present stage of implementation: In the period 2001-2003, Ecuador carried out two exploratory Tourism Satellite Account exercises, through the Executing Unit
put up for this purpose. During this period, a technical cooperation agreement was signed with the entities directly connected to the sector.
The objectives of the project were precisely to construct a framework of satellite accounts and lay down the foundations of a system of tourism statistics that would make it possible to quantify the share of tourism in the national economy.
Of the 10 proposed tables, tables corresponding to Employment (7), Gross Fixed Capital Formation (8), and Collective Consumption (9) were not prepared.
The periods of reference of the exploratory Tourism Satellite Account exercises were 1993-2001 in current and constant sucres, and the period 2000- 2003 in current and constant dollars.
Q.2 General methodological approach: The exploratory tourism satellite account exercises carried out in Ecuador, maintained logical, accounting and statistical consistency with the System of National Accounts.
Q.3 Institution in charge for compilation: • Name: Ministry of Tourism. • Comments: In July 2007 the Special Interinstitutional Commission on Tourism Statistics was created, composed of the
principal entities linked to the sector, whose fundamental objective is to promote the production of basic tourism statistics that would make it possible to update the Tourism Satellite Accounts of the country as well as of the sub-region, while at the same time institutionalizing the project and give it sustainability.
Q.4 Basic documentation: • TSA sources and methods documents: • Other related publications and studies: Q.5 Dissemination formats of TSA data- Hard copy - Other (s):

20
• Title: Ecuador – Tourism Satellite Accounts 1993-2001, Quito, 2002 Ecuador – Tourism Satellite Accounts 2000-2003, Quito, 2002 • Periodicity: Occasional. • Language(s): Spanish. Q.6 Person in charge for TSA • Name: Rita Alexandra Betancourt Guzmán. • Title: Economist – Professional 5. • Organization: Ministry of Tourism. • E-mail: [email protected]
EGY
Q.1 Present stage of implementation: Current Situation in 2008: The institutional platform has been set through:
• A protocol of Cooperation between MOT and MOED emphasizing the partners and the role of each of them • Setting TSA Budget and Financial Plan and allocating the funds for conducting the surveys. • Selecting the teams and training of staff. • Revising the field surveys & questionnaires . • A ministerial decree that formulate the steering committee of TSA unit with specialized experts.
Q.2 General methodological approach: • The interface between supply and demand has not yet been implemented • Econometric Techniques are used, both using Forecasting (quantitative) and Wild Cards Techniques. (qualitative) • Publication is underway and indirect and induced effects will be included. Q.3 Institution in charge for compilation: • Name: Ministry of Tourism. • Comments: In cooperation with the following bodies
• Ministry of Civil Aviation. • Passport and Immigration Authority of the Ministry of Interior (PIAMI). • The Central Bank of Egypt (CBE). • The Central Agency for Public Mobilization and Statistics (CAPMAS) (Official Statistical Producer). • Ministry of Culture.
Q.4 Basic documentation: • TSA sources and methods documents:
• Official National Accounts • National Tourism Statistics & Tourism Statistic Bulletin • Labour force ( household based sample surveys) • Establishment surveys
• Other related publications and studies: • National TSA Feasibility Study • Airports survey • Tourism Centre survey • Exit Poll survey • National Balance of Payments
Q.5 Dissemination formats of TSA data (to be implemented): • Hard copy
• Annual publication(s) - Language (s): Arabic & English. • Other (s) - Language (s): Arabic & English
• Electronic: • Internet - Language (s): Arabic & English. • Other - Language (s): Arabic & English.
Q.6 Person in charge for TSA: • Name: Adla Ragab. • Title: Economic Advisor to the Minister of Tourism • Organization: Ministry of Tourism , Egypt • E-mail: [email protected]
FIN
Q.1 Present stage of implementation: TSA Tables 1, 2, 4, 5, 6, 7 and 10 are compiled annually. Time series exist since 1995. Q.3 Institution in charge for compilation: Statistics Finland. Q.4 Basic documentation: • TSA sources and methods documents: http://ktm.elinar.fi/ktm_jur/ktmjur.nsf/All/4A4961275CDE38B6C2256F6D0026AEE1/$file/englanninkielinen_ratu8mos_2004.pdf • Other related publications and studies: Q.5 Dissemination formats of TSA data -Electronic – Internet: • Website: http://www.stat.fi/til/matp/index_en.html • Table reference/title: http://www.stat.fi/til/matp/tau_en.html • Language(s): Finnish, English. Q.6 Person in charge for TSA: • Name: Olli Pirinen. • Title: Senior Statistician. • Organization: Statistics Finland. • E-mail: [email protected]

21
FRA
Q.1 Present stage of implementation: A “Tourism Account” (with no integration with the System of National Accounts) has been regularly produced in France for
many years but it does not comply with UN-WTO recommendations and it will be replaced soon by a new Tourism Satellite Account (TSA) more in line with UN-WTO recommendations. The first experimental exercise with integration in National Accounts (NA) has been set up for the benchmark year 2005. The integration in NA is ensured by the method used for estimating the major product components of Internal Tourism Consumption (see below the reply to Q2). In addition, works are in progress to define appropriate methods for updating the benchmark year estimates to the current year estimates. All figures given in the tables below and the attached comments refer to the TSA pilot exercise.
Q.2 General methodological approach: • Interface between visitor consumption…: See reply bellow to Q2. • TSA is basic on econometric or statistical modeling techniques…:
• TSA is partly basic on… • See reply bellow to Q2.
• Comments: Due to a lack of statistical data on the product components of consumption expenditure by non resident visitors (inbound tourism consumption), internal tourism consumption of most products cannot be directly estimated from statistical surveys on visitors’ consumption (approach based on the demand side). Instead (approach based on the supply side), the French pilot study derives the main estimates of internal tourism consumption of the tourism characteristic products from the most detailed SUT (Supply and Use Tables) in French NA and from other various data sources on the corresponding “visitors consumption ratios” (i.e.: for each product concerned, the share of visitors consumption to total consumption of visitors and non-visitors). For example, the estimation of visitors’ consumption ratio for restaurants makes use of the compulsory registration of paid employees by all establishments in France and it mainly relies on the frequent links, in many places visited, between the peaks of monthly employment numbers and the peaks in number of visitors (econometric model) In the special case of the non-market housing service provided by vacation homes on own account, its estimate in the pilot study derives from the French Satellite Account for Housing based on NA valuation principles. For the other tourism accommodation services, all available data sources are used and compared to each other, including the French Survey on Domestic Tourism (SDT) for the demand side and a national Hotel Accommodation Survey for the supply side, along with NA estimates based on the combination of tax returns figures and the French system of general national surveys on enterprises. Finally, the methods used in the present pilot exercise could be changed in the near future as some improvements in the French system of surveys of visitors’ consumption are expected to be introduced soon, subject to financial considerations and other priorities.
Q.3 Institution in charge for compilation: • Name: Bureau des Etudes, des Statistiques et des Comptes Economiques (BESCE), Direction du Tourisme, Ministère de
l’Economie, de l’Industrie et de l’Emploi. • Comments:
• The French Central Bank (Banque de France) and the French Administration of Tourism (Direction du Tourisme) share responsibilities in designing, financing and processing both the Survey on Domestic Tourism and the Tourism Border Survey. In particular, the principal aim of the French Tourism Border Survey is to provide the statistical data required for estimating the total travel receipts item of the Balance of Payments.
• See comments to Q.6. Q.4 Basic documentation: • TSA sources and methods documents:
• Official notes on the sources and methods of the new French TSA will be made public if and when the TSA estimates are approved by the French Commission of Accounts on Tourism.
• As matters stand, only some PowerPoint supports for short presentations of the new TSA are available. • Other related publications and studies: "The impact of Tourism on paid employment” (Paper presented in the 8Th OECD
and Eurostat International Forum on Tourism Statistics). Q.6 Person in charge for TSA: • Name: Jacques Ho Ta Khanh. • Title: Senior officer in charge of the revision of the French CST. • Organization: BESCE, Direction du Tourisme. • E-mail: [email protected] • Comments: A general reorganization of government statistical services is under way in France. So, in the course of next
year, the TSA task will be transferred to a new department of the Ministry of Economy, Industry and Employment (MEIE) while the surveys operating activities of the present Direction du Tourisme will be transferred to the French NSO (INSEE).
HND
Q.1 Present stage of implementation: Currently, the figures of the last TSA exercise are being revised, based on the official data published by the Central Bank of
Honduras. In order to carry out the Tourism Satellite Account Project in Honduras, two important agreements were signed; the Technical
Cooperation Agreement between the Honduras Institute of Tourism and the Central Bank of Honduras; and the Agreement on Cooperation and the Creation of the Interinstitutional Platform for the Development of the Tourism Satellite Account of Honduras, among the following institutions: Honduras Institute of Tourism (IHT), Central Bank of Honduras (BCH), National Institute of Statistics (INE), General Directorate for Immigration (DGME) and the National Tourism Chamber of Commerce of Honduras (CANATURH). The objective of both agreements is to facilitate the execution of activities necessary for the development and implementation of a suitable methodology for the calculation of the Tourism Satellite Account, as well as the training of human resources and the conduction of the office and field studies considered necessary to ensure the validity and quality of the data
The first document including Tourism Satellite Account results was published by the Honduras Institute of Tourism (IHT) in November 2005 and constituted the culmination of the first experimental exercise that started in December 2003. This exercise was developed based on the National Accounts of Honduras, within the framework of the implementation of the System of National Accounts of 1993 (SNA1993) carried out by the Central Bank of Honduras, and based on the Supply and Use Matrices of 2000 which allowed the construction of estimations for the period of reference 2000-2005. In order to enable

22
projections, the official information published by the Central Bank of Honduras for the reference period was used which allowed the construction of a table portraying the evolution of annual volume and price indices.
A second publication for the reference period 2000-2007 is planned for February 2009. It will be based on the Supply and Use Matrices for the years 2000-2005 while for the years 2006 and 2007 estimates will be based on the evolution of volume and price indices.
Stages of Implementation of The Tourism Satellite Account in Honduras,following TSA-RMF
TABLE TITLE STAGE LIMITATIONS
1 Inbound Tourism Consumption according to
Products and Categories of Visitors Semi complete
Due to limitations in the compilation of statistics, there is still no available disaggregation according to categories of visitors
2 Internal Tourism Consumption according to Products and Groups of Resident Visitors
Semi complete
Due to limitations in the compilation of statistics, there is no available disaggregation neither by categories of visitors, nor by type of trip.
3 Outbound Tourism Consumption according
to Products and Visitor Categories Semi complete
A disaggregation into categories of visitors is not available
4 Internal Tourism Consumption according to
Products and Forms of Tourism Complete
Due to limitations in the compilation of statistics, there is no data available yet for "Other components of visitor consumption".
5 Production Accounts of Tourism and Other
Industries Complete
6 Internal Tourism Supply and Consumption
according to products Complete
7 Employment in Tourism Industries Semi complete There is no data available yet for employment by category
8 Tourism Gross Fixed Capital Formation of Tourism Industries and Other Industries
Semi complete The statistical data necessary for this table is not available yet
9 Tourism Collective Consumption according
to Functions and Levels of Government Administrations
Not available The statistical data necessary for this table is not available yet
10 Non-monetary indicators Semi complete
The statistical data necessary for the following tables is not available yet: Number of establishments and capacity by types of accommodations, Number of establishments according to Tourism characteristic industries and Tourism related industries and according to the Number of persons employed.
Q.2 General methodological approach: Based on the Supply-Use Matrix of the National Accounts compiled by the Central Bank
of Honduras. Q.3 Institution in charge for compilation - Name: Secretaria e Instituto Hondureño de Turismo. Q.4 Basic documentation: • TSA sources and methods documents:
2000 TSA-RMF • Other related publications and studies:
Survey on Tourists Inbound Expenditure and Classes Survey on Tourist Inbound Expenditure and Classes Counts of Flows and Quick Surveys
Q.5 Dissemination formats of TSA data: • Hard copy:
• Annual publication(s): • Title: Statistical Overview (Compendiums). • Language (s): Spanish.
• Other(s): • Title: An Initial Economic Interpretation of Tourism in Honduras, 2005 • Language (s): Spanish.
• Electronic – Internet: • Website: http://www.iht.hn/ • Table reference/title: Tourism Satellite Account Results 2008. • Language(s): Spanish.
Q.6 Person in charge for TSA: • Name: Ana Rossibel Cruz • Title: Chief, Economic Analysis Unit.

23
• Organization: Honduras Institute of Tourism • E-mail: [email protected] • Name: Marcela Núñez L. • Title: Tourism Satellite Account Officer. • Organization: Honduras Institute of Tourism • E-mail: [email protected]
IND
Q.1 Present stage of implementation: Though the exercise of preparation of TSA for India for the year 2002-03 was developed as a pilot study, it is fully integrated with the National Accounts and other available data sources in the country.
Q.2 General methodological approach: Only 7 tables out of the 10 recommended by the UNWTO were prepared. The recommendations of the UNWTO regarding the preparation of the tables were followed, with some modifications, to take into consideration the Indian situation. The basic concepts of SNA 1993, as adopted by India, were also followed. Due to paucity of data, TSA indicators on quarterly basis were not prepared.
Q.3 Institution in charge for compilation: • Name: Ministry of Tourism. • Comments: Though the TSA was prepared by the National Council of Applied Economic Research on behalf of Ministry of
Tourism, the other organizations such as the Central Statistical Office, National Sample Survey Organization, Reserve Bank of India, Ministry of Labour, Planning Commission, etc., were actively involved in the exercise. The funding of the TSA was provided by the Ministry of Tourism and its dissemination is also being handled by the Ministry of Tourism.
Q.4 Basic documentation: • TSA sources and methods documents:
• Domestic Tourism Survey 2002-03. • International Passenger Survey 2003. • Report of National Sample Survey 56th Round on ‘Unorganised Manufacturing Sector in India, 2000-01’. • Report of National Sample Survey 57th Round on ‘Unorganised Services Sector in India, 2001-02’.
• Other related publications and studies: • National Accounts Statistics of selected years. • Input Output Transactions Table 1998-99. • India Tourism Statistics of selected years.
Q.5 Dissemination formats of TSA data: • Hard copy – • Other(s):
• Title: Tourism Satellite Account for India, January 2006. • Periodicity: Single report. • Language(s): English.
• Electronic – Internet: • Website: http://www.tourism.gov.in/survey/TSA1.pdf • Language (s): English.
Q.6 Person in charge for TSA: • Name: Dr. R.N. Pandey. • Title: Addl. Director General (Market Research). • Organization: Ministry of Tourism. • E-mail: [email protected]
IRL
Q.1 Present stage of implementation: Same Day visits are modelled using UK patterns. Employment figures in TSA Table 7 relate only to direct employment in Tourism. TSA Table 8 is not available. Discussions have been raised over the quality of tourism expenditure data Q.3 Institution in charge for compilation: • Name: Failte Ireland. • Comments: The work was conducted in close co-operation with Tourism Ireland, Failte Ireland, the Central Statistics Office
and the Department of Arts Sports and Tourism in Ireland. The actual compilation was done by National University Cork and the University of Limerick. The final product is considered as ‘pilot’ and is not published as an official statistic.
Q.4 Basic documentation: • TSA sources and methods documents:
• First Steps Tourism Satellite Account Project for the Republic of Ireland, Final Report http://www.failteireland.ie/getdoc/c885c078-85f4-43c1-a19b-d835388fe974/First-Steps-Tourism-Satellite-Account-Project-Summ.aspx
• Central Statistics Office – Input-Output and Supply and Use Tables http://www.cso.ie/releasespublications/1998_input_output_tables.htm
• Central Statistics Office – Tourism & Travel Survey - various years http://www.cso.ie/px/pxeirestat/database/eirestat/Tourism/Tourism.asp
• Central Statistics Office – Household Travel Survey – various years http://www.cso.ie/px/pxeirestat/database/eirestat/Household%20Travel%20Survey/Household%20Travel%20Survey.asp
• Failte Ireland, Tourism Facts (various years) http://www.failteireland.ie/Research---Policy/Research---Statistics/Tourism-Facts
• Other related publications and studies: - Office for National Statistics, United Kingdom – various travel surveys http://www.statistics.gov.uk/CCI/nscl.asp?ID=8131
Q.5 Dissemination formats of TSA data: • Hard copy:
• Annual publication(s): Once off only. Title First Steps Tourism Satellite Account Project for the Republic of Ireland, Final Report.
• Language (s): English.

24
• Electronic – Internet: • Webite: http://www.failteireland.ie/getdoc/c885c078-85f4-43c1-a19b-d835388fe974/First-Steps-Tourism-Satellite-Account-
Project-Summ.aspx • Table reference/title: First Steps Tourism Satellite Account Project for the Republic of Ireland, Final Report. • Language(s): English.
Q.6 Person in charge for TSA: • Name: Brian Maher. • Title : Head of Research & Policy Development. • Organization: Failt Ireland. • E-mail: [email protected]
ISR
Q.1 Present stage of implementation: The Israel TSA is computed in the CBS (National Statistic Office) and financed by the MoT (Ministry of Tourism). The Tourism
Department in the CBS is compiling the TSA in close cooperation with the National Accounts Department. The first TSA exercise was based on 1995 I/O tables. The 2004 TSA based on 2004 SUT is been completed and results will
be published by the end of 2008. Tables 1, 2, 4, 5, 6 were completed and table 7 is planned as a next step in the TSA development. Q.3 Institution in charge for compilation: • Name: CBS, financed by MoT. • Comments: The Israel TSA is compiled by the CBS (National Statistic Office) and financed by the MoT(Ministry of Tourism).
The Tourism Department in the CBS is compiling the TSA in close cooperation with the NA Department. Q.4 Basic documentation: • TSA sources and methods documents:
• 2000 TSA-RMF. • Israel SUT. • Accommodation Surveys. • Inbound Tourism Survey. • Household Budget Survey.
Q.5 Dissemination formats of TSA data: • Hard copy - Other (s):
• Title: TSA in Israel. • Periodicity: 1995, 2004 – intention for updating it together with the SUT. • Language(s): English Hebrew.
• Electronic – Internet: • Website: http://www.cbs.gov.il/reader/publications/pub_search_e_new.htm?FindWordPubEng=tourism+satellite+ac • Table reference/title: TSA in Israel. • Language(s): English Hebrew.
Q.6 Person in charge for TSA: • Name: Lena Ostrovsky. • Title: Research Manager. • Organization: CBS. • E-mail: [email protected] • Name: Esther Sultan. • Title: Director of Statistics and Database Department. • Organization: Ministry of Tourism. • E-mail: [email protected] • Name: Tilda Khait. • Title: Director of Tourism Unit. • Organization: CBS. • E-mail: [email protected]
ITA
Q.1 Present stage of implementation: ISTAT (Italian National Institute of Statistics) has conducted a TSA pilot study for year 2002 but no systematic production
is currently carried out. ISTAT compiled the first five tables. Q.2 General methodological approach: Pilot TSA was based on National Accounts and on tourism statistics. Q.3 Institution in charge for compilation: ISTAT - Italian National Institute of Statistics. Q.6 Person in charge for TSA: • Name: Maresca Sandra. • Title: Senior Researcher. • Organization: ISTAT - Italian National Institute of Statistics. • E-mail: [email protected]
JAM
Q.1 Present stage of implementation: Jamaica is in the process of compiling its first TSA that will be integrated with the National Accounts. This is scheduled for completion in early 2009.
Q.3 Institution in charge for compilation: Statistical Institute of Jamaica. Q.6 Person in charge for TSA: • Name: Carol Coy. • Title: Director, Economic Accounting Division. • Organization: Statistical Institute of Jamaica. • E-mail: [email protected]
JPN
Q.1 Present stage of implementation: Japan has compiled 5 national TSAs since 2003 (the most recent for 2007). Q.2 General methodological approach: Both statistics of the demand side and supply side are compiled and combined to build up a TSA. Demand side statistics are
generated from surveys, and businesses accounting statements and other statistical data are used for the supply side.

25
The impact of tourism on the overall economy is calculated using the TSA and applying input-output analysis. The integration with the SNA is in progress and will be completed by 2009. Besides, basic study of regional TSA will be undertaken in 2009. Q.3 Institution in charge for compilation: • Name: Japan Tourism Agency • Comments: The project is currently developed in cooperation with the Department of National Accounts, Economic and
Social Research Institute (ESRI), Cabinet Office, which is mainly responsible for the integration of TSA into SNA. Q.4 Basic documentation - TSA sources and methods documents: Research studies of the impact on economy by tourism
industry http://www.mlit.go.jp/kankocho/siryou/toukei/kouka.html (Japanese only). Q.5 Dissemination formats of TSA data: • Hard copy - Other (s):
• Title: Research studies of the impact of the tourism industry on the economy. • Language(s): Japanese.
• Electronic – Internet: • Website: http://www.mlit.go.jp/kankocho/siryou/toukei/kouka.html • Table reference/title: Research studies of the impact of the tourism industry on the economy, (94 pages). • Language(s): Japanese.
Q.6 Person in charge for TSA: • Name: Noriko Yagasaki. • Title: Director, Tourism Economy. • Organization: Japan Tourism Agency. • E-mail: [email protected]
KAZ
Q.1 Present stage of implementation: The TSA is compiled annually in accordance with the Statistical Plan of the National Statistical Office of the Republic of Kazakhstan, within a delay of 1.5 year, beginning with TSA Tables on 2003. TSA 2006 was published in May 2008. TSA for 2003 and 2004 did not include Tables 8 and 9 for lack of information. 2005 and 2006 compilations included these tables, though Table 8 contains data on input of fixed assets which differs from the TSA methodology. TSA 2007 will reflect gross fixed capital formation..
Q.2 General methodological approach: The conceptual references are the 2000 TSA-RMF and the 1993 SNA. Q.3 Institution in charge for compilation: • Name: National Statistical Office of the Republic of Kazakhstan • Comments: The Department of services statistics is in charge of generating tourism statistics; Department of National
Accounts of Kazakhstan is responsible for setting up the TSA. Q.4 Basic documentation: • TSA sources and methods documents:
• Consolidated Balance of Payment of the Republic of Kazakhstan (data are taken from items “International passenger carriage” and ”travel” within “services”).
• Report of state budget performance. Data on disbursed grants is taken from section “Expenditures” and data on taxes on domestic consumer goods and import from the section “Incomes”.
• Supply and Use Tables of the Republic of Kazakhstan are used for compilation of data on production; output is taken from the details corresponding to tourism industries.
• Other related publications and studies: Q.5 Dissemination formats of TSA data: • Hard copy - Annual publication(s):
• Title: TSA of the Republic of Kazakhstan (catalogue). • Language(s): Kazakh, Russian.
• Electronic – Internet -Language(s): Kazakh, Russian. Q.6 Person in charge for TSA: • Name: Mr. Kazhgaly Taizhanov. • Title: Director of the Department. • Organization: National Statistical Office of the Republic of Kazakhstan. • Email: [email protected]
LVA
Q.3 Name: Latvia Central Statistics Bureau Q.4 Basic documentation: • TSA sources and methods documents: • Other related publications and studies: Q.5 Dissemination formats of TSA data- Electronic – Internet: • Website: www.csb.gov.lv • Table reference/title: Press release on TSA. • Language(s): Latvian, English. Q.6 Person in charge for TSA: • Name: Edīte Miezīte. • Title: Head of section of Transport and Tourism statistics. • Organization: Latvia Central Statistics Bureau • E-mail: [email protected]
LTU
Q.3 Institution in charge for compilation: Statistics Lithuania. Q.4 Basic documentation:
Main sources: • Outbound Visitor Survey. • Inbound Visitor Survey. • Survey on Accommodation Services • Supply Use Data. • Labour Force Survey.

26
• STS, SBS Survey. Q.5 Dissemination formats of TSA data: • Hard copy - Annual publication(s):
• Title: Tourism in Lithuania 2007. • Language(s): Lithuanian/English
• Electronic – Internet – website: http://www.stat.gov.lt/lt/catalog/viewfree/?id=1296 Q.6 Person in charge for TSA: • Name: Zita Serafiniene. • Title: Head of transport and services statistics. • Organization: Statistics Lithuania. • E-mail: [email protected]
MYS
Q.1 Present stage of implementation: Malaysia TSA data have been compiled from Table 1 – 6 for year 2000 – 2007 according to the TSA -RMF 2008 recommendations. The plan is to publish Malaysia TSA data in March 2009. At the moment, the data are yet to be released and subject to approval and clearance from TSA steering committee. Table 7 – 10 are being assessed and evaluated by the same committee.
Q.3 Institution in charge for compilation: • Name: Department of Statistics Malaysia (DOSM). • Comments: DOSM is the official agency in charge of the production of TSA data in Malaysia. In implementing TSA, Malaysia
has structured an organization which comprises a technical committee handled by the Department of Statistics Malaysia and a steering committee comprised by DOSM and stakeholders. Other government agencies are also engaged in producing data required by Malaysia TSA such as Tourism Malaysia and Ministry of Tourism.
Q.4 Basic documentation: • TSA sources and methods documents:
• TSA: RMF 2008 • IRTS 2008. • SNA 1993
Q.5 Dissemination formats of TSA data: We propose our publication to be named as follows:
• Title: Provisional Tourism Satellite Account Malaysia. • Language(s): English/National Language.
Q.6 Person in charge for TSA: • Name: Fauzana Binti Haji Ismail. • Title: Miss (Ms.). • Organization: Department of Statistics Malaysia. • E-mail: [email protected]
MEX
Q.1 Present stage of implementation: Series available: 2003 – 2006, using 2003 as a Base Year. (1993 – 2004 using 1993 as a Base Year). Use of North American Industrial Classification System (NAICS) All Tables. Without TDGDP and without Domestic tourism figures in Table 10. Q.2 General methodological approach: Mexico´s TSA doesn’t consider restaurants and food and beverage serving services industries as tourism characteristic
activities. Q.3 Institution in charge for compilation: • Name: Instituto Nacional de Estadística y Geografía (INEGI). • Comments:
TSA is part of the Mexican System of National Accounts. By law it is under the responsibility of INEGI (National Institute of Statistics and Geography – National Statistical Office). Nevertheless the Ministry of Tourism (SECTUR) plays an important role as a source of information and shares responsibility in diffusion tasks. Actually INEGI and SECTUR share common projects, like the Tourism Census.
Q.4 Basic documentation - TSA sources and methods documents: • SNA 1993. • 2008 TSA-RMF • Sistema de Cuentas Nacionales de México. Cuenta de Bienes y Servicios, 2003-2006, Base 2003, 2008, Aguascalientes,
INEGI. • http://www.inegi.org.mx/prod_serv/contenidos/espanol/catalogo/Default.asp?accion=1&upc=702825006609&s=est&c=14016 • Sistema de Cuentas Nacionales de México. Cuenta Satélite del Turismo de México. Metodología, 2005, Aguascalientes,
INEGI • http://www.inegi.org.mx/est/contenidos/espanol/metodologias/cuentas/anuales/metodo_cstm.pdf • Sistema de Cuentas Nacionales de México. Cuenta Satélite del turismo de México, 2003-2006. Base 2003, 2008,
Aguascalientes, INEGI. • http://www.inegi.org.mx/prod_serv/contenidos/espanol/bvinegi/productos/derivada/satelite/turismo/2006/CSTM_03-06.pdf Q.5 Dissemination formats of TSA data - Electronic – Internet: • Website: http://www.inegi.org.mx/prod_serv/contenidos/espanol/biblioteca/Default.asp?accion=4&UPC=702825006613 • Table reference/title: Cuenta Satélite del Turismo de México. • Language(s): Spanish. Q.6 Person in charge for TSA: • Name: Alejandro Nava Alatorre. • Title: Director General de Información y Análisis. • Organization: Secretaría de Turismo. • E-mail: [email protected] • Name: Francisco Guillén Martín. • Title: Director de Cuentas Satélites. • Organization: INEGI.

27
• E-mail: [email protected]
MAR
Q.2 General methodological approach The reference year of the present Morrocan National Accounts is 1998. Currently an updating process of the National Accounts is under way to change the reference year to 2006. This is why the TSA 1998, 2001, 2003 and 2005 are final versions and the TSA 2006 is only a provisional version.
Q.3 Institution in charge for compilation: • Name: Haut Commissariat au Plan, National Accounts Directorate + Ministry of Tourism, Directorate for Strategy and
Planning • Comments:
Ministry of Tourism carried out the surveys on tourism supply and demand Haut Commissariat au Plan completed the data using elements from the National Accounts and from the household consumption survey.
Q.4 Basic documentation - TSA sources and methods documents: • 2000 TSA-RMF; UNWTO classifications • SNA 1993 • List of products and services of Morocco. • Input-output tables + standard of living table + household consumption survey. Q.6 Person in charge for TSA: • Name: Hassane El Hamdouni. • Title: Chief of Division in charge of statistics. • Organization: Ministry of Tourism and Handicrafts. • E-mail: [email protected]; [email protected]
NLD
Q.1 Present stage of implementation: TSA historical series 2001-2007. Q.3 Institution in charge for compilation: Statistics Netherlands. Q.4 Basic documentation - TSA sources and methods documents: • TSA sources and methods documents:
• Continuous Vacation Survey (CVO). • Inbound Tourism Statistics (SIT). • Lodging and Accommodation Statistics (SLA). • Statistics on same day trips.
• Other related publications and studies: Q.5 Dissemination formats of TSA data - Electronic – Internet: • Website:
http://www.cbs.nl/NR/rdonlyres/2EB1AA24-E9A4-4AA7-B83C-E47812A4DD1C/0/2006p44pub.pdf Toerisme in macro-economisch perspectief, 2001-2007 (Tourism in macroeconomic perspective, 2001-2006 only in Dutch). http://www.cbs.nl/en-GB/menu/themas/macro-economie/publicaties/artikelen/archief/2008/2008-2493-wm.htm Tourists spending up sharply.
• Table reference/title: http://statline.cbs.nl/StatWeb/publication/?DM=SLNL&PA=71777ned&D1=0-1,4,7,10-13&D2=0,2,5,8,l&D3=0&D4=4-6&VW=T http://statline.cbs.nl/StatWeb/publication/?DM=SLNL&PA=71776ned&D1=0-1,4-5,8,11-12&D2=0-2,5,8,11-12&D3=0&D4=0&D5=4-6&VW=T
Q.6 Person in charge for TSA: • Name: Rob van der Holst. • Title: Project manager TSA. • Organization: Statistics Netherlands. • E-mail: [email protected]
NZL
Q.1 Present stage of implementation: The published historical time series available for the New Zealand TSA covers the years ended March 1999–2007.
Q.3 Institution in charge for compilation: • Name: Statistics New Zealand. • Comments: The New Zealand TSA publication is developed and published by Statistics New Zealand with funding from the
Ministry of Tourism. Q.4 Basic documentation: • TSA sources and methods documents:
• Domestic Travel Survey http://www.tourismresearch.govt.nz/Methodologies/Domestic-Travel-Survey/ • International Visitor Survey http://www.tourismresearch.govt.nz/Methodologies/International-Visitor-Survey-/ • International Visitor Arrivals http://www.tourismresearch.govt.nz/Methodologies/International-visitor-arrivals-survey/ • Supply-Use data http://www.stats.govt.nz/tables/supply-and-use-tables.htm • Input-Output tables 1995/96 http://www2.stats.govt.nz/domino/external/web/prod_serv.nsf/htmldocs/Inter-
Industry+Study+1996+-+126+Industries+-+Interim+Release+(Year+ended+March+1996) • Annual Enterprise Survey http://www.stats.govt.nz/products-and-services/info-releases/aes-info-releases.htm
• Comments: Additional information pertaining to the sources and methods used in the compilation of the New Zealand TSA are detailed within the latest publication.
Q.5 Dissemination formats of TSA data: • Hard copy - Annual publication(s):
• Comments: 1995 (Pilot), 1997, 2000-02, 2000-03, 2004, 2005, 2006, 2007. The published historical time series available for the New Zealand TSA covers the years ended March 1999–2007.
• Title: Tourism Satellite Account. • Language(s): English.
• Electronic – Internet: • Website: http://www.stats.govt.nz/products-and-services/info-releases/tourism-satellite-accts-info-releases.htm • Table reference/title: Tourism Satellite Account.

28
• Language(s): English. Q.6 Person in charge for TSA: • Name: Michael Morgan. • Title: Statistical Project Manager. • Organization: Statistics New Zealand. • E-mail: [email protected] Latest year available: Year ended March 2007 (released June 2008).
OMN
Q.3 Institution in charge for compilation: • Name: Ministry of National Economy. • Comments: The Directorate General of Economic Statistics in the Ministry of National Economy in cooperation with the
Ministry of Tourism is responsible for compiling tourism statistics. Q.6 Person in charge for TSA: • Name: Khalid Said Al Mudhafar. • Title: Director of Economic Survey Department. • Organization: Ministry of National Economy. • E-mail: [email protected]
PER
Q.3 Institution in charge for compilation – • Name: Ministry of Foreign Trade and Tourism (MINCETUR) - Vice-ministry of Tourism. Q.4 Basic documentation: • TSA sources and methods documents:
• Input-Output Table (IO). • Survey of inbound and outbound tourism. • Estimations for domestic tourism. • Other tourism statistics.
• Other related publications and studies: TSA of other countries. Q.5 Dissemination formats of TSA data: • Hard copy:
• Annual publication(s): • Title: Cuenta Satélite de Turismo, Año de Evaluación 2001. • Language(s): Spanish.
• Electronic – Other: • Annual publication(s):
• Title: Cuenta Satélite de Turismo, Año de Evaluación 2001. • Language(s): Spanish.
Q.6 Person in charge for TSA: • Name: Enrique Garrido-Lecca Risco. • Title: General Director. • Organization: MINCETUR. • E-mail: [email protected]
PHL
Q.1 Present stage of implementation: • Length of historical series available: 2000 to 2007 (Annual)
After the release of the first Philippine TSA (preliminary results) covering the years 1994 and 1998, subsequent studies were undertaken to improve the previous estimates to come up with the 2000 - 2007 Philippine TSA annual estimates. The series already takes into consideration the IRTS 2008 and TSA: RMF 2008 recommendations. However, the series has yet to be officially released to the public pending the review of the Interagency Committee on Tourism Statistics (IAC-TS) prior to presentation to the NSCB Executive Board. The IACTS is scheduled to meet on November 11, 2008, and the NSCB Executive Board, on December 03, 2008.
• Completeness regarding TSA: RMF tables: Subject for further review of the estimates, the following tables are compiled with its corresponding limitations vis-à-vis the TSA: RMF tables: TABLE TITLE STATUS LIMITATIONS
1 Inbound tourism expenditure by products compiled No disaggregation for expenditures by class of visitors
2 Domestic tourism expenditure by products compiled a) No disaggregation for expenditures by class of visitors; b) different types of trips are not highlighted
3 Outbound tourism expenditure by products compiled No disaggregation for expenditures by class of visitors
4 Internal tourism consumption by products compiled imputed components of tourism consumption are not compiled
5 Production accounts of tourism industries and other industries
compiled a) no estimates for accommodation associated with all types of vacation homes ownership b) on the product categories, the list does not include items on non consumption products such as valuables due to unavailability of data
6 Total domestic supply and internal tourism consumption compiled same as in Table 5 7 Employment in the tourism industries compiled a) number of establishments is not
shown

29
b) jobs are not separated by status of employment c) number of hours worked and full-time equivalent not shown d) no disaggregation by gender is available
8 Tourism gross fixed capital formation of tourism industries and other industries
On-going (to be finished December 2008)
9 Tourism collective consumption by products and levels of government
On-going (to be finished December 2008)
10 Non monetary indicators compiled Q.3 Institution in charge for compilation: National Statistical Coordination Board (NSCB). Q.4 Basic documentation - Comments: The 2000 – 2007 Philippine TSA estimates are set for official release in January 2009, together with the corresponding
sources and methods. Specifically, the basic documentation will be released in the following publication and websites:
1) The PTSA Technical Notes – Annex of the publication “The Philippine Tourism Satellite Accounts (PTSA) 2000 to 2007” to be published by the National Statistical Coordination Board (NSCB).
2) The PTSA Technical Notes – to be uploaded in the Philippine TSA webpage (http://nscb.gov.ph/stats/ptsa/default.asp) with the official release of the 2000-2007 Philippine TSA in January 2009.
Q.5 Dissemination formats of TSA data: • Hard copy:
• Annual publication(s): • Title: The Philippine Tourism Satellite Accounts (PTSA) 2000 to 2007. • Language(s): English. • Comments: To be published by National Statistical Coordination Board (NSCB). • Title: The Philippine Statistical Yearbook (PSY) 2008: Chapter on Tourism. • Language(s): English. • Comments: To be published by National Statistical Coordination Board (NSCB).
• Other (s): • Title: Compendium of Philippine Tourism Statistics, 2008, • Language(s): English. • Comments: To be published by Department of Tourism (DOT).
• Electronic – Internet: • Website: Philippine TSA webpage at http://nscb.gov.ph/stats/ptsa/default.asp) • Language: English.
Q.6 Person in charge for TSA: • Name: Dr. Rómulo A. Virola. • Title: Secretary General. • Organization: National Statistical Coordination Board (NSCB). • E-mail: [email protected]
POL
Q.1 Present stage of implementation: The full TSA series covers 2000-2002 and 2005; it has been supplemented by projected TSA estimates for 2003-2005. The
full TSA covers tables 1-8 although with some modification in terms of layout and data. Generally it focuses on value data; data on number of trips have been omitted because of the lack of data. Generally the data on product structure are more detailed than in RMF and follow CPA classification used in Poland. Table 3 has been left mostly unfilled as well as detailed information on intermediate consumption of tourism industries.
The TSA has been compiled outside the National Accounts Department although this Department provided data on tourism supply and make matrix.
Q.3 Institution in charge for compilation: • Name: Tourism Department in the Ministry of Sport and Tourism. • Comments: In 2007 the Tourism Department has been moved from the Ministry of Economy to the Ministry of Sports and
Tourism. The TSA was compiled by the team of experts in co-operation with the Central Statistical Office, the National Bank of Poland and Institute of Tourism in Warsaw.
Q.4 Basic documentation – TSA sources and methods documents: Eksperymentalny rachunek satelitarny turystyki [Experimental Tourism Satellite Account] www.msport.gov.pl
Q.5 Dissemination formats of TSA data: • Hard copy – Other (s):
• Title: Rachunek satelitarny turystyki dla Polski 2003-2004, wersja uproszczona: • Periodicity: ad hoc; Warszawa 2007. • Language(s): Polish.
• Electronic: • Internet:
• Webs • ite: http://www.msport.gov.pl/ • Table reference/title: Tourism satellite account for Poland 2000; Tourism satellite account for Poland 2001;
Tourism satellite account for Poland 2002. • Language(s): Polish for 2000; Polish and English for 2001 and 2002. • Website: http://www.msport.gov.pl/

30
• Table reference/title: Tourism satellite account for Poland for 2003-2004 - simplified; Tourism satellite account for Poland for 2005 - simplified
• Language(s): Polish; summary in Polish and English. • Other:
• Format: CD. • Title: Tourism satellite account for Poland 2000; Tourism satellite account for Poland 2001; Tourism satellite
account for Poland 2002. • Periodicity: When available. • Language(s): Polish for 2000, Polish and English for 2001 and 2002.
Q.6 Person in charge for TSA: • Name: Katarzyna Podhorodecka (responsible for commissioning of TSA). • Title: Senior adviser. • Organization: Tourism Department, Ministry of Sport and Tourism. • E-mail: [email protected] • Name: Ewa Dziedzic (in charge of the compilation). • Title: Associate Professor. • Organization: Tourism Department Warsaw School of Economics. • E-mail: [email protected]
ROU
Q.1 Present stage of implementation: A pilot (experimental) TSA in 2004 was carried out by the National Institute of Research Development in Tourism (INCDT) together with the National Accounts Department of the National Institute of Statistics. The data were not published and were based on an informal collaboration scheme (no TSA platform or agreement). The methodology followed the 2000 TSA: RMF standards. Also, in 2005 INCDT carried out one part of a TSA feasibility study referring only to the description and diagnosis of the System of tourism statistics in Romania. This study received contributions from INS (National Institute of Statistics) and BNR (National Bank of Romania). The second part of the TSA feasibility study was completed in December 2008 by INCDT and it deals with some short general guidelines referring to the implementation alternatives, necessary activities, institutional construction and resources required
Q.2 General methodological approach: A reconciliation table (Table 6) was also included and was provided by the National Accounts Department of the National Institute of Statistics (INS). The first 4 tables and Table 7 (Employment in tourism industries) were compiled by INCDT based on INS data.
Q.3 Institution in charge for compilation: (strictly speaking “what should be done” as there is no official agreement) • Name: In the future Romanian National Tourism Administration (RNTA) will have to commission INS and INCDT to carry out
the TSA compilation. • Comments:
However in the pilot TSA. INCDT – was responsible for the “conceptual work” of TSA while INS was a data provider and responsible (unofficially) for the compilation of tables 5 and 6.
Q.4 Basic documentation: • TSA sources and methods documents:
INS, Input – Output Table for 2001 – provided by the National Accounts Department within INS 2001 TSA:RMF INS, Tourism demand of residents in 2003 INCDT study regarding receipts from international tourism in 2001 (estimations) INCDT research regarding the quantification of tourism activities from travel agencies, 29 January – 29 March
• Other related publications and studies: INS, Results and performances of commerce and services enterprises in 2001 INS, Number of tourists and excursionists benefiting from tourism organized by travel agencies in the 4th quarter and the year 2001 INS, The accommodation capacity existing at 31st of July 2001
Q.5 Dissemination formats of TSA data: • Electronic –Other:
• Format: INCDT study. • Title: [rom.- Adapatarea sistemului informaţional din turism la cerinţele integrării europene (Contul satelit)] [engl. The
adaptation of the Tourism Information System to the requests of European integration (Tourism Satellite Account)]. • Periodicity: one time project, ended in April 2004. • Language(s): Romanian.
Q.6 Person in charge for TSA: • Name: Cristi Frenţ. • Title: Tourism researcher. • Organization: National Institute of Research Development in Tourism (INCDT). • E-mail: [email protected], [email protected]
KSA
Q.1 Present stage of implementation: Continuous cooperation with the Department of Statistics and Information to measure the tourism supply through tourism establishments in an annual survey developed by the CDSI.
Q.2. General methodological approach: It is difficult to provide quarterly indicators for the TSA. Q.3 Institution in charge for compilation: • Name: Saudi Commission for Tourism and Antiquities (SCTA). • Comments:
SCTA – Responsible and empowered to collect data on the tourism sector and currently cooperating with the CDSI & Saudi Arabian Monetary Agency (SAMA). SCTA – Has funded the tourism surveys and publishes yearly statistical reports on the following topics: • Tourism satellite accounts report. • Tourism statistics report. • Accommodation statistics report.
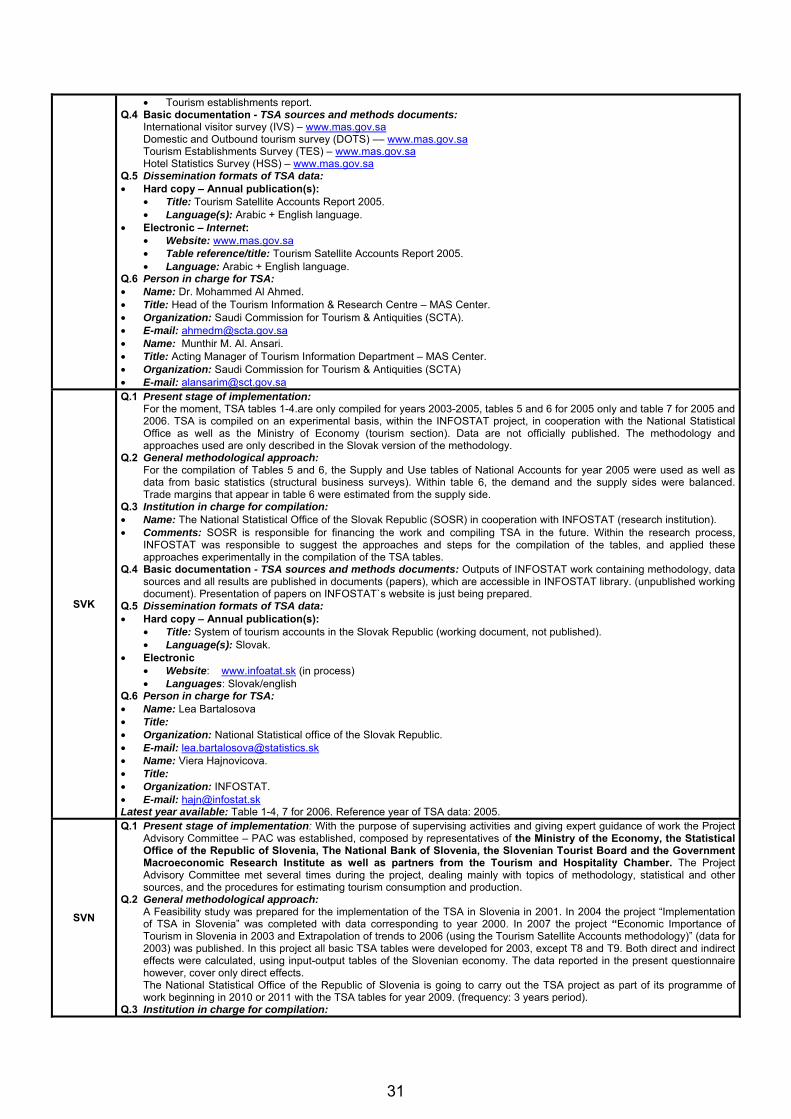
31
• Tourism establishments report. Q.4 Basic documentation - TSA sources and methods documents:
International visitor survey (IVS) – www.mas.gov.sa Domestic and Outbound tourism survey (DOTS) –– www.mas.gov.sa Tourism Establishments Survey (TES) – www.mas.gov.sa Hotel Statistics Survey (HSS) – www.mas.gov.sa
Q.5 Dissemination formats of TSA data: • Hard copy – Annual publication(s):
• Title: Tourism Satellite Accounts Report 2005. • Language(s): Arabic + English language.
• Electronic – Internet: • Website: www.mas.gov.sa • Table reference/title: Tourism Satellite Accounts Report 2005. • Language: Arabic + English language.
Q.6 Person in charge for TSA: • Name: Dr. Mohammed Al Ahmed. • Title: Head of the Tourism Information & Research Centre – MAS Center. • Organization: Saudi Commission for Tourism & Antiquities (SCTA). • E-mail: [email protected] • Name: Munthir M. Al. Ansari. • Title: Acting Manager of Tourism Information Department – MAS Center. • Organization: Saudi Commission for Tourism & Antiquities (SCTA) • E-mail: [email protected]
SVK
Q.1 Present stage of implementation: For the moment, TSA tables 1-4.are only compiled for years 2003-2005, tables 5 and 6 for 2005 only and table 7 for 2005 and
2006. TSA is compiled on an experimental basis, within the INFOSTAT project, in cooperation with the National Statistical Office as well as the Ministry of Economy (tourism section). Data are not officially published. The methodology and approaches used are only described in the Slovak version of the methodology.
Q.2 General methodological approach: For the compilation of Tables 5 and 6, the Supply and Use tables of National Accounts for year 2005 were used as well as data from basic statistics (structural business surveys). Within table 6, the demand and the supply sides were balanced. Trade margins that appear in table 6 were estimated from the supply side.
Q.3 Institution in charge for compilation: • Name: The National Statistical Office of the Slovak Republic (SOSR) in cooperation with INFOSTAT (research institution). • Comments: SOSR is responsible for financing the work and compiling TSA in the future. Within the research process,
INFOSTAT was responsible to suggest the approaches and steps for the compilation of the tables, and applied these approaches experimentally in the compilation of the TSA tables.
Q.4 Basic documentation - TSA sources and methods documents: Outputs of INFOSTAT work containing methodology, data sources and all results are published in documents (papers), which are accessible in INFOSTAT library. (unpublished working document). Presentation of papers on INFOSTAT`s website is just being prepared.
Q.5 Dissemination formats of TSA data: • Hard copy – Annual publication(s):
• Title: System of tourism accounts in the Slovak Republic (working document, not published). • Language(s): Slovak.
• Electronic • Website: www.infoatat.sk (in process) • Languages: Slovak/english
Q.6 Person in charge for TSA: • Name: Lea Bartalosova • Title: • Organization: National Statistical office of the Slovak Republic. • E-mail: [email protected] • Name: Viera Hajnovicova. • Title: • Organization: INFOSTAT. • E-mail: [email protected] Latest year available: Table 1-4, 7 for 2006. Reference year of TSA data: 2005.
SVN
Q.1 Present stage of implementation: With the purpose of supervising activities and giving expert guidance of work the Project Advisory Committee – PAC was established, composed by representatives of the Ministry of the Economy, the Statistical Office of the Republic of Slovenia, The National Bank of Slovenia, the Slovenian Tourist Board and the Government Macroeconomic Research Institute as well as partners from the Tourism and Hospitality Chamber. The Project Advisory Committee met several times during the project, dealing mainly with topics of methodology, statistical and other sources, and the procedures for estimating tourism consumption and production.
Q.2 General methodological approach: A Feasibility study was prepared for the implementation of the TSA in Slovenia in 2001. In 2004 the project “Implementation of TSA in Slovenia” was completed with data corresponding to year 2000. In 2007 the project “Economic Importance of Tourism in Slovenia in 2003 and Extrapolation of trends to 2006 (using the Tourism Satellite Accounts methodology)” (data for 2003) was published. In this project all basic TSA tables were developed for 2003, except T8 and T9. Both direct and indirect effects were calculated, using input-output tables of the Slovenian economy. The data reported in the present questionnaire however, cover only direct effects. The National Statistical Office of the Republic of Slovenia is going to carry out the TSA project as part of its programme of work beginning in 2010 or 2011 with the TSA tables for year 2009. (frequency: 3 years period).
Q.3 Institution in charge for compilation:

32
• Name: Ministry of the Economy • Comments:
The project was co-financed by the European Commission, co-ordinated by the Ministry of the Economy and carried out by the Faculty of Economics, University of Ljubljana and Institute for Socio-economic and business evaluation at the Faculty of Economics, University of Ljubljana. Other institutions also contributed to the project (National Statistical Office of the Republic of Slovenia, Bank of Slovenia, Chamber of Commerce of Slovenia and Slovenian Tourist Organization). The project is based on TSA-RMF 2000. Throughout the project our work was based on the TSA implementation manual prepared by Eurostat and TSA-RMF by UNWTO as well as solutions and experiences from our first project “implementation of TSA in Slovenia” implemented in 2004 (which was also co-financed by the EC) and experiences of countries that have already implemented TSA methodology. A brochure titled “.Economic Importance of Tourism in Slovenia in 2003 and Extrapolation of trends to 2006” was published in 2008 by the Ministry of the Economy.
Q.4 Basic documentation: • TSA sources and methods documents:
Eurostat, Schaffer and Manente (2004). European TSA implementation manual. UNWTO (2000). TSA-RMF.
• Other related publications and studies: http://www.stat.si http://www.slovenia.info http://www.mg.gov.si/si/delovna_podrocja/turizem/raziskave_in_razvoj/ Ministry of the Economy, Implementation of TSA in Slovenia (2004).
Q.5 Dissemination formats of TSA data: • Hard copy: - A brochure:
• Title: “.Economic Importance of Tourism in Slovenia in 2003 and Extrapolation of trends to 2006” • Periodicity: None. • Language(s): Slovene (abstract in English).
• Electronic: • Internet:
• Website::http://www.mg.gov.si/fileadmin/mg.gov.si/pageuploads/razpisi/JN/DT/Brosura-TSA.pdf Also published on the web site: http://slovenia.info
• Language(s): Slovene (abstract in English). • Other (included restricted dissemination):
• Format: Power Point Presentations. • Title: The Slovene TSA implementation project • Language(s): Slovene, English. • Comments: • project results and findings were presented at the CEI workshop “Measuring the economic importance of Tourism
in CEI Member States” in Dolenjske Toplice, October 2007 • a final report was submitted to the Ministry of Economy, EU and other international institutions related to tourism,
with copies also sent to the main governmental institutions being related to tourism, key national and regional economic institutions like Chamber of Commerce,
• an abstract and main findings of the project will be uploaded on main national websites that are responsible and related to tourism
• a broad presentation of the results of the project were presented and discussed at the annual meeting of Slovenian tourism community (the Slovenian Tourism Forum) and at some other occasions,
• project results and findings were presented in domestic and foreign tourism and economic professional periodicals • project results and findings were presented at the conference “An Enterprise Odyssey: Tourism – Governance and
Enterpreneurship” and • at the First Eurostat Workshop in the frame of the Eurostat Project on TSA in Prague in September 2008, • project results and findings were presented to UNWTO, Eurostat and CEI, • project results and findings were presented to students in high schools and faculties in Slovenia.
Q.6 Person in charge for TSA: For year 2007: • Name: Jasna Radič. • Title: Secretary. • Organization: Ministry of the Economy, Directorate for Tourism. • E-mail: [email protected] Latest year available: 2003, extrapolation for 2006.
ZAF
Q.3 Institution in charge for compilation: Statistics South Africa. Q.4 Basic documentation: • TSA sources and methods documents: The TSA sources and methods document for the TSA for South Africa is currently
an internal document only available to the TSA working group • Other related publications and studies: All are available on Statistics South Africa website (www.statssa.gov.za).
• Status of the Tourism Satellite Account in South Africa (discussion document D0405.3, April 2005). • Country experience in the compilation of Tourism Satellite Accounts (discussion document D0405.4, February 2007). • Statistics of the Tourism Satellite Account and assessment of data sources related to tourism in South Africa (discussion
document D0405.5, April 2007). • Linking government strategies and the Tourism Satellite Account in South Africa (discussion doc. D0405.6, October
2007). Q.6 Person in charge for TSA: • Name: Riaan Grobler. • Title: Manager: Application of National Accounts.

33
• Organization: Statistics South Africa. • E-mail: [email protected]
ESP
Q.1 Present stage of implementation: Series available: 1995 – 2006. All the TSA – Tables. Q.3 Institution in charge for compilation: National Statistical Office (National Accounts Department). Q.4 Basic documentation: • TSA sources and methods documents:
• 2000 TSA-RMF. • Spanish Tourism Satellite Account: Methodological note. • http://www.ine.es/en/metodologia/t35/metosatel_en.htm
• Other related publications and studies: • Cañada, A.; Roig, R. (2001) Basic characteristics of the Spanish Tourism Satellite Account. Workshop on Tourism
Statistics, EUROSTAT-INE. Budapest, June 2001. • Cañada, A.; Prado, J.; Roig, R. (2002) La Contabilidad Nacional según el SEC 95 como marco para la estimación de las
Cuentas Satélites del Turismo. Methodological Workshop on Tourism Statistics related to the Council Directive 95/57/EC and Tourism Satellite Accounts. EUROSTAT-INE-IET. Madrid. March 2002
• Cañada, A.; Prado, J; Roig, R. (2002) The Spanish pilot TSA. First estimates and the Spanish experience in the compilation process. Proceedings of the 6th International Forum on Tourism Statistics, EUROSTAT–OECD-Hungarian Central Statistical Office. Budapest. September
• Cañada, A.; Roig, R. (2004) Extensions of the Spanish TSA: Constant prices and regional estimates. 7th International Forum on Tourism Statistics, EUROSTAT–OECD-Statistics Swedish-Swedish Tourist Authority. Stockholm. June 2004.
• Cañada, A; Prado, J; Roig, R. (2006) Business trips and other segments in the TSA framework: methodological approach and main results from the Spanish experience. 8th International Forum on Tourism Statistics, EUROSTAT-OECD-Instituto Nacional de Estadística- Instituto de Estudios Turísticos. Cáceres. November 2006.
Q.5 Dissemination formats of TSA data- Electronic – Internet – Website: http://www.ine.es Q.6 Person in charge for TSA: • Name: Mr Agustin Cañada. • Title: Deputy Head, National Accounts Department. • E-mail: [email protected] • Name: Mr Rafael Roig. • Title: Technical Adviser, National Accounts Department. • E-mail: [email protected] • Name: Mr Jesús Prado. • Title: Senior Statistician, National Accounts Department. • E-mail: [email protected] • Organization: National Statistical Institute. Latest year available: 2006 (demand) 2004 (supply).
SWE
Q.1 Present stage of implementation: TSA has been compiled each year since the mid 90-ies. TSA/RMF tables 1, 2 and 4 are provided and work is in progress on table 9. Employment by industry is also provided as well as tourism value added in relation to GDP.
Q.3 Institution in charge for compilation: • Name: Statistics Sweden/National Accounts. • Comments: The TSA is compiled on commission from NUTEK, the responsible National Tourism Agency in Sweden. Q.4 Basic documentation: • TSA sources and methods documents: www.nutek.se http://www.nutek.se/sb/d/759 • Other related publications and studies: Q.5 Dissemination formats of TSA data - Electronic- Internet - Language(s): Swedish, some English. Q.6 Person in charge for TSA: • Name: Birgitta Magnusson Wärmark. • Organization: Statistics Sweden, National Accounts. • E-mail: [email protected]
CHE
Q.1 Present stage of implementation: Switzerland plans to establish a fully fledged TSA every 3-4 years, plus a set of indicators for the intermediate years.
Q.2 General methodological approach: The Swiss TSA uses a simplified regression approach for certain tourism products at the level of all municipalities. The dependent variable is employment in a particular tourism industry and the independent variable is the percentage of the number of visitors overnights over all overnights spent (by visitors and non visitors) in the municipality.
Q.3 Institution in charge for compilation: • Name: Swiss Federal Statistical Office. • Comments: The TSA is published by the FSO in coordination with the State Secretariat for Economic Affairs (SECO). Q.4 Basic documentation - TSA sources and methods documents: • Tourism Satellite Account for Switzerland, 2001 and 2005
http://www.bfs.admin.ch/bfs/portal/de/index/themen/10/22/publ.html?publicationID=3405 (German). http://www.bfs.admin.ch/bfs/portal/fr/index/themen/10/22/publ.html?publicationID=3406 (French). http://www.bfs.admin.ch/bfs/portal/en/index/infothek/publ.html?publicationID=3432 (English).
• Steckbrief/Fiche signalétique: http://www.bfs.admin.ch/bfs/portal/de/index/infothek/erhebungen__quellen/blank/blank/tsa/01.html (German). http://www.bfs.admin.ch/bfs/portal/fr/index/infothek/erhebungen__quellen/blank/blank/tsa/01.html (French).
Q.5 Dissemination formats of TSA data: • Hard copy – Annual publication(s):
• Title: Tourism Satellite Account for Switzerland, 2001 and 2005.

34
• Language(s): German, French, English. • Electronic:
• Internet: • Website: http://www.bfs.admin.ch/bfs/portal/en/index/infothek/publ.html • Language(s): English, German, French.
Q.6 Person in charge for TSA: • Name: Thomas Baumann. • Title: Economist • Organization: Swiss Federal Statistical Office FSO. • E-mail: [email protected]
TTO
Q.1 Present stage of implementation: A first simulated TSA for TT was compiled on year 2005 and projections were made up to year 2015. The study focused on the impact of the Travel and Tourism industry on jobs and the economy. As such it dealt with job creation, contribution to GDP, gross expenditure by Tourists etc.
Q.2 General methodological approach: The exercise, a simulation, was developed by the World Travel and Tourism Council (WTTC) and is the closest available to a full TSA though the approach does not provide information to fill in most of the requests formulated in this questionnaire. The report has been distributed to all the major stakeholders in Trinidad and Tobago. At present work is currently done on a new "TSA" exercise.
Q.3 Institution in charge for compilation: The Tourism Development Company (TDC) took the lead in this exercise and has been responsible for the completion of the first simulated TSA for Trinidad and Tobago. They had the resources especially financial resources, and the dedicated staff to assign to this exercise to work alongside the Consultants. The National Statistical Office contributed to the exercise by providing the team with all the available requested data. However the TDC suffers from a very rapid staff turnover and thus lacks sustainability. As a result there has been no updating of the TSA. The National Statistical Office deals primarily with the hotels and guest houses from the point of view of their contribution to GDP. Other stakeholders include the Hotels Association, Yachting Association, Ministry of Tourism, Tour Guides Association…This exercise can only be sustained via the mutual cooperation among all stakeholders, with the TDC being the driver.
Q.6 Person in charge for TSA: • Name: Clifford Lewis. • Title: Senior Statistician. • Organization: Central Statistical office. • E-mail: [email protected]
USA
Q.1 Present stage of implementation: Published annual and quarterly estimates; 1998 through the third quarter of 2008. Compliant with TSA RMF where possible. Limited data in some areas. The U.S. TSA is linked to the National Accounts through the annual input output table. It was initially developed in the early 1990s. Funding is provided by the NTA. http://www.bea.gov/industry/index.htm#satellite
Q.2 General methodological approach: • Publication of TSA data includes estimates: Indirect, yes. Induced, no. • Comments:
The foundation for the U.S. TSA is the input-output table. TSA:RMF is followed where data allow. Input output multipliers are used to estimate indirect affects. No induced effects are included.
Q.3 Institution in charge for compilation: • Name: Bureau of Economic Analysis, U.S. Department of Commerce. • Comments: The U.S. TSA is financed by the U.S. NTO (Office of Travel and Tourism Industries, International Trade
Administration, U.S. Department of Commerce). Q.4 Basic documentation: • TSA sources and methods documents:
• http://www.bea.gov/industry/index.htm#satellite • http://www.bea.gov/industry/iedguide.htm#TTSA
• Other related publications and studies: • http://www.bea.gov/newsreleases/industry/tourism/tournewsrelease.htm • http://www.bea.gov/scb/pdf/2008/06%20June/0608_travel.pdf • http://www.bea.gov/industry/tourism_data.htm
Q.5 Dissemination formats of TSA data: • Hard copy – Annual publication(s):
• Title: Survey of Current Business. • Language(s): English.
• Electronic • Internet: http://www.bea.gov/newsreleases/industry/tourism/tournewsrelease.htm
• Website: http://www.bea.gov/index.htm • Table reference/title: http://www.bea.gov/industry/index.htm#satellite • Language: English.
Q.6 Person in charge for TSA: • Name: Brian Moyer. • Title: Associate Director. • Organization: U.S. Bureau of Economic Analysis. • E-mail: [email protected]

35
3. Selected aggregates and tables of results
List of Countries 3
Australia ___________ AUS Austria_____________ AUT Canada ____________CAN Chile ______________ CHL China______________CHN Colombia___________ COL Cuba ______________CUB Cyprus_____________ CYP Czech Republic______ CZE Denmark ___________DNK Ecuador____________ ECU Egypt______________ EGY Finland _____________FIN
France ____________ FRA Honduras __________ HND India _______________ IND Indonesia ___________ IDN Ireland _____________ IRL Israel_______________ ISR Japan _____________ JPN Kazakhstan_________ KAZ Latvia _____________ LVA Lithuania___________ LTU Mexico ____________ MEX Morocco ___________ MAR Netherlands ________ NLD
New Zealand ________ NZL Oman_____________ OMN Peru_______________PER Philippines __________ PHL Poland _____________POL Romania __________ ROU Saudi Arabia ________KSA Slovakia____________SVK Slovenia____________SVN Spain ______________ ESP Sweden ___________ SWE Switzerland _________CHE United States________USA
3 Only 39 of the 48 countries identified in chapter 2 have already developed or are currently developing a TSA exercise. The data included in this chapter 3 refer to this new subset. In addition to these 39 countries: - Others 8 European countries have been identified as having a TSA:
Belgium Estonia Germany Greece Hungary Italy Portugal United Kingdom
The research carried on by Eurostat and published as “Tourism Satellite Accounts in the European Union” (4 volumes - http://epp.eurostat.ec.europa.eu/portal/page/portal/tourism/methodology), includes data and information for all European countries.
- Other 5 Asian countries have been identified as already implementing or currently developing TSA
Hong Kong, China Korea, Republic of Malaysia Singapore Taiwan, Prov. of China
Consequently, a total of 52 countries have been identified by early 2010 as having already produced or are currently developing a TSA exercise. Other countries could also be added to this list in the coming two years.

36
T.1. Basic aggregates
AU
S
AU
T
CA
N
CH
L
CH
N
CO
L
CU
B
CY
P
CZ
E
DN
K
2002-03 2005 2002 2003 2002 2000 2007 2006 2006 2006
$ €Canadian
$Pesos
chilenosRMB Pesos € DKK
Millions Billions Millions Billions Billions Millions Millions Millions
• 74,974 28.05 56,559 3,483 94.85 7,115,356 1,548,025,640 7,648 71,800
• 19,592 14.36 18,115 766 8.7066 1,893,002 1,982.2 1,300,763,082 4,184 36,417
• 55,382 13.69 38,444 2,611 86.143 5,222,354 247,262,558 3,464 35,383
• 17,234 0.00 20,627 751 0.42002 2,499,757 468,612,405 2,475
• 128,966 20.50 54,362 1,395 49.962 27,349,003 15,043.2 2,337,898,635 2,161 99,636
• 28,665 13.34 23,319 1,596 44.663 3,403,704 696,348,288 2,998 33,831
• 34,483 0.00 (¶) 1,611 0.00 3,717,115 1,008,585,991 3,492
• 841,351 244.45 1,152,905 51,156 1,063.4 196,373,851 58,603.6 8,287,000,000 114,605 1,658,917
• 168,714 130.01 479,185 18,484 0.00 34,142,398 11,917.9 3,959,000,000 86,863 557,658
• 168,714 122.07 428,301 16,337 0.00 37,051,610 10,332.6 4,315,900,000 82,941 557,375
• 9,528,000 298,740.00 15,586,394 149,707 1,009.8 0 4,867.7 0 5,047,221 2,821,641
(¶) (¶) (¶) (¶) (¶) (¶) (¶)
Inbound tourism consumption
Domestic tourism consumption
Imports of goods and services
Outbound tourism consumption
Gross value added of tourism industries
Tourism direct gross value added b.p.
Exports of goods and services
Internal tourism consumption
Tourism direct gross domestic product p.p
Total jobs
Comments
Tab
le 1
. Bas
ic a
gg
reg
ates
Year
Currency
Units
Gross domestic product (GDP p.p.)
EC
U
EG
Y
FIN
FR
A
HN
D
IND
IDN
IRL
ISR
JPN
2003 2007 2006 2005 2005 2002-03 2000 2004 2007
US $ US $ € € Lempiras INR € NIS Yens
Thousands Billions Millions Billions Millions Millions Millions Millions Billions
• 2,020,647 10,233 145.1 20,589 1,728,540 6,803 22,810
• 619,096 9.5 2,788 43.4 9,359 314,080 3,637 8,424 1,483
• 1,401,551 5,293 101.7 11,230 1,414,460 3,141 13,340 21,327
• 589,213 0 30.9 6,078 52,660 2,644 12,531 4,338
• 0 5,572 0.0 6,284 2,407,655 0 61,148 0
• 1,164,801 (¶) 0.0 9,741 624,360 0 8,970 0
• 0 (¶) 64.0 16,573 0 0 9,922 9,569
• 27,087,919 127 167,041 1,726.1 183,748 24,695,640 104,845 565,576 515,084
• 7,329,470 425 75,489 449.8 108,802 3,758,730 102,885 236,028 92,222
• 0 46.7 67,195 464,6 141,471 3,852,710 88,697 226,063 84,218
• 0 23 Mill (¶) 24,775 139,713 468,740 1,670,700 2.4 64,246,000
(¶) (¶) (¶) (¶) (¶) (¶) (¶) (¶)
Internal tourism consumption
Tourism direct gross domestic product p.p
Total jobs
Comments
Tab
le 1
. B
asic
ag
gre
gat
es
Year
Currency
Units
Gross domestic product (GDP p.p.)
Inbound tourism consumption
Domestic tourism consumption
Imports of goods and services
Outbound tourism consumption
Gross value added of tourism industriesTourism direct gross value added b.p.
Exports of goods and services
KA
Z
LV
A
LT
U
ME
X
MA
R
NL
D
NZ
L
OM
N
PE
R
PH
L
2006 2004 2006 2006 2005 2007 2007 2007 2001 2007
TengueLatvian
LatsLTL Pesos US $ Nuevos Soles PhP
Billions Thousands Millions Millions Thousands Millions Millions
• 354,9 396.417 3.689,3 1.215.479 7.786 35.280 20.084 726.127 10.439,5 1.069.799
• 122,0 192.004 1.607,7 166.599 5.544 6.782 8.798 162.925 2.672,9 201.942
• 232,9 203.766 2.081,6 1.048.880 2.242 28.498 11.286 563.202 7.766,6 862.938
• 132,9 225.157 2.949,3 102.527 3.499 14.274 (¶) 328.054 2.624,5 79.640
• 7,4 390.947 1.139,5 298.382 25.809 4.143 457.497 5.269,1 0
• 180,1 172.461 1.983,4 809.406 14.169 7.871 457.497 5.846,0 411.918
• 190,1 193.157 0,0 0 17.120 20.084 0 6.164,4 0
• 10.213,7 7.434.454 82.792,8 10.306.839 4.217 567.066 166.243 16.010.320 187.251,0 6.648.235
• 5.176,1 2.150.207 53.371,8 2.904.137 424.827 48.199 895.000 30.019,6 2.833.634
• 4.082,9 3.805.258 66.537,3 3.037.584 376.111 50.528 643.300 32.955,5 2.802.659
• 0,0 1.018 1.589,2 36.193.069 346.000 9.167.000 181.200 0 251,3 33.641
(¶) (¶) (¶)
Inbound tourism consumption
Domestic tourism consumption
Imports of goods and services
Outbound tourism consumption
Gross value added of tourism industriesTourism direct gross value added b.p.
Exports of goods and services
Internal tourism consumption
Tourism direct gross domestic product p.p
Total jobs
Comments
Tab
le 1
. B
asic
ag
gre
gat
es
Year
Currency
Units
Gross domestic product (GDP p.p.)
PO
L
RO
U
KS
A
SV
K
SV
N
ES
P
SW
E
CH
E
US
A
2002 2001 2005 2005 2003 2004 2007 2005 2006
Polish Zloty PLN
RomanianLEU
SAR SKK CHF US $
Thousands Billions Millions Millions Millions Billions
• 24,327,343 48,419.9 57,777 91,655 2,166.7 92,440.1 0 32,561 677,706
• 14,356,476 21,083.0 22,234 51,206 1,157.9 39,627.7 0 12,027 83,981
• 9,970,107 23,109.0 35,543 40,449 932.6 39,096.7 0 18,421 593,725
• (¶) 0.0 15,128 32,818 744.8 13,694.0 0 0 125,820
• 219,483,401 45,117.3 36,444 54,171 1,342.2 168,576.2 0 0 13,205,406
• 13,209,286 22,879.2 36,444 34,002 824.0 49,149.2 0 12,647 0
• 16,283,193 25,417.3 59,077 42,504 1,229.0 56,713.9 0 0 349,157
• 807,859,426 1,167,687.0 1,183,000 1,485,671 24,875.6 841,042.0 0 463,139 13,178,376
• 56,777,000 389,147.4 719,898 1,132,828 11,954.8 218,201.0 0 226,250 1,322,441
• 63,177,000 479,645.9 328,678 1,200,966 14,259.0 251,800.0 0 196,074 2,084,456
• 613,835 4,609.9 332,275 2,057,045 896.0 19,334.1 0 138,203 136,086,000
(¶) (¶) (¶) (¶) (¶) (¶)
Inbound tourism consumption
Domestic tourism consumption
Imports of goods and services
Outbound tourism consumption
Gross value added of tourism industries
Tourism direct gross value added b.p.
Exports of goods and services
Internal tourism consumption
Tourism direct gross domestic product p.p
Total jobs
Comments
Tab
le 1
. Bas
ic a
gg
reg
ates
Year
Currency
Units
Gross domestic product (GDP p.p.)
(█) No answer / (¶) Comments

37
Comments
AUS
Comments: The reference year covers the period 1 July 2003 to 30 June 2004. This is the most recent period for which the full scale
Australian Tourism Satellite Account has been compiled. Note that total jobs refer to total number of employed persons aggregated over all industries of the Australian economy.
AUT Domestic tourism consumption: Including “Other components of visitor consumption”. Total jobs: In thousand.
CAN Comments: Tourism domestic product is not available at purchasers’ prices.
CHL
Internal tourism consumption: In accordance with the methodology proposed in TSA-RMF Internal Tourism Consumption includes other components of visitor consumption, such as, for example, second homes, which is why this figure is not the sum of the variables that follow, as seems to be suggested by this form of presentation.
Gross value added of tourism industries: Does not include tourism-related or tourism-specific industries. Tourism gross value added b.p. : Includes tourism-related and tourism-specific activities. Tourism gross domestic product p.p. : Estimated, since T6 is not prepared within an input-output type of framework.
CHN Gross value added of tourism industries, Tourism gross value added b.p. and Gross domestic product (GDP p.p.):
Producers’ prices are used here. Total jobs: in thousand
COL Total jobs: Not available.
CUB Internal tourism consumption: MCUC: millions of convertible Cuban pesos. Gross value added of tourism industries: Retail trade, restaurants and hotels. Gross domestic product (GDP p.p ): GDP at Market Prices (Current).
ECU
Comments: T4 expressed in thousands of dollars. Includes inbound and internal consumption, in cash and in kind. T5 expressed in thousands of dollars. T6 expressed in thousands of dollars. T7 corresponds to direct jobs.
EGY Inbound tourism consumption / GDP: Accounts for 6.1 %. Jobs in the tourism industries: Have been estimated in 1.8 millions.
FIN Tourism gross value added b.p.: Incl. employers' expenses / excl. employers' expenses = 3,410 / 2,728. Tourism gross domestic product p.p.: Incl. employers' expenses / excl. employers' expenses = 3,930 / 3,144. Total Jobs: Total number of employed persons 2 440 000.
FRA
Total jobs: In millions of full time equivalent jobs. Comments: 1) “Outbound tourism consumption” is out of the scope of the present French TSA project but this aggregate is roughly estimated
here by adding up the travel and passenger transport expenditure recorded in the French Balance of Payments (compiled by “Banque de France”).
2) No estimate of the “gross value added of tourism industries” is given in Table 1 since production accounts (including the “value added” item) are not established in French NA for these “tourism industries” which are listed in the requested Table 6 (“Gross value added and tourism gross value added by industry”) of the Questionnaire (“TSA selected data and related comments”). For instance, the gross value added for railways passenger transport or for air or water passenger transport are not compiled in French NA because it is not always easy, at a macroeconomic level, to break down all production costs of transport services between passengers and freight. Similarly, although some “passenger transport supporting services” could be considered as tourism characteristic activities in France, their outputs account only for a tiny part of the total output of the “Storage and transport supporting services” for which a production account is established in French NA.
3) As a consequence of 2), the method suggested in the TSA:RMF 2008 document (§4.56.) for calculating “tourism gross value added” by applying appropriate tourism output ratios to the intermediate consumption of the “tourism industries” is not really workable in the French context.
4) As explained further below in our comments on Table 6 bis (proposed instead of the requested Table 6) , “tourism gross domestic product” (at purchasers prices) has been estimated in the French TSA Project on the basis of the INSEE-run business accounts database which provides some proxy “Value added / output” ratios (at producers prices) by industry in a more detailed industry classification than that used in French NA publications.
HND Comments: The figures been presented are still in the process of revision, and therefore cannot be considered official or final.
IND
Comments: Total jobs: in millions Total tourism jobs: 21.54 (millions) TGVA, GVA and GDP) are at factor cost. Indicators not at p.p., but at market prices. The figures in India’s TSA are available in crore or lakh. For international comparability, the figures in the above table have
been reported in INR million (1 crore = 10 million, 1 lakh= 100,000). ISR Imports of goods and services: Imports include net taxes.
MEX Gross value added of tourism industries: Only Characteristics Goods and Services b.p.. Tourism gross domestic product p.p.: GDP is only available at Global Level.
NZL
Year: Ended March 2007. Outbound tourism consumption: Outbound estimates are included within Domestic tourism consumption. Gross value added of tourism industries: Direct tourism value added of tourism-characteristic industries is used in this instance.Tourism gross value added b.p.: New Zealand TSA data are not available at basic prices; calculations provided are at
purchasers’ prices. Tourism gross domestic product p.p.: Total Tourism Expenditure.

38
PHL
Internal tourism expenditure: Also includes expenditures of meetings and conventions organizers paid on behalf of the visitors. Gross value added of tourism industries and Tourism gross domestic product: Available only for year 2000. Among the
three aggregates GVATI, TDGVA and TDGDP, only the last two would substantially represent the contribution of tourism to the economy. However, TDGDP compared to TDGVA requires more data and assumptions, making it difficult to compile for period other than IO year. Hence, for this exercise only TDGVA was estimated for years 2001 onward.
POL Outbound tourism consumption: Not available. ROU Total jobs: Thousands End of year employment – stock of personnel existing at December 31st . KSA Gross domestic product (GDP p.p.): Billions. SVN Total jobs: Thousands.
CHE
Inbound tourism consumption and Domestic tourism consumption: Direct tourism demand only. Total jobs: Total tourism employment in full-time equivalents (FTE). Comments: Swiss TSA only calculates Tourism gross value added and not Tourism gross domestic product. The reason for this
is that taxes and subsidies on products are not available at the level of industries in the Swiss national accounts. USA Total jobs: Not billions.

39
T.2. TSA related indicators
AU
S
AU
T
CA
N
CH
L
CH
N
CO
L
CU
B
CY
P
CZ
E
DN
K
• (¶) 2007 2004 2006 2005 2007 2007
• (¶) 2005 2002 2003 2002 2000 2006 2006 2006
A.
• 2.3 5.9 1.6 1.5 0.8 1.0 15.7 3.7 2.2
• 6.6 5.6 3.3 5.1 8.1 2.7 3.0 3.0 2.1
• 26.1 51.2 32.0 22.0 9.2 26.6 84.0 54.7 50.7
• 73.9 48.8 68.0 75.0 90.8 73.4 16.0 45.3 49.3
B.
• 16.80 8.40 5.10 2.90 0.00 1.49 31.00 2.10 7.2
• 3.70 5.50 2.20 3.30 0.00 1.86 9.00 2.90 2.4
• 4.10 0.00 (¶) 3.10 4.20 1.89 12.00 3.00
C.
• 13.3 11.0 3.8 4.1 0.0 5.5 33.0 4.8 6.5
• 10.2 0.0 4.8 4.6 0.0 6.7 11.0 3.0 7.0
D.
• 4.8 7.2 11.1 2.6 2.3 0.0 0.0 3.3 5.5
(¶) (¶) (¶) (¶) (¶) (¶) (¶) (¶)
Outbound tourism consumption / Imports of goodsand services
Reference year of TSA data
Latest year available
In terms of visitors consumption
Tab
le 2
. TS
A r
elat
ed i
nd
icat
ors
Inbound tourism consumption / Internal tourismconsumption
Domestic tourism consumption / Internal tourismconsumption
Jobs in the tourism industries / Total jobs
Domestic tourism consumption / GDP p.p.
Next reference year
Comments
Inbound tourism consumption / GDP p.p.
In terms of international trade of goods andservices
In terms of production of goods and services
In terms of number of jobs
Gross value added of tourism industries(GVATI b.p.)/GVA b.p.
Tourism gross value added (TGVA b.p.)/GVA b.p.
Tourism gross domestic product (TGDP p.p. )/GD
p.p.
Inbound tourism consumption / Exports of goodsand services
EC
U
EG
Y
FIN
FR
A
HN
D
IND
IDN
IRL
ISR
JPN
• (¶) 2007 2006 2007 2008
• 2003 2006 2005 2005 (¶) 2000 2004 2007
A.
• 8.4 1.7 2.5 5.1 1.3 3.5 1.5 0.3
• 19.1 3.2 5.9 6.1 5.7 3.0 2.4 4.1
• 30.6 27.2 29.9 45.5 18.2 53.5 39.0 6.5
• 69.4 51.7 70.1 54.5 81.8 46.2 61.0 93.5
B.
• 4.38 3.80 0.00 3.74 10.70 0.00 12.00 0.00
• 0.00 (¶) 0.00 5.80 2.78 0.00 1.80 0.00
• 4.10 (¶) 3.70 5.70 0.00 0.00 1.75 1.90
C.
• 8.4 3.7 9.7 8.6 8.4 4.0 3.6 1.6
• 7.4 0.0 6.7 4.3 1.4 3.0 5.9 5.2
D.
• 1.8 0.0 0.0 5.3 4.6 4.5 2.6 2.8
(¶) (¶) (¶) (¶) (¶) (¶)
Next reference year
Comments
Inbound tourism consumption / GDP p.p.
In terms of international trade of goods andservices
In terms of production of goods and services
In terms of number of jobs
Gross value added of tourism industries(GVATI b.p.)/GVA b.p.
Tourism gross value added (TGVA b.p.)/GVA b.p.
Tourism gross domestic product (TGDP p.p. )/GDP
p.p.
Inbound tourism consumption / Exports of goodsand services
Outbound tourism consumption / Imports ofgoods and services
Reference year of TSA data
Latest year available
In terms of visitors consumption
Tab
le 2
. T
SA
rel
ated
in
dic
ato
rs
Inbound tourism consumption / Internal tourismconsumption
Domestic tourism consumption / Internal tourismconsumption
Jobs in the tourism industries / Total jobs
Domestic tourism consumption / GDP p.p.

40
KA
Z
LV
A
LT
U
ME
X
MA
R
NL
D
NZ
L
OM
N
PE
R
PH
L
• 2005 2007 2005 (¶) 2007 2008
• 2004 2006 2006 2007 (¶) 2007 2001 2007
A.
• 1.2 2.6 1.9 1.6 9.3 1.2 5.3 1.0 1.4 3.0
• 2.3 2.7 2.5 10.2 3.8 5.0 6.8 3.5 4.1 13.0
• 34.4 48.4 43.6 13.7 71.2 19.2 43.8 22.4 25.6 18.9
• 65.6 51.4 56.4 86.3 28.8 80.8 56.2 77.6 74.4 80.7
B.
• 10.00 5.87 34.70 3.00 4.60 2.00 0.00 3.1 10.16
• 1.90 2.59 2.70 8.20 6.5 2.80 5.00 2.86 3.4 6.19
• 1.90 1.87 2.60 0.00 7.1 3.00 12.00 2.85 3.3 6.87
C.
• 2.4 8.9 3.3 5.7 1.6 18.3 1.8 8.9 7.1
• 3.3 5.9 5.1 3.4 3.8 0.0 5.1 8.0 2.8
D.
• 17.8 9.0 2.6 6.7 4.3 9.7 0.0 3.1 9.7
(¶) (¶)
Outbound tourism consumption / Imports of goodsand services
Reference year of TSA data
Latest year available
In terms of visitors consumption
Tab
le 2
. T
SA
rel
ated
in
dic
ato
rs
Inbound tourism consumption / Internal tourismconsumption
Domestic tourism consumption / Internal tourismconsumption
Jobs in the tourism industries / Total jobs
Domestic tourism consumption / GDP p.p.
Next reference year
Comments
Inbound tourism consumption / GDP p.p.
In terms of international trade of goods andservices
In terms of production of goods and services
In terms of number of jobs
Gross value added of tourism industries(GVATI b.p.)/GVA b.p.
Tourism gross value added (TGVA b.p.)/GVA b.p.
Tourism gross domestic product (TGDP p.p. )/GD
p.p.
Inbound tourism consumption / Exports of goodsand services
PO
L
RO
U
KS
A
SV
K
SV
N
ES
P
SW
E
CH
E
US
A
• 2005 2006 2006 2009 (¶) 2008 2008 2008
• 2002 2001 2005 (¶) (¶) (¶) 2007 2005 (¶)
A.
• 1.8 1.8 1.9 3.4 4.7 4.7 0.0 2.6 0.6
• 1.2 2.0 3.0 2.7 3.7 4.6 0.0 4.0 4.5
• 59.0 43.5 38.5 55.9 53.4 42.9 0.0 36.9 12.4
• 41.0 47.7 61.5 44.1 43.0 42.3 0.0 56.6 87.6
B.
• 30.70 4.33 0.00 4.10 6.20 22.30 0.00 0.00 0.00
• 1.90 2.19 0.00 2.58 3.80 6.50 2.70 2.90 0.00
• 2.00 2.18 5.00 2.86 4.90 10.90 2.80 0.00 0.00
C.
• 2.5 5.4 3.1 4.5 9.7 18.2 5.4 5.3 7.8
• 0.0 0.0 4.6 2.7 6.5 5.4 0.0 0.0 4.6
D.
• 4.8 8.3 (¶) 7.3 11.5 11.8 4.1 4.4 6.2
(¶) (¶) (¶) (¶) (¶) (¶) (¶) (¶)
Outbound tourism consumption / Imports of goodsand services
Reference year of TSA data
Latest year available
In terms of visitors consumption
Tab
le 2
. TS
A r
elat
ed i
nd
icat
ors
Inbound tourism consumption / Internal tourismconsumption
Domestic tourism consumption / Internal tourismconsumption
Jobs in the tourism industries / Total jobs
Domestic tourism consumption / GDP p.p.
Next reference year
Comments
Inbound tourism consumption / GDP p.p.
In terms of international trade of goods andservices
In terms of production of goods and services
In terms of number of jobs
Gross value added of tourism industries(GVATI b.p.)/GVA b.p.
Tourism gross value added (TGVA b.p.)/GVA b.p.
Tourism gross domestic product (TGDP p.p. )/GD
p.p.
Inbound tourism consumption / Exports of goodsand services
(█) No answer / (¶) Comments

41
Comments
AUS
Latest year available of full scale ATSA: 2003-04 (1July 2003 to 30 June 2004 inclusive). Next benchmark year available: 2006-07 (1 July 2006 to 30 June 2007) to be published in June 2010. Comments: The indicator provided in the above table for number of jobs refers to tourism employed persons as a proportion of
total employed persons in Australia. Tourism employed persons refers to the tourism share of employed persons in the tourism industries, and is derived by multiplying the number of employed persons in each tourism characteristic and connected industry by the proportion of total value added of the industry which is related to tourism.
AUT
Outbound tourism consumption / Imports of goods and services: TSA-Table 3 is not available at the moment but being planned in the near future.
Comments: Related to the “TSA for Austria” the starting point of the calculation of “Tourism Gross Value Added” (TGVA) is TSA-Table 6:
• The “tourism ratio” of any given supply of commodities corresponds to the amount purchased by tourists as related to the total supply of the respective commodity.
• These “tourism ratios” are applied to the Gross Value Added (GVA) of the “symmetrically” corresponding industry in TSA-Table 5; the (direct) TGVA of each industry.
• Finally, the total TGVA of the respective industries is related to overall GDP, resulting in the share of tourism in total GDP (2005: 5.5%).
The following overview illustrates the simplified method used for the calculation of TVA. The two characteristic tourism industries “Hotels and similar” and “Restaurant and similar” are shown, including their total output, intermediate consumption and the GVA. The “tourism ratio”, based on the confrontation of total supply by commodity and tourism demand, is applied to GVA; based on this, the TGVA by industry can be calculated.
Tourism characteristic commodity
Total supply (TSA-Table 6)
Tourism demand (TSA-Table 4)
Tourism ratio
Accommodation 100 85 0.85 Meal 70 35 0.50 Tourism characteristic industry
Gross output Intermediate consumption
GVA Tourism ratio TGVA
Hotels and similar 150 75 75 0.85 63.75 Restaurants and similar 100 30 70 0.50 35
CAN Comments: Jobs (directly) attributable to tourism / Total jobs = 3.9%. Tourism Gross domestic product is not available at purchasers’ prices.
CHN Comments: We use producers’ price for GDP, not basic prices.. Jobs here only cover fulltime employment or self-employed: part-time, seasonal or informal employment is not covered.
COL Jobs in the tourism industries / Total Jobs: Not available.
DNK Comments: The Danish “GDP” in 2006 is 1658 917 million DKK according to Statistics Denmark. Gross value added at basic
price is 1389 317 million DKK. The number of jobs is obtained from the population register data from the working places. The persons who work within tourism-related industries are 155 932, which represents 5.53% of total employment.
ECU
Next reference year: Not available. Comments: T4 expressed in thousands of dollars. Includes inbound and internal consumption, in cash and in kind. T5 expressed in thousands of dollars. T6 expressed in thousands of dollars. T7 corresponds to direct jobs.
FIN Tourism gross value added (TGVA b.p.)/GVA b.p.: Incl. employers' expenses / excl. employers' expenses = 2.4% / 1.9%. Tourism gross domestic product (TGDP p.p.)/GDP p.p.: Incl. employers' expenses / excl. employers' expenses = 2.4% / 1.9%.
FRA Inbound tourism consumption / GDP p.p.: 8.4. Comments: The ratios relating to “Gross value added of tourism industries”, “Tourism gross value added (at basic prices” and
“Jobs in the tourism industries” are not given above for the reasons already explained in our comments on Table 1. HND Comments: The figures presented before are still in the process of revision, and therefore cannot be considered as official or final.
IND
Comments: Indicators are not compiled at basic prices but at market prices. So far only one TSA exercise for the reference year 2002-03 has been undertaken in India. Necessary activities have been
initiated to collect the data for the preparation of the second TSA in form of a Domestic Tourism Survey, being conducted during July 2008 - June 2009, and an International Passenger Survey likely to start shortly.
In India, the various National Account aggregates are prepared ‘at factor cost’ and ‘at market prices’, instead of ‘at basic prices’ and ‘at purchasers’ prices’. Therefore, in all the tables of this questionnaire the figures ‘at factor cost’ or ‘at market prices’ have been given in place of ‘at basic prices’ or ‘at purchasers prices’.
To make the Tables 1 and 2 complementary to each other, a row giving total tourism jobs has been inserted in Table 1. In the Indian TSA, the employment to output ratios in various tourism industries, available from National Accounts Statistics and some other sources, have been used to estimate the total number of jobs generated by the tourism activity.
NZL
Year: Ended March 2007. Latest year available: Year ended March 2007 (released June 2008). Next reference year: Year ended March 2009 (to be released October 2009). Gross value added of tourism industries (GVATI b.p.)/GVA b.p. and Tourism gross value added (TGVA b.p.)/GVA b.p.: New
Zealand TSA data is not available at basic prices and instead calculations are provided at purchasers’ prices. Outbound tourism consumption / Imports of goods and services: Outbound estimates are included within Domestic tourism
consumption. Jobs in the tourism industries / Total jobs: Determined by calculating Total Tourism Employment/Total FTE persons engaged.
PHL Gross value added of tourism industries (GVATI)/GVA and Tourism gross domestic product (TGDP )/GDP: For year 2000.

42
POL
Outbound tourism consumption / Imports of goods and services: Not available. Comments: Tourism gross value added has been estimated using two indicators: tourism rate of consumption and specialization
ratio (the share of the primary product to the total output of a given industry); TGVA calculated for tourism industries has been supplemented by TGVA calculated for the secondary output of tourism products in the output of other industries.
ROU Comments: “Total jobs” refers to the number of persons employed at December 31st. The figure for tourism industries includes
also employment in freight transportation companies.
KSA
Jobs in the tourism industries / Total jobs: In terms of number of jobs = 332,275 Jobs in the tourism industries / Total jobs ( private sectors) = 4,4% Jobs in the tourism industries / Total jobs (General and private sectors) = 3,9%
SVK Latest year available: Table 1-4, 7 for 2006. Reference year of TSA data: 2005. Domestic tourism consumption and Outbound tourism consumption: Do not include the consumption of same-day visitors
SVN Latest year available: 2003, extrapolation for 2006. Next reference year: 2009. Comments: 1 EUR=233.7045 SIT.
ESP Latest year available: 2006 (demand) 2004 (supply). Next reference year: 2007 (demand) 2005 (supply). Tourism gross domestic product: Measured from a tourism final demand approach.
CHE A. ALL: Only tourism consumption in cash (other components of visitor consumption (in kind) are not included). Tourism employment/Total employment (in full time equivalents).
USA Latest year available: 2007 (2006 IO based). Jobs in the tourism industries / Total jobs: 8,429,000.

43
T.3. Internal tourism consumption
AU
S
AU
T
CA
N
CH
L
CH
N
CO
L
CU
B
CY
P
CZ
E
DN
K
2003-04 2005 2002 2003 2002 2000 2007 2006 2006
A.
• 0.0 81.1 82.3 74.0 0.0 0.0 0.0 66.3
• 0.0 70.9 83.1 72.5 0.0 0.0 0.0 65.8
• 0.0 89.5 80.4 75.5 0.0 0.0 0.0 0.0 66.7 0.0
1.
• 9.9 34.3 15.9 12.2 17.7 9.0 27.1 16.8 17.3
• 9.1 19.4 12.2 5.4 18.2 9.4 10.0 12.6 25.9
• 12.4 46.8 23.9 23.1 12.8 8.2 30.3 20.3 8.8
2.
• 15.0 26.4 15.1 16.5 18.6 21.0 27.7 23.3 11.8
• 17.1 29.8 14.4 17.5 19.4 25.6 35.4 21.2 9.0
• 9.0 23.5 16.6 15.3 11.2 12.4 26.2 25.0 14.4
3.
• 17.3 12.1 34.6 31.0 17.7 41.0 28.0 16.8 13.9
• 13.3 11.6 38.3 33.3 17.1 42.2 37.9 15.5 24.5
• 29.0 12.5 26.6 27.4 24.5 39.3 26.1 17.9 3.6
4.
• 2.9 0.1 5.2 10.2 3.1 4.5 0.6 3.1 7.3
• 3.4 0.2 7.1 12.8 3.0 6.6 3.5 6.8 5.0
• 1.4 0.0 1.3 2.9 4.6 0.4 0.0 0.0 9.6
5.
• 8.2 0.3 2.2 3.8 0.5 4.2
• 10.0 0.2 2.2 2.2 0.1 6.1
• 6.8 0.4 2.1 6.7 0.6 2.6
6.
• 5.1 7.6 3.8 5.3 0.0 1.6 1.7 4.5
• 5.7 5.6 3.3 5.2 0.0 1.6 2.7 5.5
• 3.4 11.8 6.4 6.3 0.0 1.9 0.9 3.4
7.
• 7.9 3.6 0.0 18.1 0.5 0.0 0.4
• 5.5 5.6 0.0 18.1 0.8 0.0 0.9
• 14.9 0.3 0.0 18.3 0.0 0.0 0.0
B.
• 4.8 8.7 0.0 4.8 0.0 5.2 11.6 14.3
• 4.8 15.0 0.0 5.6 0.0 5.8 11.1 7.2
• 5.0 3.3 0.0 2.7 0.0 4.2 12.1 21.3
C.
• 37.0 10.3 17.7 21.2 17.3 14.9 14.6 22.1 31.0
• 41.3 14.1 16.9 21.9 16.8 7.6 13.1 23.1 22.9
• 25.0 7.1 19.6 21.8 20.2 28.9 25.0 21.2 38.8
(¶) (¶) (¶) (¶) (¶) (¶) (¶)
For each form of tourism, total should amount to 100.0
Tourism characteristic services
Other services
Goods
Travel agencies, tour operators and tourist guideservices
Internal
Recreation and other entertainment services
Internal
Domestic
Inbound
Tab
le 3
. In
tern
al t
ou
rism
co
ns
um
pti
on
, by
pro
du
cts
an
d f
orm
s o
f to
uri
sm (
%)
Accommodation services
Food and beverage serving services
Internal
Domestic
Passenger transport services
Inbound
Domestic
Domestic
Inbound
Internal
Domestic
Inbound
Internal
Domestic
Inbound
Cultural services
Comments
Total (A+B+C)
Inbound
Internal
Domestic
Inbound
Miscellaneous tourism services
Inbound
(¶) (¶)
(¶)
Internal
Domestic
Domestic
Inbound
(¶)
(¶)
Internal
Domestic
Internal
Internal
Inbound

44
EC
U
EG
Y
FIN
FR
A
HN
D
IND
IDN
IRL
ISR
JP
N
2003 2006 2005 2002-03 2000 2004 2007
A.
• 0.0 65.9 0.0 68.0 0.0 0.0 0.0 62.6
• 0.0 62.4 0.0 64.0 0.0 0.0 0.0 63.0
• 0.0 72.7 0.0 72.0 0.0 0.0 0.0 0.0 78.3
1.
• 16.8 10.8 26.0 11.0 6.1 13.2 25.0 15.8
• 9.5 9.0 27.6 3.0 3.5 7.3 28.0 14.7
• 23.5 14.3 22.1 21.0 17.8 18.5 20.0 36.5
2.
• 13.4 20.0 13.5 18.0 6.1 28.2 9.0 10.2
• 7.4 22.1 14.4 10.0 4.7 31.3 8.0 10.2
• 27.5 16.1 11.3 28.0 12.3 25.6 11.0 13.4
3.
• 42.3 25.5 16.4 23.0 62.7 27.0 38.0 27.2
• 55.7 20.8 16.1 34.0 70.5 24.2 39.0 28.0
• 18.1 34.5 17.1 12.0 27.5 29.2 38.0 26.0
4.
• 12.7 2.1 5.1 1.0 9.2 2.5 11.0 2.6
• 16.7 3.2 7.0 0.0 7.2 4.9 15.0 2.8
• 5.6 0.1 0.9 3.0 18.2 0.3 3.0 0.0
5.
• 0.1 2.0 9.0 0.0 0.0 6.0 3.0 0.9
• 0.2 2.1 7.7 0.0 0.0 6.6 4.0 1.0
• 0.0 1.9 12.2 0.0 0.0 5.4 2.0 0.2
6.
• 2.8 3.4 3.7 4.0 1.8 2.0
• 0.9 3.1 4.0 3.0 0.2 2.0
• 7.2 4.1 3.1 5.0 9.3 2.3
7.
• 0.0 2.0 3.8 9.0 0.0 5.1 4.0 3.9
• 0.0 2.1 4.0 14.0 0.0 5.7 2.0 4.2
• 0.0 1.8 3.3 3.0 0.0 4.7 7.0 0.0
B.
• 2.6 0.3 1.0 21.0 0.0 18.0 17.3
• 3.9 0.2 0.9 30.0 0.0 19.9 18.4
• 0.0 0.5 1.3 11.0 0.0 6.3 6.5
C.
• 9.3 33.7 21.4 11.0 14.0 10.0 17.9
• 5.7 37.4 18.3 6.0 13.9 4.0 18.5
• 18.1 26.8 28.7 17.0 14.9 19.0 15.2
(¶) (¶) (¶) (¶) (¶) (¶)
For each form of tourism, total should amount to 100.0
Tourism characteristic services
Other services
Goods
Travel agencies, tour operators and tourist guideservices
Internal
Recreation and other entertainment services
Internal
Domestic
Inbound
Tab
le 3
. In
tern
al t
ou
rism
co
ns
um
pti
on
, by
pro
du
cts
an
d f
orm
s o
f to
uri
sm (
%)
Accommodation services
Food and beverage serving services
Internal
Domestic
Passenger transport services
Inbound
Domestic
Domestic
Inbound
Internal
Domestic
Inbound
Internal
Domestic
Inbound
Cultural services
Comments
Total (A+B+C)
Inbound
Internal
Domestic
Inbound
Miscellaneous tourism services
Inbound
Internal
Domestic
Domestic
Inbound
(¶)
Internal
Domestic
Internal
Internal
Inbound
(¶) (¶)

45
KA
Z
LV
A
LT
U
ME
X
MA
R
NL
D
NZ
L
OM
N
PE
R
PH
L
2004 2006 2006 2005 2007 (¶) 2007 2001 2007
A.
• 0.0 76.0 0.0 38.0 0.0 0.0 0.0 0.0
• 0.0 89.9 0.0 31.0 0.0 0.0 0.0 0.0
• 0.0 77.2 0.0 0.0 0.0 0.0 0.0 0.0 0.0
1.
• 12.6 17.1 13.0 11.0 8.2 10.0 14.5 14.6 13.1
• 4.4 13.8 12.7 7.0 7.9 8.0 8.0 8.6 8.8
• 21.1 23.9 14.9 12.0 14.1 13.0 37.1 27.3 31.1
2.
• 23.5 12.0 12.4 17.0 29.4 12.0 5.5 18.9 11.2
• 20.4 14.1 9.1 13.0 32.1 9.0 2.6 20.8 6.1
• 26.9 11.4 34.1 18.0 15.2 17.0 15.4 18.3 32.8
3.
• 15.7 14.5 29.1 21.0 15.8 0.0 25.0 29.8 6.0
• 6.4 18.4 31.1 28.0 16.0 0.0 23.3 35.7 6.3
• 26.0 19.1 16.9 17.0 20.9 0.0 31.2 20.0 5.1
4.
• 5.0 22.5 1.2 2.0 3.2 32.0 26.7 5.5 7.4
• 3.6 32.2 1.1 2.0 3.7 29.0 32.7 5.8 9.2
• 6.5 3.5 1.8 1.0 0.0 35.0 6.0 6.2 0.1
5.
• 3.8 9.9 0.1 1.0 7.3 0.0 1.2 2.9 4.8
• 5.3 11.4 0.1 1.0 8.1 0.0 1.5 2.1 4.4
• 2.2 19.3 0.2 0.0 3.0 0.0 0.3 7.6 6.5
6.
• 11.3 0.7 3.0 8.0 0.0 7.1 17.9
• 21.4 0.4 3.0 9.1 0.0 8.2 16.8
• 0.5 2.4 2.0 1.5 0.0 3.3 22.8
7.
• 0.3 2.1 6.0 0.0 46.0 4.4 6.7 39.6
• 0.3 1.0 6.0 0.0 54.0 5.2 4.3 48.5
• 0.4 8.9 6.0 0.0 35.0 1.8 15.2 1.8
B.
• 9.8 4.6 17.8 11.0 28.1 22.6 5.4
• 16.8 3.7 20.4 13.0 23.1 26.7 6.1
• 2.6 3.1 1.6 11.0 45.3 8.3 1.4
C.
• 18.0 19.4 23.6 30.0 9.0
• 21.4 6.4 24.1 27.0 8.4
• 13.8 19.7 19.2 31.0 0.8
(¶) (¶) (¶) (¶) (¶) (¶)
For each form of tourism, total should amount to 100.0
Tourism characteristic services
Other services
Goods
Travel agencies, tour operators and tourist guideservices
Internal
Recreation and other entertainment services
Internal
Domestic
Inbound
Tab
le 3
. In
tern
al t
ou
rism
co
ns
um
pti
on
, by
pro
du
cts
an
d f
orm
s o
f to
uri
sm (
%)
Accommodation services
Food and beverage serving services
Internal
Domestic
Passenger transport services
Inbound
Domestic
Domestic
Inbound
Internal
Domestic
Inbound
Internal
Domestic
Inbound
Cultural services
Comments
Total (A+B+C)
Inbound
Internal
Domestic
Inbound
Miscellaneous tourism services
Inbound
Internal
Domestic
Domestic
Inbound
Internal
Domestic
Internal
Internal
Inbound
(¶)
(¶)
(¶) (¶) (¶)
(¶)
(¶)
(¶)
(¶)

46
PO
L
RO
U
KS
A
SV
K
SV
N
ES
P
SW
E
CH
E
US
A
2002 2001 2005 2005 2003 2004 2007 2005 2006
A.
• 0.0 83.0 0.0 0.0 0.0 0.0 0.0 60.2 0.0
• 0.0 81.4 0.0 0.0 0.0 0.0 0.0 56.9 0.0
• 0.0 85.0 0.0 0.0 0.0 0.0 0.0 65.2 0.0
1.
• 28.0 45.3 30.1 18.5 16.3 28.1 4.0 14.6 16.0
• 19.0 45.1 17.4 20.3 13.2 31.6 21.1 10.6 23.0
• 37.0 45.5 50.4 17.1 18.9 25.1 25.1 20.9 15.0
2.
• 24.0 17.0 11.6 17.4 13.8 24.6 24.3 14.8 16.0
• 18.0 17.8 14.7 14.1 17.4 28.7 10.8 13.3 17.0
• 30.0 16.0 6.6 20.0 10.9 27.6 35.1 17.1 15.0
3.
• 31.0 10.9 20.1 23.0 10.9 21.1 15.7 18.8 35.0
• 44.0 6.9 20.5 32.5 12.8 14.0 23.9 17.2 30.0
• 17.0 15.7 19.4 15.4 9.4 20.3 39.6 21.3 36.0
4.
• 5.0 8.0 2.6 1.0 5.1 0.0 6.7 5.0
• 8.0 10.6 5.5 2.9 4.5 6.1 10.8 2.0
• 2.0 5.0 0.3 0.6 0.9 6.1 0.5 6.0
5.
• 12.0 0.8 9.3 1.9 0.6 6.3 0.9 2.0
• 11.0 0.2 13.3 2.7 0.0 4.7 0.8 1.0
• 14.0 1.5 6.1 1.1 0.1 11.0 1.2 2.0
6.
• 6.4 13.7 2.2 2.8 9.0
• 9.7 6.8 2.9 2.4 8.0
• 1.2 19.3 2.4 3.3 10.0
7.
• 0.0 1.0 0.8 0.2 0.0 1.6 0.0
• 0.0 0.8 0.6 0.0 3.0 1.9 0.0
• 0.0 1.3 1.0 0.0 3.0 1.0 0.0
B.
• 0.0 17.0 4.8 0.0 22.6 8.7 20.0 14.4 0.0
• 0.0 18.6 4.9 0.0 23.1 8.9 13.1 14.4 0.0
• 0.0 15.0 4.8 0.0 22.3 11.0 33.1 14.4 0.0
C.
• 0.0 27.0 29.2 18.3 9.4 30.0 25.4 17.0
• 0.0 32.8 14.2 20.5 9.3 16.9 28.7 19.0
• 0.0 17.6 41.1 16.5 12.7 46.9 20.3 17.0
(¶) (¶) (¶) (¶) (¶) (¶) (¶) (¶)
For each form of tourism, total should amount to 100.0
Tourism characteristic services
Other services
Goods
Travel agencies, tour operators and tourist guideservices
Internal
Recreation and other entertainment services
Internal
Domestic
Inbound
Tab
le 3
. In
tern
al t
ou
rism
co
ns
um
pti
on
, by
pro
du
cts
an
d f
orm
s o
f to
uri
sm (
%)
Accommodation services
Food and beverage serving services
Internal
Domestic
Passenger transport services
Inbound
Domestic
Domestic
Inbound
Internal
Domestic
Inbound
Internal
Domestic
Inbound
Cultural services
Comments
Total (A+B+C)
Inbound
Internal
Domestic
Inbound
Miscellaneous tourism services
Inbound
Internal
Domestic
Domestic
Inbound
Internal
Domestic
Internal
Internal
Inbound
(¶) (¶)
(¶)
(¶) (¶)
(¶)
(¶)
(¶)(¶)
(█) No answer / (¶) Comments

47
Comments
AUS
5. Cultural services: The Australian Tourism Satellite Account (ATSA) does not separately disaggregate Cultural Services in its product classification. As such, this product is included in Recreation and other entertainment services in the table above.
7. Miscellaneous tourism services: Includes actual and imputed rent on dwellings (I.e. holiday homes) Other services: The residual category 'Other tourism goods and services' in the ATSA does not separately identify goods and
services. Comments: Imputed consumption is not separately identified in the Australian Tourism Satellite Account (ATSA). As such, tourism
consumption provided in this table includes the amount paid for the acquisition of consumption goods and services plus imputed consumption.
All tourism consumption in Australia is allocated to a specific product or is allocated to the residual “Other tourism goods and services” product grouping. Therefore, products identified as goods are allocated to the 'Goods' grouping above, while the residual category 'Other services' does not separately identify goods and services.
AUT 6. Recreation and other entertainment services and 7. Miscellaneous tourism services: Included in 5.Cultural services. Comments: Due to a lack of detailed data related to “Cultural services”, “Recreation and other entertainment services” and
“Miscellaneous tourism services” only a total is available.
CAN
3. Passenger transport services: Includes vehicle fuel. 4. Travel agencies, tour operators and tourist guide services: Corresponds to the commissions of the travel agencies and tour
operators. 5. Cultural services: Included with Recreation and other entertainment services. 7. Miscellaneous tourism services: In Domestic tourism consumption, it includes tourism single purpose durable goods,.
CHL Internal: Includes accommodation provided by second homes on own account amounting to 106 million, which explains the fact
that accommodation services is not the sum of this internal and inbound tourism product. CUB Comments: This information is not disaggregated based on the lack of primary data. CYP Goods: is included in Other services.
CZE
Comments: Accommodation services include second home services on own account or for free. Travel agency, tour operator and tourist guide services correspond to the margins of the travel agencies and tour operators. In
case of inbound tourism, expenditures corresponding to the Czech Republic are not separated within the category "package tour".
Other services = Services other than tourism characteristic services (i.e. tourism connected services). Goods = Goods other than non-specific products (i.e. tourism connected goods).
FRA
Comments: In the French TSA, the Inbound Tourism consumption and Domestic Tourism Consumption estimates are less accurate than the Internal Tourism Consumption estimate. As explained earlier (see Q2 Comments above), most product components of Internal Tourism Consumption are estimated first on the basis of NA Supply and Use Tables and visitors consumption ratios. Then, the internal tourism consumption of each product is divided between its domestic and inbound components on the basis of various sources. For instance, the share of non-residents in the hotel accommodation consumption is based on the Hotel Accommodation Survey which collects each month the number of overnights by category of hotels and by country of residence of guests. Similar information is collected by another survey on campsites. For owner-occupied vacation homes, the share of non-resident tourists are estimated on the basis of the numbers of non-residents owners recorded in the national register of all dwellings owners. For the other types of short term accommodation, the shares of non-resident occupiers are often estimated using professional sources.
HND
Comments: The figures presented here are still in the process of revision, and therefore cannot be considered official or final. 3. Passenger transport services: The following products were included: Passenger Transport Service by Rail, Passenger
Transport Service by Road and vehicle rentals with driver, passenger transport service on water and rental of boats, transport service by air and aircraft rentals, services related to transport of passengers.
7. Miscellaneous tourism services: The following products were included: Rental services of passenger transport equipment without driver, accommodation services provided by second homes on own account.
IND
Comments: In the Indian TSA, separate categories of cultural services, recreational & other entertainment services, and miscellaneous
tourism services are not available. However, a separate category of ‘other recreational and entertainment services’ is available. Therefore, in all the tables requiring the break-up in three categories in the questionnaire, only one category, namely that of ‘other recreational and entertainment services’, has been given.
In the Indian TSA, the goods have been categorized as below:- i) Clothing & garments ii) Processed food iii) Tobacco products iv) Alcohol v) Travel related consumer goods vi) Footwear vii) Toiletries viii) Gems & jewellery ix) Medicines and health related items, and x) Printing and publishing
A combined figure for all these categories taken together has been provided against the category ‘goods’ in the questionnaire.

48
IDN
Comments: (Billion IDR)
No. Products Inbound tourism
consumption
Domestic tourism
consumption
Internal tourism
consumption 1. Hotel and other
accommodation 19,231.40 6,741.96 25,973.36
2. Restaurant and its similar 10,584.50 19,595.93 30,180.43 3. Domestic transport 3,840.30 42,724.23 46,564.53 4. Travel bureau, tour operator
and guide services 694.00 2,623.88 3,317.88
5. Art, culture, recreation and entertainment
3,275.60 2,010.03 5,285.63
6. Other tourism services 2,021.60 514.42 2,536.02 7. Souvenir 4,570.90 4,048.58 8,619.48 8. Health and beauty 941.20 23.35 964.55 9. Non food products 4,182.80 26,236.37 30,419.17 10. Agricultural products 1,011.50 1,011.50 TOTAL 50,353.81 107,527.78 154,872.55
Number of trips 5,505,759 211,468,925 Average length of stay 9.02
IRL 6. Recreation and other entertainment services: Included in 5.Cultural services. Goods: Included in Other services.
ISR 6. Recreation and other entertainment services: Included in 5. Cultural services.
LTU 6. Recreation and other entertainment services: Included in 5.Cultural services. 7. Miscellaneous tourism services: Included in Other services.
MEX
7. Miscellaneous tourism services: Is equal to imputed accommodation services provided by Second homes on own account Other services: Include tourism connected services.
Goods: Include tourism characteristic products and tourism connected products. Comments: Add Timeshares.
NLD Goods: Includes in Other services.
NZL
Year: Ended March 2007. 3. Passenger transport services and 4. Travel agencies, tour operators and tourist guide services: Are provided at an
aggregated level due to the unavailability of detailed information as the year in question is a provisional estimate. 5. Cultural services, 6. Recreation and other entertainment services, 7. Miscellaneous tourism services, Other services
and Goods: grouped under 7. Miscellaneous tourism services due to the unavailability of detailed information as the year in question is a provisional estimate.
OMN 6. Recreation and other entertainment services: Included in 5. Cultural services. Goods: Included in Other services.
PHL Other services and Goods: Not available.
POL
Latest year available: In a few weeks, 2005 will be available too. 5. Cultural services: Data concerning expenses on cultural services include also expenditure on 6. recreational and
entertainment services. Comments: Data on domestic consumption of food and beverage services do not include expenses of business travellers Shares calculated for consumption of tourism characteristic products only, i.e. expenses on shopping has been excluded.
ROU Comments:
7. Miscellaneous tourism services includes 6. Recreation and other entertainment services Goods includes Other services
KSA 4. Travel agencies, tour operators and tourist guide services, 5. Cultural services and 7. Miscellaneous tourism
services are included in Other services.
SVK
6. Recreation and other entertainment services and 7. Miscellaneous tourism services: Included in 5.Cultural services. Goods: Represents all other goods and services Comments: Structure is calculated as related to the sum of all tourism consumption by visitors (characteristic, connected, and non-
connected). In domestic and outbound tourism, data for same-day visitors are missing.
ESP 5. Cultural services: Non-market artistic and news agency services. 6. Recreation and other entertainment services: Market cultural and sporting services. Other services: Includes distribution margins of goods.
SWE 6. Recreation and other entertainment services: Included in 5.Cultural services.
CHE Other services: Tourism connected services. Goods: Including wholesale margin, excluding retail trade margin.
USA
1. Accommodation services: Traveler accommodations. 2. Food and beverage serving services: Food services and drinking places. 3. Passenger transport services: Passenger transport. 4. Travel agencies, tour operators and tourist guide services: Travel arrangement and reservation services. 5. Recreation and other entertainment services: Recreation and entertainment services.

49
T.4. Domestic tourism consumption
AU
S
AU
T
CA
N
CH
L
CH
N
CO
L
CU
B
CY
P
CZ
E
DN
K
2003-04 2005 2002 2003 2002 2000 2007 2006 2006
A.
• 0.0 70.9 83.1 72.6 0.0 0.0 0.0 65.8
• 0.0 73.3 86.5 73.9 0.0 0.0 0.0 0.0
• 0.0 67.9 67.0 61.4 0.0 0.0 0.0 0.0
1.
• 9.1 19.4 12.2 5.4 18.2 9.4 10.0 12.6 25.9
• 11.6 34.6 14.7 6.0 20.2 9.4 14.2 17.6 38.3
• 0.0 0.0 0.0 0.0 1.3 (¶) 0.0 0.0 0.0
2.
• 17.1 29.8 14.4 17.5 19.4 25.6 35.4 21.2 9.0
• 17.1 16.3 13.6 27.9 18.8 25.6 22.0 23.6 8.6
• 17.4 47.0 18.3 14.2 24.4 (¶) 67.4 15.1 9.9
3.
• 13.2 11.6 38.3 33.3 17.1 42.2 37.9 15.5 24.5
• 15.3 18.3 39.7 32.7 17.3 42.2 53.7 0.0 10.2
• 4.4 3.2 31.7 38.5 15.2 (¶) 0.4 0.0 54.4
4.
• 3.4 0.2 7.1 12.8 3.0 6.6 3.5 6.8 5.0
• 4.3 0.3 6.6 14.3 3.2 6.6 5.0 9.1 3.9
• 0.0 0.0 9.2 0.0 1.2 (¶) 0.0 1.1 7.3
5.
• 10.0 0.3 2.2 2.2 0.1 6.1
• 3.8 0.2 2.0 2.2 0.1 0.0
• 17.7 0.7 4.5 (¶) 0.0 0.0
6.
• 5.7 5.6 3.3 5.2 0.0 0.1 2.7 5.5
• 5.6 5.2 2.8 5.2 0.0 0.1 0.0 4.6
• 6.1 7.3 8.0 5.2 0.0 0.0 0.0 7.5
7.
• 5.5 5.6 0.0 18.1 0.8 0.0 0.9
• 6.5 6.6 0.0 17.2 0.8 0.0 0.0
• 1.8 0.5 0.0 26.3 (¶) 0.0 0.0
B.
• 4.8 15.0 0.0 5.6 0.0 5.8 11.1 7.2
• 3.9 13.8 0.0 4.9 0.0 5.8 0.0 7.9
• 7.8 16.6 0.0 10.9 0.0 (¶) 0.0 5.5
C.
• 41.3 14.1 16.9 21.8 16.9 7.6 13.1 23.1 22.9
• 35.6 12.9 13.5 21.2 16.3 7.6 5.0 0.0 26.4
• 62.4 15.5 33.0 27.7 21.9 (¶) 32.3 0.0 15.5
(¶) (¶) (¶) (¶) (¶) (¶) (¶)
For each categories of visitors, total should amount to 100.0Total (A+B+C)
Tourism characteristic services
Miscellaneous tourism services
Total visitors
Tourists
Same-day visitors
Total visitors
Tourists
Same-day visitors
Tourists
Same-day visitors
Other services
Comments
Passenger transport services
Same-day visitors
Total visitors
Tourists
Same-day visitors
Total visitors
Tourists
Same-day visitors
Tab
le 4
. Do
mes
tic
tou
rism
co
nsu
mp
tio
n,
by
pro
du
cts
an
d c
ateg
ori
es (
%)
Accommodation services
Food and beverage serving services
Total visitors
Tourists
Travel agencies, tour operators and tourist guideservices
Cultural services
Recreation and other entertainment services
Tourists
Same-day visitors
Tourists
Goods
Tourists
Total visitors
Same-day visitors
Total visitors
Total visitors
(¶)
Total visitors
Tourists
Same-day visitors
Same-day visitors
Total visitors
(¶)
(¶)
(¶)
(¶)

50
EC
U
EG
Y
FIN
FR
A
HN
D
IND
IDN
IRL
ISR
JPN
2003 2006 2005 2005 2002-03 2000 2004 2007
A.
• 0.0 62.4 0.0 71.0 0.0 0.0 0.0 63.0
• 0.0 63.3 0.0 0.0 0.0 0.0 0.0 66.5
• 0.0 59.0 0.0 0.0 0.0 0.0 0.0 51.4
1.
• 9.5 9.0 0.0 13.0 0.0 9.1 0.0 14.7
• 0.0 11.5 0.0 0.0 3.5 32.0 0.0 19.1
• 0.0 0.0 0.0 0.0 0.0 0.0 0.0 0.0
2.
• 7.4 22.1 0.0 19.0 4.7 39.5 0.0 10.2
• 0.0 22.8 0.0 0.0 4.7 29.5 0.0 10.1
• 0.0 19.7 0.0 0.0 0.0 43.4 0.0 10.8
3.
• 55.7 20.8 0.0 26.0 0.0 10.7 0.0 28.0
• 0.0 20.9 0.0 0.0 70.5 8.0 0.0 28.1
• 0.0 20.5 0.0 0.0 0.0 11.8 0.0 27.9
4.
• 16.7 3.2 0.0 2.0 0.0 0.1 0.0 2.8
• 0.0 3.8 0.0 0.0 7.2 0.0 0.0 3.4
• 0.0 1.2 0.0 0.0 0.0 0.1 0.0 0.8
5.
• 0.2 2.1 0.0 0.0 0.0 8.4 0.0 1.0
• 0.0 1.3 0.0 0.0 0.0 6.3 0.0 0.8
• 0.0 5.2 0.0 0.0 0.0 9.2 0.0 1.6
6.
• 0.9 3.1 0.0 3.0 0.0 0.0 2.0
• 0.0 1.2 0.0 0.0 0.2 0.0 1.3
• 0.0 9.8 0.0 0.0 0.0 0.0 4.3
7.
• 0.0 2.1 0.0 8.0 0.0 7.2 0.0 4.2
• 0.0 1.9 0.0 0.0 0.0 5.4 0.0 3.8
• 0.0 2.6 0.0 0.0 0.0 7.9 0.0 5.9
B.
• 3.9 0.2 0.0 17.0 0.0 25.1 0.0 18.4
• 0.0 0.1 0.0 0.0 0.0 15.8 0.0 16.8
• 0.0 0.8 0.0 0.0 0.0 27.6 0.0 23.8
C.
• 5.7 37.4 0.0 12.0 0.0 0.0 18.5
• 0.0 36.6 0.0 0.0 13.9 0.0 16.6
• 0.0 40.2 0.0 0.0 0.0 0.0 24.8
(¶) (¶) (¶) (¶) (¶) (¶)
For each categories of visitors, total should amount to 100.0Total (A+B+C)
Tourism characteristic services
Miscellaneous tourism services
Total visitors
Tourists
Same-day visitors
Total visitors
Tourists
Same-day visitors
Tourists
Same-day visitors
Other services
Comments
Passenger transport services
Same-day visitors
Total visitors
Tourists
Same-day visitors
Total visitors
Tourists
Same-day visitors
Tab
le 4
. Do
mes
tic
tou
rism
co
nsu
mp
tio
n,
by
pro
du
cts
an
d c
ateg
ori
es (
%)
Accommodation services
Food and beverage serving services
Total visitors
Tourists
Travel agencies, tour operators and tourist guideservices
Cultural services
Recreation and other entertainment services
Tourists
Same-day visitors
Tourists
Goods
Tourists
Total visitors
Same-day visitors
Total visitors
Total visitors
(¶)
(¶)
Total visitors
Tourists
Same-day visitors
Same-day visitors
Total visitors

51
KA
Z
LV
A
LT
U
ME
X
MA
R
NL
D
NZ
L
OM
N
PE
R
PH
L
2006 2004 2006 2006 2005 2007 (¶) 2007 2001 2007
A.
• 0.0 0.0 89.9 0.0 14.0 0.0 0.0 0.0 0.0
• 0.0 0.0 91.4 0.0 14.0 0.0 0.0 0.0 0.0
• 0.0 0.0 83.0 0.0 (¶) 0.0 0.0 0.0 0.0
1.
• 10.3 4.4 13.7 12.7 14.0 7.9 0.0 8.0 8.6 8.8
• 9.9 11.0 16.8 15.8 14.0 22.2 8.0 0.0 10.2
• 0.4 0.0 0.0 0.0 (¶) 0.0 0.0 0.0 0.0
2.
• 11.7 20.4 14.1 9.1 18.0 32.1 0.0 2.6 20.8 6.1
• 8.4 12.2 11.3 8.9 18.0 13.2 9.0 0.0 15.3
• 3.3 25.9 26.4 11.4 (¶) 41.4 0.0 0.0 49.0
3.
• 59.9 6.1 18.4 31.1 22.0 16.0 0.0 23.3 35.7 6.3
• 38.0 3,6 16.7 27.1 22.0 32.2 29.0 0.0 41.9
• 21.9 7.8 25.8 39.0 (¶) 6.8 0.0 0.0 3.6
4.
• 4.2 3.6 32.3 1.1 0.0 3.7 0.0 32.7 5.8 9.2
• 3.9 3.9 39.4 1.2 0.0 12.4 54.0 0.0 6.9
• 0.3 3.3 1.1 0.0 (¶) 0.2 0.0 0.0 0.0
5.
• 1.9 5.3 11.4 0.1 1.0 8.1 0.0 1.5 2.1 4.4
• 1.2 4.3 7.2 0.1 1.0 0.8 0.0 0.0 2.3
• 0.7 6.0 29.7 0.1 (¶) 11.6 0.0 0.0 0.7
6.
• 3.4 21.4 0.4 7.0 9.1 0.0 (¶) 8.2 16.8
• 3.1 11.0 0.5 7.0 0.1 0.0 0.0 7.5
• 0.3 28.4 0.4 (¶) 13.7 0.0 0.0 12.1
7.
• 1.0 0.3 1.0 2.0 0.0 0.0 5.2 4.3 48.5
• 0.9 0.3 1.3 2.0 0.0 0.0 0.0 3.9
• 0.1 0.5 0.0 (¶) 0.0 0.0 0.0 6.3
B.
• 92.4 16.8 3.7 20.4 15.0 23.1 26.7 6.1
• 65.4 23.2 4.0 22.0 15.0 19.1 0.0 4.7
• 27.0 12.6 2.6 15.9 (¶) 26.3 0.0 13.6
C.
• 7.6 21.7 6.4 24.1 23.0 (¶) 8.4
• 7.0 30.5 4.6 23.1 23.0 0.0 7.2
• 0.6 15.5 14.4 33.2 (¶) 0.0 14.6
(¶) (¶) (¶) (¶) (¶) (¶) (¶)
For each categories of visitors, total should amount to 100.0Total (A+B+C)
Tourism characteristic services
Miscellaneous tourism services
Total visitors
Tourists
Same-day visitors
Total visitors
Tourists
Same-day visitors
Tourists
Same-day visitors
Other services
Comments
Passenger transport services
Same-day visitors
Total visitors
Tourists
Same-day visitors
Total visitors
Tourists
Same-day visitors
Tab
le 4
. Do
mes
tic
tou
rism
co
nsu
mp
tio
n,
by
pro
du
cts
an
d c
ateg
ori
es (
%)
Accommodation services
Food and beverage serving services
Total visitors
Tourists
Travel agencies, tour operators and tourist guideservices
Cultural services
Recreation and other entertainment services
Tourists
Same-day visitors
Tourists
Goods
Tourists (¶)
Total visitors
Same-day visitors
Total visitors
(¶)
(¶)(¶) (¶)
Total visitors
Total visitors
Tourists
Same-day visitors
Same-day visitors
Total visitors
(¶)
(¶)
(¶)
(¶)
(¶)
(¶)
(¶)
(¶)
(¶)

52
PO
L
RO
U
KS
A
SV
K
SV
N
ES
P
SW
E
CH
E
US
A
2002 2005 2005 2003 2004 2007 2005 2006
A.
• 0.0 0.0 0.0 0.0 0.0 0.0 56.9 0.0
• 0.0 0.0 0.0 0.0 0.0 0.0 73.1 0.0
• 0.0 0.0 0.0 0.0 0.0 0.0 27.7 0.0
1.
• 19.0 17.4 20.3 13.2 31.6 21.1 10.6 0.0
• 28.0 17.7 20.3 26.4 0.0 16.8 0.0
• 0.0 1.5 0.0 0.0 0.0 0.0 0.0
2.
• 18.0 14.7 14.1 17.4 28.7 10.8 13.3 0.0
• 25.0 14.6 14.1 9.2 0.0 12.7 0.0
• 6.0 13.9 0.0 22.5 0.0 10.9 0.0
3.
• 44.0 20.5 32.5 12.8 14.0 23.9 17.2 0.0
• 27.0 20.5 32.5 16.2 0.0 0.0 0.0
• 86.0 22.8 0.0 9.3 0.0 0.0 0.0 0.0
4.
• 8.0 5.5 2.9 4.5 6.1 10.8 0.0
• 8.0 5.5 4.8 0.0 0.0 0.0
• 5.0 0.0 1.0 0.0 0.0 0.0
5.
• 11.0 13.3 2.7 0.0 4.7 0.8 0.0
• 9.0 13.3 1.8 0.0 0.0 0.0
• 3.0 0.0 3.7 0.0 0.0 0.0
6.
• 9.7 6.8 2.9 (¶) 2.4 0.0
• 9.8 3.2 0.0 0.0 0.0
• 2.9 0.0 10.2 0.0 0.0 0.0
7.
• 0.0 0.6 0.0 3.0 1.9 0.0
• 0.0 1.1 0.0 13.6 0.0
• 0.0 0.0 0.0 0.0 17.5 0.0
B.
• 0.0 4.9 23.1 8.9 13.1 14.4 0.0
• 0.0 4.7 17.7 0.0 13.6 0.0
• 0.0 11.8 0.0 28.5 0.0 17.5 0.0
C.
• 0.0 32.8 14.2 20.5 9.3 16.9 28.7 0.0
• 0.0 32.6 14.2 19.3 0.0 13.3 0.0
• 0.0 47.0 0.0 21.7 0.0 54.8 0.0
(¶) (¶) (¶) (¶) (¶) (¶) (¶)
(¶)
(¶)
(¶)
For each categories of visitors, total should amount to 100.0Total (A+B+C)
Tourism characteristic services
Miscellaneous tourism services
Total visitors
Tourists
Same-day visitors
Total visitors
Tourists
Same-day visitors
Tourists
Same-day visitors
(¶)
(¶)
(¶)
(¶)
(¶)
Other services
Comments
Passenger transport services
Same-day visitors
Total visitors
Tourists
Same-day visitors
Total visitors
Tourists
Same-day visitors
Tab
le 4
. Do
mes
tic
tou
rism
co
nsu
mp
tio
n,
by
pro
du
cts
an
d c
ateg
ori
es (
%)
Accommodation services
Food and beverage serving services
Total visitors
Tourists
Travel agencies, tour operators and tourist guideservices
Cultural services
Recreation and other entertainment services
Tourists
Same-day visitors
(¶)
(¶)
(¶)
(¶)
(¶)
(¶)
Tourists
Goods
Tourists
Total visitors
Same-day visitors
Total visitors
Total visitors
Total visitors
Tourists
Same-day visitors
Same-day visitors
Total visitors
(¶)
(█) No answer / (¶) Comments

53
Comments
AUS
5. Cultural services: The Australian Tourism Satellite Account (ATSA) does not separately disaggregate Cultural Services in its product classification. As such, this product is included in Recreation and other entertainment services in the table above.
7. Miscellaneous tourism services: Includes actual and imputed rent on dwellings (I.e. holiday homes) Other services: The residual category 'Other tourism goods and services' in the ATSA does not separately identify goods and
services. Comments: Imputed consumption is not separately identified in the Australian Tourism Satellite Account (ATSA). As such, tourism
consumption provided in this table includes the amount paid for the acquisition of consumption goods and services plus imputed consumption.
All tourism consumption in Australia that is not allocated to a specific product is allocated to the residual “Other tourism goods and services” product grouping. Therefore, products identified as goods are allocated to the 'Goods' grouping above, while the residual category 'Other services' does not separately identify goods and services.
AUT
6. Recreation and other entertainment services and 7. Miscellaneous tourism services: Includes in 5.Cultural services. Comments: General: Due to a lack of detailed data related to “Cultural services”, “Recreation and other entertainment services” and “Miscellaneous
tourism services” only a total is available and classified as 5. Cultural services.. Same-day visitors and tourists travelling within Austria: Due to a lack of information it is assumed that resident same-day visitors traveling within Austria do not consume “travel
agency, tour operator and tourist guide services”, although services of travel agencies might be used, in particular in the case of bus trips to national attractions and other sites.
The basic data for calculation of the total amount of expenditure of resident tourists in Austria for tourism characteristic services is taken from the sample survey related to the travel behavior of the Austrians. The basic structure of total expenditure and the expenditure per day is taken from the latest “Tourism Monitor Austria” (T-Mona; guests survey at destinations) results available, which specifies tourism consumption. The expenditure items of T-Mona are re-classified according to TSA requirements, excluding the costs of package tours.
Same-day visitors and tourists travelling abroad: The total outbound tourist consumption of resident same-day visitors is primarily based on a Microcensus survey related to
“Same-day holiday visits of Austrians in 1994”. For the respective reference year the number of outbound same-day visits is extrapolated considering the development of the arrivals assuming that the dynamic of arrivals and same-day visits are similar (trend to short-term trips).
For visitors staying overnight it is assumed that only package tours (assuming to be mainly booked in resident travel agencies) related to outbound trips concern domestic production, while the remaining services do not affect the domestic economy (i.e. products bought abroad). However, the products used for intermediate consumption within the production process and the imported services included within the scope of the package are excluded and the domestic production corresponds to the travel agency's margin (net calculation), only.
CAN
3. Passenger transport services: Includes vehicle fuel 4. Travel agencies, tour operators and tourist guide services: Corresponds to the commissions of the travel agencies and
tour operators 5. Cultural services: Included with Recreation and other entertainment services 7. Miscellaneous tourism services: In Domestic tourism consumption , it includes tourism single purpose durable goods.
COL Same-day visitors: Not available. CUB Comments: This information cannot be disaggregated based on the primary data available. CYP Goods: is included with Other services.
CZE
Comments: Accommodation services include services provided by second home on own account or for free. Travel agency, tour operator and tourist guide services correspond to the margins of the travel agencies and tour operators. Same-day visitors do not include same-day business visitors. Other services = Services other than tourism characteristic services (i.e. tourism connected services). Goods = Goods other than non-specific products (i.e. tourism connected goods). Only limited breakdown of services is available for particular type of visitors.
FRA Comments: Some partial attempts have been made to divide domestic tourism consumption between tourists and same-days
visitors’ consumption but they are not yet completed.
HND
Comments: The figures presented here are still in the process of revision, and therefore cannot be considered official or final. Figures broken down by categories (tourists, same-day visitors) are not yet available. 3. Passenger transport services: The following products were included: Passenger Transport Service by Rail, Passenger
Transport Service by Road and vehicle rentals with driver, passenger transport service on water and rental of boats, transport service by air and aircraft rentals, services related to transport of passengers.
7. Miscellaneous tourism services: The following products were included: Rental services of passenger transport equipment without driver, imputed accommodation services provided by second homes on own account.
IND
Comments: Though the tables presented in the Indian TSA include the information on inbound, domestic and outbound tourism, details of same-day visitors in all three types of tourism have not been included in the tables. However, keeping in view the importance of same day visitors within domestic tourism, a separate write-up indicating their contribution has been incorporated in the TSA report. Due to this constraint, column relating to “same day visitors” has been left blank.
IDN Comments:
(Billion IDR)

54
No. Products
Resident traveling
only within the country of reference
Resident visitors
traveling to a
different country
All resident visitors
1. Hotel and other accommodation 6,671.85 70.11 6,741.96 2. Restaurant and its similar 18,812.02 783.91 19,595.93 3. Domestic transport 41,598.05 1,126.18 42,724.23 4. Travel bureau, tour operator and
guide services 592.33 2,031.55 2,623.88
5. Art, culture, recreation and entertainment
2,010.03 - 2,010.03
6. Other tourism services 514.42 - 514.42 7. Souvenir 4,048.58 - 4,048.58 8. Health and beauty 23.35 - 23.35 9. Non food products 24,727.61 1,508.76 26,236.37 10. Agricultural products 3,009.03 - TOTAL 102,007.26 5,520.52 107,527.78
Number of trips 211,468,925 5,158,441 Average length of stay 9.05
IRL 6. Recreation and other entertainment services: Included in 5.Cultural services. Goods: Included in Other services.
ISR Comments: Except for Total Visitors (already present in Table3) (1) - the number of Inbound Same-day visitors was negligible in
2004 and no data are available
LTU 6. Recreation and other entertainment services: Included in 5.Cultural services. 7. Miscellaneous tourism services: Included in Other services.
MEX
5. Cultural Services and 6. Recreation and other entertainment services: Are added. 7. Miscellaneous tourism services: relates to imputed accommodation services provided by second homes on own account. Other services: include tourism connected services. Goods: Include tourism characteristic products and tourism connected products. Comments: Add Timeshares.
MAR Same-day visitors: Not available. NLD Goods: Included in Other services.
NZL
Year: Ended March 2007. Total visitors and Same-day visitors: This category is not applicable in the case of New Zealand. 3. Passenger transport services and 4. Travel agencies, tour operators and tourist guide services: Are provided at an
aggregated level due to the unavailability of detailed information as the year in question is a provisional estimate. 5. Cultural services, 6. Recreation and other entertainment services, 7. Miscellaneous tourism services, Other services
and Goods: grouped under 7. Miscellaneous tourism services due to the unavailability of detailed information as the year in question is a provisional estimate.
OMN 6. Recreation and other entertainment services: Included in 5. Cultural services. Goods: Included in Other services.
PHL Tourists and Same-day visitors: Breakdown not available. Other services and Goods: Not available.
POL
5. Cultural services: Data concerning expenses on cultural services include also expenditure on recreational and entertainment services.
6. Recreation and other entertainment services: Not available. Comments: Data on domestic consumption of food and beverage services do not include expenses of business travellers Shares calculated in relation to consumption of tourism characteristic products only, i.e. expenses on shopping has been
excluded.
KSA 4. Travel agencies, tour operators and tourist guide services: Included in Other services. 5. Cultural services: Included in Other services. 7. Miscellaneous tourism services: Included in Other services.
SVK
6. Recreation and other entertainment services and 7. Miscellaneous tourism services: are included in 5.Cultural services.. Goods represent all other goods and services Comments: Structure is calculated in reference to the sum of all products consumed by visitors (characteristic, connected, and non-
connected). Data for same-day visitors are missing.
ESP 5. Cultural services: include non-market artistic and news agency services. 6. Recreation and other entertainment services: include market cultural and sporting services.
SWE Tourists and same-day visitors: No breakdown is available.
CHE Other services: Tourism connected services. Goods: Including wholesale margin, excluding retail trade margin.

55
USA
Comments:
2006
Domestic
Traveler accommodations 23%
Food services and drinking places 17%
Passenger transport 30%
Travel arrangement and reservation services 2%
Cultural services 1% Recreation and entertainment services 8%
Goods 19% We do not identify same-day visitors.

56
T.5. Inbound tourism consumption
AU
S
AU
T
CA
N
CH
L
CH
N
CO
L
CU
B
CY
P
CZ
E
DN
K
2003-04 2005 2002 2003 2002 2000 2007 2006 2006
A.
• 0.0 89.5 80.4 75.5 12.8 0.0 0.0 66.7
• 0.0 93.8 81.2 76.2 12.9 0.0 0.0 0.0
• 0.0 56.4 73.7 39.9 0.0 0.0 0.0 0.0
1.
• 12.4 46.8 23.9 23.1 11.2 8.2 30.3 20.3 8.8
• 12.4 52.7 26.5 23.6 11.2 8.2 30.7 24.4 11.6
• (¶) 0.0 0.0 0.0 14.8 (¶) 0.0 0.0 0.0
2.
• 9.0 23.5 16.6 15.3 24.5 12.4 26.2 25.0 14.4
• 9.0 21.5 15.5 15.3 24.5 12.4 26.4 27.3 15.2
• (¶) 38.6 26.2 13.3 20.1 (¶) 8.5 11.8 12.1
3.
• 29.0 12.5 26.6 27.4 4.6 39.3 26.1 17.9 3.6
• 29.0 13.8 26.8 27.7 4.7 39.3 25.5 0.0 3.7
• (¶) 2.6 24.6 13.3 0.7 (¶) 78.4 0.0 3.4
4.
• 1.4 0.0 1.3 2.9 2.1 0.4 0.0 0.0 9.6
• 1.4 0.0 1.3 2.9 2.1 0.4 0.0 0.0 9.4
• 0.0 0.0 1.2 0.0 2.6 (¶) 0.0 0.0 10.1
5.
• 6.8 0.4 6.3 6.7 0.6 2.6
• 5.7 0.4 6.3 6.7 0.6 0.0
• (¶) 15.2 0.0 6.6 (¶) 0.0 0.0
6.
• 3.4 11.8 6.4 18.2 0.0 1.9 0.9 3.4
• 3.4 10.7 6.3 18.1 0.0 1.9 0.0 3.6
• (¶) 21.3 13.3 32.4 0.0 0.1 0.0 2.9
7.
• 14.9 0.3 0.0 0.0 0.0 0.0 0.0
• 14.9 0.3 0.0 0.0 0.0 0.0 0.0
• (¶) 0.4 0.0 0.0 (¶) 0.0 0.0
B.
• 5.0 3.3 0.0 2.7 0.0 4.2 7.2 12.1 21.3
• 5.0 2.0 0.0 2.7 0.0 4.2 0.0 21.5
• (¶) 13.9 0.0 6.7 0.0 (¶) 0.0 20.6
C.
• 25.0 7.1 19.6 21.8 20.3 28.9 14.9 21.2 38.8
• 25.0 4.2 18.8 21.1 20.2 28.9 14.9 0.0 35.1
• (¶) 29.7 26.3 53.4 22.8 (¶) 13.0 0.0 50.9
(¶) (¶) (¶) (¶) (¶) (¶)
For each categories of visitors, total should amount to 100.0
27.1
39.9
13.2
(¶)
Total visitors
Tourists
Same-day visitors
Goods
Comments
Total visitors
Tourists
Same-day visitors
Total (A+B+C)
Tourists
Same-day visitors
Miscellaneous tourism services
Total visitors
Ta
ble
5. I
nb
ou
nd
to
uri
sm
co
ns
um
pti
on
, by
pro
du
cts
and
cat
eg
ori
es (
%)
Accommodation services
Food and beverage serving services
Total visitors
Tourists
Travel agencies, tour operators and tourist guideservices
Cultural services
Tourists
Other services
Total visitors
Tourists
Same-day visitors
Same-day visitors
Total visitors
Passenger transport services
Tourists
Same-day visitors
Total visitors
Same-day visitors
Total visitors
Tourists
Same-day visitors
Tourism characteristic services
Total visitors
Tourists
Same-day visitors
Total visitors
Tourists
Same-day visitors
Recreation and other entertainment services
(¶)
(¶)
(¶)
(¶)
1.3
11.2

57
EC
U
EG
Y
FIN
FR
A
HN
D
IND
IDN
IRL
ISR
JPN
2003 2006 2005 2005 2002-03 2000 2004
A.
• 0.0 72.7 0.0 72.0 0.0 0.0 0.0
• 0.0 74.4 0.0 0.0 0.0 0.0 0.0
• 0.0 54.0 0.0 0.0 0.0 0.0 0.0
1.
• 23.5 14.3 0.0 21.0 0.0 18.5 0.0
• 0.0 15.6 0.0 0.0 17.8 19.0 0.0
• 0.0 0.0 0.0 0.0 0.0 0.0 0.0
2.
• 27.5 16.1 0.0 28.0 0.0 25.6 0.0
• 0.0 16.2 0.0 0.0 12.3 25.7 0.0
• 0.0 14.9 0.0 0.0 0.0 21.1 0.0
3.
• 18.1 34.5 0.0 12.0 0.0 29.2 0.0
• 0.0 34.7 0.0 0.0 27.5 28.6 0.0
• 0.0 31.9 0.0 0.0 0.0 47.5 0.0
4.
• 5.6 0.1 0.0 3.0 0.0 0.3 0.0
• 0.0 0.1 0.0 0.0 18.2 0.3 0.0
• 0.0 0.0 0.0 0.0 0.0 0.2 0.0
5.
• 0.0 1.9 0.0 0.0 0.0 5.4 0.0
• 0.0 2.0 0.0 0.0 0.0 5.4 0.0
• 0.0 1.7 0.0 0.0 0.0 4.4 0.0
6.
• 7.2 4.1 0.0 5.0 0.0 0.0
• 0.0 4.1 0.0 0.0 9.3 0.0
• 0.0 3.8 0.0 0.0 0.0 0.0
7.
• 0.0 1.8 0.0 3.0 0.0 4.7 0.0
• 0.0 1.8 0.0 0.0 0.0 4.7 0.0
• 0.0 1.7 0.0 0.0 0.0 13.4 0.0
B.
• 0.0 0.5 0.0 11.0 0.0 16.3 0.0
• 0.0 0.5 0.0 0.0 0.0 16.3 0.0
• 0.0 0.4 0.0 0.0 0.0 13.4 0.0
C.
• 18.1 26.8 0.0 17.0 0.0 0.0 0.0
• 0.0 25.1 0.0 0.0 14.9 0.0 0.0
• 0.0 45.5 0.0 0.0 0.0 0.0 0.0
(¶) (¶) (¶) (¶) (¶)
For each categories of visitors, total should amount to 100.0
Total visitors
Tourists
Same-day visitors
Goods
Comments
Total visitors
Tourists
Same-day visitors
Total (A+B+C)
Tourists
Same-day visitors
Miscellaneous tourism services
Total visitors
Ta
ble
5. I
nb
ou
nd
to
uri
sm
co
ns
um
pti
on
, by
pro
du
cts
and
cat
eg
ori
es (
%)
Accommodation services
Food and beverage serving services
Total visitors
Tourists
Travel agencies, tour operators and tourist guideservices
Cultural services
Tourists
Other services
Total visitors
Tourists
Same-day visitors
(¶)
Same-day visitors
Total visitors
Passenger transport services
Tourists
Same-day visitors
Total visitors
Same-day visitors
Total visitors
Tourists
Same-day visitors
Tourism characteristic services
Total visitors
Tourists
Same-day visitors
Total visitors
Tourists
Same-day visitors
Recreation and other entertainment services

58
KA
Z
LV
A
LT
U
ME
X
MA
R
NL
D
NZ
L
OM
N
PE
R
PH
L
2006 2004 2006 2006 2005 2007 (¶) 2007 2001 2007
A.
• 0.0 0.0 58.2 0.0 14.1 0.0 0.0 0.0
• 0.0 0.0 70.0 0.0 15.7 0.0 0.0 0.0
• 0.0 0.0 14.9 0.0 0.0 0.0 0.0 0.0
1.
• 23.7 21.1 21.5 14.9 19.0 15.2 0.0 37.1 27.3 31.1
• 23.7 22.8 27.4 17.9 19.0 14.4 0.0 0.0 27.7
• 0.0 0.0 0.0 0.0 0.0 22.5 0.0 0.0 0.0
2.
• 11.1 26.9 9.3 34.1 22.0 20.9 0.0 15.4 18.3 32.8
• 11.9 25.5 9.6 35.1 22.0 22.5 0.0 0.0 18.1
• 0.1 43.5 8.2 29.3 10.0 7.6 0.0 0.0 33.2
3.
• 16.4 26.0 9.5 16.9 11.0 0.0 0.0 31.2 20.0 5.1
• 16.3 27.1 11.7 13.4 11.0 0.0 0.0 0.0 20.2
• 0.1 12.1 1.3 34.0 6.0 0.0 0.0 0.0
4.
• 2.2 6.5 9.8 1.8 1.0 3.0 0.0 6.0 6.2 0.1
• 2.2 6.1 12.3 1.8 1.0 3.1 0.0 0.0 6.3
• 0.0 11.2 0.7 2.0 1.0 1.9 0.0 0.0 0.0
5.
• 3.8 2.2 8.1 0.2 1.0 1.5 0.0 0.3 7.6 6.5
• 3.8 2.3 9.0 0.2 1.0 1.4 0.0 0.0 7.4
• 0.0 0.0 4.7 0.1 40.0 1.6 0.0 0.0 20.6
6.
• 9.3 0.5 2.4 7.0 0.0 0.0 (¶) 3.3 22.8
• 9.2 0.6 2.8 7.0 0.0 0.0 0.0 3.2
• 0.1 0.0 0.6 6.0 0.0 0.0 0.0 7.9
7.
• 3.2 0.3 8.9 2.0 0.0 0.0 1.8 15.2 1.8
• 3.2 0.4 10.7 2.0 0.0 0.0 0.0 15.0
• 0.0 0.0 0.0 0.0 0.0 0.0 0.0 26.2
B.
• 69.7 2.6 5.6 1.6 16.0 45.3 8.3 1.4
• 69.4 2.4 7.2 1.5 16.0 42.9 0.0 1.3
• 0.3 2.6 0.0 2.3 31.0 66.5 0.0 5.9
C.
• 30.3 13.9 36.2 19.2 20.0 0.0 0.0 0.8
• 30.1 12.8 22.8 16.6 20.0 0.0 0.0 0.8
• 0.2 30.6 85.1 31.7 6.0 0.0 0.0 0.0
(¶) (¶) (¶) (¶) (¶) (¶)
For each categories of visitors, total should amount to 100.0
(¶)
(¶)
(¶)
(¶)
(¶)
(¶) (¶)
(¶)
(¶)
Total visitors
Tourists
Same-day visitors
Goods
Comments
Total visitors
Tourists
Same-day visitors
Total (A+B+C)
Tourists
Same-day visitors
Miscellaneous tourism services
Total visitors
(¶)
Ta
ble
5. I
nb
ou
nd
to
uri
sm
co
ns
um
pti
on
, by
pro
du
cts
and
cat
eg
ori
es (
%)
Accommodation services
Food and beverage serving services
Total visitors
Tourists
Travel agencies, tour operators and tourist guideservices
Cultural services
Tourists
Other services
Total visitors
Tourists
Same-day visitors
Same-day visitors
Total visitors
Passenger transport services
Tourists
Same-day visitors
Total visitors
Same-day visitors
Total visitors
Tourists
Same-day visitors
Tourism characteristic services
Total visitors
Tourists
Same-day visitors
Total visitors
Tourists
Same-day visitors
Recreation and other entertainment services
(¶)
(¶)
(¶)

59
PO
L
RO
U
KS
A
SV
K
SV
N
ES
P
SW
E
CH
E
US
A
2002 2001 2005 2005 2003 2004 2005 2006
A.
• 0.0 0.0 0.0 0.0 0.0 0.0 65.2 0.0
• 0.0 0.0 0.0 0.0 0.0 0.0 73.9 0.0
• 0.0 0.0 0.0 0.0 0.0 0.0 37.5 0.0
1.
• 27.0 0.0 50.4 17.1 0.0 25.1 20.9 0.0
• 42.0 0.0 50.7 21.2 0.0 0.0 27.4 0.0
• 0.0 0.0 0.0 0.0 0.0 0.0 0.0 0.0
2.
• 30.0 0.0 6.6 20.0 18,9 27.6 17.1 0.0
• 24.0 0.0 6.6 19.9 33.3 0.0 16.1 0.0
• 65.0 0.0 4.1 20.6 0.0 0.0 20.2 0.0
3.
• 17.0 0.0 19.4 15.4 10.9 20.3 21.3 0.0
• 18.0 0.0 19.4 17.5 12.0 0.0 0.0 0.0
• 15.0 0.0 12.2 6.7 9.4 0.0 0.0 0.0
4.
• 2.0 0.0 0.3 0.6 0.9 0.5 0.0
• 3.0 0.0 0.3 1.1 0.0 0.0 0.0
• 0.0 0.0 0.2 0.0 0.0 0.0 0.0
5.
• 14.0 0.0 6.1 1.1 0.1 1.2 0.0
• 13.0 0.0 6.5 1.5 0.0 0.0 0.0
• 20.0 0.0 4.7 0.7 0.0 0.0 0.0
6.
• 0.0 1.2 19.3 2.4 3.3 0.0
• 0.0 1.2 9.0 0.0 0.0 0.0
• 0.0 0.0 0.0 32.7 0.0 0.0 0.0
7.
• 0.0 0.0 1.0 0.0 1.0 0.0
• 0.0 0.0 1.5 0.0 0.0 0.0
• 0.0 0.0 0.0 0.4 0.0 0.0 0.0
B.
• 0.0 0.0 4.8 0.0 23.3 11.0 14.4 0.0
• 0.0 0.0 4.8 0.0 8.1 0.0 15.3 0.0
• 0.0 0.0 0.8 0.0 41.0 0.0 11.7 0.0
C.
• 0.0 0.0 17.6 41.1 16.5 12.7 20.3 0.0
• 0.0 0.0 17.3 34.7 24.2 0.0 10.9 0.0
• 0.0 0.0 82.9 67.8 6.2 0.0 50.8 0.0
(¶) (¶) (¶) (¶) (¶) (¶) (¶)
(¶)
(¶)
For each categories of visitors, total should amount to 100.0
(¶)
(¶)
(¶)
Total visitors
Tourists
Same-day visitors
Goods
Comments
Total visitors
Tourists
Same-day visitors
Total (A+B+C)
Tourists
Same-day visitors
Miscellaneous tourism services
Total visitors
Ta
ble
5. I
nb
ou
nd
to
uri
sm
co
ns
um
pti
on
, b
y p
rod
uc
ts a
nd
cat
eg
ori
es (
%)
Accommodation services
Food and beverage serving services
Total visitors
Tourists
Travel agencies, tour operators and tourist guideservices
Cultural services
Tourists
Other services
Total visitors
Tourists
Same-day visitors
Same-day visitors
Total visitors
Passenger transport services
Tourists
Same-day visitors
Total visitors
Same-day visitors
Total visitors
Tourists
Same-day visitors
Tourism characteristic services
Total visitors
Tourists
Same-day visitors
Total visitors
Tourists
Same-day visitors
Recreation and other entertainment services
(¶)
(█) No answer / (¶) Comments

60
Comments
AUS
Same-day visitors could theoretically occur but are expected to be negligible and are not measured as part of ATSA. 5. Cultural services: The Australian Tourism Satellite Account (ATSA) does not separately disaggregate Cultural Services in its
product classification. As such, this product is included in Recreation and other entertainment services in the table above. 7. Miscellaneous tourism services: Includes actual and imputed rent on dwellings (I.e. holiday homes) Other services: The residual category 'Other tourism goods and services' in the ATSA does not separately identify goods and
services. Comments: Imputed consumption is not separately identified in the Australian Tourism Satellite Account (ATSA). As such, tourism
consumption provided in this table includes the amount paid for the acquisition of consumption goods and services plus imputed consumption.
All tourism consumption in Australia if not allocated to a specific product, is allocated to the residual “Other tourism goods and services” product grouping. Therefore, products identified as goods are allocated to the 'Goods' grouping above, while the residual category 'Other services' does not separately identify goods and services.
AUT
6. Recreation and other entertainment services and 7. Miscellaneous tourism services: Includes in 5.Cultural services. Comments: Due to a lack of detailed data related to “Cultural services”, “Recreation and other entertainment services” and “Miscellaneous
tourism services” only a total is available. Regarding the breakdown of visitor consumption of inbound tourism, into same-day visitors and tourists, within the Austrian
TSA the following has to be considered: • As a working hypothesis it is be assumed that non-resident visitors, in particular same-day visitors, do not book package
tours within the area visited. • Nevertheless, parts of a package – booked abroad – are relevant for domestic production, if the package is including
domestic products (i.e. a package by a foreign tour operator includes the ski lift tickets or hotel services); however, the margin of the tour operator is produced by a non resident and thus excluded.
Estimates related the share of business expenses are done based on mirror statistics of the important partner countries (i.e. based on the number of business trips and the respective expenditure to Austria).
Total inbound expenditure corresponds mainly to the total tourism receipts (credits) according to the “Travel Balance of Payments” (TBoP). Nevertheless, due to methodological differences related to tourism statistics concepts (UNWTO) and BoP requirements (IMF) the credit figure is adjusted to take into consideration border workers and students or patients staying longer than one year.
CAN
3. Passenger transport services: Includes vehicle fuel. 4. Travel agencies, tour operators and tourist guide services: Corresponds to the commissions of the travel agencies and
tour operators. 5. Cultural services: Included with Recreation and other entertainment services.
COL Same-day visitors: Not available. CYP Goods: includes Other services.
CZE
Comments: Travel agency, tour operator and tourist guide services – Corresponds to the margins of the travel agencies and tour
operators. In the case of inbound tourism in 2006, it was not possible to separate expenditure corresponding to the Czech Republic within the category "package tour"
Other services = Services other than tourism characteristic services (i.e. tourism connected services). Goods = Goods other than non-specific products (i.e. tourism connected goods). Only limited breakdown of services is available for particular type of visitors.
FRA Comments: See our comments on the previous table.
HND
Comments: The figures presented here are still in the process of revision, and therefore cannot be considered official or final. Figures broken down by categories (tourists, same-day visitors) are not yet available. Passenger transport services: The following products were included: Passenger Transport Service by Rail, Passenger
Transport Service by Road and vehicle rentals with driver, passenger transport service on water and rental of boats, transport service by air and aircraft rentals, services related to transport of passengers.
Miscellaneous tourism services: The following products were included: Rental services of passenger transport equipment without driver, imputed accommodation services provided by second homes on own account.
IND Comments: Though in the case of domestic tourism, partial information was collected regarding same day visitors, as stated in
the comment on Table-4, no such information was collected in case of inbound tourists because the number of such visitors was expected to be insignificant. Consequently, the column relating to “same day visitors” has been left blank.

61
IDN
Comments: (Billion IDR)
No. Products Visitors
1. Hotel and other accommodation 19,231.402. Restaurant and its similar 10,584.503. Domestic transport 3,840.304. Travel bureau, tour operator and guide services 694.005. Art, culture, recreation and entertainment 3,275.606. Other tourism services 2,021.607. Souvenir 4,570.908. Health and beauty 941.209. Non food products 4,182.8010. Agricultural products 1,011.50
TOTAL 50,353.81
Number of trips 5,505,759 Average length of stay 9.02
IRL 6. Recreation and other entertainment services: Includes in 5.Cultural services. Goods: Includes in Other services.
ISR Comments: The number of Inbound Same-day visitors was negligible in 2004 and no data are available. KAZ Other services: Total services.
LTU 6. Recreation and other entertainment services: Included in 5.Cultural services. 7. Miscellaneous tourism services: Included in Other services.
MEX
7. Miscellaneous tourism services: Is equal to imputed accommodation services provided by second homes on own account. Other services: Include tourism connected services. Goods: Include tourism characteristic products and tourism connected products. Comments: Add Timeshares.
NZL
Year: Ended March 2007. Total visitors and Same-day visitors: This category is not applicable in the case of New Zealand. 3. Passenger transport services and 4. Travel agencies, tour operators and tourist guide services: Are provided at an
aggregated level due to the unavailability of detailed information as the year in question is a provisional estimate. 5. Cultural services, 6. Recreation and other entertainment services, 7. Miscellaneous tourism services, Other services
and Goods: grouped under 7. Miscellaneous tourism services due to the unavailability of detailed information as the year in question is a provisional estimate.
OMN 6. Recreation and other entertainment services: Included in 5. Cultural services. Goods: Included in Other services.
PHL Tourists and Same-day visitors: Disaggregation not available. Other services and Goods: Not available.
POL
6. Recreation and other entertainmdent services: Not available. Comments: Data concerning expenses on cultural services include also expenditure on recreational and entertainment services. Shares calculated in relation to consumption of tourism characteristic products only, i.e. expenses on shopping has been
excluded.
ROU
6. Recreation and other entertainment services: Included in 5. Cultural services as aggregate category “Cultural and recreation services”.
Comments: The data refer only to tourism characteristic services and were taken from TSA table 1. Be aware that the data in column “Total visitors” are not the same as the ones from TSA table 4 (table 3 in the UNWTO
questionnaire). This is due to some inconsistencies that appear in our experimental TSA.
KSA 4. Travel agencies, tour operators and tourist guide services: 5. Cultural services; and 7. Miscellaneous tourism
services: are included in Other services.
SVK
6. Recreation and other entertainment services and 7. Miscellaneous tourism services: are Included in 5.Cultural services. Goods: Represents all other goods and services Comments: Structure is calculated in relation to the sum of all products consumed by visitors (characteristic, connected, and non-
connected).
ESP 5. Cultural services: includes non-market artistic and news agency services. 6. Recreation and other entertainment services :includes market cultural and sporting services.
CHE Other services: Tourism connected services. Goods: Including wholesale margin, excluding retail trade margin.

62
USA
Comments:
2006
Inbound
Traveler accommodations 15%
Food services and drinking places 15%
Passenger transport 36%
Travel arrangement and reservation services 6%
Cultural services 2%
Recreation and entertainment services 10%
Goods 17% We do not identify same day visitors.

63
T.6. Tourism gross value added, by industry
AU
S
AU
T
CA
N
CH
L
CH
N
CO
L
CU
B
CY
P
CZ
E
DN
K
2005 2002 2003 2002 2000 2007 2006 2006
A.
• 0.0 8.4 5.1 87.5 0.0 0.0 0.0 4.5
• 0.0 83.2 76.8 0.0 0.0 0.0 0.0 72.1
1.
• 0.6 4.2 0.8 12.3 1.0 0.4 2.3 0.7 0.4
• 12.9 62.4 24.5 (¶) 20.9 0.3 22.9 17.0 7.7
2.
• 8.7 0.4 0.0 6.1 0.1 6.9 0.1 0.4
• 6.0 4.6 0.0 (¶) 0.1 0.3 3.9 0.5
3.
• 2.2 0.0 1.6 11.8 1.8 1.4 4.9 1.3 1.1
• 13.1 0.0 12.4 (¶) 20.0 0.3 35.6 22.6 20.3
4.
• 3.5 2.4 1.7 36.6 0.0 0.0 5.4 1.1
• 20.1 7.0 23.7 (¶) 0.0 0.0 14.1 15.1
4.1
• 0.7 0.1 0.2 0.1 0.0 0.0 0.3 0.4
• 1.6 0.4 (¶) 2.0 0.0 0.0 4.4 8.4
4.2
• 1.7 0.7 20.1 0.5 2.1 0.6 0.5 0.8
• 3.9 2.8 (¶) 8.7 0.2 0.0 6.0 16.1
4.3
• 0.0 0.2 0.0 0.1 1.5 0.0 2.0
• 0.0 (¶) 0.0 0.0 0.0 0.0 2.7
4.4
• 0.8 0.3 16.0 0.2 0.4 1.8 0.2 0.3
• 12.7 3.0 (¶) 3.6 0.4 0.0 4.1 6.2
4.5
• 0.0 1.3 0.1 0.0 2.2 1.1 0.1
• 0.0 0.8 (¶) 0.0 0.0 0.0 0.4
4.6
• 0.4 0.0 0.0 0.4 0.1 0.4
• 1.9 0.0 0.0 0.0 0.3 1.8
5.
• 0.2 0.1 0.2 14.3 0.2 0.0 1.0 0.2 1.5
• 4.3 2.4 7.4 (¶) 4.8 0.0 10.5 6.8 10.4
6.
• 0.5 1.3 0.4 0.2 1.0 0.4 0.5
• 1.5 6.9 0.0 3.0 0.1 0.5 5.4
7.
• 1.2 0.8 6.0 0.3 1.6 0.6 2.1
• 2.2 8.8 (¶) 5.4 2.6 1.3 11.3
B.
• 83.2 91.6 94.9 12.5 95.7 92.3 77.6 95.5 10.4
• 39.9 16.8 23.2 (¶) 31.6 98.5 13.5 27.9 10.4
(¶) (¶) (¶) (¶) (¶) (¶) (¶) (¶) (¶)
For each aggregate, total should amount to 100.0
GVA b.p.
TGVA b.p.
GVA b.p.
Water passenger transport
Restaurants and similar
GVA b.p.
TGVA b.p.
GVA b.p.
TGVA b.p.
Tourism characteristic services
Tab
le 6
. Gro
ss
valu
e a
dd
ed
(G
VA
b.p
.) an
d t
ou
rism
gro
ss v
alu
e a
dd
ed
(T
GV
A b
.p.),
by
ind
ust
ry
Accommodation (Hotels and similar)
Second homes ownership (imputed)
GVA b.p.
TGVA b.p.
Transportation
Travel agencies and similar
Cultural services
TGVA b.p.
Comments
Total (A+B)
GVA b.p.
TGVA b.p.
GVA b.p.
TGVA b.p.
GVA b.p.
Railways passenger transport
Road passenger transport
GVA b.p.
GVA b.p.
TGVA b.p.
Other industries
(¶)
(¶)
Sporting and recreational services
TGVA b.p.
GVA b.p.
(¶)
(¶)
(¶)
TGVA b.p.
Air passenger transport
(¶)TGVA b.p.
GVA b.p.
TGVA b.p.
(¶)
(¶)
GVA b.p.
TGVA b.p.
(¶)
TGVA b.p.
GVA b.p.
TGVA b.p.
GVA b.p.
Passenger transport equipment rental
Passenger transport supporting services

64
EC
U
EG
Y
FIN
FR
A
HN
D
IND
IDN
IRL
ISR
JPN
2003 2006 2005 2005 2002-03 2000 2004
A.
• 0.0 3.8 0.0 0.0 0.0 0.0 0.0 0.0
• 0.0 0.0 0.0 64.6 0.0 0.0 0.0 0.0
1.
• 11.7 0.4 2.5 0.0 2.3 7.1 0.5 0.0
• 0.0 13.9 17.5 10.2 8.0 0.5 27.0 0.0
2.
• 5.4 0.2 0.9 0.0 8.1 0.0 0.0 0.0
• 0.0 6.8 20.3 4.9 5.7 1.0 0.0 0.0
3.
• 9.5 1.1 0.0 0.0 0.0 (¶) 0.8 0.0
• 0.0 12.2 13.9 14.0 0.0 6.0 0.0
4.
• 0.0 1.6 0.0 0.0 0.0 0.0 0.0
• 0.0 47.1 0.0 27.8 0.0 0.0 0.0
4.1
• 0.0 0.1 0.3 0.0 9.7 6.0 0.1 0.0
• 0.0 3.8 4.9 0.0 11.0 0.2 0.0 0.0
4.2
• 36.2 0.7 0.5 0.0 23.2 (¶) 1.2 0.0
• 0.0 12.9 3.3 14.8 35.6 0.0 3.0 0.0
4.3
• 0.4 0.2 0.1 0.0 6.9 1.7 0.4 0.0
• 0.0 7.9 0.2 0.3 0.6 0.5 0.3 0.0
4.4
• 4.1 0.5 0.4 0.0 2.2 (¶) 0.5 0.0
• 0.0 20.4 7.7 2.3 8.0 0.0 19.0 0.0
4.5
• 0.0 0.0 0.9 0.0 0.0 2.6 1.2 0.0
• 0.0 1.0 3.3 0.7 0.0 0.0 6.0 0.0
4.6
• 0.2 0.1 0.8 0.0 0.5 (¶) 0.7 0.0
• 0.0 1.1 0.8 9.7 1.5 0.0 6.0 0.0
5.
• 18.3 0.2 0.1 0.0 3.7 0.0 0.3 0.0
• 0.0 6.5 3.3 1.9 13.7 0.0 15.0 0.0
6.
• 0.2 0.1 1.6 0.0 0.0 2.1 0.4 0.0
• 0.0 1.7 12.3 0.8 0.0 0.3 0.4 0.0
7.
• 4.4 0.2 0.0 0.0 0.5 (¶) 0.0
• 0.0 2.9 4.8 5.0 1.0 0.0 0.0
B.
• 9.6 96.2 91.9 0.0 42.9 87.9 94.0 0.0
• 0.0 9.0 7.6 35.5 14.9 0.0 14.0 0.0
(¶) (¶) (¶) (¶) (¶)
For each aggregate, total should amount to 100.0
GVA b.p.
TGVA b.p.
GVA b.p.
Water passenger transport
Restaurants and similar
GVA b.p.
TGVA b.p.
GVA b.p.
TGVA b.p.
Tourism characteristic services
Tab
le 6
. Gro
ss
valu
e a
dd
ed
(G
VA
b.p
.) an
d t
ou
rism
gro
ss v
alu
e a
dd
ed
(T
GV
A b
.p.),
by
ind
ust
ry
Accommodation (Hotels and similar)
Second homes ownership (imputed)
GVA b.p.
TGVA b.p.
Transportation
Travel agencies and similar
Cultural services
TGVA b.p.
Comments
Total (A+B)
GVA b.p.
TGVA b.p.
GVA b.p.
TGVA b.p.
GVA b.p.
Railways passenger transport
Road passenger transport
GVA b.p.
GVA b.p.
TGVA b.p.
Other industries
Sporting and recreational services
TGVA b.p.
GVA b.p.
(¶)
TGVA b.p.
Air passenger transport
TGVA b.p.
GVA b.p.
TGVA b.p.
GVA b.p.
TGVA b.p.
TGVA b.p.
GVA b.p.
TGVA b.p.
GVA b.p.
Passenger transport equipment rental
Passenger transport supporting services

65
KA
Z
LV
A
LT
U
ME
X
MA
R
NL
D
NZ
L
OM
N
PE
R
PH
L
2006 2004 2006 2006 2005 2007 (¶) 2007 2001 2000
A.
• 0.0 0.0 4.5 0.0 0.0 0.0 0.0 0.0
• 0.0 0.0 57.5 0.0 0.0 0.0 0.0 0.0
1.
• 6.7 0.4 0.4 1.0 11.0 0.6 0.0 0.0 17.0 0.8
• 16.0 10.1 12.6 45.0 14.8 10.0 14.3 15.3 14.8
2.
• 0.0 0.0 0.1 0.2 0.0 0.0 0.0 4.1
• 0.0 0.0 2.3 0.0 0.0 9.9 3.7
3.
• 9.9 0.6 1.0 0.9 1.0 0.0 0.0 21.7 1.1
• 13.9 17.9 10.7 26.2 0.0 3.5 19.6 5.3
4.
• 38.3 0.0 1.4 2.1 1.6 0.0 0.0 2.5
• 41.6 0.0 8.0 25.8 22.8 3.0 0.0 3.5
4.1
• 4.6 0.0 0.1 0.0 0.0 0.0 0.0 0.0 0.8 0.0
• 9.9 0.1 0.0 2.0 0.0 0.0 0.0 0.8 0.0
4.2
• 14.7 0.8 0.7 1.3 1.0 0.0 0.0 0.0 14.8 0.0
• 10.7 0.7 16.1 4.0 0.0 0.0 6.5 13.3 0.0
4.3
• 0.0 0.1 0.0 0.0 1.0 0.0 0.0 0.0 0.2 0.0
• 0.0 0.0 0.3 1.0 0.0 3.0 0.0 0.2 0.0
4.4
• 7.1 0.3 0.2 0.2 1.0 0.0 0.0 0.0 14.0 0.0
• 15.8 5.1 2.1 10.0 0.0 12.0 10.5 12.6 0.0
4.5
• 2.6 0.4 0.3 0.6 0.0 0.0 0.0 1.4 0.0
• 2.4 1.7 7.0 0.0 8.0 4.2 1.3 0.0
4.6
• 9.3 0.1 0.1 0.0 1.0 0.0 0.0 0.0 0.3 0.0
• 2.8 0.4 0.3 0.0 0.0 4.0 31.4 0.3 0.0
5.
• 1.7 0.2 0.4 0.1 1.0 0.2 0.0 6.0 0.3
• 4.1 12.8 0.9 1.0 5.9 1.1 5.4 5.6
6.
• 3.1 0.3 1.2 0.0 0.0 0.6 0.0 0.0 0.2 0.0
• 2.0 8.7 0.0 2.0 8.0 0.0 18.8 0.2 0.0
7.
• 5.7 1.0 0.0 0.5 0.0 0.0 13.9 0.0
• 4.2 0.5 8.8 5.0 0.0 12.5 0.0
B.
• 34.6 95.7 95.5 3.9 1.0 95.5 99.0 0.0 5.4 91.8
• 18.2 42.5 47.1 1.0 13.5 49.0 18.8 5.4 42.8
(¶) (¶) (¶) (¶) (¶) (¶) (¶)
For each aggregate, total should amount to 100.0
GVA b.p.
TGVA b.p.
GVA b.p.
Water passenger transport
Restaurants and similar
GVA b.p.
TGVA b.p.
GVA b.p.
TGVA b.p.
Tourism characteristic services
Tab
le 6
. Gro
ss
valu
e a
dd
ed
(G
VA
b.p
.) an
d t
ou
rism
gro
ss v
alu
e a
dd
ed
(T
GV
A b
.p.),
by
ind
ust
ry
Accommodation (Hotels and similar)
Second homes ownership (imputed)
GVA b.p.
TGVA b.p.
Transportation
Travel agencies and similar
Cultural services
TGVA b.p.
Comments
Total (A+B)
GVA b.p.
TGVA b.p.
GVA b.p.
TGVA b.p.
GVA b.p.
Railways passenger transport
Road passenger transport
GVA b.p.
GVA b.p.
TGVA b.p.
Other industries
Sporting and recreational services
TGVA b.p.
GVA b.p.
(¶)
(¶) (¶)
TGVA b.p.
Air passenger transport
(¶)
(¶)
TGVA b.p.
GVA b.p.
TGVA b.p.
GVA b.p.
TGVA b.p.
TGVA b.p.
GVA b.p.
TGVA b.p.
GVA b.p.
Passenger transport equipment rental
Passenger transport supporting services
(¶)

66
PO
L
RO
U
KS
A
SV
K
SV
N
ES
P
SW
E
CH
E
US
A
2002 2001 2005 2005 2003 2004 2005
A.
• 6.1 4.3 0.0 4.1 0.0 0.0 0.0 0.0
• 51.5 67.9 0.0 65.3 0.0 0.0 0.0 0.0
1.
• 0.4 1.2 24.0 0.9 11.7 1.6 0.0 0.0
• 14.4 30.5 24.0 24.0 (¶) 23.0 17.1 0.0
2.
• 0.2 0.0 0.1 0.0 8.7 0.0 0.0
• 9.2 0.0 1.9 (¶) 14.4 7.9 0.0
3.
• 0.8 0.6 39.1 0.6 25.6 6.0 0.0 0.0
• 10.7 6.2 39.1 11.3 (¶) 25.1 16.6 0.0
4.
• 3.9 1.9 30.4 1.2 1.5 3.1 0.0 0.0
• 15.7 8.3 30.4 11.7 (¶) 17.1 15.5 0.0
4.1
• 0.5 0.4 0.4 0.6 3.2 0.2 0.0 0.0
• 6.2 1.3 0.4 0.8 (¶) 1.8 6.3 0.0
4.2
• 2.7 0.8 5.8 0.5 0.0 0.6 0.0 0.0
• 6.1 3.6 5.8 10.7 (¶) 2.9 1.8 0.0
4.3
• 0.0 0.0 0.0 0.0 2.4 0.0 0.0 0.0
• 0.1 0.2 0.0 0.1 (¶) 0.4 0.3 0.0
4.4
• 0.1 0.2 24.1 0.0 16.5 0.6 0.0 0.0
• 3.3 1.0 24.1 0.0 (¶) 7.7 6.0 0.0
4.5
• 0.1 0.4 0.0 (¶) 0.3 1.5 0.0 0.0
• 0.0 1.8 0.0 0.0 (¶) 2.8 0.8 0.0
4.6
• 0.4 0.0 0.0 0.1 5.5 0.2 0.0 0.0
• 0.0 0.5 0.0 0.5 (¶) 1.4 0.4 0.0
5.
• 0.1 0.3 4.1 0.2 13.8 0.3 0.0 0.0
• 5.8 13.2 4.1 8.7 (¶) 4.9 10.5 0.0
6.
• 0.5 0.1 0.2 19.4 0.6 0.0 0.0
• 2.3 0.5 2.6 (¶) 0.6 1.0 0.0
7.
• 0.5 2.5 0.0 1.9 0.0 0.0
• 2.5 2.5 (¶) 1.8 3.0 0.0
B.
• 93.9 95.7 0.0 95.9 0.0 77.7 0.0 0.0
• 48.5 32.1 0.0 34.7 (¶) 13.2 28.3 0.0
(¶) (¶) (¶) (¶) (¶) (¶) (¶)
For each aggregate, total should amount to 100.0
GVA b.p.
TGVA b.p.
GVA b.p.
Water passenger transport
Restaurants and similar
GVA b.p.
TGVA b.p.
GVA b.p.
TGVA b.p.
Tourism characteristic services
Tab
le 6
. Gro
ss
valu
e a
dd
ed
(G
VA
b.p
.) an
d t
ou
rism
gro
ss v
alu
e a
dd
ed
(T
GV
A b
.p.),
by
ind
ust
ry
Accommodation (Hotels and similar)
Second homes ownership (imputed)
GVA b.p.
TGVA b.p.
Transportation
Travel agencies and similar
Cultural services
TGVA b.p.
Comments
Total (A+B)
GVA b.p.
TGVA b.p.
GVA b.p.
TGVA b.p.
GVA b.p.
Railways passenger transport
Road passenger transport
GVA b.p.
GVA b.p.
TGVA b.p.
Other industries
Sporting and recreational services
TGVA b.p.
GVA b.p.
TGVA b.p.
Air passenger transport
(¶)
TGVA b.p.
GVA b.p.
TGVA b.p.
GVA b.p.
TGVA b.p.
TGVA b.p.
GVA b.p.
TGVA b.p.
GVA b.p.
Passenger transport equipment rental
Passenger transport supporting services
(¶)
(¶) (¶)
(█) No answer / (¶) Comments

67
Comments
AUS
4.3 Water passenger transport and 4.4 Air passenger transport: are combined in 4.4 for confidentiality reasons. Comments: In publishing the ATSA estimates, the estimates which relate to air travel are confidential as in Australia there are only
a small number of significant contributors to these estimates. To overcome this, airfares estimates are aggregated with other data when published. On the product side, airfares are included with other long distance passenger transportation. On the industry side, air transport is published with water transport.
AUT
4.6 Passenger transport equipment rental: Included in 4.5 Passenger transport supporting services. 7. Sporting and recreational services: Included in 6. Cultural services. Comments: GVA and TGVA corresponding to “Accommodation” includes “Restaurant and similar”. Due to a lack of detailed data related to “Cultural services” and “Sporting and recreational services” only a total is available.
CAN 4. Transportation: Canadian table 5 & 6 show only Transportation industry aggregation. 6. Cultural services: Aggregated with Sports and recreation services.
CHL Comments: T6 in Chile considers only the first supply-and-demand quadrant, given that an input-output table is not produced for
TCAs.
CHN 2. Imputed accommodation services of Second homes on own account and 4.6 Passenger transport equipment rental:
are not estimated because of data limitation. Comments: Producers’ prices are used in China.
COL 7. Sporting and recreational services: Not available.
CUB Comments: These data are available for internal work of the Office and list of specialized users, not so for the widely distributed
publications published by the National Statistics Office (ONE).
CZE Comments: Tourism industries = tourism characteristic industries as defined in TSA:RMF 2000. 2006 = Preliminary data.
DNK 6. Cultural services: Included in 7. Sporting and recreational services.
FRA
Comments: We have replaced UNWTO's Table 6 by Table 6 bis. Breakdown by industry (%) of Gross Domestic Product (GDP pp) and Tourism Gross Domestic Product (TGDPpp) For practical reasons due to the available sources used in the French TSA, we have replaced Table 6 of the UNWTO questionnaire by the above Table 6 bis: Table 6 bis shows the most detailed activities for which production accounts (including the GVA item) are elaborated in French NA (118 activities for the whole economy); they appear in bold characters. Figures in the second column (under the heading “GDP .p p “) are taken directly from the French NA (except for “imputed accommodation services provided by Second homes on own account” discussed further below) while figures in the third column (under the heading “TGDP .p.p “) are calculated within the French TSA through the preliminary estimation of product components of Internal Tourism Consumption. The French TSA takes advantage of the most detailed Supply and Use table in French NA (492 products for the whole economy) where tourism characteristic services can be identified in a very detailed product classification close to that used in the UNWTO questionnaire. In Table 6 bis, “Tourism Gross Value Added” of each tourism characteristic industry is not calculated by applying a tourism ratio to the Gross Value Added of the corresponding tourism service (as suggested in the TSA: RMF document) since this gross value added amount is unknown in the French NA. For example, the Gross Value Added for “Hotels, restaurants and similar” (including “Catering and food service contracting”) is estimated in the French NA but no estimate is compiled for the Gross Value Added of “Restaurants and similar” industry. Instead, the Tourism Gross Value Added of “Restaurants and similar” industry is estimated within the French TSA by multiplying the restaurant component of the Internal Tourism Consumption by a proxy “value added/ output” ratio based on a business accounts data base used only at a more aggregate level in the general process of NA elaboration. As regards the special case of “imputed accommodation services provided by Second homes on own account”, its value added is implicitly included in the French NA estimate of value added for “Real estate activities on owned or leased property”. However, no separate estimate is directly available in the core of French NA for the “Second homes ownership” value added itself. Given that the second homes numbers account only for about 10% of all dwellings in France and since the French Satellite Account for Housing complies to NA valuation principles and since it relies on official primary data sources, we have derived an estimate of “Second homes ownership” value added from the French Satellite Account for Housing.
GDP .p p TGDP .p.p
FRANCE FRANCE
2005 2005
1. Hotels, restaurants and similar Accommodation (Hotels and similar) Restaurants and similar 2. Second home ownership (imputed) 3. Railways intercity transport (of goods and passengers) Railways intercity passenger transport 4. Road passenger transport 5. Water transport of goods and persons Water passenger transport 6. Air transport of goods and persons Air passenger transport 7. Storage and transport supporting services Passenger transport supporting services 8. Renting of cars, machines and other equipment Passenger transport equipment rental
2,5
n.a. n.a.
(0,9)
0,3
n.a. 0,5
0,1 n.a. 0,4 n.a.
0,9 n.a.
0,8
17,5 13,9
20,3
4,9 3,3
0,2
7,7
3,3

68
9. Travel agencies and similar 10. Cultural, sporting and recreational services Cultural services Sporting and recreational services 11. Other industries
n.a. 0,1 1,6
n.a. n.a. 91,9
0,8 3,3
12,3 4,8 7,6
Total 100 100
IND
Comments: Both Indicators are at factor costs. For Indian TSA, the details of imputed accommodation services provided by Second homes on own account were not collected
because its prevalence was expected to be negligible. In the Indian TSA, separate information on ‘passenger transport support services’ has not been compiled.
IRL
3. Restaurants and similar: Included in 1. Accommodation (Hotels and similar). 4.2 Road passenger transport: Included in 4.1 Railways passenger transport. 4.4 Air passenger transport Included in 4.3 Water passenger transport. 4.5 Passenger transport supporting services and 4.6 Passenger transport equipment rental: All other transport. 7. Sporting and recreational services: Included in 6.Cultural services. Comments: What about Food and Beverages?? GVA (bp) Breakdown by Industry refers to Intermediate industry output only.(???) TGVA (bp) Breakdown by Industry not available.
ISR 7. Sporting and recreational services: Included in 6. Cultural services. JPN Comments: The above table is going to be undertaken from the reference year 2008. LTU 7. Sporting and recreational services: Included in 6. Cultural services.
MEX
4.5 Passenger transport supporting services: Include Local transport (4.7 %), Services related with transport (2.0 %) and Other transport (0.2 %).
4.6 Passenger transport equipment rental: Is tourism transport. 6. Cultural services: Is close to 0.0 %. Comments: Add Timeshares.
MAR 2. imputed accommodation services provided by Second homes on own account and 3. Restaurants and similar: are
grouped with 1. Accommodation (Hotels and similar) 7. Sporting and recreational services: grouped with 6. Cultural services.
NZL
Year: Ended March 2005. GVA b.p. and TGVA b.p.: New Zealand TSA data is not available at Basic prices and instead calculations provided are at Purchasers
prices. Year: Data for the specified industries is only available for the Year ended March 2005. 2. imputed accommodation services provided by Second homes on own account: Data is included within the
Accommodation industry in this instance. 4.1 Railways passenger transport, 4.2 Road passenger transport and 4.3 Water passenger transport: Data is combined for
confidentiality reasons. 5. Travel agencies and similar: Data is included within the Passenger transport supporting services industry in this instance. 6. Cultural services and 7. Sporting and recreational services: Are published as one category in the New Zealand TSA.
OMN 7. Sporting and recreational services: Included in 6. Cultural services.
PER Comments: GVA: only Includes tourism characteristic industry. GVA: Includes only tourism characteristic industry and other industries (connected and not specify).
PHL
2. Imputed accommodation services provided by Second homes on own account: Not available. 3. Restaurants and similar: Food and Beverage serving services. Comments: Based on the 2000 Input-Output (IO) Table. Entertainment & Recreation GVA = 0.68 / TGVA = 6.8 Country-specific tourism characteristic goods – Retail trade GVA = 1.03 / TGVA = 20.3 Miscellaneous GVA = 1.90 / TGVA = 0.9
POL
1. Accommodation (Hotels and similar): Cover all collective accommodation. 2. imputed accommodation services provided by Second homes on own account: Not available. Comments: TGVA covers tourism characteristic and connected activities; the latter include wholesale and retail sale of fuel, food,
beverages, tobacco and clothes. ROU 7. Sporting and recreational services: Aggregated with 6. Cultural services in category “Cultural and recreation services”. KSA 6. Cultural services: Included in 7. Sporting and recreational services.
SVK
1. Accommodation (Hotels and similar) NACE 55. All transport industries also include freight 4.1 Railways passenger transport: NACE 60. 4.3 Water passenger transport: NACE 61. 4.4 Air passenger transport: NACE 62. 4.5 Passenger transport supporting services: NACE 63 without 63.30. 5. Travel agencies and similar: NACE 63.30. 6. Cultural services: NACE 92. 7. Sporting and recreational services: Included in 6.Cultural services. Comments: In tables 5 and 6 we use industry classification at the two digit level of NACE (according to official SUT). Only industry
NACE 63.30 was compiled specially on the level of 4-digit.

69
SVN TGVA b.p.: Not available.
ESP 6. Cultural services: include Non-market recreational, cultural and sporting activities. 7. Sporting and recreational services :include Market recreational, cultural and sporting activities.
CHE 4.1 Railways passenger transport: Including cableways, funiculars and ski-tows. B. Other industries: include miscellaneous services, tourism connected services and non specific services

70
T.7. Tourism gross value added, by components
AU
S
AU
T
CA
N
CH
L
CH
N
CO
L
CU
B
CY
P
CZ
E
DN
K
2003-04 2002 2003 2002 2000 2007 2006
• 57.3 0.0 67.8 37.7 60.9 1.7 0.0 48.5
• 39.2 0.0 32.2 40.4 16.7 2.0 0.0 49.9
• 3.5 0.0 (¶) 3.4 6.3 1.8 0.0 1.6
100 100 100 100 100 100
(¶) (¶) (¶) (¶)Tab
le 7
. To
uri
sm
g
ross
va
lue
add
ed
(T
GV
A
b.p
.), b
y
co
mp
on
ents
(%
)
Gross operating surplus and mixed income
Net taxes on production
Compensation of employees
Total
Comments
EC
U
EG
Y
FIN
HN
D
EG
Y
IND
IDN
IRL
ISR
JPN
2006 2005 2000 2004
• 52.2 0.0 0.0 43.0 0.0 0.0
• 48.7 0.0 0.0 43.9 0.0 0.0
• -0.9 0.0 0.0 13.0 0.0 0.0
100 100 100
(¶) (¶) (¶) (¶)Tab
le 7
. To
uri
sm
g
ross
va
lue
add
ed
(T
GV
A
b.p
.), b
y
co
mp
on
ents
(%
)
Gross operating surplus and mixed income
Net taxes on production
Compensation of employees
Total
Comments
KA
Z
LV
A
LT
U
ME
X
MA
R
NL
D
NZ
L
OM
N
PE
R
PH
L
2006 2004 2006 2006 2005 (¶) 2001 2000
• 32.4 63.0 50.1 21.3 34.0 0.0 51.0 17.1 33.7
• 53.1 33.0 49.8 78.1 65.0 0.0 42.0 82.3 60.0
• 0.7 4.0 0.2 0.6 1.0 0.0 7.0 0.6 6.3
100 100 100 100 100 100 100 100
(¶) (¶)Tab
le 7
. To
uri
sm
g
ross
va
lue
add
ed
(T
GV
A
b.p
.), b
y
co
mp
on
ents
(%
)
Gross operating surplus and mixed income
Net taxes on production
Compensation of employees
Total
Comments
PO
L
RO
U
KS
A
SV
K
SV
N
ES
P
SW
E
CH
E
US
A
2002 2001 2005
• (¶) 36.9 27.8 0.0 0.0 0.0 0.0 0.0 0.0
• (¶) 63.4 72.2 0.0 0.0 0.0 0.0 0.0 0.0
• 15.5 -0.3 (¶) 0.0 0.0 0.0 0.0 0.0 0.0
100 100 100
(¶) (¶) (¶)Tab
le 7
. To
uri
sm
g
ross
va
lue
add
ed
(T
GV
A
b.p
.), b
y
co
mp
on
ents
(%
)
Gross operating surplus and mixed income
Net taxes on production
Compensation of employees
Total
Comments
(█) No answer / (¶) Comments
AUT Comments: No data is available, so far! CAN Next taxes on production: Included in Gross operating surplus and mixed income. CHL Comments: Fixed Capital Consumption = 18.5. CZE Comments: We are not able to separate TGVA by components.
IND Comments: As mentioned earlier, all the information recommended by UNWTO for the TSA exercise could not be collected in the first Indian TSA. The information required for Table-7 was not collected, and hence this table has been left blank.
IRL Gross operating surplus and mixed income: Is net. ISR Comments: These data were not compiled. JPN Comments: The above table is going to be undertaken from the reference year 2008. NLD Comments: Not available.
NZL Year: Data for the specified components is only available for the Year ended March 2005. Comments: New Zealand TSA data is not available in Basic prices and instead these calculations have used Purchasers prices.
POL Compensation of employees and Gross operating surplus and mixed income: Not available.
KSA Net taxes on production:
No taxes on production. There are Government fees included in gross operating surplus and mixed income.
SVN Comments: Data for T7 not available.

71
T.8. Domestic supply
AU
S
AU
T
CA
N
CH
L
CH
N
CO
L
CU
B
CY
P
CZ
E
DN
K
2005 2002 2003 2002 2000 2007 2006
A.
• 0.0 7.0 5.7 73.8 0.0 0.0 0.0 4.0
• 0.0 52.0 0.0 0.0 0.0 0.0 0.0 32.7
1.
• 0.8 3.4 0.4 14.1 0.5 80.9 9.1 0.4 0.4
• 98.5 80.8 91.8 98.2 86.0 83.4 27.0 75.5 92.5
2.
• 4.3 0.0 1.9 16.6 1.1 18.1 3.7 0.9 0.9
• 25.9 0.0 20.2 43.7 46.3 19.6 67.0 51.3 23.9
3.
• 2.2 2.4 2.4 30.4 0.5 17.6 7.1 0.8 1.4
• 63.8 21.9 37.4 36.7 82.7 17.8 36.0 40.6 18.3
4.
• 0.2 0.0 0.1 8.5 0.1 84.7 0.1 0.5 0.3
• 92.2 100.0 99.5 100.0 92.4 90.0 100.0 100.0 49.9
5.
• 0.0 1.2 0.0 0.2 0.1 0.0 0.3 0.3
• 0.0 29.3 0.0 0.0 71.9 0.0 14.0 29.8
6.
• 3.5 0.0 0.8 4.0 0.2 6.7 1.0 0.5 1.5
• 9.9 0.0 24.0 0.0 65.4 6.8 15.0 6.6 5.5
7.
• 33.8 0.0 0.1 0.0 5.5 0.0 5.8 0.5 0.1
• 4.9 0.0 99.3 0.0 7.5 0.0 0.0 1.5 13.0
B.
• 40.3 48.0 51.7 4.2 92.0 0.9 72.9 42.5 58.0
• 0.6 1.0 0.0 0.0 0.7 2.1 0.0 0.5 0.5
C.
• 15.0 45.0 42.6 22.0 0.0 0.2 0.0 53.6 37.5
(¶) (¶) (¶) (¶) (¶)
For each product, total should amount to 100.0
Tourism ratio on supply
Tourism ratio on supply
Tourism characteristic services
Tourism ratio on supply
Share of each product
Tourism ratio on supply
Share of each product
Tourism ratio on supply
Share of each product
Travel agencies, tour operators and tourist guideservices
Share of each product
Tab
le 8
. Do
mes
tic
su
pp
ly o
f g
oo
ds
an
d s
ervi
ces
, b
y p
rod
uct
s (
%)
Accommodation services
Food and beverage serving services
Share of each product
Tourism ratio on supply
Passenger transport services
Comments
Goods
Share of each product
Cultural services
Recreation and other entertainment services
Tourism ratio on supply
Share of each product
Share of each product
Total (A+B+C)
Share of each product
Other services
Tourism ratio on supply
Miscellaneous tourism services
Share of each product
Tourism ratio on supply

72
EC
U
EG
Y
FIN
FR
A
HN
D
IND
IDN
IRL
ISR
JPN
2006 2005 2005 2002-03 2000 2004
A.
• 4.3 0.0 41.0 0.0 0.0 0.0 0.0
• 48.1 0.0 38.0 0.0 0.0 0.0 0.0
1.
• 0.5 15.5 3.0 1.5 3.5 0.5 0.0
• 91.7 100.0 78.0 91.7 50.0 99.0 0.0
2.
• 1.6 18.4 13.0 7.6 16.6 1.5 0.0
• 29.0 43.7 31.0 18.4 2.0 13.0 0.0
3.
• 1.1 11.2 10.0 42.4 4.1 5.4 0.0
• 78.7 86.9 56.0 33.9 65.0 14.0 0.0
4.
• 0.1 3.1 0.0 2.2 3.4 0.2 0.0
• 99.1 100.0 100.0 95.6 4.0 100.0 0.0
5.
• 0.2 10.9 0.0 0.0 1.1 0.3 0.0
• 28.5 49.1 32.0 0.0 27.0 18.0 0.0
6.
• 0.2 7.2 1.0 0.9 0.0 0.0
• 43.4 30.8 95.0 49.0 0.0 0.0
7.
• 0.6 7.5 14.0 0.0 14.8 5.9 0.0
• 7.6 29.9 15.0 0.0 2.0 1.4 0.0
B.
• 95.7 13.4 59.0 0.0 56.5 43.0 0.0
• 0.2 4.5 8.0 0.0 4.0 0.0 0.0
C.
• 0.0 12.8 0.0 45.4 0.0 43.0 0.0
(¶) (¶) (¶) (¶) (¶)
(¶)
Share of each product
Share of each product
Total (A+B+C)
Share of each product
Other services
Tourism ratio on supply
Miscellaneous tourism services
Share of each product
Tourism ratio on supply
Share of each product
Cultural services
Recreation and other entertainment services
Tourism ratio on supply
Share of each product
Tab
le 8
. D
om
esti
c su
pp
ly o
f g
oo
ds
an
d s
ervi
ces,
by
pro
du
cts
(%)
Accommodation services
Food and beverage serving services
Share of each product
Tourism ratio on supply
Passenger transport services
Comments
Goods
Tourism ratio on supply
Tourism ratio on supply
Tourism characteristic services
Tourism ratio on supply
Share of each product
Tourism ratio on supply
Share of each product
Tourism ratio on supply
Share of each product
Travel agencies, tour operators and tourist guideservices
For each product, total should amount to 100.0

73
KA
Z
LV
A
LT
U
ME
X
MA
R
NL
D
NZ
L
OM
N
PE
R
PH
L
2006 2004 2006 2006 2005 2007 (¶) 2007 2001.0 2000
A.
• 0.0 0.0 0.0 12.5 0.0 0.0 0.0 0.0
• 0.0 0.0 0.0 95.5 0.0 0.0 0.0 0.0
1.
• 6.2 0.3 0.4 14.2 5.0 0.0 8.0 13.9 14.8 0.0
• 99.0 0.0 85.0 80.7 94.0 89.9 95.0 0.0 100.0 100.0
2.
• 8.3 1.2 0.6 29.2 2.0 0.0 9.0 5.6 19.1 0.0
• 58.0 0.0 39.2 91.7 75.0 77.6 43.0 0.0 100.0 24.7
3.
• 40.0 2.3 5.8 1.3 2.0 0.0 29.0 25.4 30.1 0.0
• 48.1 0.0 4.4 88.5 48.0 78.0 0.0 0.0 100.0 7.2
4.
• 1.4 0.1 0.4 0.1 1.0 0.0 29.0 27.2 5.6 0.0
• 100.0 0.0 92.4 82.5 11.0 100.0 88.0 0.0 100.0 100.0
5.
• 3,9 0.3 1.0 0.8 0.0 0.0 0.0 1.2 10.2 0.0
• 26.0 0.0 19.8 83.0 74.0 35.0 0.0 0.0 100.0 51.0
6.
• 7.3 0.8 1.9 0.0 0.0 54.0 6.7 0.0
• 30.3 0.0 0.0 100.0 95.0 61.8 6.0 0.0 100.0 100.0
7.
• 7.2 0.2 16.5 4.0 0.0 4.5 2.3
• 8.4 0.0 0.0 99.1 18.0 0.0 0.0 0.0 0.0
B.
• 74.3 52.6 74.6 23.5 31.0 0.0 22.2 5.6 0.0
• 0.0 0.0 0.0 91.4 2.0 0.0 0.0 0.0 97.2 2.3
C.
• 26.0 42.2 17.1 23.5 50.0 0.0 0.0 7.8
(¶) (¶) (¶) (¶) (¶) (¶)
For each product, total should amount to 100.0
Tourism ratio on supply
Tourism ratio on supply
Tourism characteristic services
Tourism ratio on supply
Share of each product
Tourism ratio on supply
Share of each product
Tourism ratio on supply
Share of each product
Travel agencies, tour operators and tourist guideservices
Share of each product
Tab
le 8
. Do
mes
tic
su
pp
ly o
f g
oo
ds
an
d s
ervi
ces
, b
y p
rod
uct
s (
%)
Accommodation services
Food and beverage serving services
Share of each product
Tourism ratio on supply
Passenger transport services
Comments
Goods
Share of each product
Cultural services
Recreation and other entertainment services
Tourism ratio on supply
Share of each product
Share of each product
Total (A+B+C)
Share of each product
Other services
Tourism ratio on supply
Miscellaneous tourism services
Share of each product
Tourism ratio on supply

74
PO
L
RO
U
KS
A
SV
K
SV
N
ES
P
SW
E
CH
E
US
A
2002 2001 2005 2005 2003 2004 2005 2006
A.
• 0.0 8.1 0.0 4.9 5.6 0.0 47.2 0.0
• 0.0 12.2 0.0 29.0 44.0 0.0 9.9 0.0
1.
• 4.0 0.8 17.7 0.4 0.8 31.6 10.1 17.1
• 94.0 59.5 0.0 99.0 98.0 21.0 13.6 100.0
2.
• 9.3 0.8 47.1 0.5 0.7 28.7 3.6 16.5
• 31.0 21.5 0.0 73.0 30.0 28.4 27.6 19.9
3.
• 15.9 4.9 29.3 1.1 0.1 14.0 3.1 24.0
• 34.0 2.6 0.0 40.0 27.0 35.0 45.6 100.0
4.
• 1.5 0.2 2.8 0.1 1.8 4.5 0.5 5.8
• 40.0 93.0 0.0 100.0 99.0 100.0 100.0 96.0
5.
• 5.0 0.2 0.0 0.1 1.6 0.0 0.5 1.7
• 9.0 3.6 0.0 38.0 31.0 7.7 21.3 34.6
6.
• 8.7 0.0 0.0 0.7 0.1 2.9 1.3 9.9
• 0.0 0.0 0.0 12.0 67.0 7.5 15.6 35.0
7.
• 0.0 1.2 0.1 2.0 0.4 0.0 28.1 0.0
• 0.0 0.9 0.0 3.0 3.0 100.0 0.4 0.0
B.
• 55.6 17.0 2.9 0.0 5.8 5.5 24.0 0.0
• 3.0 0.8 0.0 0.0 1.0 0.6 4.3 0.0
C.
• 0.0 74.9 0.1 95.1 82.7 12.7 28.9 25.0
(¶) (¶) (¶) (¶) (¶)
For each product, total should amount to 100.0
Tourism ratio on supply
Tourism ratio on supply
Tourism characteristic services
Tourism ratio on supply
Share of each product
Tourism ratio on supply
Share of each product
Tourism ratio on supply
Share of each product
Travel agencies, tour operators and tourist guideservices
Share of each product
Tab
le 8
. Do
mes
tic
su
pp
ly o
f g
oo
ds
an
d s
ervi
ces
, b
y p
rod
uct
s (
%)
Accommodation services
Food and beverage serving services
Share of each product
Tourism ratio on supply
Passenger transport services
Comments
Goods
Share of each product
Cultural services
Recreation and other entertainment services
Tourism ratio on supply
Share of each product
Share of each product
Total (A+B+C)
Share of each product
Other services
Tourism ratio on supply
Miscellaneous tourism services
Share of each product
Tourism ratio on supply
(█) No answer / (¶) Comments

75
Comments
AUS
5. Cultural services: The Australian Tourism Satellite Account (ATSA) does not separately disaggregate Cultural Services in its product classification. As such, this product is included in Recreation and other entertainment services in the table above.
7. Miscellaneous tourism services: Includes actual and imputed rent on dwellings (I.e. holiday homes) Other services: The residual category 'Other tourism goods and services' in the ATSA does not separately identify goods and
services. Comments: The confrontation between supply and internal tourism consumption in the Australian Tourism Satellite Account (ATSA) is
undertaken through the comparison of domestic output at basic prices (excluding imports) and tourism consumption at basic prices (excluding tourism imports purchased in Australia).
The “Share of each product” column in the table above for Australia refers to the share of domestic output at basic prices of each product, rather than the share of domestic supply at purchaser prices.
The “Tourism ratio on supply” column in the table above for Australia is derived as the proportion of the domestic output of each product that is consumed by visitors by dividing tourism consumption at basic prices into the total supply of each product at basic prices. This is referred to as the tourism product ratio in the ATSA.
All tourism consumption in Australia is allocated to a specific product or is allocated to the residual “All other tourism goods and services” product grouping. Therefore, products identified as goods are allocated to the 'Goods' grouping above, while the residual category 'Other services' does not separately identify between goods and services.
AUT
2. Food and beverage serving services: Includes in 1. Accommodation services. 6. Recreation and other entertainment services and 7. Miscellaneous tourism services: Included in 5. Cultural services. Comments: Due to a lack of detailed data related to “Accommodation services” and “Food and beverage serving services” only a total is
available. Due to a lack of detailed data related to “Cultural services”, “Recreation and other entertainment services” and “Miscellaneous
tourism services” only a total is available.
CAN
3. Passenger transport services: Includes vehicle fuel. 4. Travel agencies, tour operators and tourist guide services: Corresponds to the commissions of the travel agencies and tour
operators. 5. Cultural services: Included with Recreation and other entertainment services. 7. Miscellaneous tourism services: In Domestic tourism consumption, it includes single purpose tourism durable goods. Share of domestically produced goods and services at purchaser prices (i.e. does not include imports).
CHL 5. Cultural services, 7. Miscellaneous tourism services and Other services: Not available.
CZE Comments: Tourism industries = tourism characteristic industries as defined in TSA:RMF 2000. 2006 = Preliminary data.
FIN Goods: Included in Other services.
FRA
Comments: 1) As already explained in our comments on Table 2 and Table 6 bis above, the French TSA estimation relies directly on the
“Uses side” of the most detailed French Supply-Uses Table where all expenditure are broken down by products (492 products for the whole economy) and not on the “Supply side” where domestic supply is broken down by industries (only 118 industries for the whole economy). By using the identity for each product between domestic supply at purchasers prices on one side and total uses (including exports) less imports at purchasers prices on the other side, this method enables us to estimate the tourism ratios on supply of such services as “passenger transport services” although these activities are not identified as industries in the French classification of industries.
2) Exceptionally, the row “Goods” in Table 8 above refers only to the value of goods actually consumed by visitors (mainly petrol for cars, food and beverage purchased outside restaurants and other goods purchased by visitors). It does not refer to the total domestic supply of these goods. So the intersection of the row “Goods” and the column “Tourism ratio on supply” is irrelevant.
IRL 6. Recreation and other entertainment services: Includes in 5.Cultural services.
ISR 3. Passenger transport services: Includes private and rental cars. 6. Recreation and other entertainment services: Includes in 5. Cultural services.
JPN Comments: The above table is going to be compiled starting with the reference year 2008. KAZ Other services: Total.
LTU 6. Recreation and other entertainment services: Included in 5.Cultural services. 7. Miscellaneous tourism services: Included in Other services.
MEX
7. Miscellaneous tourism services: Is equal to imputed accommodation services provided by Second homes on own account. Other services: include tourism connected services. Goods: Include tourism characteristic products and tourism connected products. Comments: Add Timeshares.
NZL
3. Passenger transport services and 4. Travel agencies, tour operators and tourist guide services: • Share of each product: Are provided at an aggregated level due to the unavailability of detailed information as the year in
question is a provisional estimate. • Tourism ratio on supply: The ratio calculated here reflects the aggregation of Passenger transport services and Travel
agencies, tour operators and tourist guide services. 5. Cultural services, 6. Recreation and other entertainment services and 7. Miscellaneous tourism services: • Share of each product: Are provided at an aggregated level due to the unavailability of detailed information as the year in
question is a provisional estimate. • Tourism ratio on supply: The ratio calculated here reflects the aggregation of Cultural services, Recreation and other
entertainment services and Miscellaneous tourism services aggregation. Other services and Goods: Are included in the Cultural services, Recreation and other entertainment services and Miscellaneous
tourism services aggregation. PER Other services: The supply of products considered as secondary .production

76
PHL Goods: Not available.
POL Tourism ratio on supply: • Cultural services: Cultural and recreational services together. • Other services: Trade in food, clothes and fuel, only margins.
ROU
6. Recreation and other entertainment services: Aggregated with 5. Cultural services in category “Cultural and recreation services”.
Other services: Non-specific services. Goods: Includes distribution margin of non-specific products and the value of domestically produced goods net of distribution
margins.
KSA 5. Cultural services: Included in Other services. 6. Recreation and other entertainment services: Included in Other services.
ESP 5. Cultural services:include Non-market artistic and news agency services. 6. Recreation and other entertainment services: include market cultural and sporting services.
CHE Other services: Tourism connected services. Goods: Including wholesale margin, excluding retail trade margin.
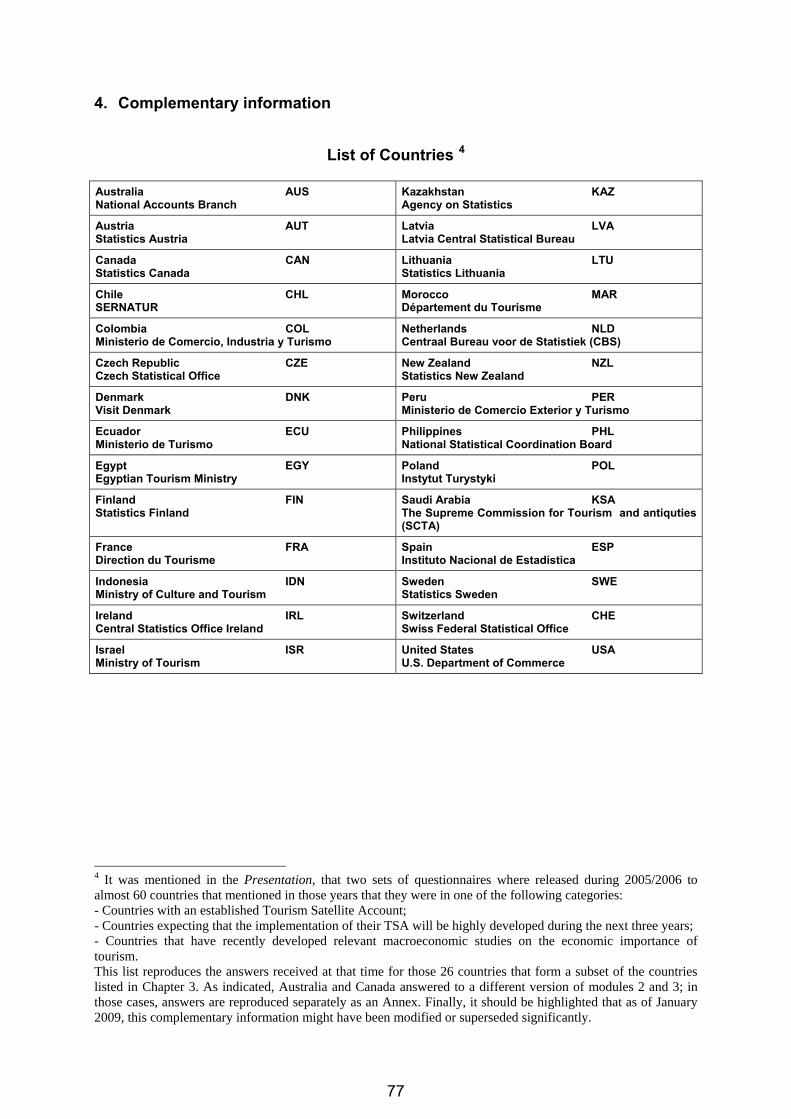
77
4. Complementary information
List of Countries 4 Australia AUS National Accounts Branch
Kazakhstan KAZ Agency on Statistics
Austria AUT Statistics Austria
Latvia LVA Latvia Central Statistical Bureau
Canada CAN Statistics Canada
Lithuania LTU Statistics Lithuania
Chile CHL SERNATUR
Morocco MAR Département du Tourisme
Colombia COL Ministerio de Comercio, Industria y Turismo
Netherlands NLD Centraal Bureau voor de Statistiek (CBS)
Czech Republic CZE Czech Statistical Office
New Zealand NZL Statistics New Zealand
Denmark DNK Visit Denmark
Peru PER Ministerio de Comercio Exterior y Turismo
Ecuador ECU Ministerio de Turismo
Philippines PHL National Statistical Coordination Board
Egypt EGY Egyptian Tourism Ministry
Poland POL Instytut Turystyki
Finland FIN Statistics Finland
Saudi Arabia KSA The Supreme Commission for Tourism and antiquties (SCTA)
France FRA Direction du Tourisme
Spain ESP Instituto Nacional de Estadística
Indonesia IDN Ministry of Culture and Tourism
Sweden SWE Statistics Sweden
Ireland IRL Central Statistics Office Ireland
Switzerland CHE Swiss Federal Statistical Office
Israel ISR Ministry of Tourism
United States USA U.S. Department of Commerce
4 It was mentioned in the Presentation, that two sets of questionnaires where released during 2005/2006 to almost 60 countries that mentioned in those years that they were in one of the following categories: - Countries with an established Tourism Satellite Account; - Countries expecting that the implementation of their TSA will be highly developed during the next three years; - Countries that have recently developed relevant macroeconomic studies on the economic importance of tourism. This list reproduces the answers received at that time for those 26 countries that form a subset of the countries listed in Chapter 3. As indicated, Australia and Canada answered to a different version of modules 2 and 3; in those cases, answers are reproduced separately as an Annex. Finally, it should be highlighted that as of January 2009, this complementary information might have been modified or superseded significantly.

78
Module 1: Where you are
AU
S
AU
T
CA
N
CZ
E
CH
L
CO
L
DN
K
EC
U
EG
Y
FIN
FR
A
ID
N
IR
L
IS
R
KA
Z
LV
A
LT
U
MA
R
NL
D
NZ
L
PE
R
PH
L
PO
L
KS
A
ES
P
SW
E
CH
E
US
A
We have a full-fledged TSA showingthe interface between visitorconsumption and the correspondingsupply of goods and services
Y Y Y N Y Y Y N Y N N N Y Y N N Y Y Y Y Y Y N Y N Y Y
This full-fledged TSA is compiledentirely every year
N Y N Y N N Y N N Y Y Y Y N N Y Y N Y
if not: last year of compilation (¶) (¶) (¶) (¶) (¶) (¶) (¶) (¶) (¶)This full-fledged TSA has beencompiled for a benchmark year andprojected through indicators forcurrent years
• reference year of fullestimation (¶)
• projected values are balanced Y N Y Y Y Y N Y N Y Y Y N YAlthough full-fledged in terms of itsmethodology, it is partial as not allcomponents are included.Components missing refer to:
• coverage of visitors (¶)• coverage of consumption
We do not have a full-fledged TSA atthe level of an experimental TSA, dueto:
• statistical basis is too incomplete • use of coefficients derived from other countries
• data corresponding to a mix of different years
or due to independent andunreconciled estimations of supplyand demand:
• both based on statistical sources • only consumption is based on statistical information
• only supply is based on statistical information
C
We are in the process of improvingthe statistical basis towards a TSAcompilation
Y Y Y Y Y Y Y Y N Y
Comments: (¶) (¶) (¶) (¶) (¶) (¶) (¶) (¶) (¶) (¶) (¶) (¶) (¶)
Y Y Y Y Y Y N N N Y Y (¶) Y Y Y Y Y N Y Y Y Y Y Y N Y N
From the Public AdministrationY Y N Y Y Y Y Y Y Y Y Y Y Y Y Y Y Y Y Y Y Y
N N N N N Y N N Y N Y N N Y
unit in charge of surveys of productive activities
N Y Y Y Y Y Y Y Y Y Y Y Y Y N Y Y N Y Y
unit in charge of National Accounts compilation
N N Y N Y Y Y Y Y N Y Y N Y Y Y Y Y Y Y Y
The Border Control Authority Y N N N Y Y N N Y Y Y Y N Y Y N YThe Civil Aviation administration N N N N Y Y N N ? N N Y N Y Y N YThe Port Authority N N N N N Y N N ? N N Y N N N NOthers (¶) Y Y N From other administrationsThe Central Bank
unit in charge of the Balance of Payments compilation
N Y N Y Y Y Y Y N N Y Y Y Y N (¶) Y Y Y Y
The Tourism Authority (or equivalent) N Y Y N Y Y Y Y N Y N Y N N Y N YFrom local administrationsRegional/local Tourism offices N N Y N N Y Y Y N N N Y N Y N N NFrom the private sectorBusiness associations N N Y Y Y Y Y Y N ? N N Y Y N YPlease identify them (¶)
Y N Y N N Y N Y N Y Y N N Y Y Y Y Y YY N Y Y Y Y N Y N Y Y N Y N Y Y Y Y Y Y YY N Y Y Y Y N Y Y ? N N Y N Y Y Y Y Y Y Y
Y N Y N Y Y N Y N Y Y Y N Y Y N Y Y Y Y Y
Y Y Y N Y Y Y Y Y N Y Y Y N Y Y Y Y Y Y Y
N Y Y N Y N Y Y Y
Y Y Y N Y Y N N N Y Y N Y Y Y Y N N Y
N N Y Y Y Y Y Y N N Y N Y Y Y Y Y Y
N N Y N N Y N Y Y N Y Y Y N Y Y Y Y Y
Comments: (¶) (¶) (¶) (¶) (¶) (¶) (¶) (¶) (¶) (¶) (¶) (¶) (¶) (¶) (¶) (¶) (¶) (¶) (¶)
(█) No answer / (Y) Yes / (N) No / (¶) Comments
1.1 Level of development of the TSA:
AB
(¶)
1.2.3 Mechanisms that have been used toset up this inter-institutional cooperation
Working Groups on specific issues, e.g.….
1.2 The inter-institutional platform
Could you give your opinion on the level of development of the TSA project in your country?
Do you have an operating inter-institutional platform for tourism 1.2.1 What is the membership? pleaseidentify members from the list
Policy defining levelOperational level in terms of data collection
The Ministry of Transport (if different from Tourism)
The Ministry of Tourism (or equivalent)
The National Statistical Office
1.2.2 Do you have different levels ofinvolvement? For example,
Shared responsibility among institutions onspecific statistical operations
Informal agreementsContracts for the provision of statistical dataproduced under specific responsibility
Please explain: (¶)
Please specify: (¶)Working Groups on specific issuesPlease identify issues: (¶)Shared responsibility on specific statisticaloperation
Formalized agreements between differentpartners
AUS
1.1 • if not: last year of compilation: 2000-2001 (Reference year). • Reference year of full estimation: 2000-2001. • In terms of coverage of visitors and In terms of coverage of consumption): The Australian TSA does not include the
following: 1. International same day visitors 2. Items of expenditure for outbound visitors

79
3. Annually released full employment table (e.g. male/female) but do industry 4. Produce tourism gross fixed capital formation 5. Present details of tourism related consumption
• Comments: While the ABS conducts a fully-fledged TSA every three years (last one in 2000-01), TSA results are released on an annual basis using demand indicators to project the estimates forward.
1.2.1 From the Public Administration – Others: Tourism Research Australia (undertakes visitor demand surveys). 1.2.3 • Mostly formalized agreements: Between the ABS and the Department of Industry, Tourism & Resources. We have a
Memorandum of Understanding in place for the compilation of the TSA because it is funded by the Ministry of Tourism. • Comments:
• Collection activity is undertaken across two agencies. ABS collects industry (supply) data, while TRA collects tourism demand data for domestic and international visitors.
• The TSA is compiled by ABS (National Accounts). • The client who provides funding is the Department of Industry, Tourism & Resources.
CAN
1.1 • if not: last year of compilation: 2002 • Reference year of full estimation :2007 • In terms of coverage of visitors and In terms of coverage of consumption):
• In transit visitors and students are not covered. • Detailed consumption of same day visitors is not collected. • Information on Consumption by in transit visitors and students is not available.
1.2.1 • From the other administrations:
• The Central Bank: For Canada, Balance of Payments compilation is part of the National Accounts compilation. • The Tourism Authority (or equivalent): Canada Tourism Commission (CTC).
• Business associations: ex. Conference Board of Canada, Hotel Association. 1.2.3 • Mostly formalized agreements: CTC and other partners • Contracts for the provision…: TSA, NTI, TAMS, travel surveys • Working Groups…: Various task forces & working groups for regional TSA, travel surveys communication issues. • Shared responsibility…: Surveys, development of questionnaires, TSA, NTI and extensions.
CZE
1.2.1 • From the Public Administration – Others: Experts from public institution. • Business associations: SOCR, HOREKA. 1.2.3 Working Groups…: TSA, accommodation statistic, inbound and outbound statistic.
CHL
1.1 • if not: last year of compilation: 2003. • reference year of full estimation: 2003. • Comments: In the case of Chile, for year 2003, Tables 1, 2, 3, 4, 5, 6 and 7 were prepared based on the compilation of the
accounts on the production of tourism characteristic and tourism-related activities and studies on inbound and outbound tourism carried out over the year by SERNATUR and a study on domestic tourism conducted jointly by SERNATUR and INE.
1.2.1 • The National Statistical Office (Unit in charge of National Accounts compilation): Central Bank • Business associations: Cámara de Comercio, Servicios y Turismo (CONSETUR) and the Corporación de Promoción
Turística (CPT). 1.2.3 • Contracts for the provision…: There is an agreement between SERNATUR and the Central Bank, whereby SERNATUR
provides the Bank with figures on income and expenditure associated with inbound and outbound tourism. This agreement dates back to 1991. With the INE, an agreement has been in place since 1999 for the statistics they generate based on monthly surveys at tourism accommodation establishments. Recently, another agreement has been under study involving all the information requirements of SERNATUR, which are related to the information needed for the TSA.
• Comments: In 2005 an inter-institutional agreement was signed between the Servicio Nacional de Turismo, Banco Central de Chile, Instituto Nacional de Estadísticas, Consejo Superior de Turismo and the Corporación de Promoción Turística, while the TSA project for year 2003 was being elaborated. In the present year (2006) the Central Bank expressed that it was not necessary to carry out such agreement in order to provide information for the TSA, and that it would only be necessary to complete a single form listing information requirements. In view of this, an agreement will be carried out with the INE that would include the basic information they provide for the TSA.
DNK 1.1 Reference year of full estimation: 2004.
ECU
1.1 • if not: last year of compilation: 2003. • reference year of full estimation: 1993. • Comments: The reinforcement of the System of Tourism Statistics and in particular the development of the Tourism Satellite
Account must be considered a national necessity, in which the main institutions linked to the industry should proactively participate, aiming at the institutionalization of the project in order to ensure its technical and financial sustainability.
1.2.1 Business associations: Federación de Cámaras Provinciales de Turismo -FENACAPTUR-. 1.2.3 • Contracts for the provision…: During the period 2001-2003.
Central Bank: Provided the methodologies for the elaboration of the S-U balance of products related to tourism activity; methodologies for the preparation of the transport and travel items in the current account of the balance of payments. Instituto Nacional de Estadística – Dirección Nacional de Migración: provided information on arrivals of foreigners into the country and departures of nationals to foreign destinations. Ministry of Tourism: Carried out surveys on tourism supply and demand and updated records on tourism establishments.
• Shared responsibility…: The Executing Unit engaged for the period 2001-2003 was given the task of constructing the Tourism Satellite Account and laying the groundwork for a system of tourism statistics. The institutions that comprised the inter-institutional technical platform limited themselves to providing the information and observing the elaboration process.
• Comments: The development of the Tourism Satellite Account project should have been undertaken as a national project rather than as an inter-institutional project, where entities that were directly involved should have assumed proactive roles in developing the project and maintaining it with technical and financial contributions, under the coordination of the Tourism Administration. It is not advisable to develop this kind of project under structures that are independent from the institutional structures, as it limits its sustainability and institutionalization.

80
EGY
1.1 Comments: The answers are based on the fact that Egypt has not developed yet its TSA; but it is in the pipeline. A pre-feasibility study is carried out at present and the preparation of TSA study is in process. TSA development will follow the UNWTO guidelines and data and surveys will be compiled and conducted in line with these guidelines. 1.2.1 • From the Public Administration – Others: CAMPAS. • Business associations: Egyptian Tourism Federation and associations. 1.2.3 • Contracts for the provision…: These are agencies involved in Tourism Statistics collection working either independently or
through formal arrangements and contracts bus not as an operating inter-institutional set-up (committee or commission). • Working Groups…: Ministry of Economic Development. • Shared responsibility…:
• Passport and Immigration Authority. • Civil Aviation Authority.
• Comments: At present, we are in the process of settng up an institutional platform for theTSA project.
FIN
1.1 • reference year of full estimation: 2001. • Although full-fledged in terms of its methodology…:
• Outbound tourism consumption. • Tourism collective consumption. • Tourism gross fixed capital formation.
FRA
1.1 Comments: We are in the process of establishing a full-fledged TSA for 2002 but still have to cope with a few difficulties. 1.2.3 • Working Groups…: Issues to be defined. • Comments: The French tourism administration has the full responsibility for the TSA. Nevertheless, the compilation method
requires a good knowledge of National Accounting.
IRL 1.2 Do you have an operating…: Yes (informally). 1.2.3 Shared responsibility…: We co-operate with Northern Ireland Tourist Board regarding data exchange between jurisdictions.
ISR 1.1 • if not: last year of compilation: 1995. • reference year of full estimation: 1995.
LVA
1.2.3 • Contracts for the provision…: Latvia CSB has a contract with the Central Bank of Latvia which compiles the BOP and
calculations on tourism supply statistics. • Working Groups…: Tourism State Programme. • Shared responsibility…: BOP is compiled by the Central Bank.
LTU 1.2.3 Shared responsibility…: Each institution is responsible for its data collection, and Statistics Lithuania is the coordinating authority.
MAR
1.1 • if not: last year of compilation: 1998. • Reference year of full estimation: 1998. 1.2.1 The Central Bank:
NLD
1.1 • if not: last year of compilation: 2002. • Comments: The compilation of the TSA is planned every year. After the time series which will take place at the beginning of
2007 it is part of the regular program. 1.2.3 Comments: There is no platform but parts of the TSA have at certain times received funding from other sources like the Ministry of Economic Affairs.
NZL
1.1 • Last year of compilation: 2002. • Reference year of full estimation: 2002. • In terms of coverage of visitors and In terms of coverage of consumption): Coverage of consumption – New Zealand
(NZ) TSA does not include any imputation for the provision of individual non-market tourism services in total tourism consumption.
1.2.1 Business associations: chief executives from: one of our largest commercial banks and the national airline: - A popular tourist destination/facility 1.2.3 • Informal agreements: The Ministry of Tourism and Statistics NZ. • Contracts for the provision…: Within the Memorandum of Understanding, the Ministry is to provide a certain amount of input
data. In return, Statistics NZ is to produce an annual TSA by a set date, and following certain standards. • Working Groups…: The review of key surveys (which are extensively used as data sources) – Domestic Travellers Survey
review - International Visitors Survey review. • Shared responsibility…: It is generally the responsibility of Statistics NZ to undertake the statistical operations. If there are
any changes to statistical methodologies, these will be conveyed to the Ministry of Tourism.
PER
1.1. if not: last year of compilation: 2001. 1.2.1 • The Ministry of Tourism (or equivalent): Ministerio de Comercio Exterior y Turismo (MINCETUR). • The Ministry of Transport (if different from Tourism): Ministerio de Transporte y Comunicaciones (MTC). • The National Statistical Office (Unit in charge of National Accounts compilation): Instituto Nacional de Estadística e
Informática (INEI). • The Border Control Authority: Dirección General de Migración y Naturalización (DIGEMIN). • The Civil Aviation administration: Corporación Peruana de Aeropuertos y Aviación Comercial (CORPAC). • The Central Bank: Banco Central de Reserva del Perú (BCRP). • From other administrations: Comisión de Promoción del Perú (PROMPERU).
This institution does not belong to the Bank and is independent. PROMPERU formulates and executes the policies and strategies of promotion of domestic and inbound tourism, as well as developes and executes the diffusion of the image of Peru outside as the matter of tourism promotion
• Business associations: Cámara Nacional de Turismo del Perú (CANATUR). 1.2.3 • Contracts for the provision…: DIGEMIN, INEI, BCRP, PROMPERU.

81
• Working Groups…: Viceministerio de Turismo – Banco Central de Reserva del Perú. • Shared responsibility…: Viceministerio de Turismo – Instituto Nacional de Estadística e Informática.
PHL
1.1. • Last year of compilation: 1998. • Reference year of full estimation: 1994 / 1998. • Projected values are balanced: Not applicable. • In terms of coverage of visitors:
a) outbound tourism. • In terms of coverage of consumption:
a) pre-travel consumption expenditures by resident tourists; b) expenditures of same day visitors; c) expenditures of households on behalf of tourists; and d) expenditure of outbound tourists.
1.2 • From the Public Administration – Others: Department of Interior and Local Government / National Economic and
Development Authority. • Business associations: Hotel and Restaurant Association of the Philippines / Philippine Tour Operators Association /
Philippine Travel Agencies Association / Board of Airline Representatives / Academe / University of the Philippines – Asian Institute of Tourism / Training Center / Statistical Research and Training Center.
1.2.3 • Informal agreements: Among all the members of the Inter-agency Committee on Tourism Statistics. • Contracts for the provision…: Memorandum of Agreement between the Department of Tourism and the National Statistical
Coordination Board on the provision of Statistics to the Philippine Statistical Yearbook. • Working Groups…: Tourism Statistics Capacity Building Program / Philippine Statistical Development Program / Survey on
Domestic Tourism In the Philippines. • Shared responsibility…: Capacity Building Program / Preparation of Statistical Development Programs.
POL
1.1 This full-fledged TSA is compiled entirely every year: (Yes) - 2001. 1.2.3 • Contracts for the provision…: The Programme of Statistical Data Collection. • Working Groups…: The Group for the Methodology of Tourism Satellite Account for Poland. • Shared responsibility…: The National Statistical Office is responsible for the collection of statistical data covering the supply
side of tourism; Institute of Tourism is responsible for collection of data on the demand side of tourism.
KSA
1.2.1 Business associations: Council of Saudi Chambers of Commerce and Industry. 1.2.2 and 1.2.3 • Working Groups…: Tourism Balance of Payment. • Shared responsibility…: Tourism Supply Statistics. 1.2.3 Comments: SCT has signed MOU's with other government agencies like Ministry of Economy and Planning to insure their cooperation especially in tourism statistics.
ESP
1.1 reference year of full estimation: 2000. 1.2.3 • Working Groups…:
• Tourism Satellite Account. • EGATUR (frontier survey).
• Shared responsibility…: EGATUR (frontier survey).
SWE 1.2 Comments: We have only an agreement between the Tourism Authority and the NSO, that the NSO will produce the Tourism Satellite Account on commission. During the first development stage of the TSA in the middle of the 90-ies collaboration between authorities/branch organizations and researchers with knowledge within the area took place.
CHE 1.1 if not: last year of compilation: 2005. • in charge of surveys of productive activities: “Tourism” Unit of the Federal Statistical Office. • Others: State secretariat for Economic Affairs (Seco).
USA
1.1 • Reference year of full estimation: 1997. • Coverage of visitors: No headcount. 1.2 Comments: We have such a group for policy –the Tourism Policy Council (TPC) - but not for statistics. We utilize statistics from several Federal agencies: the Bureau of the Census, the Bureau of Labour Statistics and the International Trade Administration (Dept. of Commerce).

82
Module 2: General statistical infrastructure and national TSA developments
AU
S (
*)
AU
T
CA
N (
*)
CZ
E
CH
L
CO
L
DN
K
EC
U
EG
Y
FIN
FR
A
IDN
IRL
ISR
KA
Z
LV
A
LT
U
MA
R
NL
D
NZ
L
PE
R
PH
L
PO
L
KS
A
ES
P
SW
E
CH
E
US
A
2.1 Classifications of products andactivities:
Are the detailed classifications used inthe sources of information for your TSAconsistent:
a. with each other? e.g.
• for accommodation services Y Y Y Y Y Y Y N Y Y Y Y Y N Y Y Y Y Y
• for international transportation Y Y N Y Y Y Y N Y Y Y Y Y N Y Y Y Y Y
• for domestic transportation Y Y N Y Y Y Y N Y Y Y Y Y N Y Y Y Y Y
• for food serving services Y Y N Y Y Y Y N Y Y Y Y Y N N Y Y Y Y
• for other tourism services N Y Y Y Y Y Y N Y Y Y Y Y N N N Y Y Y
b. with the list of Tourism CharacteristicProducts (TCP)? e.g.
• for accommodation services Y Y Y Y Y Y Y Y Y Y Y Y Y N Y Y Y Y
• for international transportation Y Y Y Y Y Y Y Y Y Y Y Y Y N Y Y Y Y
• for domestic transportation Y Y Y Y Y Y Y Y Y Y Y Y Y N Y Y Y Y
• for food serving services Y Y Y Y Y Y Y Y Y Y Y Y Y N Y Y Y Y
• for other tourism services N Y Y Y Y Y Y N Y Y Y Y Y N N Y Y Y
Comments: (¶) (¶) (¶) (¶) (¶) (¶) (¶) (¶) (¶) (¶) (¶)
Do you use this classification standardfor your TSA compilation?
• for accommodation services Y Y Y Y Y Y Y Y Y N Y Y Y Y Y N Y Y Y Y
• for international transportation Y Y Y Y Y Y Y Y Y N Y Y Y Y Y Y Y N Y Y
• for domestic transportation Y Y Y Y Y Y Y Y Y N Y Y Y Y Y Y Y N Y Y
• for food serving services Y Y Y Y Y Y Y Y Y N Y Y Y Y Y Y Y Y Y Y
• for other tourism services Y Y Y Y Y Y Y N Y N Y Y Y Y Y N N N Y Y
if not, what are the reasons:
– the TSA standard is too detailed ascompared to the availability of information
• for accommodation services
• for international transportation
• for domestic transportation
• for food serving services
• for other tourism services
– the TSA standard is not compatible withthe classification system prevailing in thecountry:
• for accommodation services
• for international transportation
• for domestic transportation
• for food serving services
• for other tourism services
Comments: (¶) (¶) (¶) (¶) (¶) (¶) (¶)
2.2 Measurement of Domestic tourismexpenditure
Do you conduct a national expendituresurvey for domestic tourism in yourcountry? (Domestic tourism is thetourism of resident visitors within theeconomic territory of the country ofresidence (TSA-RMF)
Y Y Y Y N N Y Y Y Y N Y Y Y N Y Y Y Y N
Do you compile your domestic tourismstatistics from a national householdexpenditure survey?
Y N Y N N Y N N Y N Y Y N N Y N Y Y N Y
Comments: (¶) (¶) (¶) (¶) (¶) (¶) (¶) (¶) (¶) (¶)
2.3 Implementation of SNA93
Is there a supply and use tableintegrated within the system of nationalaccounts in your country?
Y Y Y Y N Y Y Y Y Y Y Y Y Y Y N Y N Y
Is there a stand- alone Input-Outputtable in your country?
N Y Y Y N Y N Y Y Y Y Y N N N N Y
2.4 Measurement of the “travel” item inthe Balance of payments (followingBPM5)
We are particularly interested in themethod/s used for the estimation of the“travel” item in your country:
Pure banking reporting system N N N N N N N N N N Y N N Y N N N N
Adjusted banking reporting system Y N N N N N Y N Y Y Y N N Y Y N N
• using Credit card reports Y N N N N N Y N N Y Y Y N N Y N Y N N
• using reports by travel agencies, hotels and international carriers
Y Y N Y N N N Y N Y Y N N Y N Y N N
• using data on cross border Y Y N N N N N N Y Y N N Y Y N Y N N• other sources and adjustments Y Y N Y N N Y N Y Y N N Y Y Y Y N N
Basing reporting on expenditure surveys atborders with some adjustments
N Y Y N Y Y Y Y Y Y Y Y Y N Y
• for inbound travellers N Y Y N Y Y Y N Y Y Y Y Y Y Y N Y
• for outbound travellers N Y Y N Y N N N Y N Y Y Y N N N Y
Using mirror statistics of main partnercountries for exports
Y N N N Y N N N N N N N N N Y Y Y
Using mirror statistics of main partnercountries for imports
Y N N N Y N N N Y N N N N N Y Y
Comments: (¶) (¶) (¶) (¶) (¶) (¶)
(*) Australia and Canada answered to a different version of this module and the replies are reproduced separately as an Annex to this Module 2.
(█) No answer / (Y) Yes / (N) No / (¶) Comments
Products Homogeneity and compatibility with TSA–RMF Recommendations
Activities Compatibility with TSA-RMF Recommendations
(¶)
AUT Comments: Related “Miscellaneous tourism services”: Information hardly available!
CHL
2.1 • Products: The framework guidelines for the classification of activities carried out in the country, and which are in accordance
with the classifications of those included in the National Accounts. It is sufficiently detailed so as to allow all countries to follow it.

83
• Activities: These constitute the classification framework directly related with the classification used in the national accounts of the country. The exception is constituted by the activities of relatively less importance in the national accounts such as the majority of cultural, sports and recreational activities, which are handled in an aggregated manner and which do not permit a detailed comparison of levels and structures, in contrast to more prominent activities where such comparisons are possible, such as hotels, restaurants and transport services in general.
2.2 Comments: The study on domestic tourism was carried out just once for the TSA 2003 of the country. In the Household Budget Survey carried out by the INE during 2006-2007 SERNATUR was able to include two questions regarding travel in a recall module at the household level (not by individual household members). 2.4 Comments: SERNATUR and the Central Bank jointly finance the annual Study on Inbound and Outbound Tourism Expenditure.
COL 2.2 Comments: There is only a survey for 2002 – 2003. Since 2006, a module was incorporated to the continuous household survey.
DNK 2.1. Activities: Road passenger transport services could be separated into long-distance (such as by own car) road transport and local short distance transport, such as buses and taxis.
ECU
2.1 Products: The list of tourism specific products developed by UNWTO is sufficiently broad so that in the case of Ecuador an effort has been made to adapt (not adopt) the international methodological recommendations to the structure of the tourism activity of the country, and thus certain categories or items not produced in the country were eliminated. For example, services provided by sleeping cars, ski resorts and cable cars were eliminated, although the possibility of including them remains open for when they are actually offered. 2.2 Comments: During the period July 2002-June 2003 the international recommendations were taken as a basis and household surveys were conducted on domestic tourism, to obtain the tourism consumption expenditure of this segment. Currently, in the fourth quarter of the present year, to include a small tourism module to the employment survey is planned, which is part of the Integrated Household Survey System carried out by the country's Instituto Nacional de Estadística y Censos. 2.4 Comments: The quantification of this operation is carried out from the demand-side perspective, that is to say, travellers (consumers) who go to the place of the supplier (resident of the economy visited) to acquire the goods and services they require. The information regarding travel (inbound and outbound tourism) is obtained from the Instituto Nacional de Estadística y Censos (INEC) and the Dirección Nacional de Migración y Extranjería and is complemented by means of surveys of hotels, travel agencies and other entities that deal in package tours. For this account, a specific methodological treatment is used which makes it possible to obtain the value in dollars of the consumption of non-residents in the compiling economy and vice-versa. The basic information provides data on the number, type of visa, average expenditure and length of stay of travellers. Based on these parameters, the average daily expenditure is estimated. Also, direct information is collected from embassies and consulates of the foreign service accredited in Ecuador.
EGY
2.2 Comments: An initial survey has been conducted by the Central Agency for Public Mobilization and Statistics (CAPMAS) but its degree of accuracy is questionable. Further improvements are needed to ensure that tourism data as collected are tailored to TSA needs 2.3 • Is there a stand-alone…: But needs updating and further disaggregation. • Pure banking…:
(a) Only used to report official transfers through banking channels. (b) Travel receipts by the Central Bank are based on estimations of tourism expenditure per night (average). multiplied by the
number of overnights for departing tourists. (c) Tourism expenditure (outbound) is based exclusively on the banking recording system.
•
FIN 2.4 Comments: Telephone interview survey is being conducted on residents tourism consumption abroad (debits).
FRA
2.1 • Products: We have to use the 3 levels together. The 7 item level approximately corresponds to what we can get from visitors
surveys. The 19 items level is our working level with data from the central framework of national accounts. The CPC level can be useful to better understand what the less detailed levels contain but we do not collect information at that level.
• Activities: We generally agree with the level of detail of these 12 main headings. However, in the French National Accounts the concept of “homogeneous production unit” is used rather than that of establishment.
IRL
2.1 • Products: .We do not use any level of detail beyond the 7 main headings. • Activities
• if not, what are the reasons: We do have internal consistency but not with ISIC classifications. We do not have detail required for ISIC.
• Comments: .OK. 2.2 Comments: Our household travel survey does not detail same day visits therefore we have this deficit with respect to domestic tourism.
LVA
2.1 • Products: We suppose that this distribution is in general suitable for TSA compilation and adjustable to Latvia. We will be able
to give detailed comments on this question after starting the TSA implementation project in 2007. • Activities: Having estimated these headings we can conclude that they are useful also for our country, except paragraph 2.
Second home ownership. We will be able to comment on this question in detail after we have started the TSA implementation project in 2007.
NLD
2.1 • Products: Second home services on own account and rental services are the more difficult products. • Activities: We use the classifications but second home ownership and rental activities is an issue. 2.2 Comments: We have a separate survey for samedaytrips and domestic overnight trips.
PER 2.1 Products: We have included handicrafts for their importance in our country’s tourism consumption. 2.2 Comments: We use the survey “Perfil del Turista Nacional” of PROMPERU as a reference.
POL
2.1 • Products: Our data on the demand side are less detailed than the data on the supply.
From our point of view regarding the list included in the TSA-RFM: the items under heading 1. are too general, the collection of the demand data for subheadings 5.1, 5.2, 6.1, 6.2 is difficult; products listed under heading 7. are both marginal in value and difficult to survey.
• Activities: The list covers the main tourist activities although some of them are of marginal significance in our country (eg. transport equipment rental services or transport supporting services); at least at the present.
2.2 Comments: We use the national household expenditure survey only as a source of additional information and means of cross-checking some data if possible. 2.4 Comments: The adjusted system of banking reporting was ceased in 2003 and a system based on expenditure surveys at the borders with some adjustments from the banking system has been implemented.

84
KSA 2.2 Comments: We use Domestic and Outbound Survey (DOTS) to estimate both domestic and outbound tourism expenditure. 2.4 Comments: We use Domestic and Outbound Survey (DOTS) to estimate outbound tourism expenditure.
USA 2.1 • Products: We are missing a few pieces - like estimates of vacation home rentals, but hope to include them in the future. • Activities: We also include industries, that produce goods that visitors buy, like gasoline.

85
Annex
AU
S
CA
N
Homogeneity in the classification systems used in measuring tourism related flows of goods and services
Do you use a unique detailed classification standard in all the sources of information used for your TSAcompilation
• for accommodation services Y Y
• for international transportation Y Y
• for domestic transportation Y Y
• for food serving services Y Y
• for other tourism services Y Y
explain (¶) (¶)
What are the specific obstacles towards a unification of these classifications:
• historical situation that is not easily overcome N
• lack of coordination between entities in charge of different procedures N
• consistency required for certain procedures (i.e. modules of household surveys) with different classification principles Y
• other: explain
Compatibility with TSA recommendations
Do you use this classification standard for your TSA compilation?
• for accommodation services Y N
• for international transportation Y N
• for domestic transportation Y N
• for food serving services Y N
• for other tourism services N N
if not, what are the reasons for this situation:
– the TSA standard is too detailed as compared to the availability of information
• for accommodation services N
• for international transportation N
• for domestic transportation N
• for food serving services N
• for other tourism services N
– the TSA standard is not compatible with our classification system of reference:
• for accommodation services N
• for international transportation N
• for domestic transportation N
• for food serving services N
• for other tourism services N
Comments: (¶)
Compatibility with TSA recommendations
Do you use this classification standard for your TSA compilation?
• for accommodation services Y N
• for international transportation Y N
• for domestic transportation Y N
• for food serving services Y N
• for other tourism services N N
if not, what are the reasons for this situation:
– the TSA standard is too detailed as compared to the availability of information
• for accommodation services N
• for international transportation N
• for domestic transportation N
• for food serving services N
• for other tourism services N
– the TSA standard is not compatible with our classification system of reference:
• for accommodation services N
• for international transportation N
• for domestic transportation N
• for food serving services N
• for other tourism services N
Comments: (¶) (¶)
Y Y
Geographical coverage
• all households Y Y• only those in major cities (give criterion) N• only those in urban areas (give criterion) N
General sampling method
• 12 separate monthly samples N Y• 4 separate quarterly samples N• overlapping monthly samples N• overlapping quarterly samples N• a unique sample with various visits over the year N• a unique sample visited during a restricted period with a broad recording period N
Existence of a specific module to measure outbound/domestic tourism expenditure (¶) N• periodicity of this module
(¶) (¶)
Approximate periodicity (¶)
Reference period of the last available one (¶)
Comments:
Act
ivit
ies
2. National household expenditure survey
Do you apply a national household expenditure survey in your country?
1. Classifications of products and activities:
Pro
du
cts

86
AU
S
CA
N
Existence of a supply and use table integrated within the system of national accounts Y YExistence of a standing alone Input-Output table Y Y
Frequency of the compilation (¶)
Integral part of the national accounts compilation
Degree of detail
• Number of different products considered in the disseminated results
• Number of different activities considered in the disseminated results
• Number of different products considered at the worksheet level
• Number of different activities considered at the worksheet level Y
Existence of specific commodity balances for:
Passenger transport Y Y
• air Y Y
• water Y Y
• train Y Y
• road (buses) Y Y
• Hotels and similar collective accommodation services Y Y
• Restaurants and other food serving services Y Y
• Travel agencies and tour operators services Y Y
• Car rental services Y Y
• Recreation services Y Y
• Other tourism characteristic products Y Y
Existence of a make matrix Y Y
• For all activities including tourism characteristic activities Y N
• For only a few activities (manufacture) for which specific information exists N Y
General procedure used for its compilation
• Base year estimates based on detailed information (census, specific surveys, etc.) Y Y
• Last base year (¶)
If yearly or more frequent estimations are made, then indicate what is the main situation:
• Current period estimates based on information on the level of main variables N Y
• Current period estimates based on general indicators in volume and prices of the different products and activities
• without balancing Y N
• rebalancing these estimates Y Y
Other: explain (¶)
(¶) (¶)
YDoes your country apply the BPM5 recommendations in the compilation of its balance of Payments? N Y
Pure banking reporting system N N
• using Credit card reports N N
• using reports by travel agencies, hotels and international carriers N N
• using data on cross border transactions N N
• Other adjustment: explain N N
Using expenditure surveys at borders with some adjustments Y Y
• for inbound travellers N Y
• for outbound travellers Y Y
Using mirror statistics of main partner countries for exports N N
Using mirror statistics of main partner countries for imports N N
Other explain (¶)
(¶) (¶)
Basic statistical observation procedures specifically designed for tourism purposes (¶) (¶)Other non-specific statistical observation procedures used in the system of tourism statistics (¶) (¶)
4. Compilation of the Balance of payments following BPM5
Me
tho
d u
sed
fo
r es
tim
ati
on
of
the
"tr
ave
l it
em"
Comments:
(█) No answer / (Y) Yes / (N) No / (¶) Comments
5. Statistical procedures used for the observation of tourism
3. Implementation of SNA93
Comments:
Pa
rtic
ula
rity
of
the
exis
tin
g S
up
ply
an
d U
se t
able
s o
r s
tan
din
g a
lon
e In
pu
t-O
utp
ut
tab
le
AUS
1. Products – Comments: • Very helpful as a starting point. • Where possible, the Australian TSA aligns with the international standard. 2. National household expenditure survey • Reference period of the last available one: 1998-1999. 2003-04 due out in July 05. • Geographical coverage - all households: Excluding those in remote areas. • Periodicity of this module: Not a specific module, however output based on:
• Holidays (Australian & Overseas) • For various categories of expenditure (see below)
• Comments: The enumeration period is 12 months. A sample is selected at a point in time and participants are asked to report expenditure in a diary over a 2 week period. Different parts of the sample will record their two weeks expenditure at different times over the 12 month enumeration period. Any expenditure is then coded to various categories. Household Expenditure Survey Australian Bureau of Statistics Table 1 Commodity code 10 digit level • Holidays • Holidays-Australia (selected expenses) • Holiday air fares – Australia • Holiday rail fares – Australia • Holiday bus fares – Australia • Other holiday fares - Australia (including vehicle hire) • Holiday petrol – Australia

87
• Holiday motel/hotel charges – Australia • Holiday flat/house charges – Australia • Caravan park fees/hire of caravan – Australia • Other accommodation charges – Australia • Airfare inclusive package tours – Australia • Other package tours – Australia • Holidays-overseas (selected expenses) • Holiday air fares – overseas • Other holiday fares - overseas • Holiday motel/hotel charges - overseas • Other accommodation charges - overseas • Airfare inclusive package tours - overseas • Other package tours - overseas
3. Implementation of SNA93 - Frequency of the compilation: Yearly. 4. Compilation of the Balance of payments following BPM5
Data Model Title and Data Sources
Estimation methodology Balance of payments broad
level components 1. Travel by Foreign Residents
Model Overseas Arrivals and Departures (OAD) International Visitor Survey (IVS) Survey of Inbound Tour Operators (SITO)
This model measures expenditure in Australia by foreign resident travellers and workers, primarily using per capita data on expenditure and earnings applied to OAD data and short-term visitor arrivals. It excludes the expenditure of foreign students studying in Australia on student visas and New Zealand students: these are covered in the Foreign Students in Australia Model. To estimate the per capita expenditure data several sources are used. These primarily include IVS expenditure data (adjusted to exclude on-carriage and prepaid land component) and IVS earnings data, SITS data on on-carriage receipts and SITO data.
Services: • Transportation
(passenger services) • Travel credits
Income: Compensation of
employees debits
Survey of International Trade in Services (SITS) – transportation component Economic Activity Survey (EAS)
SITS (transport component) provides data on cruise fares and on the on-carriage receipts by resident airlines for carrying foreign travellers on domestic transports legs beyond their initial arrival in Australia. SITO provides (until 1995-96) estimates of the earnings by Australian businesses from the prepaid land component of package tours into Australia. From 1996-97 these estimates are derived from the EAS.
Visiting Military Personnel (VMP) (Department of Defence advice)
Other minor components of the model are non-resident transport crews’ expenditure in Australia, foreign military crews’ expenditure in Australia, and an adjustment to passenger fare earnings. The first is obtained from data reported in the SITS (transportation component). The second comes from the VMP advice which provides quarterly data on the numbers of foreign service personnel visiting Australia, used together with per capita expenditure data supplied irregularly by the United State Navy. The last component is compiled from IVS (see paragraph 5.31 for further detail). Until each of the above sources is available, the individual affected components are extrapolated.
2. Travel by Australian Residents Model
Survey of International Trade in Services (SITS) – travel component Survey of Returned Australian Travellers (SORAT) Overseas Arrivals and Departures
SITS provides a quarterly measure of the expenditure abroad by Australian travellers using credit cards, travellers’ cheques, cruise fares and other prepaid packages. SITS is supplemented with data (every four years) for SORAT on the cash taken abroad by Australian travellers. SORAT is also used to validate the SITS methodology and ensure SITS coverage has been maintained. OAD data are applied to SORAT data by purpose of travel, and are also used for monthly interpolation and extrapolation of quarterly SITS information.
Services: Travel credits
Income: Compensation of
employees credits
3. Foreign Students in Australia Model
Foreign Student Statistics (FSS) (DETYA) Survey of International Students (SIS) Consumer Price Index (CPI)
FSS provide numbers of foreign students in Australia in any calendar year and indicative per capita course fees per student registration. These estimates are combined, after allowing for those short courses that span calendar years, to calculate total fees paid. The model does not cover foreign students (apart from New Zealand citizens) who are not on education visas; foreign students in Australia for less than three months are not required to take out an education visa. SIS provides weekly per capita data on expenditure by foreign visaed students on other goods and services (by course type) and earnings. Weekly data are converted to annual using assumptions on period of year when students stay in Australia. Per capita annual data and FSS student numbers are used to derive expenditure on other goods and services. SIS data are interpolated between survey years and extrapolated from most recent survey with reference to CPI.
Services: Travel credits Income: Compensation of
employees debits
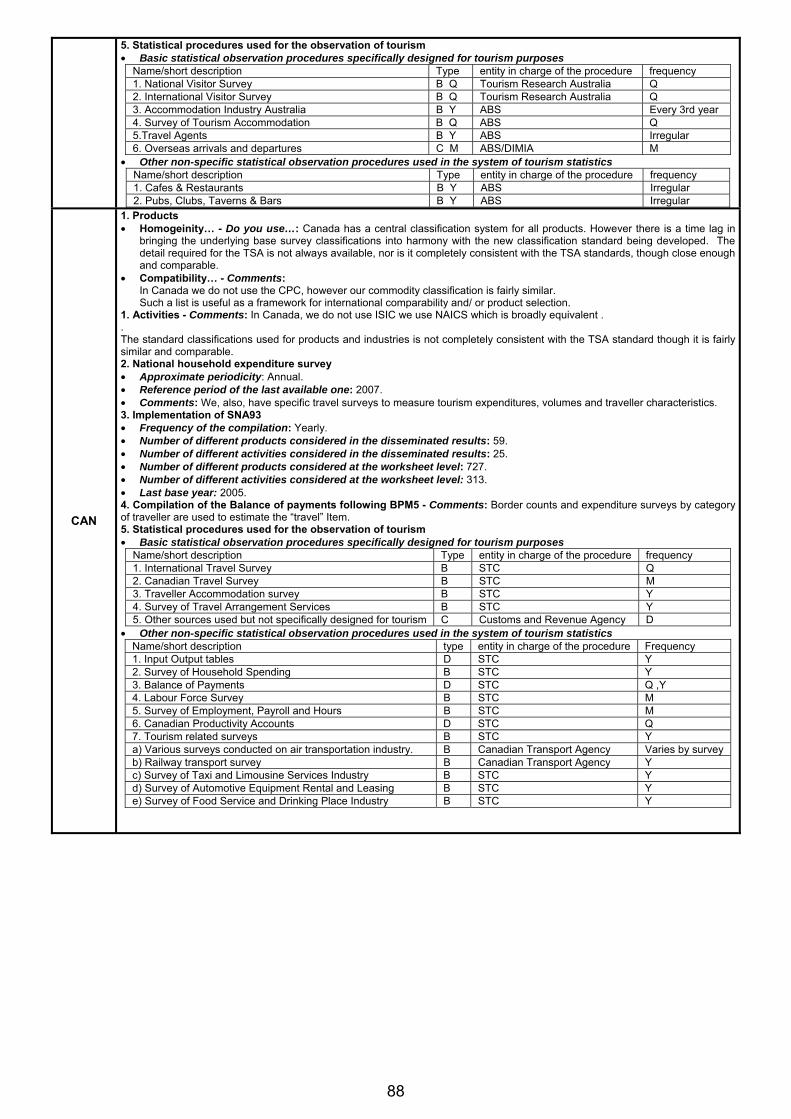
88
5. Statistical procedures used for the observation of tourism • Basic statistical observation procedures specifically designed for tourism purposes
Name/short description Type entity in charge of the procedure frequency 1. National Visitor Survey B Q Tourism Research Australia Q 2. International Visitor Survey B Q Tourism Research Australia Q 3. Accommodation Industry Australia B Y ABS Every 3rd year 4. Survey of Tourism Accommodation B Q ABS Q 5.Travel Agents B Y ABS Irregular 6. Overseas arrivals and departures C M ABS/DIMIA M
• Other non-specific statistical observation procedures used in the system of tourism statistics Name/short description Type entity in charge of the procedure frequency 1. Cafes & Restaurants B Y ABS Irregular 2. Pubs, Clubs, Taverns & Bars B Y ABS Irregular
CAN
1. Products • Homogeinity… - Do you use…: Canada has a central classification system for all products. However there is a time lag in
bringing the underlying base survey classifications into harmony with the new classification standard being developed. The detail required for the TSA is not always available, nor is it completely consistent with the TSA standards, though close enough and comparable.
• Compatibility… - Comments: In Canada we do not use the CPC, however our commodity classification is fairly similar. Such a list is useful as a framework for international comparability and/ or product selection.
1. Activities - Comments: In Canada, we do not use ISIC we use NAICS which is broadly equivalent . . The standard classifications used for products and industries is not completely consistent with the TSA standard though it is fairly similar and comparable. 2. National household expenditure survey • Approximate periodicity: Annual. • Reference period of the last available one: 2007. • Comments: We, also, have specific travel surveys to measure tourism expenditures, volumes and traveller characteristics. 3. Implementation of SNA93 • Frequency of the compilation: Yearly. • Number of different products considered in the disseminated results: 59. • Number of different activities considered in the disseminated results: 25. • Number of different products considered at the worksheet level: 727. • Number of different activities considered at the worksheet level: 313. • Last base year: 2005. 4. Compilation of the Balance of payments following BPM5 - Comments: Border counts and expenditure surveys by category of traveller are used to estimate the “travel” Item. 5. Statistical procedures used for the observation of tourism • Basic statistical observation procedures specifically designed for tourism purposes
Name/short description Type entity in charge of the procedure frequency 1. International Travel Survey B STC Q 2. Canadian Travel Survey B STC M 3. Traveller Accommodation survey B STC Y 4. Survey of Travel Arrangement Services B STC Y 5. Other sources used but not specifically designed for tourism C Customs and Revenue Agency D
• Other non-specific statistical observation procedures used in the system of tourism statistics Name/short description type entity in charge of the procedure Frequency 1. Input Output tables D STC Y 2. Survey of Household Spending B STC Y 3. Balance of Payments D STC Q ,Y 4. Labour Force Survey B STC M 5. Survey of Employment, Payroll and Hours B STC M 6. Canadian Productivity Accounts D STC Q 7. Tourism related surveys B STC Y a) Various surveys conducted on air transportation industry. B Canadian Transport Agency Varies by survey b) Railway transport survey B Canadian Transport Agency Y c) Survey of Taxi and Limousine Services Industry B STC Y d) Survey of Automotive Equipment Rental and Leasing B STC Y e) Survey of Food Service and Drinking Place Industry B STC Y

89
Module 3: Conceptual issues
AU
S (
*)
AU
T
CA
N (
*)
CZ
E
CH
L
CO
L
DN
K
EC
U
EG
Y
FIN
FR
A
IDN
IRL
ISR
KA
Z
LV
A
LT
U
MA
R
NL
D
NZ
L
PE
R
PH
L
PO
L
KS
A
ES
P
SW
E
CH
E
US
A
3.1 The definition of visitors
3.1.1 How is the length of stay (actual orexpected) determined in practice?
A specific question is asked on thequestionnaire:
- at departure on date of entry for inbound,
• For domestic tourism N N N N N N N N N Y Y N N
• For outbound tourism N N N Y N Y Y N N Y N N
• For inbound tourism N Y N Y Y Y Y Y Y N Y Y Y Y Y N
- at arrival on date of departure foroutbound
• For domestic tourism N N N N N N N N N Y Y N N
• For outbound tourism N Y Y Y N Y Y N N Y Y Y Y Y N
• For inbound tourism N N N N Y N Y Y N N Y N N
A specific question is asked on E/D cards(international tourism) regarding expectedlength of stay abroad: or in the country
• For outbound tourism N Y Y N N N N N N N N N Y N N N Y
• For inbound tourism N Y Y N N N N N N N N N N Y N N N Y
Exit cards are matched with entry cards
• For outbound tourism N N N N N N Y N Y N N N Y N N N
• For inbound tourism N N N N N N N Y N Y N N N Y N N N
The case of long term foreign residents(other than students) or nationals abroad:
- No identification is made: they are treatedaccording to place of residence
• For domestic tourism Y Y Y N N Y Y N N N N Y Y
• For outbound tourism Y N N N Y Y N N N Y Y Y
• For inbound tourism Y N N N N Y Y N N N Y Y
- No identification is made: they are treatedaccording to nationality
• For domestic tourism N N N N Y N Y N N N Y N
• For outbound tourism N Y Y N N Y N Y N N N Y Y N
• For inbound tourism N Y N Y N N Y N Y N N N Y Y N
- These cases are treated separatelyaccording to the type of visa they hold
• For domestic tourism N N N Y N N N N N
• For outbound tourism N N N N N Y N N N N N
• For inbound tourism N Y N N N N Y N N N N Y N
The case of long term foreign students ornational students abroad:
- No identification is made
• For domestic tourism Y N N N Y N Y N N Y Y N Y
• For outbound tourism Y N N N N Y N Y N N Y N Y N Y
• For inbound tourism Y Y N N N N Y N Y N N Y N Y N Y
- Their case is treated separately accordingto the type of visa they hold
• For domestic tourism N N N Y N N N N N N
• For outbound tourism N Y Y N N Y N N N N Y N Y
• For inbound tourism N N N Y N N Y N N N N Y N Y
Comments: (¶) (¶) (¶) (¶) (¶) (¶) (¶) (¶) (¶) (¶) (¶) (¶) (¶) (¶) (¶) (¶)

90
AU
S (
*)
AU
T
CA
N (
*)
CZ
E
CH
L
CO
L
DN
K
EC
U
EG
Y
FIN
FR
A
ID
N
IR
L
IS
R
KA
Z
LV
A
LT
U
MA
R
NL
D
NZ
L
PE
R
PH
L
PO
L
KS
A
ES
P
SW
E
CH
E
US
A
3.1.2 How is the fact of leaving one’s usualenvironment established in practice?
Question is left to the judgment of person completing the questionnaire
• in the case of domestic tourism Y N Y Y N N Y Y Y Y N Y N N Y N Y
• in the case of outbound tourism Y Y N N N Y N N N N Y Y N Y
• in the case of inbound tourism Y Y Y N N N Y N N N N Y Y N
Minimum distance travelled
• in the case of domestic tourism N Y N N N Y Y N N N N N N N Y Y Y
• in the case of outbound tourism N N N N N Y N N N N N N N Y
• in the case of inbound tourism N N N N N N Y N N N N N N N
The crossing of an administrative border
• in the case of domestic tourism Y N N Y N Y N N Y Y N N N
• in the case of outbound tourism Y Y N Y Y Y N Y Y Y N Y Y Y
• in the case of inbound tourism Y Y N N Y Y ? Y N Y Y Y N Y Y Y Y
Frequency
• in the case of domestic tourism Y Y N N N Y Y Y Y N N Y N N N Y
• in the case of outbound tourism Y N N Y N Y N N Y N N Y Y
• in the case of inbound tourism N N N N Y N Y N N Y N N Y
Are frequent crossings of these borders for dailyactivities considered as tourism?
• in the case of domestic tourism N N N N N N Y N Y N N N N N N
• in the case of outbound tourism N N N N N N Y N N N N N N Y
• in the case of inbound tourism N N N N N Y N Y N N N N N N Y Y
Could you please give your definition of:
• Administrative border (¶)
• Frequency (¶)
• Minimum distance (¶)
Comments: (¶) (¶) (¶) (¶) (¶) (¶) (¶)
3.1.3 How is the fact of not being remuneratedfrom within the country (place) visitedestablished in practice?
Do you exclude or attempt to exclude those whoare remunerated from the country visited?
• in the case of domestic tourism Y Y Y N Y N Y N Y N Y N N Y Y Y N Y Y N
• in the case of outbound tourism Y Y Y Y N Y N Y N Y N N Y Y Y N Y N
• in the case of inbound tourism Y Y Y N Y N Y N Y N Y N N Y Y Y Y Y N
Comments: (¶) (¶) (¶) (¶) (¶) (¶) (¶) (¶) (¶) (¶) (¶) (¶)
3.1.4 Identifying particular subsets of visitors
Do you include the following in the definition ofvisitors in your TSA?
(¶)
Foreign student for an academic year Y N N Y Y Y N Y N Y Y N Y N Y N Y Y Y N
Accompanying family of such a student Y Y N Y Y Y N Y N Y Y N Y N N N Y Y Y
Foreign student for more than an academic year N N N N N N N N N Y N Y N Y N N Y Y N
Accompanying family of such a student N Y N Y N N N N N Y N Y N N N N Y Y
Foreign student financed by his employer Y N N Y Y Y N Y N Y N Y N Y N N Y Y N
Accompanying family of such a student Y Y N Y Y Y N Y N Y N Y N N N N Y Y
Accountant (short term mission) Y N N Y Y Y N Y Y Y Y N Y Y N Y Y Y Y
IT specialist (short term mission) Y N N Y Y Y N Y Y Y Y N Y Y N Y Y Y Y
Fruit picker (seasonal worker) N N N Y N Y N Y Y Y N N N N N Y N Y N
Person coming for medical treatment Y Y Y N Y Y N Y Y Y Y N Y N Y Y Y Y Y N
Accompanying family of such a person Y Y N Y Y Y N Y Y Y Y N Y N N Y Y Y Y
Person in transit N N N N N N N N Y Y N N Y Y Y Y N Y Y N
Person coming for a short term, working with aninternational Non Governmental Organization
Y ? N Y Y Y Y Y Y Y N Y Y N Y Y Y N
Person coming for scientific research Y ? N Y Y Y N Y Y Y Y N Y Y N N Y Y N
Crew on an air carrier Y N N N N N N Y Y N N N Y N Y N N N Y
Crew on a land carrier or lorry driver Y N N Y N N N Y Y N N N Y N Y N Y N Y
Person coming to stay in his/her second home Y Y N Y N Y N Y Y Y Y N Y Y N Y Y Y Y
3.2 The treatment of transit visitors
3.2.1 Are transit visitors identified in yourcountry?
in flows of inbound visitors N N N Y N Y N N N N Y Y Y Y Y N Y Y N
in the values of the TSA concerning
• inbound tourism consumption N N N N N Y N N N N Y Y Y Y Y N Y Y N
• outbound tourism consumption N N N N N Y N N N N Y N N N Y N N Y N
• domestic tourism consumption N N N N N N N N N Y N N N Y N N Y N
Comments: (¶) (¶) (¶) (¶) (¶) (¶)
3.3 The purpose of the trip
3.3.1 Classification of the purpose of the trip
Do you agree with the categories of visitorspresently used in REC93 and TSA?
Y Y Y Y Y Y Y Y Y Y Y Y Y Y Y Y Y ?
If not, what modifications do you suggest? (¶) (¶) (¶) (¶)
What classification of purpose of the trip is usedin your country’s basic tourism surveys? (Pleaseattach a list with detailed content) (¶)
(*) Australia and Canada answered to a different version of this module and the replies are reproduced separately as an Annex to this Module 3.
(█) No answer / (Y) Yes / (N) No / (¶) Comments
AUT
3.1.1 Comments: Average length of stay is measured by dividing nights spent through arrivals; data on arrivals and nights spent are provided by accommodation statistics! 3.1.2 • Administrative border: Borders of municipalities/communes (about 2 400 in Austria). • Frequency: Twice a month.
CHL
3.1.1 Comments: In the inbound tourism survey the following question is asked: How many days did you stay in Chile? In the survey on outbound tourism the following question is asked: How many days did you stay abroad? In the survey on domestic tourism respondents were asked for their average stay for short, long and business trips they took. In the case of foreign residents who live in Chile, when they travel abroad, the International Police counts them as “Outgoing residents"”. In this case, (outbound tourism) SERNATUR estimates this population based on the sample and adds it to “Outgoing Chileans”. In the case of Chileans residing abroad, when they travel to Chile, they generally do so with a Chilean passport and the International Police counts them as “Incoming Chileans”. For inbound tourism, SERNATUR estimates this population based on the sample and adds it to incoming foreign tourists figure provided by the International Police. 3.1.2 • Administrative border: Geographic boundaries of the country. • Minimum distance: For domestic tourism, the usual environment of a person is considered to be the place of residence,
place of work or study, plus a distance of 30 km from these places, and a frequency of more than one trip a week. • Comments: This definition is difficult to apply when carrying out measurements of domestic tourism. 3.1.3 Comments: The household survey (domestic tourism) includes questions regarding the purpose of the trip. If the trip or trips were for business (remuneration at the destination) they are not included as tourism.. Surveys carried out with foreign visitors (inbound tourism) or with visitors resident in Chile upon arrival from a trip (outbound

91
tourism) include a question regarding this. Surveys of travellers who were remunerated in the country visited constitute data that is processed and submitted to the Central Bank for Balance of Payments purposes. For tourism statistics, this information is excluded. 3.1.4
The number of visitors considered for inbound and outbound tourism is based on the information submitted by the Jefatura Nacional de Extranjería y Policía Internacional (Foreign Office and International Police Service). Therefore:
• Foreign student for an academic year, Foreign student for more than an academic year and Foreign student financed by his employer: Foreign students who come to Chile for less than a year or more than a year or financed by his employer, and entering with a student visa, are not considered visitors.
• Accountant (short term mission), IT specialist (short term mission), Fruit picker (seasonal worker), Person coming for a short period of time, working with an international Non Governmental Organization and Person coming for scientific research: Professionals who come to Chile on short missions, or working with an NGO, or for scientific research, and who entered with a working visa or subject to contract, are not considered visitors.
• Crew on an air carrier and Crew on a land carrier or lorry driver: Foreign crew members who enter the country working in their mode of transport enter Chile as "incoming residents". Therefore, they are not visitors.
• Person coming to stay in his/her second home: If a person who resides abroad goes to his second home in Chile for less than a year and will not be remunerated there, he/she is considered a visitor.
3.2 Comments: Visitors in transit are not identified in the statistics provided by the International Police. Therefore, it is not known whether or not visitors in transit are significant. Visitors entering through a land border crossing and exit through another land border crossing are counted by the International Police even if their destination is another country given that generally, the distances that these visitors have to travel within our country are very large. Also counted as visitors are cruise travellers who disembark at a port and return to their country through the Santiago airport on the same day. Here in Chile, some cruise ships carry out a passenger reload. The International Police does not count passengers in transit at the Santiago airport; these flows are on the rise as LAN provides connections to different destinations. 3.3.1 • If not, what modifications do you suggest? We are in agreement, but the addition of "studies" is requested. • What classification of purpose…: The travel purposes used in the survey on inbound and outbound tourism are the
following: Holidays; Visiting friends and relatives; Health; Studies; Business; Conventions and seminars; Professional reasons; Work; Other purposes. Among the alternatives is Work, since we submit this information to the Central Bank. In our measurements, we do not include this purpose.
COL 3.1.3 Comments: The survey includes a question about purpose of the trip. If the purpose is “Business and professional”, the survey requires an answer about where the visitor is remunerated: in the country of destination or in the country of origin. 3.3.1 What classification of purpose…: The categories used are those in REC93 and TSA-RMF.
DNK
3.1.1 Comments: In Denmark tourists are interviewed at hotels and other accommodation establishments, campsites, youth hostels etc. about the length of their stay. 3.2.1 Comments: Special surveys on same-day visitors catch some transit visitors (by rail or road). 3.3.1 What classification of purpose…: • What is the overall purpose of your trip in Denmark?
Pure holiday/pleasure trip Pure business/work Mixture of holiday/pleasure and business/work/training
• What is the more precise purpose of your holiday trip? Spa/health trip Other purpose of holiday
• What is the more precise purpose of your business/work trip? Seasonal/daily work Congress/conference with predominantly international participation Congress/conference with predominantly Danish participation Company meeting Fair/exhibition Course Professional study tour/training Reward/incentive trip Professional participant in sports events Other business trip (e.g. customer visit)
ECU
3.1.1 Comments: Both length of stay and country of residence are obtained from surveys, as the Arrival/Departure card does not capture this information. 3.1.2 Administrative border: Boundaries established by the Municipality for the payment of the real estate tax. 3.1.3 Comments: When conducting the interview, it is explained that tourism purposes do not include remunerated activities. 3.3.1 Comments: The classification provided in the Recommendations on Tourism Statistics is used.
EGY
3.1.2 • Administrative border: So far, the concept of usual environment is not applied. Inbound tourists are classified by nationality.
Domestic tourism is based on the questionnaire relating to all kinds of trips.. • Minimum distance: Of distance or administrative border and we are using the household survey. 3.3.1 What classification of purpose…: Recreation and leisure / Business / Health / Exhibition / Study / Same-day visit.
FIN
3.1.1 Comments: As much as possible stays of longer than 12 months are not included in tourism. 3.1.2 • Administrative border: Mainly national frontiers, in domestic tourism administrative borders are not primary criteria • Frequency: Less frequently than once a week. • Minimum distance: Approximately 30-50 kilometres, it depends on the region. • Comments: Minimum distance criteria is not very easy to apply as in Finland some regions are sparsely inhabited and even
all daily services are located far away from dwelling places. 3.1.3 Comments: In general, if the interviewee has travelled abroad or outside his usual place of stay to work for a shorter or longer period there (s)he is not considered as a tourist. 3.3.1 What classification of purpose…: List of detailed content on purpose of the trip for inbound tourism to Finland: Business trip 1. Congress or seminar with more than 25 participants
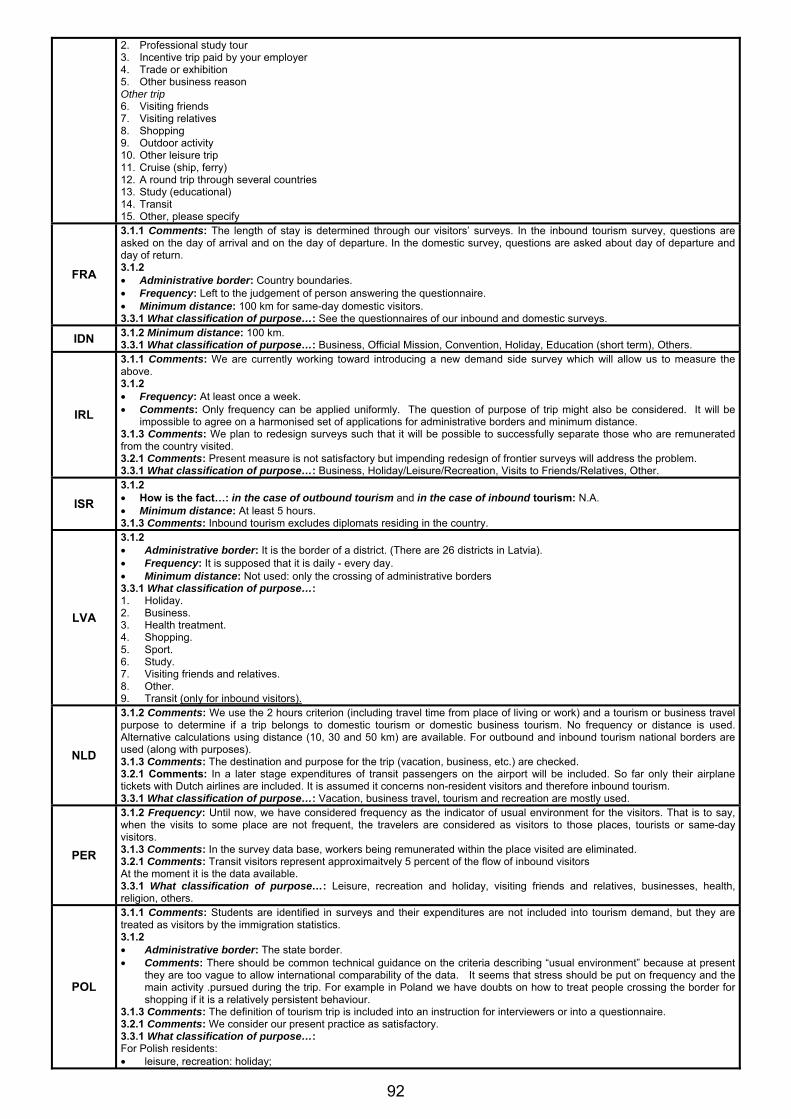
92
2. Professional study tour 3. Incentive trip paid by your employer 4. Trade or exhibition 5. Other business reason Other trip 6. Visiting friends 7. Visiting relatives 8. Shopping 9. Outdoor activity 10. Other leisure trip 11. Cruise (ship, ferry) 12. A round trip through several countries 13. Study (educational) 14. Transit 15. Other, please specify
FRA
3.1.1 Comments: The length of stay is determined through our visitors’ surveys. In the inbound tourism survey, questions are asked on the day of arrival and on the day of departure. In the domestic survey, questions are asked about day of departure and day of return. 3.1.2 • Administrative border: Country boundaries. • Frequency: Left to the judgement of person answering the questionnaire. • Minimum distance: 100 km for same-day domestic visitors. 3.3.1 What classification of purpose…: See the questionnaires of our inbound and domestic surveys.
IDN 3.1.2 Minimum distance: 100 km. 3.3.1 What classification of purpose…: Business, Official Mission, Convention, Holiday, Education (short term), Others.
IRL
3.1.1 Comments: We are currently working toward introducing a new demand side survey which will allow us to measure the above. 3.1.2 • Frequency: At least once a week. • Comments: Only frequency can be applied uniformly. The question of purpose of trip might also be considered. It will be
impossible to agree on a harmonised set of applications for administrative borders and minimum distance. 3.1.3 Comments: We plan to redesign surveys such that it will be possible to successfully separate those who are remunerated from the country visited. 3.2.1 Comments: Present measure is not satisfactory but impending redesign of frontier surveys will address the problem. 3.3.1 What classification of purpose…: Business, Holiday/Leisure/Recreation, Visits to Friends/Relatives, Other.
ISR
3.1.2 • How is the fact…: in the case of outbound tourism and in the case of inbound tourism: N.A. • Minimum distance: At least 5 hours. 3.1.3 Comments: Inbound tourism excludes diplomats residing in the country.
LVA
3.1.2 • Administrative border: It is the border of a district. (There are 26 districts in Latvia). • Frequency: It is supposed that it is daily - every day. • Minimum distance: Not used: only the crossing of administrative borders 3.3.1 What classification of purpose…: 1. Holiday. 2. Business. 3. Health treatment. 4. Shopping. 5. Sport. 6. Study. 7. Visiting friends and relatives. 8. Other. 9. Transit (only for inbound visitors).
NLD
3.1.2 Comments: We use the 2 hours criterion (including travel time from place of living or work) and a tourism or business travel purpose to determine if a trip belongs to domestic tourism or domestic business tourism. No frequency or distance is used. Alternative calculations using distance (10, 30 and 50 km) are available. For outbound and inbound tourism national borders are used (along with purposes). 3.1.3 Comments: The destination and purpose for the trip (vacation, business, etc.) are checked. 3.2.1 Comments: In a later stage expenditures of transit passengers on the airport will be included. So far only their airplane tickets with Dutch airlines are included. It is assumed it concerns non-resident visitors and therefore inbound tourism. 3.3.1 What classification of purpose…: Vacation, business travel, tourism and recreation are mostly used.
PER
3.1.2 Frequency: Until now, we have considered frequency as the indicator of usual environment for the visitors. That is to say, when the visits to some place are not frequent, the travelers are considered as visitors to those places, tourists or same-day visitors. 3.1.3 Comments: In the survey data base, workers being remunerated within the place visited are eliminated. 3.2.1 Comments: Transit visitors represent approximaitvely 5 percent of the flow of inbound visitors At the moment it is the data available. 3.3.1 What classification of purpose…: Leisure, recreation and holiday, visiting friends and relatives, businesses, health, religion, others.
POL
3.1.1 Comments: Students are identified in surveys and their expenditures are not included into tourism demand, but they are treated as visitors by the immigration statistics. 3.1.2 • Administrative border: The state border. • Comments: There should be common technical guidance on the criteria describing “usual environment” because at present
they are too vague to allow international comparability of the data. It seems that stress should be put on frequency and the main activity .pursued during the trip. For example in Poland we have doubts on how to treat people crossing the border for shopping if it is a relatively persistent behaviour.
3.1.3 Comments: The definition of tourism trip is included into an instruction for interviewers or into a questionnaire. 3.2.1 Comments: We consider our present practice as satisfactory. 3.3.1 What classification of purpose…: For Polish residents: • leisure, recreation: holiday;

93
• sightseeing; • sports tourism; • VFR; • training and educational activities; • business matters; • health; • religion; • “green school”; • shopping; • other. For non-residents: • business and professional; • tourism and recreation; • VFR; • transit; • religion; • shopping; • seasonal employment; • health; • privately arranged courses and other educational activities; • other The survey of non-residents covers possibly the full range of travel purposes to Poland, but some are excluded from tourism trips.. Although the enclosed lists are more detailed than proposed standard, the data can be easily converted into the format proposed by TSA-RMF. For the presentation of The Polish TSA tables, they are further combined into two groups: business and non-business travel.
KSA
3.1.1 Comments: We use Domestic and Outbound Survey (DOTS) to estimate the length of stay of both domestic and outbound visitors. 3.1.2 • Administrative border: All international border (airports, land ports, seaports). • Frequency: Monthly. • Minimum distance: No minimum for inbound and outbound visitors, and 80 km for domestic visitors. 3.1.3 Comments: By excluding the visitors invited and sponsored by government to perform Hajj. Even foreign business visitors who are remunerated from within the Kingdom are excluded. 3.3.1 What classification of purpose…: As Recommended by REC 93.
CHE
3.1.1 Comments: Household surveys inquire about the length of travel for domestic and outbound tourism, including day of departure and arrival back home. Data on Swiss long-term residents abroad are not included in tourism statistics so far, the number could probably be guessed by enquiring about Swiss nationals registered with Swiss embassies abroad. Foreign residents in Switzerland are not treated in a uniform way. Students and hospital patients are considered separately, foreign residents working for longer than 4 months in Switzerland are in any case considered as resident (equal to nationals). Foreign tourists staying in hotels and other lodging services for tourism purpose in Switzerland are considered as tourists notwithstanding how long they stay in Switzerland (maximum length of stay regulations may apply though), as the Swiss statistics on stay of foreign guests is mainly based on a hotel-survey-based accommodation statistics. 3.1.2 • Administrative border: National borders. • Minimum time: 4 hours. • Comments: Time could be a useful criteria as well. 3.1.3 Comments: In the TSA 1998 it is probably based on the results of the household survey (no guarantee), which asked about 3.3.1 What classification of purpose…: Leisure and business travel separately. Inbound: Holiday, visiting friends and relatives, education, medical treatment Outbound: Holiday, visiting friends and relatives, medical treatment, religion/pilgrimage, business, accompanying somebody on a business trip, other.
USA
3.1.2 • Administrative border: (Outbound / Inbound) Leaving or entering the U.S.. • Minimum distance: (Domestic) Sometimes 75 miles / sometimes 50 miles (depends on the survey). • Comments: It is the best we can do at present and we think it reasonably homogeneous. 3.3.1 if not, what modifications do you suggest? and What classification of purpose…: We use 9 categories (for inbound / outbound only – not domestic) your 6, plus: 1. Convention / Conference / Trade show. 2. Government affairs / Military. 3. Study, teaching.

94
Annex
AU
S
CA
N
A specific question is asked in the questionnaire at departure on date of entry for inbound/at arrival on date of departure foroutbound
• in the case of domestic tourism N
• in the case of outbound tourism Y
• in the case of inbound tourism Y
stay abroad/in the country
• in the case of outbound tourism Y
• in the case of inbound tourism Y
Exit cards are matched with entry cards
• in the case of outbound tourism N
• in the case of inbound tourism N
Case of long term foreign residents (non students) or nationals abroad
No special case is made: treated according to place of residence
• in the case of domestic tourism N
• in the case of outbound tourism N
• in the case of inbound tourism N
No special case is made: treated according to nationality
• in the case of domestic tourism N
• in the case of outbound tourism (¶)
• in the case of inbound tourism (¶)
Their case is treated separately according to the type of visa they hold
• in the case of domestic tourism N
• in the case of outbound tourism (¶)
• in the case of inbound tourism (¶)
Case of long term foreign students or national students abroad
• in the case of domestic tourism
• in the case of outbound tourism
• in the case of inbound tourism
Their case is treated separately according to the type of visa they hold
• in the case of domestic tourism
• in the case of outbound tourism
• in the case of inbound tourism
Other explain (¶)
(¶)
(█) No answer / (Y) Yes / (N) No / (¶) Comments
(¶)
(¶)
1.1.
Ho
w i
s th
e le
ng
th o
f st
ay
(act
ual
or
exp
ect
ed)
det
erm
ined
in
pra
ctic
e?
Comments:
1. The definition of visitors
CAN
1.1 • Case of long term foreign residents (non students) or nationals abroad:
• in the case of domestic tourism: N/A. • in the case of outbound tourism and in the case of inbound tourism: Out of Scope.
• Case of long term foreign students or national students abroad: Out of Scope. • Comments: Comments: No special case is made for any of these categories-long-term foreign residents, nationals abroad, or
long-term foreign students or national students abroad. All their expenditures are ignored. 1.2 • The crossing of an administrative border - Which type of borders:
• in the case of outbound tourism: International. • in the case of inbound tourism: borders.
• Second homes are considered: Currently, second homes are not part of TSA. Travel expenditures to and from second homes which respect distance and national border criteria are included but we do not include expenditures associated with accommodation.
• Comments: Crossing the administrative or international border frequently is not treated as leaving one’s usual environment, irrespective of distance travelled. We have no other suggestions.
1.3 - Comments: How relevant in terms of tourism analysis do you find treating differently high skilled individuals (consultants, performers, lecturers, specialists…) remunerated from within the country visited though not employees of resident businesses (theoretically, according to REC93, they are not visitors) from those remunerated from within their country of origin? (It is not treated differently) In principle, it would be useful for tourism analysis to be able to distinguish those highly skilled individuals remunerated from the place visited from those remunerated from within their country of origin, however in practice, it may be very difficult to collect the necessary information. 3. - Comments: We use purpose of visit to do a business /personal split for the TSA. In the Canadian International Travel survey, the following purposes can be identified These have been independently developed. • Business
• Meetings • Conventions, conference, trade show, seminar • Other work
• Pleasure • Holiday, vacation • Visit friends or relatives • Visit second home, cottage, condo • Attend events, attractions
• Other: • Personal (medical, wedding, etc.) • In transit to/from other countries • Educational study • Shopping

95
Module 4: Measurement issues
AU
S
AU
T
CA
N
CZ
E
CH
L
CO
L
DN
K
EC
U
EG
Y
FIN
FR
A
IDN
IRL
ISR
KA
Z
LV
A
LT
U
MA
R
NL
D
NZ
L
PE
R
PH
L
PO
L
KS
A
ES
P
SW
E
CH
E
US
A
Y Y Y Y Y Y N Y Y N Y Y Y Y Y Y Y
Y N Y Y Y N Y N N Y N N Y Y N Y Y Y
Comments: (¶) (¶) (¶) (¶) (¶) (¶) (¶) (¶) (¶)
Y (¶) N N N Y N Y Y Y N N Y Y Y Y N
Do you include?
- Pre-trip expenses Y N N N N Y N Y Y Y N Y Y N Y Y Y Y N
- Post trip expenses Y N N N N Y N Y N Y N N Y N Y N Y Y N
- High value items Y N N N N Y Y Y Y N Y N N Y N Y Y N
- Single purpose consumer durables Y Y N N N Y Y N Y N Y Y N Y N Y Y N
• in the case of domestic visitors N N N N N N N Y N N N N N N N N N N
• in the case of outbound visitors N N N N N N N Y N N N Y N N N N N N
• in the case of inbound visitors N N N N N N N Y N N N Y N N N N N N
• is included
• in the case of domestic visitors N Y N Y N N Y N N N N Y N N N Y N
• in the case of outbound visitors N Y N Y N N Y N N N N Y N N N Y N
• in the case of inbound visitors N Y N Y N N Y N N N N N N N Y Y N
• is included indirectly by analysis of supply by products
• in the case of domestic visitors Y N Y Y Y N Y Y N N N Y Y Y Y N
• in the case of outbound visitors Y N Y Y N Y Y N N N Y Y Y Y N
• in the case of inbound visitors Y N Y Y Y N Y Y N N N N Y Y Y N
• questions on expenditures after a trip are included
• in the case of domestic visitors N Y N N N N N Y N Y Y N N N Y N N N
• in the case of outbound visitors N Y N N N N N Y N N Y N N N Y N N N
• in the case of inbound visitors N N N N N N N Y N N Y N N N Y N N N
• all reported expenditures are a priori included in domestic, outbound or inbound tourism consumption according to destination of trip
• in the case of domestic visitors Y N N N Y Y N Y Y Y N Y N N Y
• in the case of outbound visitors Y N N N Y Y N Y Y Y N Y N N Y
• in the case of inbound visitors Y N N N Y Y N Y N Y N Y N N Y
Y Y Y Y N Y N Y N Y Y Y Y Y N N Y Y
Comments: (¶) (¶) (¶) (¶) (¶) (¶)
Y Y Y Y N Y Y Y Y Y Y N N Y Y Y Y Y Y Y
Comments: (¶) (¶) (¶) (¶) (¶) (¶)
Identification and classification of expenditure ontourism single purpose consumer durable goods
Identification and classification of expenditureafter a trip
Do you agree that consumption expendituremade by visitors after a trip should be included?
4.1 The measurement of tourism businessexpenses
Do you ask for this information on surveys?
Do you determine the venue of expenditure onitems of exceptionally high level of expenditure?
4.2 The scope of tourism final consumptionexpenditure; the identification of the venue oftourism consumption
Do you follow the guidelines of SNA93 in measuring tourism business expenses?
Do you have the data sources to follow theserecommendations?
4.3 Travel agency services and the unbundling ofpackage tours
Do you implement this recommendation?

96
AU
S
AU
T
CA
N
CZ
E
CH
L
CO
L
DN
K
EC
U
EG
Y
FIN
FR
A
IDN
IRL
ISR
KA
Z
LV
A
LT
U
MA
R
NL
D
NZ
L
PE
R
PH
L
PO
L
KS
A
ES
P
SW
E
CH
E
US
A
How important is the use of second homes indomestic tourism in your country? (¶)
Do you include an estimation of its value inyour TSA?
Y Y N Y Y Y N Y Y Y Y N N N N Y N Y N N Y N Y Y Y N
If yes: please indicate if the method of estimationis based on
• estimations made by unit in charge in NSO of estimates in housing
Y Y (¶) N Y N Y
• special enquiry for tourism purposes N N Y N N
• estimation of market accommodation of similar characteristics (when relevant)
N N N Y N
• costs of maintenance of second homes N N N N Y
• only when no market accommodations exist
N N N
• in all cases N N N
• figures corresponding to similar kind of country
N N N N
• other type of data/information used Y N N
If not: please identify the reason why noestimation is made
• not a high priority because of low occurrence N N N
• a project is underway N N N N
• high occurrence, but considered as second priority as lack of information requires setting a specific statistical method;
Y N N
• disagreement with the principle of estimation N N N
• other reasons N N
Do you have specific information concerningthe incidence of timeshare in tourismaccommodation for your country? (¶)
• from the supply side
• number of construction units added to stock
N N N N N N N N N N N N N N N N N N Y N N N
• number of units N N N N N Y N N N N N Y N N Y N N N N Y N N
• number of beds N N N N N Y N N N N N Y N N N N N N N Y N N
• values N N N N N Y N N N N N Y N N N N N N N Y N N
• from the consumption side N
• number of overnights spent in timeshare units
N N N N N N N N Y N N N N N N N N N N Y N N N
• values of current expenditure by visitors N N N N N N N N Y N N N N N N N N N N N N N
How important is timeshare in the supply oftourism accommodation in your country? (¶)
Do you know of the different forms oftimeshare ownership and their incidence inyour country:
• right-to-use ownership N N N N N N N N N N N N
• deeded interest N N N N N N N N N N N N
• membership system N N N N N N N Y N N N N
Do you treat accommodation under atimeshare contract in your accounts?
N N Y Y N Y N N N Y N
If yes, do you include it:
• within hotels and similar Y Y
• within second homes Y
Comments: (¶) (¶) (¶) (¶) (¶) (¶) (¶) (¶) (¶) (¶) (¶) (¶) (¶) (¶) (¶) (¶) (¶)
(█) No answer / (Y) Yes / (N) No / (¶) Comments
4.4 Second homes and timeshares
Tre
atm
ent
of
sec
on
d h
om
esT
reat
men
t o
f t
imes
har
e
AUS 4.4 How important is the use of second homes...: 2.8 %.
AUT 4.1 Comments: Excluded from domestic tourism consumption! 4.4 How important is the use of second homes...: 10 %.
CHL
4.1 Comments: The available information from previous accounts and/or surveys is insufficient to attain this level of detail. In general, the item referred to as “Viáticos” (Travel Expenses) is broken down into inputs consisting of accommodation, food and transport, which correspond to the intermediate consumption of the company that paid for the travel expenses of its executives or travelling salesmen, without identifying which corresponds to “business tourism”. 4.2 • Pre-trip expenses and Post-trip expenses: In the annual study on outbound tourism, expenses incurred in Chile before and
after a trip abroad are not counted. However, in the study on domestic tourism consumption "Consumo Turístico Interno" (carried out in 2004), the questionnaires did include questions about household expenses incurred before and after trips abroad, and before and after trips within the country. Thus, measurements of pre- and post-trip expenditure for outbound and domestic tourism are included in the TSA (Table 2). As for high-value items, in the surveys on inbound and outbound tourism, they could be included under the shopping item (souvenirs, handicrafts, objects, etc.), as this item includes all goods regardless of value if such goods are for the own use of the visitors and are taken back to their country of residence. There is no specific question about it. Durable goods such as cameras, and camcorders for personal use are included in visitor expenditure and are not the object of specific questions.
• Comments: We consider that pre- and post-trip consumption expenditure should be measured for both domestic tourism and outbound tourism and be accounted for in Table 2 Domestic tourism consumption, as proposed.
4.3 Comments: It is necessary to gain better knowledge of how tour packages of foreign travel agencies are constituted, especially when they include visits to various countries including Chile. Currently, we apply the structure used by the country's travel agencies to unbundle inbound tour packages. 4.4 • How important is the use of second homes...: It represents 3.4% of domestic tourism consumption. • Estimations made by unit in charge in NSO of estimates in housing: from the execution of the TSA 2003 project.
CZE 4.4 • How important is the use of second homes...: 25 %.

97
• Do you include an estimation of its value in your TSA?- other type of data/information used: Estimation made by units in charge of National Accounts in NSO.
DNK 4.1 Comments: We have two sources for domestic business expenses on hotels: national accounts and tourism surveys, but they are different with each other. We mainly use survey data for business tourism.
ECU
4.3 Comments: The statistical source used to prepare the input-output table for the product “Travel agencies and similar” (10) of the TSA is the balance of product 37.01.099 “Travel agency services and similar” of the national accounts of Ecuador. In the case of Ecuador, the information, in its current state, does not allow the unbundling of the value components of the services provided by travel agencies and those of tour packages. In fact, in the table, the production reported is the total value of sales and there is no available breakdown into commissions, retail margins, and net values of the tourism services rendered, and so, in this pilot exercise it has been assumed (hypothesis to be verified) that the production recorded in the national accounts only includes the value of commissions. As is known, the production of these services is used only by visitors, and is therefore tourism characteristic in their totality. 4.4 How important is the use of second homes…: 30 %.
EGY
4.2 Do you ask this information on surveys? Only expenses during the trip in the country are recorded. 4.3 Comments: Only when unbundling package tours. Travel agencies margins are not recorded so far. 4.4 • How important is the use of second homes...: 40 %. • How important is timeshare...: 10-15 %.
FRA 4.4 • How important is the use of second homes...: 17 %. • How important is timeshare...: Small %.
IDN 4.1 Comments: Doing survey (Passenger Exit Survey) at the airport, bus station, sea port and others. We are doing the survey when visitors are leaving Indonesia.
IRL 4.4 • How important is the use of second homes...: 7 %. • How important is timeshare...: 0 %.
ISR
4.2 – Dou you ask for this information on surveys? Only for domestic tourism. 4.4 • How important is the use of second homes...: 2 %. • How important is timeshare...: 1 %.
KAZ 4.3 Comments: Yes.
MAR 4.4 How important is the use of second homes...: 2 %.
NLD
4.1 Comments: It stays a difficult issue. 4.3 Comments: A specific survey has been conducted for unbundling the services. 4.4 • How important is timeshare...: 0 %. • Comments: There is hardly any timeshare in the Netherlands therefore timeshare is not separately treated.
NZL
4.4 • How important is the use of second homes...: 15 %. • Do you include an estimation of its value in your TSA?- other type of data/information used: We use an imputed rental
approach for second homes. The average rental value is derived from Census 2001 data, and is rated forward by price index movements. Number of dwellings also comes from the Census.
• Treatment of timeshare • number of units: Number of units / dwellings. • within hotels and similar: (Holiday homes). We use the imputed rental approach. • Comments: In the population Census, we ask a question regarding ‘holiday homes’. In theory, timeshares will be included
within this. ‘Demand’ for holiday homes is assumed to come solely from domestic recreational tourists, and the tourism ratio is set equal to 1.
PER
4.1 Comments: From the surveys of inbound tourism, we have information on the purpose of trip, and we analyze this reason: business. 4.4 • How important is timeshare...: 2 %. • Comments: There is no direct information on second homes. We have imputed the house rent for domestic tourism for
visitors who stay with relatives.
PHL 4.4 • Do you know of the different forms of timeshare….: Not yet a popular practice among local tourists. • Do you treat accommodation under…: Cannot be disaggregated.
POL
4.1 Comments: The data on business travel expenses are compiled by National Accounts Department with basic breakdown into accommodation and transportation (data on travel allowances are given separately) and surveys are used to make more detailed breakdowns. 4.2 Comments: With the deregulation of air transport and growing use of internet services the identification of the place of residence of the service providers is getting more complicated. 4.4 • How important is the use of second homes...: 7 %. • How important is timeshare...: We do not have information about timeshare but the importance of "timeshare" is very small
in our country..
SWE
4.4 • How important is the use of second homes…: 15 per cent of tourism value added. • Do you include an estimation of its value in your TSA?- other type of data/information used: national accounts unit. • Comments: The whole value of second homes from the national accounts is considered tourism consumption. Most people
own their own secondary homes.
CHE
4.1 Do you have the data sources…: Partially – separating private consumption from business expenses on business trips is notoriously difficult. 4.2 Comments: Nationals are asked about their expenditures on domestic and out-bound travel in household surveys. The expenditures of foreign tourists are determined using a supplier-based survey system. 4.4 • How important is the use of "self occupied" second homes...: 16 %. • Comments: I have no clue about time-sharing arrangements in Switzerland – therefore no answers. However, quite common
are private second homes, which are rented from private to private. They are included as a separate item in tourism statistics.
USA 4.1 Comments: We pull business expenses from our I-O tables and allocate to tourism based on Private Survey data.

98
4.2 • Dou you ask for this information on surveys? Not explicitly. • Do you agree that consumption…: Yes (in theory). • Comments: We include a allocate 4.3 Comments: We break our travel agency commissions from the services upon which they are carried (e.g. air transport, accommodations). 4.4 • How important is the use of second homes...: ? %.It is important. Both own account and rentals out to others. • How important is timeshare...: ? %. Not as important as second homes. • Comments: We are currently in the process of developing an estimate for vacation home rentals.

99
Module 5: The TSA tables and the presentation of the basic data
AU
S
AU
T
CA
N
CZ
E
CH
L
CO
L
DN
K
EC
U
EG
Y
FIN
FR
A
ID
N
IR
L
IS
R
KA
Z
LV
A
LT
U
MA
R
NL
D
NZ
L
PE
R
PH
L
PO
L
KS
A
ES
P
SW
E
CH
E
US
A
Table 1: Inbound tourism consumption byproducts and categories of visitors (Visitor finalconsumption expenditure in cash)
Do you establish a table to measure inboundtourism consumption by products and bycategories of visitors?
Y Y Y Y N Y Y N Y Y Y Y Y Y Y Y Y Y ?
If not, please explain the reasons why: (¶) N
Classification of products
• is the basic differentiation between specific and non specific products used?
N Y Y Y Y N Y Y Y Y Y Y Y Y Y N Y Y Y
• are the 2 levels of detailed classification of characteristic products used?
Y Y Y Y Y Y Y Y N Y Y Y Y Y N N Y Y
If not, indicate classification used and level of detailused: (¶)
Comments: (¶) (¶) (¶) (¶) (¶)
Table 2: Domestic tourism consumption byproducts and categories of visitors (Visitor finalconsumption expenditure in cash)Do you establish a table of domestic tourism byproducts and categories of visitors?
Y Y Y Y N N Y N Y Y Y Y Y N Y Y Y Y
If not, please indicate the reason:
• It is not possible at present to undertake statistical measurement
• it does not seem to be significant in this country
• other reason
Classification of products
• is the basic differentiation between specific and non specific products used?
N Y Y Y Y N Y Y Y Y Y Y Y Y Y N Y Y Y
• are the 2 levels of detailed classification of characteristic products used?
Y Y Y Y N Y Y Y N Y Y Y Y Y N N Y Y
If not, indicate what is the classification and levelofdetail used (¶)
Comments: (¶) (¶) (¶) (¶) (¶) (¶)
Table 3: Outbound tourism consumption byproducts and categories of visitors (Visitor finalconsumption expenditure in cash)
Do you establish a table of outbound tourism byproducts and categories of visitors?
N Y Y N N N N N Y Y Y N Y N Y N N N
If not, please indicate the reason:
• It is not possible at present to undertake statistical measurement
• it does not seem to be significant in this country
• other reason
Classification of products
• is the basic differentiation between specific and non specific products used?
Y Y N Y N N N Y Y Y Y N Y N N N
• are the 2 levels of detailed classification of characteristic products used?
Y Y N N N N Y N Y Y N Y N N N
If not, indicate what is the classification and level ofdetail used (¶)
Comments: (¶) (¶) (¶) (¶) (¶) (¶) (¶)
Table 4: Internal tourism consumption byproducts and types of tourism
Do you compile a table 4 internal consumptionby products and types of tourism?
Y Y Y N N Y Y Y Y Y Y Y Y Y Y Y
If not, please indicate the reason:
• it seems unnecessary because there is no adjustment to the estimations of tourism consumption expenditure in cash;
• other reason (¶)
Treatment of goods
• does the table follow the TSA recommendation concerning the treatment of goods? Specifically:
• separation of distribution margins Y N Y Y N N Y N Y N N Y Y N Y Y
• separation of domestically produced and imported products
Y N N Y N N N N N N Y N N Y N
Comments: (¶) (¶) (¶)
(¶)
(¶)
(¶) (¶) (¶)(¶) (*) (¶)

100
AU
S
AU
T
CA
N
CZ
E
CH
L
CO
L
DN
K
EC
U
EG
Y
FIN
FR
A
IDN
IRL
ISR
KA
Z
LV
A
LT
U
MA
R
NL
D
NZ
L
PE
R
PH
L
PO
L
KS
A
ES
P
SW
E
CH
E
US
A
Table 5: Production accounts of tourismindustries and other industries
1. Do you compile output, input and value addeddata for tourism industries/activities?
Y Y Y Y Y Y Y Y Y Y Y Y Y Y Y Y Y Y Y
2. Classification of industries/ activities Y Y Y Y Y Y Y Y Y Y Y Y Y Y Y Y Y
What is the level of classification and level of detailused? (¶)
(¶) (¶)
3. Classification of output by product N Y Y Y Y Y Y Y Y Y Y Y Y N Y Y Y
What is the level of classification and level of detailused? (¶)
4.Classification of inputs N Y Y Y Y Y Y Y Y Y Y Y Y Y Y N N
What is the level of classification and level of detailused? (¶)
5. Components of value added by activity Y Y Y Y Y N Y Y Y Y Y Y Y Y Y
Do you identify the components as listed in the TSAofficial text?
N Y Y Y N Y N Y Y N Y Y Y Y
6. Relationship with the supply and use table (orInput-output scheme) of the same period ofnational accounts
• not related N N N N N N Y Y
• a simple reclassification of products, activities Y Y Y Y Y N Y Y Y N Y
• a different treatment of certain products and activities (packages, travel agencies), …
Y N Y Y Y Y Y Y Y Y
• other type of relationship N N N N
7. Treatment of goods
• does the table follow the TSA recommendation concerning the treatment of goods? Specifically:
• separation of distribution margins Y N Y Y Y N Y N Y N N Y Y Y N Y Y
• separation of domestically produced and imported products
Y N N Y N N N N N Y Y N N Y N
Comments: (¶) (¶) (¶) (¶) (¶) (¶) (¶) (¶) (¶) (¶) (¶) (¶) (¶)
Table 6: Domestic supply and internal tourismconsumption by products
Do you compile Table 6 as recommended in theTSA official text?
Y N Y Y N Y N N Y N N N N N Y Y N
Or, do you establish a similar type of table withthe purpose of showing how supply and tourismconsumption are reconciled?
N Y N Y N N Y Y Y N Y Y Y Y Y
Structure of the table
Do you strictly apply the TSA: RMF proposedformat?
Y Y Y N N Y Y N N Y Y N N N N Y N N
Can you describe differences between Table 6and your country’s table:
• Fewer products and activities (More aggregation)
Y N N Y Y N N Y Y Y Y Y Y N N Y
• Different classification of products and activities Y N N Y N Y N Y N Y Y Y Y
• Is non-tourism consumption as well as tourism consumption included to balance supply and use
Y Y N Y Y N Y N N Y Y N Y N Y
• A specific tourism share by activities is calculated for each product
N Y N Y N Y ? Y N Y Y N Y N Y Y
• A different price system is used (necessary only in time series, or purchasers and basic prices)?
N Y N Y N N N Y Y N N
• Insufficient or no detail of inputs by activities are available
Y N N Y N Y Y Y Y N Y N Y Y
• Different treatment of goods N N N N Y N Y Y Y Y N
• Any other differences N N N Y Y Y Y N Y N
General characteristic of the data
• It is an experimental-type of Table (high incidence of assumptions)
N Y N N Y Y N Y N N N Y
• only supply is known and non observed shares are applied to estimate consumption
Y N N Y N Y N N N N Y
• only consumption is known and non observed shares are applied to estimate supply
N N N N Y N N N N
• only part of consumption is known (inbound), and the incidence of domestic consumption is assumed
Y N N N Y N N N N
• Supply and consumption are based on separate statistical observation methods
Y Y N Y Y Y N Y Y Y Y Y Y Y
Calculation of tourism value added
Do you use this table to establish Tourism Value Added?
Y Y Y N Y N Y N Y N Y Y Y Y Y N N Y (¶)
How do you establish tourism shares?
• uniformly for all output of an activity Y N N Y N N Y Y N N
• uniformly for all products N N N N N N Y N
• separately for each cell of the supply side N Y Y Y Y N Y N Y Y N Y Y Y
• the share in value added is the same as the share in output
N Y Y Y Y N Y Y N Y Y Y
• a different or more sophisticated procedure is adopted: explain
N N N N N N
Do you have a special treatment for tourism business expenses in this calculation?
Y N N N N (¶) N N Y N N N (¶) N
Describe the procedure followed for the calculation of TVA: (¶)
Do you also calculate indirect TVA? Y N N N N N N Y N Y N Y N N N Y N N
Relationship to the system of national accounts
Do you present the relationship of this table to the Supply and Use table of your system of national accounts?
Y Y Y N Y N Y Y Y Y N Y Y N Y
Do you present the relationship to your stand alone Input-output scheme?
N N Y N N N Y Y N Y N N
Comments: (¶) (¶) (¶) (¶) (¶) (¶) (¶) (¶) (¶) (¶) (¶) (¶) (¶) (¶)
(¶)

101
AU
S
AU
T
CA
N
CZ
E
CH
L
CO
L
DN
K
EC
U
EG
Y
FIN
FR
A
IDN
IRL
ISR
KA
Z
LV
A
LT
U
MA
R
NL
D
NZ
L
PE
R
PH
L
PO
L
KS
A
ES
P
SW
E
CH
E
US
A
Table 7: employment in the tourism industries
Do you establish some type of tablesummarizing the impact of tourism onemployment?
Y Y Y Y Y Y Y Y Y Y Y Y N Y Y Y Y Y Y Y Y Y Y Y Y
Your analysis and description of employmentrelated to tourism
• is restricted to total employment in tourism industries
N Y N N Y Y Y Y N Y N N N N Y N Y Y N N N
• uses tourism shares applied:
• exclusively to tourism industries Y Y N N Y N N N Y N N Y N Y Y
• to all industries N Y Y N N N Y Y Y Y N N Y
• these tourism shares
• are similar to tourism share in value added (table 6)
Y Y Y Y N N Y Y Y Y N Y Y Y
• are different Y N N N N Y Y N N
Do you make a difference between number ofjobs and number of employed persons andsystematically process both information?
N Y N Y N N N N Y Y N N Y Y N N N Y N Y N
Do you use measurements in terms of Full TimeEquivalents?
N Y N Y Y Y N N N Y Y Y N Y Y N N N N Y Y Y N
Do you also calculate indirect impacts of tourismon employment?
Y N N N Y N Y N Y Y Y N Y Y N N N N Y N N Y
Do you provide more detailed data on tourismemployment
• by occupation N Y N N Y N N Y N Y N N N N N N Y N Y Y N N
• by gender N Y N N Y Y N Y N Y Y N N N N N N Y N Y N N
• by level of qualification N N N N Y Y N Y N Y N N N N N N N N N N N N
• by nationality N N N N N N N Y N Y N N N N Y N N N Y N N N
• by levels of remuneration N N N N N N N Y N Y N N N N N Y N N N N N N
• effect of seasonality, through sub annual measurement
N N N N Y N N Y N N N N N Y N N N N N N
• other N Y N Y N Y N N N N N N N Y N N
Comments: (¶) (¶) (¶) (¶) (¶) (¶) (¶) (¶) (¶)
Table 10: Non monetary indicators
Do you compile the indicators proposed in Table10 of the TSA Recommended Framework
• Number of trips and over-nights by types of tourism and categories of visitors
N Y Y N Y Y Y Y Y Y Y Y N Y N Y
• Inbound tourism: Number of arrivals and overnights by means of transport
N Y N N Y Y Y Y Y Y Y Y N Y N N
• Number of establishments and capacity by forms of accommodation
N Y N Y Y Y Y Y Y Y Y Y N Y N Y
• Number of establishments in tourism characteristic and tourism connected activities classified according to number of employed persons
N Y N N Y N Y Y Y N Y N N Y Y Y
Do you systematically relate tourismcomsunption with
• Number of trips N Y N Y N N N Y Y Y Y Y Y N Y N Y
• Number of overnights N Y N Y Y N Y Y Y Y Y Y Y N Y N Y
• Average expenditure by trips N Y N Y Y N Y Y Y Y Y Y Y Y Y N Y
• Average expenditure by overnights N Y N Y Y N Y Y Y Y Y Y Y Y Y N Y
• Other N N N N Y Y Y Y N N N
Do you also compute any other types of ratios? N N N Y N N Y N Y N Y Y N Y N
Do you systematically disseminate this information?
N Y N Y Y N Y Y N Y N Y Y Y N Y
Comments: (¶) (¶) (¶) (¶)
Other tables
Do you use any other tables or additional tablesnot mentioned above to present the results ofyour TSA exercise?
N Y N Y N Y Y N N N Y Y Y Y Y N
Comments: (¶) (¶) (¶) (¶)
(█) No answer / (Y) Yes / (N) No / (¶) Comments
AUS
Table 4 • Scope of “other components of internal tourism consumption”: In the Australian TSA, these components are allocated to
products. Final consumption expenditure in kind and social transfers in kind are not explicit, second homes and tourism business expenses are separately identified.
Table 4 • Sources of information on: Other components of final consumption expenditure in kind:
• special questions in surveys to visitors: Business expenses only. • estimation directly derived from national accounts: For other components.
• Treatment of goods - separation of domestically produced and imported products: However, this is published in a separate table.
Table 6 - Do you also calculate indirect TVA? - What is the procedure used?: The ABS calculates tourism value added to include the full cost of the good/service. We do not calculate the indirect effects of tourism, although in Australia another agency does that calculation. Table 7 - These tourism shares are similar to tourism share in value added (table 6) mostly though theyr are different occasionally. At times when tourism activity has declined, but the economy has been growing, the ratios have required adjustment.Other tables – Comments: Australia does not compile or publish separately tables 8 and 9.
AUT Table 5 – 2 What is the level…: 2-digit.
CAN
Table 4 - Comments: In Canada, the TSA includes only visitor final consumption in cash, transactions in kind are not included. Table 5 • Do you establish a specific table…: We do not publish this table however data for this table can be extracted from our
worksheets and the Input –Output tables. • Classification of output: We identify products as tourism and non–tourism products. The non-tourism products would
correspond to non-specific product. We use a detailed classification of products-more detailed than TSA-RMF. • Classification of activities: Same as with products, we identify activities as tourism and non –tourism activities. The non-
tourism activities would correspond to non-specific activities. Table 6 • Comments: The following descriptions are quoted from p48, Study of the Canadian Tourism Satellite Account-Comparison of
TSA-RMF and CTSA, op cit. Currently CTSA does not present its Tourism Production Accounts in this manner, but it can extract all the necessary data for

102
this Table from the Input Output Tables. 1.2 Output Output by product as recommended for Table 5 is available but not published. The data could only be shown in terms of the modified basic prices used in CSNA. Further, as explained in the discussion on classification, because it does not use ISIC or the CPC, there would be a difference in the precise definition and content of categories. For international comparability the data would have to be converted from the aggregations used to those corresponding to TSA-RMF’s lists (ISIC, SICTA and the CPC) or differences documented. To be comparable, the data would have to be converted or differences documented in the product dimension, as well. How precise a conversion it would be, would depend upon the availability of the detail and the work involved in making the adjustments. However, except where there are data gaps, the adjustments required are likely to be marginal. Some categories such as miscellaneous tourism services would be estimated only in aggregate. Goods included in CTSA definition of tourism expenditure and their distribution margins would have to be separated to correspond to the TSA-RMF Tables. 1.3 Intermediate consumption Currently CTSA does not publish intermediate consumption of tourism and non-tourism industries corresponding to the input columns of Table 5 of TSA-RMF, though the information by product would be available in the Canadian I/O tables. Again it would be a matter of extracting it and rearranging it to correspond to the CPC categories used in Table 5. (or explaining differences). 1.4 GDP and its components Currently CTSA does not display GDP by industry for Tourism and Non-Tourism industries as is done in Table 5 of TSA-RMF, but the data can be derived from CTSA Table 2. To cover the entire economy, the aggregate for Non-specific industries in TSA-RMF has also to include industries that produce goods purchased exclusively by non-visitors. This is also the case for Non-tourism industries in CTSA.
Table 7 - Comments: We are currently developing a Human Resource Module as an extension of the TSA which would provide the above detailed data. Table 10 – Comments: Selected non-monetary indicators of Table 10 are produced and disseminated. They relate to travellers rather than visitors but they serve as indicators for tourism and are produced independently of the TSA. Other tables - Comments: The following comments are quoted from the Study of the Canadian Tourism Satellite Account-Comparison of TSA-RMF and CTSA. Note that it is suggested that Table 2 of the Canadian presentation presents somewhat different but useful tourism aggregates that may be easier to produce than the RMF-TSA Table 6. All the information is calculated for CTSA and some of it can be derived directly from CTSA Table 2 but it is not published in this manner. In summary, although CTSA does not produce Tables 5 and 6, the approach to the derivation of the main data items is as recommended and the information is assembled from the I/O Tables for CTSA and could be provided, with notes describing classification and other differences from TSA-RMF. Only after assembling the data will it be possible to examine whether certain detail will need to be collapsed or withheld for reasons of confidentiality or reliability. Presenting the results CTSA presents its GDP data and the Tourism share of each Tourism industry’s GDP, attributable to Tourism demand, in Table 2, but somewhat differently from TSA-RMF Table 6. The two presentations display Tourism aggregates in analytically different ways. TSA-RMF Table 6 begins by displaying the total value added of each Tourism characteristic industry (VATI) and the share attributable to Tourism consumption (TVA). It also shows the total value added of all Tourism characteristic industries (VATI) and the share attributable to Tourism consumption (TVA). In each case, however, the figure displayed is that of VATI which, as pointed out in TSA-RMF, is likely to be an inadequate indicator of the size of Tourism in a country. [4.83]. The more meaningful figure is TVA but that has to be derived by using the share. CTSA begins by displaying the GDP attributable to Tourism consumption or demand from each Tourism (characteristic) industry and then showing the share. (Though it does not show the GDP of each Tourism industry or the total GDP of all Tourism industries, those figures can be calculated from the shares.) CTSA includes an additional row after Tourism industries for the GDP associated with the production of other Tourism goods and services that it describes as Other industries. All the rest of the economy’s GDP is displayed in an aggregation of industries derived from the I/O tables. CTSA Table 2 is reproduced below in Annex I. TSA-RMF might consider adapting this CTSA table for international adoption as an additional, simplified form of presenting the results of Table 6 that would provide useful aggregates for a quick analysis of Tourism. [The adaptation would be necessary to define the Table in terms of international classifications, for example, it would be necessary to use an aggregation of ISIC industries, or just one total to display the GDP of the rest of the economy.] What this type of presentation does is to display figures for Tourism GDP (or value added) in the context of the total economy, data of great interest to users, while at the same time displaying the shares that Tourism GDP comprises of the GDP of Tourism industries. For that reason, it would be a useful supplementary table to Table 6.
CHL
Table 4 – Comments: Table 4 was prepared in accordance with the recommendations for the TSA. Distribution margins on goods purchased have not been separated for lack of information. Table 5 • 2 What is the level…: Twelve tourism characteristic activities, two tourism connected activities and two non-specific activities. • 3 What is the level…: Production accounts have been prepared for each of the twelve characteristic activities, two tourism-
connected activities and two tourism non-specific activities. • 4 What is the level…: That allowed by existing accounting data and/or structural surveys. Once the Central Bank publishes
the MIP 2003, the level of intermediate consumption for each of the activities can be distributed using the structure of the respective activities, at least for the tourism characteristic activities.
• 6 Other type of relationship: Very related. There has been close collaboration with the national accounts team of the Central Bank of Chile and levels have been checked for all tourism-characteristic activities defined in TSA 2003.
Table 6 • General characteristic of the data: Note: Consumption is based on specific surveys. The supply is based on structural
surveys. • Calculation of tourism value added: This is the figure obtained in Table 5 for each of the activities included in the TSA. • Describe the procedure followed for the calculation of TVA: In Table 6, there is no breakdown between Intermediate
Consumption and Value Added due to problems of space on paper, which led us to use a font size for the numbers that is unreadable unless viewed in projection, but which corresponds with the figures calculated in the production accounts of Table 5. On the other hand, Table 6, although complete in the Manual on the supply side, is not complete on the consumption side, as this only refers to tourism consumption. As Table 6 does not show all the activities of the overall economy, it is not possible to carry out the compatibilization of Supply and Use.
• Comments: Note: It is complicated to complete Table 6 as proposed, due to the fact already mentioned that Table 6 as presented in the national accounts cannot be compiled, unless an Input-Output matrix is produced for the activities included in the TSA. And even then it is difficult to manage a reconciliation between intermediate consumption and final use inputs limited to just these activities. For example, attributing import fees, taxes and subsidies to products assigned to tourism use cannot be

103
done, unless the same percentage ratios as those for the totality of products are applied, in order to be consistent with the valuation between this Table and that for the entire economy. It should be taken into consideration that data with the required breakdown is unavailable, not even at the central banks or at the statistics offices that work on this subject, and it is an even more remote prospect that this data br provided with the required breakdown by other institutions. I believe that while this Table is important, it should be simplified or be treated in an overall manner.
Table 7 – Comments: Subcontracting is what is known as “outsourcing”, that is to say, when companies provide workers to other companies, such as cleaning workers, security personnel, telephone operators, among others. Payments made by a company that contracts these services is classified as part of its intermediate consumption, but is explicitly cited due to its relationship with employment in the activity. Other tables - Comments: Note: For each tourism characteristic and tourism-connected activity, a summary of its contribution to the GDP of the economy is given, and thus its impact on it.
COL
Table 5 • 2 and 3 - What is the level…: Main level of classification by activities. • 4. What is the level…: Main level of classification by product. Comments: We just have an experimental exercise for 2000 and the first 7 tables with no continuous basic statistics.
DNK
Table 3 Classification of products (If not…): In Denmark we have household survey about outbound tourism, but, the survey does not provide detailed consumption by groups or categories. Table 5 – What is the level…: • 2 As shown in your footnote 3. • 3 We can come to the level as standard by the national accounts.
ECU
Table 1 • Do you establish a table… (If not…): The table in question was compiled by product but not by category of visitor, since the
information obtained was not sufficient to carry out this differentiation. • Comments: Rows for reporting the number of arrivals and the number of overnights are not presented. • The figure for the item “Second home ownership (imputed)” is not given, since this consumption item, due to its nature, forms
part of transactions in kind, and is therefore recorded on table no. 4 , which describes all domestic consumption items. Table 2 – Comments: Rows for reporting the number of arrivals and the number of overnights are not presented. The figure for the item “Second home ownership (imputed)” is not given, since this consumption item, due to its nature, forms part of transactions in kind, and is therefore recorded on table no. 4 , which describes all domestic consumption items. Moreover, Table 2 which describes visitor final consumption expenditure in cash in the economic territory of the country, should distinguish between consumption expenditure by residents whose trips take them outside of the economic territory of the country of reference, from the expenditure carried out in the country of reference prior to departure or after having returned. For the case of Ecuador, it was not possible to estimate the level or the composition of pre- and post-trip final consumption expenditure of visitors. Table 3 Comments: Rows for reporting the number of arrivals and the number of overnights are not presented. The figure for the item “Second home ownership (imputed) )” is not given, since this consumption item, due to its nature, forms part of transactions in kind, and is therefore recorded on table no. 4 , which describes all domestic consumption items. Table 4 • Do you compile a table… (If not…) - other reason: • Comments: Table 4 includes only the estimation of the value of the services rendered by second homes on own account;
furthermore, the two additional rows where--in accordance with the international recommendations--the national and imported components of the goods are to be reported, are not presented.
Table 5 • 2 What is the level…: Table 5 presents the production accounts of the tourism industries (characteristic, connected, and non-
specific), which makes it possible to compare this production with internal tourism consumption. • 3 What is the level…: This table follows the recommendations suggested in SNA 1993: production is broken down by
products and valued as basic prices. • 4 What is the level…: Intermediate consumption (also called inputs) is broken down according to the CPC classification and
valued at purchaser's prices. • Comments: The Table 5s compiled as part of Ecuador's tourism satellite preparation exercises are presented in the following
manner: 5a corresponds to the production accounts, expressed in current and constant prices. They show a breakdown of intermediate consumption, gross production of the tourism industries and the gross value added. 5b presents a series of years of the gross value of production of the tourism industries. 5c reports series of years of intermediate consumption of the tourism industries. 5d reports the value added of tourism industries 5e reports the generation of primary income accounts.
Table 6 Comments: In the case of Ecuador, Table 6 of the TSA is presented in two types of tables: the first one reports the supply of tourism products made of gross production and imports. The first quadrant describes imports valued at basic prices; the second is the production matrix--previously analysed--while the third quadrant shows the value components of the supply, which makes it possible to express it at purchasers’ prices: taxes on production and imports, value-added taxes, taxes and implicit subsidies on foreign trade and retail margins. This table makes it possible to analyse the origin (domestic or foreign) of tourism products and their annual availability as well as the components of purchasers’ prices of each of the tourism products. The table of tourism product supply is expressed at current and constant prices. On the other hand, the tourism product use tables distinguish tourism business expenses in cash; final tourism expenditure of resident households (in cash and kind); collective tourism consumption expenditure; inbound tourism consumption expenditure; and outbound tourism consumption expenditure. All the use variables are valued as purchaser prices and at a single exchange rate, which allows immediate comparison with the items that appear in the current account of the balance of payments (in this case, travel and tourism). Also, as in the case of supply, the tourism product use tables are expressed in current and constant prices. Tables 6a (tourism product supply table) and 6b (tourism product use table) designed in Ecuador, are closely related to the supply-use tables for goods and services of the Ecuadorian national accounts, which ensures the possibility of comparing tourism with the rest of the national economy in a methodologically homogenous manner.
EGY
Table 5 1: The "Hotels and Restaurants" activity is the only activity directly derivable from the Production Accounts of the Egyptian National Accounts. Table 7 Comments: Tourism employment measurements are based on sample surveys; Indirect employment is estimated based on Input / Output tables.
FIN
Table 5 – 1, 2, 3 and 4 - What is the level..: TSA/RMF Table 6 Calculation of tourism value added: • Do you have a special treatment for tourism business…: Two numbers are estimated for tourism value added. The first
includes travel expenses paid by employers and it describes the size and importance of the tourism industry in the national economy. The second describes the value added caused by tourism in the national economy, considering the fact that travel
104
expenses paid by employers are costs to enterprises as well and they reduce the value added of different industries. The latter number illustrates better the value added attained by tourism for the whole national economy.
• Describe the procedure followed for the calculation of TVA: The value added produced by tourism is calculated in each industry by deducting the share of the intermediate consumption generated by tourism from the output generated by tourism. For the sake of simplicity, it is assumed in the calculations that in each industry the share due to tourism of intermediate consumption is equal to its share of output.
FRA
Table 1 Do you establish a table (If not…): Our survey does not provide breakdowns by products. Table 2 Comments: In our survey, domestic consumption is only broken down by functional household expenditure types and not yet by products (in the CPC sense). Table 3 Classification of products (If not…): A global evaluation is considered as sufficient. Table 5 What is the level…: • 2: Approximately the first sub headings of the list of characteristic activities. • 3: Approximately the first sub-headings (with a little more details) of characteristic products. • 4: Rough global evaluation. Table 7 Comments: We have two different approaches for analysing the impact of tourism on employment: one based on total employment in tourism industries, the other one estimates the tourism shares from a model based on “structural business statistics”.
IDN Table 5 – 2 What is the level..; Hotel, Restaurant, Recreation and Entertainment.
IRL Table 1, Table 2, Table 3 and Table 5 – Classification of products (level of…): 7 main headings level.
ISR Table 5 – 1, 2, 3 and 4 - What is the level..: 3 digits.
KAZ Table 6 – Describe the procedure followed for the calculation of TVA: For each product the tourism share was calculated by dividing internal tourism consumption to domestic supply. Using this share the total tourism output for each kind of activity was calculated and then the TVA was obtained as tourism output minus tourism intermediate consumption.
MAR
Table 6 • Describe the procedure followed for the calculation of TVA: Using a Leontieff type model (input-output analysis) • Do you also calculate indirect TVA? – Comments: Using a Leontieff type model (input-output analysis) • Do you also calculate indirect TVA? – Comments: Using a Leontieff type model (input-output analysis)
NLD
Table 2 Comments: The 2 level of detailed classification is used but not published due to confidentiality of data. Table 3 Classification of products (If not…): Data on outbound tourism only considers 1 level of detail. Table 4 Comments: The trade and transport margins and imported products are identified for the non-characteristic goods and services but not presented by type of visitor. Table 5 What is the level...: • 2 and 3: Data is published on level 1 or higher for transportation but compiled at a lower level. • 4: Intermediate consumption is not detailed. • Comments: It is related to national accounts. A reclassification of products, activities. Table 7 Comments: Indirect impacts of tourism on employment have been calculated but are not included in the publication of the TSA results. Table 10 Comments: Information on trips, stays, arrivals, types of visitors, etc. is published in separate publications and therefore not separately included in a table 10. Other tables Comments: TSA: RMF recommended tables 8 and 9 (tourism investment and tourism collective consumption) have both been compiled and are being published.
NZL
Table 4 - Treatment of goods - separation of distribution margins: Distribution/freight: Transport freight industries are excluded from the TSA. In the case where the cost of a good includes freight, we do not separate out the freight component. Thus if delivery charges are included in the cost of a good – then we cannot separate out. However, wholesale and retail margins are separated out. Table 6 • Describe the procedure followed for the calculation of TVA: Direct Tourism Value Added is calculated as follows:
• Tourism expenditure by product by type of tourist is calculated. • Production accounts by industry, and sales of tourism specific products by industry are sourced from balanced supply-use
accounts • Tourism and non-tourism expenditure on tourism specific products is balanced against total sales of these products within
the input-output framework. For each product total tourism expenditure is divided by total sales, giving tourism product ratios· Each industry’s sales of tourism specific products are multiplied by tourism product ratios to give tourism sales by product by industry. Each industry’s total tourism sales are then divided by total sales to give tourism industry ratios.·
• Tourism industry ratios are then applied to industry production accounts, producing direct tourism value added by industry.• Do you also calculate indirect TVA? - What is the procedure used?: Where balanced supply/use accounts are available,
then the TSA calculates indirect Tourism VA by using a table of ‘industry by industry total requirements’ from our latest input-output tables (dated 1996).In the case of provisional years (where there are no balanced supply-use accounts available) - Indirect TVA is calculated as a residual ie. Indirect TVA = total tourism expend – direct TVA – imports – GST.
Table 7 • Do you calculate also indirect impacts of tourism on employment? - (if yes) - How? Explain…: Indirect tourism
employment data are only available for years where balanced supply-use accounts are available from the National Accounts. Employment numbers are calculated by applying indirect tourism industry ratios (as calculated in the workings for indirect tourism GDP), to the employment by industry data.
• Do you provide more detailed data on tourism employment – Other: A breakdown of full-time and part-time employees/tourism employees / a breakdown of full-time and part-time working proprietors/tourism working proprietors.
PER
Table 5 What is the level...: • 2 and 3: Specific activities (characteristic and connected activities) and non-specific activities as recommended in TSA official
text. • 4: They are aggregated in 9 groups: agriculture, mining and steel, electricity and water, manufacture, construction, services of
commerce, transport service, services to the community, other services. Table 6 • Describe the procedure followed for the calculation of TVA: It is the sum of the added values of each tourism activity. • Comments: In this table we do not take into consideration the share of tourism industries relationship to the National Account
industries. Table 7 Comments: Using a tourism multiplier, we obtain indirect employment and total employment. Other tables Comments: We have elaborated table 9 on the collective consumption, with information available of the government consumption. At the moment they are the only data available.
PHL Table 6 - Calculation of tourism value added - Do you use this table to establish Tourism Value Added?: For the Philippine Tourism Satellite Accounts (PTSA) only VATI (Value Added of Tourism Industries) is compiled.
POL Table 1 and 2 Comments: Our system of detailed classification of products does not fully comply with the TSA-RMF list.

105
Our TSA does not cover same-day visitors although we plan to include some estimation as year 2002 is concerned. The information on the number of visitors is very difficult to obtain, especially for business travel and we consider these data as not of primary importance as compared to the data on consumption. Table 3 Comments: .We plan to estimate only the global amount of residents’ expenditure on outbound travel, more detailed presentation will need additional financial outlays. Table 5 What is the level...: • 2 and 3: Mostly 2 level classification. • 4: 1 level classification. • Comments: Is there any other particular issue that you would wish to raise?
Since 2002 the breakdown of value added will be limited to the level proposed in EUROSTAT guilines. In our TSA only trade services are considered as directly linked to tourism so we consider .inclusion of the value of the goods purchased by visitors as inflating tourism consumption and its contribution to the economy. There is also a practical problem of making distinction between imported and domestically produced goods bought by visitors.
Table 6 • Describe the procedure followed for the calculation of TVA: The observed tourism shares of consumption are applied to
the global outputs of corresponding activities. The same shares are also applied to the tourist output of non-tourism activities. • Comments: The more precise guidance on TVA and tourism GDP calculation would help international comparability of the
TSA output.
SWE
Table 4 • Do you establish a table with similar type of objective? - if no, why - Other reason: Domestic split into business and
leisure, inbound tourism consumption is a lump sum. • Sources of information on: Social transfers in kind: Not included in TSA. Table 6 - Do you have a special treatment for tourism business expenses in this calculation?: Information collected from the supply and use tables on product level in the national accounts. Describe the procedure followed for the calculation of TVA: Tourism demand measured by surveys. Figures are transformed into basic prices and the same relation as in the national accounts between output and value added per industry is used to calculate TVA.
CHE
Table 5 • 2 What is the level…: NACE 5-streller classification. • 3 What is the level…: NACE 2-streller • 4 What is the level…: None (at the moment – see comment below) • Comments: There was no Input-Output-Table used in the TSA 1998. Therefore only direct value added was measured.
Future TSA’s will be based on an Input-Output-Table, so that indirect effects can be measured also. Table 6 • Do you compile…: Except, that the TSA 1998 uses no Input-Output-Table and there are therefore no Imports in Table 6). • Fewer products and activities: heading 4 of characteristic products. • Different classification of products and activities: heading 7.
USA
Table 1 • Do you establish a table… - if not…: We estimate inbound consumption by products but not by category of visitor (We do
not have this information). • Classification of products: Yes to both questions implicitly. Table 2 - Classification of products: Yes to both questions implicitly. Table 3 – Dou you establish a table…: We breakout spending into 2 categories of visitor –leisure and business- but not products. Table 4 – Treatment of goods: We show some info on margins of domestic vs. imported. Table 5 • 2 and 3- What level…: Detailed. • 4 - What level…: Not much detail. • 6
• a simple reclassification…: Mostly • a different treatment: e.g. travel agencies treated differently.
• 7: To some degree. Table 6 • General characteristic of data: changes non observed to some are observed. • Calculation of value added: % of an industry's output that B tourism related x industry's VA. Table 10 – Comments: We don’t' compile these but (Office of Travel and Tourism Industries www.tinet.ita.doc.gov)office in the Department of Commerce does

106
Module 6: The dissemination of the TSA exercise
AU
S
AU
T
CA
N
CH
L
CO
L
CZ
E
DN
K
EC
U
EG
Y
FIN
FR
A
ID
N
IR
L
IS
R
KA
Z
LV
A
LT
U
MA
R
NL
D
NZ
L
PE
R
PH
L
PO
L
KS
A
ES
P
SW
E
CH
E
US
A
What TSA information do you disseminatepublicly?
TSA tables? Y Y Y Y Y Y Y Y Y Y Y Y Y Y Y Y Y Y
Which ones? (¶) (¶) (¶) (¶) (¶) (¶) (¶) (¶) (¶) Y
How often do you calculate your TSA
• every five years or more? N
• every 2-3 years? N
• annually? Y
Means used to disseminate your TSA exercise
• Support
• paper Y Y Y Y Y Y Y N Y N Y Y Y Y Y Y Y
• CD N N N Y Y Y N N N Y Y N Y N Y Y
• website and downloadable file N Y Y Y Y Y Y Y N Y N Y Y Y Y Y Y Y Y Y
• Freely distributed
• on the web Y Y Y Y N N Y Y Y Y Y N Y Y Y Y Y Y Y Y Y Y
• on paper or CD N N Y Y N N Y N Y N Y Y Y N Y
• Distributed on a fee basis
• on the web N N N N N N N N Y N N N N Y Y
• on paper or CD N N N Y N N N N Y N N Y Y N
• Restricted dissemination N N N N N N N N N N
• Type of document
• a specific document Y Y Y
• an issue of a current publication Y Y
• a topic within a more general publication (national accounts for instance…)
N N
Frequency of the dissemination
• Annual
• Quarterly
• Occasional
Responsability for the dissemination
• The Ministry of tourism (or equivalent) N Y N N Y N Y Y Y Y N N Y N Y N N
• The Tourism board (or equivalent) N N Y Y N N N N N N N N N Y N Y N
• The unit in charge of National Accounts Y N Y N Y N N N Y Y N Y Y Y Y
• The Central Bank N Y N N N N N N N N N N N N
• Other Y Y N N Y Y N N N N
Content
• Current data, annual or sub-annual Y Y Y Y Y N Y Y Y Y Y
• One time or time series Y Y Y Y Y Y Y Y N N Y Y
• Analysis of trends and determinants Y N Y Y N N Y N Y Y Y
• National Y Y Y Y Y Y Y Y Y Y Y Y Y Y Y
• Regional N N Y Y N N N N N N N
Level of detail
• Methodological issues Y Y Y Y Y Y Y Y Y Y N Y Y Y Y Y Y Y N Y
• Comments on the data Y Y Y Y Y Y Y Y N Y Y Y Y Y Y Y Y Y Y
• Strictly tourism data Y Y N Y Y N Y Y Y N Y Y Y N Y Y (¶)
• Relationship to National Accounts data, Balance of Payments data, etc.
Y N Y N N Y Y Y Y Y Y Y Y Y Y (¶)
• Other N N N N Y Y N N Y
Possible role of UNWTO
• Do you think UNWTO should play a role in the dissemination of TSA data and experiences at the international level?
Y Y Y Y Y Y Y Y Y Y Y Y Y Y Y Y Y Y Y Y
• Would you find a questionnaire on TSA metadata useful for such a purpose?
Y Y Y Y Y Y Y N Y Y Y Y Y N Y N
• Would you find a questionnaire on TSA results useful for such a purpose
Y Y Y Y Y Y Y Y N Y Y N Y Y N N N
• Are the existing tables a sufficient reference framework?
Y Y Y Y Y Y Y Y Y Y Y Y Y Y
• Would you prefer a system of directing users of the UNWTO website to the corresponding national websites, fostering though a basic formatting of these websites? (not sure about this piece)
N Y Y Y Y Y Y Y Y Y N Y Y Y Y Y Y Y
• A combination: explain (¶) N Y N Y N N Y
Comments: (¶) (¶) (¶) (¶) (¶) (¶) (¶) (¶) (¶) (¶)
(█) No answer / (Y) Yes / (N) No / (¶) Comments
(¶)
(¶)
AUS Possible role of UNWTO: • Do you think UNWTO…: UNWTO could play this role. • Would you prefer…: It would not be possible for the ABS website to be re-formatted.
AUT What TSA information...? - Which ones? TSA-Tables 1, 2, 4, 5, 6, 7. Responsibility for the dissemination – Other: NSO.
CHL
The TSA for the year 1996 was disseminated in a printed document. The TSA 2003, and estimates for 2004 and 2005 will be disseminated as follows: What TSA information...? - Which ones? Tables 1 to 7 and 10. How often do you calculate your TSA? No annual funding has been secured for this project. There was funding in 2005 and 2006 to compile the TSA for reference year 2003 and estimates for 2004 and 2005.
COL What TSA information...? - Which ones? Tables 1 – 7 presented to a sectorial commission. Comments: We are attempting to compile TSA annually if it is justified.
CZE Responsibility for the dissemination - Other: NSI – Tourism Statistics Section.
ECU What TSA information...? - Which ones? 1-4 Tourism Consumption; 5 Production; 6 Supply–Consumption balance 7 Employment; 10 Physical indicators
EGY What TSA information...? - Which ones? Visitors / Nights / Expenditure.
FRA What TSA information...? - Which ones? Tourism consumption. Comments: The present French tourism account, which is disseminated, does not comply with UNWTO recommendations (in particular no reconciliation between supply and demand sides).
IDN What TSA information...? - Which ones? All of TSA-Tables.
IRL What TSA information...? - Which ones? TSA-Tables 1, 2, 4, 5, 6, 7(employment only), 9 (national level only) 10. Frequency of the dissemination: Once off.
ISR What TSA information...? - Which ones? 1-6. Responsibility for the dissemination – Other: CBS.
KAZ What TSA information...? - Which ones? 1-7, 10.
NZL Level of detail – Other: Within the release, we do publish international visitor arrivals data. This table comes straight from the

107
External Migration publication from Statistics NZ. Comments: I believe it would be extremely useful to view the experiences, methodologies and results of other country’s TSAs. This will enable all compilers of national TSAs to be made aware of options to enhance their accounts, and keep up-to-date with international methodologies.
PER What TSA information...? - Which ones? The methodology, indicators brochures.
POL What TSA information...? - Which ones? All compiled tables.
ESP
Comments: We do not see any reason for a change in the UNWTO role. In our opinion its present role should be maintained, that is to say, as a platform for methodological discussions. Concerning the dissemination of the TSA data and experiences, this task is already undertaken by the institutions in charge of the compilation of the TSA by themselves, therefore at first sight it would be unnecessary that UNWTO play a role in this issue.
SWE Possible role of UNWTO - A combination: Detailed data on national websites, metadata on UNWTO website.
CHE What TSA information...? - Which ones? Tables 1-7 (classification in the TSA methodological framework).
USA Level of detail: • Strictly tourism data: Mostly. • Relationship to National Accounts data, Balance of Payments data, etc.: Somewhat.

108
Module 7: Extension of the TSA framework
AU
S
AU
T
CA
N
CZ
E
CH
L
CO
L
DN
K
EC
U
EG
Y
FIN
FR
A
ID
N
IR
L
IS
R
KA
Z
LV
A
LT
U
MA
R
NL
D
NZ
L
PE
R
PH
L
PO
L
KS
A
ES
P
SW
E
CH
E
US
A
Are you undertaking systematicmeasurement of other components oftourism demand
• Tourism gross fixed capital formation N N N N N N N N Y Y N N Y Y Y N N Y Y N Y N N N
• Collective tourism consumption N N N N N N N N N Y Y N Y Y Y N Y Y Y N Y N N N
Other types of treatments
• Allocation of consumption of multipurpose consumer durable goods
Y N N N N N N N N Y N N N N N N Y N N N N N N N
• Inclusion in a extended concept of tourism consumption, of goods produced to be sold to visitors in other countries
N N N N N N N N Y N N N N N N N N N N N N N
• Transportation services produced on own-account by households included in tourism consumption
N N N N N N N N N Y Y Y N Y N N Y N N N N N N Y
• Other N Y N N N N N N N N N N N N
Measurement of additional variables
• Impact on Government Revenues N N Y N N N Y N N N Y N Y N N N N Y N N N Y Y
• Systematic breakdown of accounts by purpose of trips
Y N N N N N N N N N N N Y N N N Y N N N N Y
• Leakages and linkages N N N N N N Y N N N N N N Y N N N N N N N
• Other: please identify (¶) Y N N N N N N N N N N
Regional accounts
• A process of regionalization at national level (top-down process)
N Y Y Y N N N Y N N N N N N N N N Y N N N N Y
• Local initiatives with national coordination (bottom-up process)
N N Y N N N N N N N N N N N N N N Y N Y
• Local, (still not totally coordinated) initiatives
N N Y N Y N N Y N N N N N N N N N N Y Y
• Other Y N Y N N N N N N N N N N N
Quarterly accounts
• Complete TSA benchmarked on annual ones, similar to annual one
N N N N N N N N N N N N N N N N N N N N Y N N
• Simplified TSA, based on indicators
• reconciled N N Y N N N N N N N N N N N N N N N N N N Y
• not reconciled N N N N N N N N N N N N N N N N N N N Y N
• Other Y N N N N N N N N N N N N N N N N
Sectoral accounts
extension of the analysis in terms ofinstitutional sectors
• Institutional sectors of interest: list N N N N N N N N N N N N N N N N N N N
• Distribution and use of income accounts
N N N N N N N N N N N N N N N N N N N N N
• Capital account N N N N N N N N N N N N N N N N N N N N N
• Financial account N N N N N N N N N N N N N N N N N N N N N
• Other N N N N N N N N N N N N N N
Tourism Balance of Payments
• Effects of tourism on the external balance of goods and services
Y N Y Y Y N Y N N Y Y Y N Y N Y N N Y N N Y Y
• Balance of labour income N N Y N N N N N Y N N N Y N N N N N N N
• Inbound and outbound leakages N N Y N N Y N N Y N Y N N Y N N Y N N N N
• External account of primary incomes and current transfers
N N N N N N N N Y N N N Y N N N N N N N
• capital account N N N N N N N N Y N N N Y N N N N N N N
• Financial account N N N N N N N N Y N N N Y N N N N N N N
• Other N N N N N N N N N N N N N N
Comments: (¶) (¶) (¶) (¶) (¶) (¶) (¶) (¶) (¶)
(█) No answer / (Y) Yes / (N) No / (¶) Comments
AUS
Measurement of additional variables - Impact on Government revenues: ABS presents tourism consumption for business/household travel (by product) for domestic visitors. Regional accounts - Other: Some states have derived their own TSA, but ABS only produces a TSA at a national level. Quarterly accounts - Other: ABS is currently working on a TGVA quarterly indicator. Results are yet to be released as it is still in the development stages. Comments: The Australian TSA reconciles with the BoP for international visitor arrivals (tourism exports).
CAN Other types of treatments - Other: • Regional Accounts; • Foreign Direct Investment;

109
• Impact of Government Expenditure • Tourism Establishments, • Human Resources Module, • Impact Models, • Quarterly National Tourism Indicators • Impact Models • Indictors of Business Financial Performance Regional accounts - Other: Local and regional impact models exist with the same definitions and structure of industries and commodities as the TSA
LVA
Comments: Short description of Latvia’s tourism After joining the EU in 2004, tourism activities have expanded rapidly. The number of border crossings from abroad is increasing every year by more than 20%. The Latvian government makes a big effort to attract foreign visitors to Latvia and also to support domestic tourism. In 2002 the Institute of Economics of the Latvian Academy of Sciences made a research on “Possibilities of introduction of national tourism satellite accounts in Latvia”. Taking into consideration the fact that Latvia would join the EU, the OECD and UN methodology was applied. Some of the tables were compiled. The tables contain the latest material that we have for now. This is the reason why we did not fill module 5 about the TSA tables and the presentation of the basic data. Now we are planning a project in this field “TSA in Latvia” that is expected to start in January 2007 and end in June 2008. Within this project, the development of a Methodological Manual for the implementation of the TSA and calculation of the TSA tables is planned.
LTU
Comments: Statistics Lithuania started implementing TSA system in the middle of this year. In May, the working group was created from following institutions: Statistics Lithuania, Bank of Lithuania, State Department of Tourism. Currently it is preparing the list of the variables and data sources which will be used for the development of theTSA system. Second, the list of products and activities for the TSA will be prepared. At the end of next year Lithuania plans to prepare the 4 tables for TSA. Statistics Lithuania collects data according the EU Tourism Directive from supply and demand sides. Data are collected of all types of collective accommodations and data of outbound and domestics tourism.
NLD Comments: No specific tourism balance of payment is constructed. A standard balance of payment is regularly published.
NZL
Measurement of additional variables - Other: Would be interested in exploring the production of productivity measures for tourism industries. Regional accounts - Other: Within Statistics NZ, a project has just started, considering the feasibility of producing regional GDP data. It will be a number of years before this could possibly be incorporated into the TSA.
PHL Are you undertaking systematic measurement - Tourism gross fixed capital formation: PTSA table on Tourism GFCF lacks the presentation of the capital goods according to the breakdown recommended by the UNWTO.
POL Comments: Works on the regional accounts are in an introductory, methodological stage.
SWE Comments: The concept of “usual environment” is interpreted very differently among countries. Distances or travelling time are used, but it is really up to every single country to adapt its own rules. Some further guidance in this respect would be good from an international comparative analysis point of view.

110
5. Understanding and measuring tourism economic contribution: basic glossary A. General background
A.1. Products and activities
• Tourism characteristic activities: Tourism characteristic activities are the activities that typically produce tourism characteristic products. As the industrial origin of a product (the ISIC industry that produces it) is not a criterion for the aggregation of products within a similar CPC category, there is no strict one-to-one relationship between products and the industries producing them as their principal outputs (IRTS 2008, ¶ 5.11).
• Tourism characteristic products: Tourism characteristic products are
those consumption products that satisfy one or both of the following criteria:
(a) Tourism expenditure on the product should represent a significant
share of total tourism expenditure (share-of-expenditure/demand condition);
(b) Tourism expenditure on the product should represent a significant
share of the supply of the product in the economy (share-of-supply condition). This criterion implies that the supply of a tourism characteristic product would cease to exist in meaningful quantity in the absence of visitors (IRTS 2008, ¶ 5.10).
• Tourism industries: The tourism industries comprise all establishments
for which the principal activity is a tourism characteristic activity. The term tourism industries is equivalent to tourism characteristic activities and the two terms are sometimes used synonymously in the IRTS 2008.
• The typology of tourism characteristics consumption products and tourism
industries are grouped in 12 categories to be used in the Tourism Satellite Account tables. Categories 1 to 10 comprise the core for international comparison (IRTS 2008, ¶¶ 5.25 to 5.30) and are described in annexes 3 and 4 in terms of ISIC classes and CPC subclasses. The two other categories are country specific, with category 11 covering tourism characteristic goods and the corresponding retail trade activities (IRTS 2008, ¶ 5.41) and category 12 referring to tourism characteristic services and activities. (IRTS 2008, ¶ 5.34).
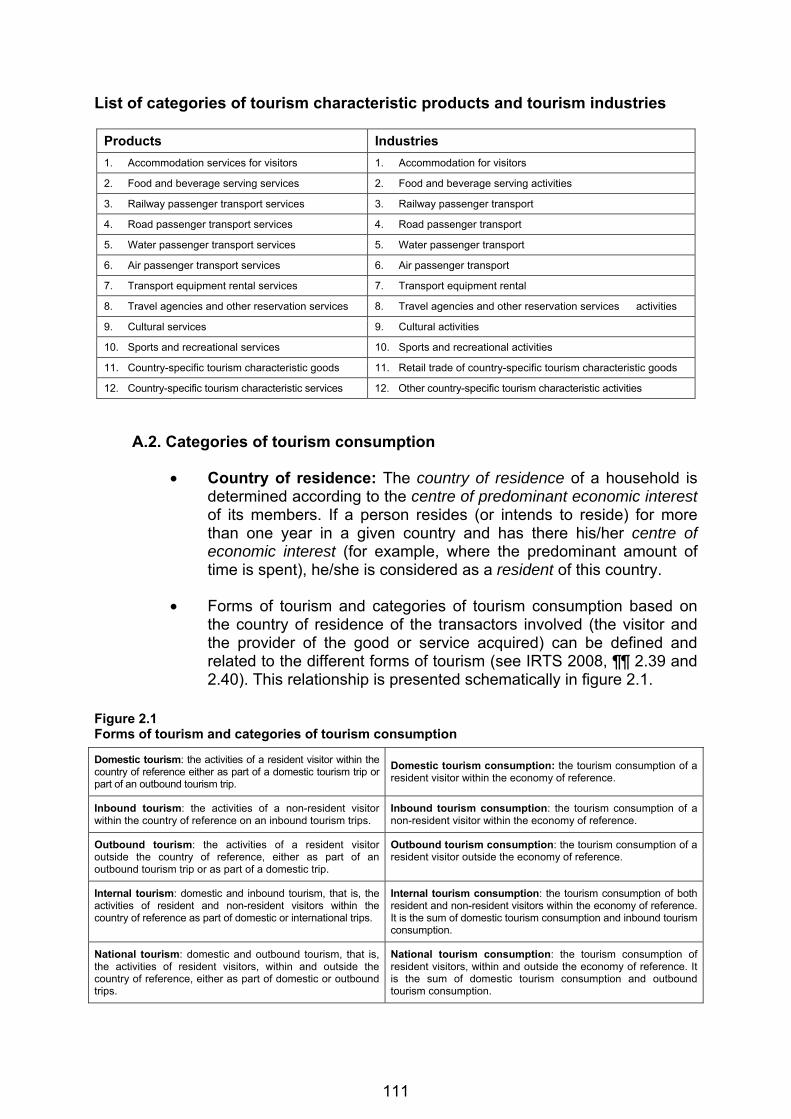
111
List of categories of tourism characteristic products and tourism industries
Products Industries
1. Accommodation services for visitors 1. Accommodation for visitors
2. Food and beverage serving services 2. Food and beverage serving activities
3. Railway passenger transport services 3. Railway passenger transport
4. Road passenger transport services 4. Road passenger transport
5. Water passenger transport services 5. Water passenger transport
6. Air passenger transport services 6. Air passenger transport
7. Transport equipment rental services 7. Transport equipment rental
8. Travel agencies and other reservation services 8. Travel agencies and other reservation services activities
9. Cultural services 9. Cultural activities
10. Sports and recreational services 10. Sports and recreational activities
11. Country-specific tourism characteristic goods 11. Retail trade of country-specific tourism characteristic goods
12. Country-specific tourism characteristic services 12. Other country-specific tourism characteristic activities
A.2. Categories of tourism consumption
• Country of residence: The country of residence of a household is determined according to the centre of predominant economic interest of its members. If a person resides (or intends to reside) for more than one year in a given country and has there his/her centre of economic interest (for example, where the predominant amount of time is spent), he/she is considered as a resident of this country.
• Forms of tourism and categories of tourism consumption based on
the country of residence of the transactors involved (the visitor and the provider of the good or service acquired) can be defined and related to the different forms of tourism (see IRTS 2008, ¶¶ 2.39 and 2.40). This relationship is presented schematically in figure 2.1.
Figure 2.1 Forms of tourism and categories of tourism consumption
Domestic tourism: the activities of a resident visitor within the country of reference either as part of a domestic tourism trip or part of an outbound tourism trip.
Domestic tourism consumption: the tourism consumption of a resident visitor within the economy of reference.
Inbound tourism: the activities of a non-resident visitor within the country of reference on an inbound tourism trips.
Inbound tourism consumption: the tourism consumption of a non-resident visitor within the economy of reference.
Outbound tourism: the activities of a resident visitor outside the country of reference, either as part of an outbound tourism trip or as part of a domestic trip.
Outbound tourism consumption: the tourism consumption of a resident visitor outside the economy of reference.
Internal tourism: domestic and inbound tourism, that is, the activities of resident and non-resident visitors within the country of reference as part of domestic or international trips.
Internal tourism consumption: the tourism consumption of both resident and non-resident visitors within the economy of reference. It is the sum of domestic tourism consumption and inbound tourism consumption.
National tourism: domestic and outbound tourism, that is, the activities of resident visitors, within and outside the country of reference, either as part of domestic or outbound trips.
National tourism consumption: the tourism consumption of resident visitors, within and outside the economy of reference. It is the sum of domestic tourism consumption and outbound tourism consumption.

112
• Residents/non-residents: The residents of a country are individuals whose centre of predominant economic interest is located in its economic territory. For a country, the non-residents are individuals whose centre of predominant economic interest is located outside its economic territory.
• Tourism consumption: This concept is used in the Tourism Satellite
Account framework and is an extension of the concept of tourism expenditure. Besides tourism expenditure, it also includes, for instance, the so called social transfers in kind that benefit visitors, the imputation of accommodation services provided by vacation homes to their owners, etc.
• Tourism trip: Trips taken by visitors are tourism trips (IRTS 2008, ¶
2.29).
• Visit: A trip is made up of visits to different places. The term “tourism visit” refers to a stay in a place visited during a tourism trip (IRTS 2008, ¶¶ 2.7 and 2.33).
• Visitor: A visitor is a traveller taking a trip to a main destination
outside his/her usual environment, for less than a year, for any main purpose (business, leisure or other personal purpose) other than to be employed by a resident entity in the country or place visited (IRTS 2008, ¶ 2.9).
B. TSA aggregates The compilation of the following aggregates, which represent a set of relevant indicators of the size of tourism in an economy is recommended (paras. 4.81):
− Internal tourism expenditure; − Internal tourism consumption; − Gross value added of tourism industries (GVATI); − Tourism direct gross value added (TDGVA); − Tourism direct gross domestic product (TDGDP).
• Internal tourism consumption: Internal tourism consumption is the
tourism consumption of both resident and non-resident visitors within the economy of reference. It is the sum of domestic tourism consumption and inbound tourism consumption (figure 2.1).
• Gross value added of tourism industries: Gross value added of tourism
industries (GVATI) is the total gross value added of all establishments belonging to tourism industries, regardless of whether all their output is provided to visitors and the degree of specialization of their production process (para. 4.86).

113
• Tourism direct gross value added: Tourism direct gross value added (TDGVA) is the part of gross value added generated by tourism industries and other industries of the economy that directly serve visitors in response to internal tourism consumption (para. 4.88).
• Tourism direct gross domestic product: Tourism direct gross domestic
product (TDGDP) is the sum of the part of gross value added (at basic prices) generated by all industries in response to internal tourism consumption plus the amount of net taxes on products and imports included within the value of this expenditure at purchasers’ prices (para 4.96).

114
ANNEX Basic macroeconomic aggregates and tourism data
AUSTRALIA (a)
Units2004
(TSA latest reference year)
2007
INBOUND TOURISM
Arrivals
1.1 Visitors ('000) 5,215 5,6441.2 Tourists (overnight visitors) ('000) 4,774 ..1.3 Same-day visitors ('000) 23 ..1.4 Cruise passengers ('000) .. ..
Arrivals by region
2.1 Africa ('000) 68 862.2 Americas ('000) 561 6292.3 Europe ('000) 1,261 1,3552.4 East Asia and the Pacific ('000) 3,205 3,3872.5 South Asia ('000) 75 1252.6 Middle East ('000) 43 63
Arrivals by means of transport used
3.1 Air ('000) 5,201 5,6193.2 Rail ('000) .. ..3.3 Road ('000) .. ..3.4 Sea ('000) 14 26
Arrivals by purpose of visit
4.1 Leisure, recreation and holidays ('000) 2,685 2,8274.2 Business and professional ('000) 999 1,3094.3 Other ('000) 1,531 1,509
Accommodation
5.1 Overnight stays in hotels and similar establishments ('000) .. ..5.2 Guests in hotels and similar establishments ('000) .. ..5.3 Overnight stays in all types of accommodation establishments ('000) .. ..5.4 Average length of stay of non-resident tourists in all accommodation
establishments Nights .. ..
6.1 Tourism expenditure in the country US$ Mn 27,766 34,5996.2 "Travel" (b) US$ Mn 20,656 26,5836.3 "Passenger transport" (b) US$ Mn 7,110 8,016
DOMESTIC TOURISM
Accommodation
7.1 Overnight stays in hotels and similar establishments ('000) .. ..7.2 Guests in hotels and similar establishments ('000) .. ..7.3 Overnight stays in all types of accommodation establishments ('000) .. ..7.4 Average length of stay of resident tourists in all accommodation
establishments Nights .. ..
OUTBOUND TOURISM
8.1 Departures ('000) 4,369 5,462
8.2 Tourism expenditure in other countries US$ Mn 19,342 23,5698.3 "Travel" (b) US$ Mn 13,925 16,9548.4 "Passenger transport" (b) US$ Mn 5,417 6,615
TOURISM INDUSTRIES
Hotels and similar establishments
9.1 Number of rooms Units 205,495 236,7879.2 Number of bed-places Units 586,217 679,0959.3 Occupancy rate Percent 63.70 65.209.4 Average length of stay Nights 2.30 2.20
(a) As in the UNWTO Compendium of Tourism Statistics(b) Balance of Payments items: 6.1 to 6.3 correspond to the "Credit" side (and are receipts for the country) while 8.2 to 8.4 correspond to the "Debit" side (and are expenditures in other countries).

115
General comments (country notes) (1.1) Excluding nationals residing abroad and crew members; (1.2,1.3) Arrivals by air; (2.1-4.3) Arrivals of non-resident visitors at national borders; (9.1,9.2/2003/2004) Hotels, motels, guests houses and serviced apartments with 15 rooms or more; (9.1,9.2/2005/2006) Hotels, motels, guests houses and serviced apartments with 5 rooms or more; (9.3) Rooms. Sources: (1.1-4.3,8.1,9.1-9.4) Australian Bureau of Statistics; (6.1-6.3,8.2-8.4) International Monetary Fund.
Basic macroeconomic aggregates (c)
AU
S
2002-03
$
Millions
• 74.974
• 19.592
• 55.382
• 17.234
• 128.966
• 28.665
• 34.483
• 841.351
• 147.205
• 168.714
• 9.528.000
(¶)
Internal tourism consumption
Tourism direct gross domestic product p.p
Total jobs
Comments
Tab
le 1
. B
asic
ag
gre
gat
esYear
Currency
Units
Gross domestic product (GDP p.p.)
Inbound tourism consumptionDomestic tourism consumption
Imports of goods and services
Outbound tourism consumptionGross value added of tourism industriesTourism direct gross value added b.p.
Exports of goods and services
(c) These data are the same as those reproduced in T.1. of Chapter 3. Selected aggregates and tables of results
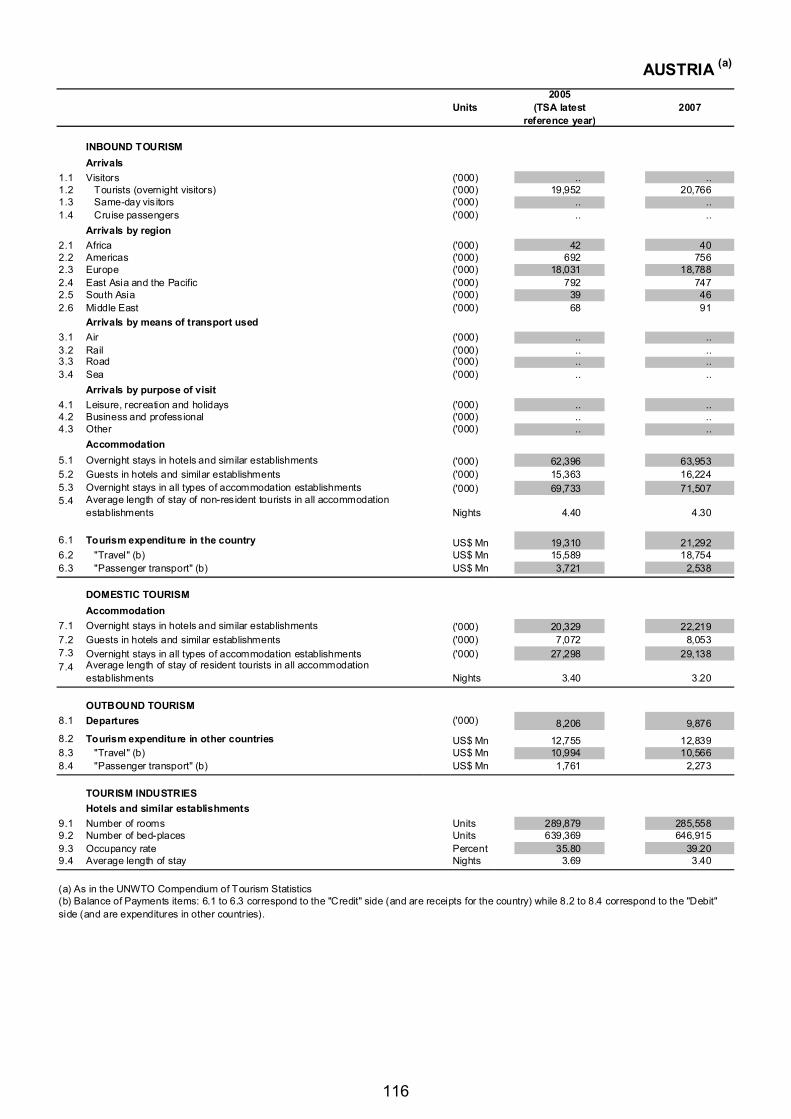
116
AUSTRIA (a)
Units2005
(TSA latest reference year)
2007
INBOUND TOURISM
Arrivals
1.1 Visitors ('000) .. ..1.2 Tourists (overnight visitors) ('000) 19,952 20,7661.3 Same-day vis itors ('000) .. ..1.4 Cruise passengers ('000) .. ..
Arrivals by region
2.1 Africa ('000) 42 402.2 Americas ('000) 692 7562.3 Europe ('000) 18,031 18,7882.4 East Asia and the Pacific ('000) 792 7472.5 South Asia ('000) 39 462.6 Middle East ('000) 68 91
Arrivals by means of transport used
3.1 Air ('000) .. ..3.2 Rail ('000) .. ..3.3 Road ('000) .. ..3.4 Sea ('000) .. ..
Arrivals by purpose of visit
4.1 Leisure, recreation and holidays ('000) .. ..4.2 Business and professional ('000) .. ..4.3 Other ('000) .. ..
Accommodation
5.1 Overnight stays in hotels and similar establishments ('000) 62,396 63,9535.2 Guests in hotels and similar establishments ('000) 15,363 16,2245.3 Overnight stays in all types of accommodation establishments ('000) 69,733 71,5075.4 Average length of stay of non-resident tourists in all accommodation
establishments Nights 4.40 4.30
6.1 Tourism expenditure in the country US$ Mn 19,310 21,2926.2 "Travel" (b) US$ Mn 15,589 18,7546.3 "Passenger transport" (b) US$ Mn 3,721 2,538
DOMESTIC TOURISM
Accommodation
7.1 Overnight stays in hotels and similar establishments ('000) 20,329 22,2197.2 Guests in hotels and similar establishments ('000) 7,072 8,0537.3 Overnight stays in all types of accommodation establishments ('000) 27,298 29,1387.4 Average length of stay of resident tourists in all accommodation
establishments Nights 3.40 3.20
OUTBOUND TOURISM
8.1 Departures ('000) 8,206 9,876
8.2 Tourism expenditure in other countries US$ Mn 12,755 12,8398.3 "Travel" (b) US$ Mn 10,994 10,5668.4 "Passenger transport" (b) US$ Mn 1,761 2,273
TOURISM INDUSTRIES
Hotels and similar establishments
9.1 Number of rooms Units 289,879 285,5589.2 Number of bed-places Units 639,369 646,9159.3 Occupancy rate Percent 35.80 39.209.4 Average length of stay Nights 3.69 3.40
(a) As in the UNWTO Compendium of Tourism Statistics(b) Balance of Payments items: 6.1 to 6.3 correspond to the "Credit" side (and are receipts for the country) while 8.2 to 8.4 correspond to the "Debit" side (and are expenditures in other countries).

117
General comments (country notes) (1.2-2.6) Non-resident tourists staying in all types of accommodation establishments; (5.1,5.2,7.1,7.2) Including holiday villages; (5.3,7.3) Excluding private accommodation; (8.1) From 2003, new methodology. Including leisure and business trips abroad with at least one overnight stay; (9.1) Hotels only; (9.2) Hotels and holiday villages; (9.3) Based on summer season; (9.4) Average length of stay in hotels and similar establishments; including holiday villages. Sources: (1.2-5.4,7.1-7.4,8.1,9.1-9.4) Department for Tourism and Historic Objects - Federal Ministry of Economics and Labour; (6.1-6.3,8.2-8.4) International Monetary Fund. Balance of Payments items (IMF notes) Transportation This item covers freight revenues and expenditures, as well as international passenger transport and auxiliary services. Travel Travel now excludes international passenger transport. One of the most important sources for the credit side of travel is the official statistics on overnight stays and arrivals of nonresident visitors to Austria. Furthermore, studies and sources provided by other institutions are used, for instance the new Austrian Guest Inquiry “T-Mona”—an instrument that measures the average daily expenditure of foreign tourists in Austria. The main source for measuring the expenditure of Austrians abroad is a quarterly household survey operated by Statistics Austria. Credit card data are mainly used for plausibility checks on the data from the above-mentioned sources and for compiling the geographical breakdowns on a detailed country level. Various supplementary data sources are used in the compilation process to provide the necessary data that cannot be obtained from the main sources. These sources are used to measure directly specific variables; for example direct imports of cars by households are taken from the car registration statistics. The expenditure of “fuel tourists” contributing to the credit side of the travel item is relatively high; a model is therefore used to measure it. Concerning the debit side of the travel item, expenditure on health services abroad—in particular related to “dental tourism”—is significant. Because this kind of travel is not or only partly covered by the household survey, an estimation model is employed, which takes into account the supply structure of dentists near the Austrian border (in particular the border with Hungary). Supplementary data sources are also used to corroborate the reliability of outcomes of highly important variables that depend on weaker data sources. Examples of supplementary sources are data provided by other countries or institutions, such as Eurostat or the World Tourism Organization (UNWTO), data from private institutions, or other macroeconomic indicators such as GDP, the consumer price index, and statistics on wages studies on the mobility of students.
Basic macroeconomic aggregates (c)
AU
T
2005
€
Billions
• 28.05
• 14.36
• 13.69
•• 20.50
• 13.34
•• 244.45
• 130.01
• 122.07
• 298.74
(¶)
Inbound tourism consumption
Domestic tourism consumption
Imports of goods and services
Outbound tourism consumptionGross value added of tourism industriesTourism direct gross value added b.p.
Exports of goods and services
Internal tourism consumption
Tourism direct gross domestic product p.p
Total jobs
Comments
Tab
le 1
. B
asic
ag
gre
ga
tes
Year
Currency
Units
Gross domest ic product (GDP p.p.)
(c) These data are the same as those reproduced in T.1. of Chapter 3. Selected aggregates and tables of results

118
CANADA (a)
Units2002
(TSA latest reference year)
2007
INBOUND TOURISM
Arrivals
1.1 Visitors ('000) 44,896 30,3731.2 Tourists (overnight visitors) ('000) 20,057 17,9311.3 Same-day vis itors ('000) 24,839 12,4421.4 Cruise passengers ('000) .. ..
Arrivals by region
2.1 Africa ('000) 54 762.2 Americas ('000) 16,576 13,9432.3 Europe ('000) 2,095 2,4432.4 East Asia and the Pacific ('000) 1,210 1,2672.5 South Asia ('000) 79 1362.6 Middle East ('000) 42 68
Arrivals by means of transport used
3.1 Air ('000) 7,193 7,8143.2 Rail ('000) 108 1063.3 Road ('000) 12,226 9,1783.4 Sea ('000) 531 833
Arrivals by purpose of visit
4.1 Leisure, recreation and holidays ('000) 11,503 9,6144.2 Business and professional ('000) 2,560 2,5904.3 Other ('000) 5,901 5,563
Accommodation
5.1 Overnight stays in hotels and similar establishments ('000) .. ..5.2 Guests in hotels and similar establishments ('000) .. ..5.3 Overnight stays in all types of accommodation establishments ('000) 122,150 122,0235.4 Average length of stay of non-resident tourists in all accommodation
establishments Nights .. ..
6.1 Tourism expenditure in the country US$ Mn 12,744 17,9856.2 "Travel" (b) US$ Mn 10,687 15,6146.3 "Passenger transport" (b) US$ Mn 2,057 2,371
DOMESTIC TOURISM
Accommodation
7.1 Overnight stays in hotels and similar establishments ('000) 59,217 43,4187.2 Guests in hotels and similar establishments ('000) .. ..7.3 Overnight stays in all types of accommodation establishments ('000) 308,046 264,4887.4 Average length of stay of resident tourists in all accommodation
establishments Nights .. ..
OUTBOUND TOURISM
8.1 Departures ('000) 17,705 25,163
8.2 Tourism expenditure in other countries US$ Mn 14,257 31,3658.3 "Travel" (b) US$ Mn 11,722 24,8828.4 "Passenger transport" (b) US$ Mn 2,535 6,483
TOURISM INDUSTRIES
Hotels and similar establishments
9.1 Number of rooms Units .. ..9.2 Number of bed-places Units .. ..9.3 Occupancy rate Percent 61.90 ..9.4 Average length of stay Nights .. ..
(a) As in the UNWTO Compendium of Tourism Statistics(b) Balance of Payments items: 6.1 to 6.3 correspond to the "Credit" side (and are receipts for the country) while 8.2 to 8.4 correspond to the "Debit" side (and are expenditures in other countries).

119
General comments (country notes) (1.1,1.3) Data based on customs counts and adjusted using questionnaire surveys; (1.2,2.1-4.3) Arrivals of non-resident tourists at national borders; (4.2) Including convention; (8.1) Person-trips (one or more nights). Sources: (1.1-4.3,5.3,7.1,7.3,8.1,9.1,9.3) Canadian Tourism Commission and Statistics Canada; (6.1-6.3,8.2-8.4) International Monetary Fund. Balance of Payments items (IMF notes) Transportation For passenger transport, BOPD relies on monthly administrative data, combined with estimates of average passenger fares from a quarterly sample survey of expenditure characteristics by the Culture, Tourism, and Center for Education Statistics Division (CTCES) of Statistics Canada. Included with passenger transport is coverage of cruise fares, which international standards define as travel. For goods transport the BOPD records, as transportation receipts, the bilateral services that Canadian-domiciled truck operators provide beyond the Canada-U.S. border, whereas it treats as transportation payments the services that U.S.-domiciled truck operators provide within the Canadian border. Taking components for this calculation from the U.S. Bureau of Economic Analysis (BEA), BOPD follows the BEA basic methodology for this series. For water and air transport, BOPD derives information from several specific surveys it conducts annually. It maintains survey frames from industry registers and media sources, along with information on shipping companies from the Transportation Division of Statistics Canada. Where regular follow-ups to surveys do not produce sufficient data, the division imputes amounts based on prior responses and available external information. BOPD often combines the survey results with other sources. For example, for the 1997 historical series, the division adapted methodology to increase the coverage of global payments abroad for the transport by sea of imports. That is, the division closely re-edited the basic survey of freight on non-oil imports to calculate unit values. It then multiplied the unit values by international shipping tonnage unloaded at Canadian ports, as compiled by the Transportation Division of Statistics Canada. The tonnage activity is largely handled by nonresident carriers. Since deregulation of air services in the late 1980s, reporting has been less than complete for airfreight receipts and for payments for supporting landside services, especially geographic breakouts. Certain payments data on bilateral airfreight and landside services benefit from U.S. estimates, reflecting incomplete information obtained from the Canadian sources. Travel The CTCES Division compiles the basic Canadian travel statistics. CTCES derives these statistics from a combination of census data and sample counts of travelers crossing the border, coupled with sample surveys used to collect specific information from travelers, including their expenditures and main purpose of visit. Beginning with the reference year 2000, a new air exit survey introduced on-site interviews for foreign travelers at eight key Canadian airports. Travel is subdivided into travel for business reasons and travel for personal reasons: Business travel covers expenditures by cross-border workers, but insufficient data bar their identification as such in the Canadian statistics. Also, as a result of data limitations, cruise fares as noted above are recorded under transportation services rather than travel. As part of the business travel item, the CTCES calculates estimates of spending by crews (of airplanes, ships, boats, trains, and trucks). For personal travel, data for health-related travel consist of foreign spending for hospital services in Canada. CTCES records these data from the annual hospital survey of the Canadian Institute for Health Information, projecting data for recent years where survey results are not yet available. With the 1995 reference year, CTCES introduced estimates for physician services linked to U.S. data on the payments side. Also starting in 1995, access to U.S. sources has enabled a fuller estimate covering payments, beyond provincial health plans, at major medical centers and university hospitals located in the United States. On the receipt side of the education series, CTCES produces the estimates by combining the time series on the number of students with average tuition rates and adding estimates of other expenditure. For expenditures of Canadian students in the United States, the data have been supplied by the U.S. BEA from 1981 onward and were linked with balance of payments data for prior years. CTCES updates the data on student expenditures overseas to incorporate volume and expenditure estimates.
Basic macroeconomic aggregates (c)
CA
N
2002
Canadian$
Mill ions
• 56,559
• 18,115
• 38,444
• 20,627
• 54,362
• 23,319
• (¶)
• 1,152,905
• 479,185
• 428,301
• 15,586,394
Inbound tourism c ons umpt ion
Domestic t ourism consumption
Imports of goods and services
O utbound tourism consumpt ionG ross va lue added of tourism industriesTourism direct gross value added b.p.
E xports of goods and s ervices
Inte rnal t ou rism consumption
Tourism direct gross domestic p roduct p. p
To tal jobs
Comments
Tab
le 1
. B
asic
ag
gre
ga
tes
Year
Currency
Units
G ross domest ic product (G DP p. p.)
(c) These data are the same as those reproduced in T.1. of Chapter 3. Selected aggregates and tables of results

120
CHILE (a)
Units2003
(TSA latest reference year)
2007
INBOUND TOURISM
Arrivals
1.1 Visitors ('000) .. ..1.2 Tourists (overnight visitors) ('000) 1,614 2,5071.3 Same-day vis itors ('000) 448 6861.4 Cruise passengers ('000) .. ..
Arrivals by region
2.1 Africa ('000) 3 42.2 Americas ('000) 1,243 1,9682.3 Europe ('000) 309 4372.4 East Asia and the Pacific ('000) 54 912.5 South Asia ('000) 2 42.6 Middle East ('000) 1 1
Arrivals by means of transport used
3.1 Air ('000) 708 1,0553.2 Rail ('000) 2 23.3 Road ('000) 867 1,3463.4 Sea ('000) 37 104
Arrivals by purpose of visit
4.1 Leisure, recreation and holidays ('000) 1,054 1,3064.2 Business and professional ('000) 229 4564.3 Other ('000) 331 745
Accommodation
5.1 Overnight stays in hotels and similar establishments ('000) 1,947 3,6055.2 Guests in hotels and similar establishments ('000) 850 1,5635.3 Overnight stays in all types of accommodation establishments ('000) .. ..5.4 Average length of stay of non-resident tourists in all accommodation
establishments Nights 12.30 10.90
6.1 Tourism expenditure in the country US$ Mn 1,309 2,1726.2 "Travel" (b) US$ Mn 883 1,4196.3 "Passenger transport" (b) US$ Mn 426 753
DOMESTIC TOURISM
Accommodation
7.1 Overnight stays in hotels and similar establishments ('000) 4,879 6,5787.2 Guests in hotels and similar establishments ('000) 2,199 3,3717.3 Overnight stays in all types of accommodation establishments ('000) .. ..7.4 Average length of stay of resident tourists in all accommodation
establishments Nights .. ..
OUTBOUND TOURISM
8.1 Departures ('000) 2,100 3,234
8.2 Tourism expenditure in other countries US$ Mn 1,109 2,1408.3 "Travel" (b) US$ Mn 850 1,7628.4 "Passenger transport" (b) US$ Mn 259 378
TOURISM INDUSTRIES
Hotels and similar establishments
9.1 Number of rooms Units 52,362 63,2949.2 Number of bed-places Units 117,905 138,8659.3 Occupancy rate Percent 32.50 36.409.4 Average length of stay Nights 2.20 2.10
(a) As in the UNWTO Compendium of Tourism Statistics(b) Balance of Payments items: 6.1 to 6.3 correspond to the "Credit" side (and are receipts for the country) while 8.2 to 8.4 correspond to the "Debit" side (and are expenditures in other countries).

121
General comments (country notes) (5.1,5.2,7.1,7.2) Figures for 2005 are not comparable with those of previous years due to a revision of the National Census of Tourism Accommodation Establishments. Sources: (1.2-5.4,7.1,7.2,8.1,9.1-9.4) "Servicio Nacional de Turismo - SERNATUR"; (6.1-6.3,8.2-8.4) International Monetary Fund. Balance of Payments items (IMF notes) Transportation Passenger. Credit and debit entries for passenger services are estimated on the basis of information obtained from quarterly forms provided by resident carriers (i.e., shipping companies and airlines) and by representatives of nonresident transport companies. The CBC supplements the data with information from annual surveys of resident carriers, a benchmark survey of other carriers, and data on vehicles crossing the border. Before complete information is obtained from the forms and surveys, preliminary estimates are made. Travel Both credit and debit entries are estimated by combining monthly data provided by immigration authorities on the number of foreign visitors and Chilean travelers who enter and exit the country, with data on average expenditures and length of stay obtained from surveys, which cover tourism by both incoming and outgoing travelers. The surveys are undertaken in accordance with an agreement between the CBC and the National Tourism Service, a government agency.
Basic macroeconomic aggregates (c)
CH
L
2003
Pesoschilenos
Billions
• 3,483
• 766
• 2,611
• 751
• 1,395
• 1,596
• 1,611
• 51,156
• 18,484
• 16,337
• 149,707
(¶)
Inbound tourism consumption
Domestic tourism consumption
Imports of goods and services
Outbound tourism consumptionGross value added of tourism industriesTourism direct gross value added b.p.
Exports of goods and services
Internal tourism consumption
Tourism direct gross domestic product p.p
Total jobs
Comments
Tab
le 1
. B
asic
ag
gre
ga
tes
Year
Currency
Units
Gross domest ic product (GDP p.p.)
(c) These data are the same as those reproduced in T.1. of Chapter 3. Selected aggregates and tables of results

122
CHINA (a)
Units2002
(TSA latest reference year)
2007
INBOUND TOURISM
Arrivals
1.1 Visitors ('000) 97,908 131,8731.2 Tourists (overnight visitors) ('000) 36,803 54,7201.3 Same-day visitors ('000) .. ..1.4 Cruise passengers ('000) .. ..
Arrivals by region
2.1 Africa ('000) 85 3272.2 Americas ('000) 1,510 2,7212.3 Europe ('000) 3,007 6,9372.4 East Asia and the Pacific ('000) 92,866 120,9562.5 South Asia ('000) 381 7492.6 Middle East ('000) 52 180
Arrivals by means of transport used
3.1 Air ('000) 10,343 18,8153.2 Rail ('000) 1,252 1,6643.3 Road ('000) 81,936 105,4733.4 Sea ('000) 4,377 5,920
Arrivals by purpose of visit
4.1 Leisure, recreation and holidays ('000) 5,560 13,1414.2 Business and professional ('000) 3,220 6,9614.3 Other ('000) 4,659 6,008
Accommodation
5.1 Overnight stays in hotels and similar establishments ('000) 99,360 195,0805.2 Guests in hotels and similar establishments ('000) 39,142 73,1145.3 Overnight stays in all types of accommodation establishments ('000) .. ..5.4 Average length of stay of non-resident tourists in all accommodation
establishments Nights 2.54 2.67
6.1 Tourism expenditure in the country US$ Mn 21,742 41,1266.2 "Travel" (b) US$ Mn 20,385 37,2336.3 "Passenger transport" (b) US$ Mn 1,357 3,893
DOMESTIC TOURISM
Accommodation
7.1 Overnight stays in hotels and similar establishments ('000) 246,325 435,8497.2 Guests in hotels and similar establishments ('000) .. ..7.3 Overnight stays in all types of accommodation establishments ('000) .. ..7.4 Average length of stay of resident tourists in all accommodation
establishments Nights .. ..
OUTBOUND TOURISM
8.1 Departures ('000) 16,602 40,954
8.2 Tourism expenditure in other countries US$ Mn 16,759 33,2648.3 "Travel" (b) US$ Mn 15,398 29,7868.4 "Passenger transport" (b) US$ Mn 1,361 3,478
TOURISM INDUSTRIES
Hotels and similar establishments
9.1 Number of rooms Units 897,206 1,573,7849.2 Number of bed-places Units 1,729,460 2,969,4349.3 Occupancy rate Percent 60.15 60.969.4 Average length of stay Nights 2.54 2.67
(a) As in the UNWTO Compendium of Tourism Statistics(b) Balance of Payments items: 6.1 to 6.3 correspond to the "Credit" side (and are receipts for the country) while 8.2 to 8.4 correspond to the "Debit" side (and are expenditures in other countries).
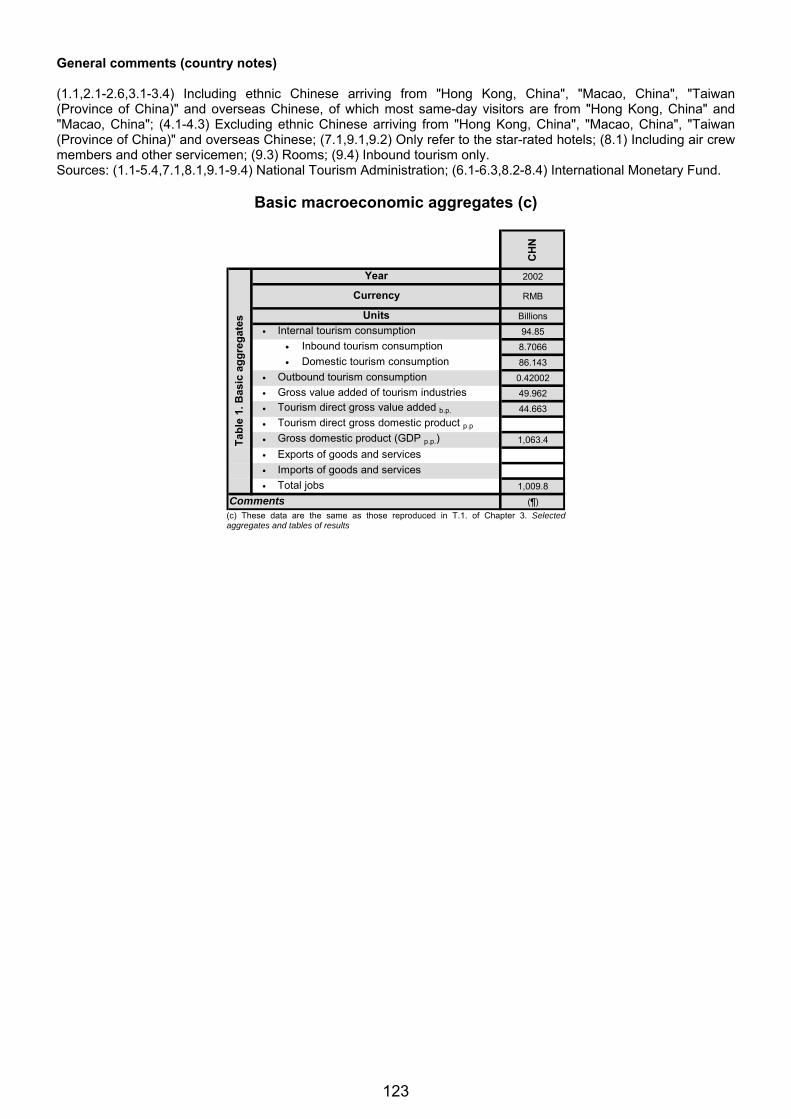
123
General comments (country notes) (1.1,2.1-2.6,3.1-3.4) Including ethnic Chinese arriving from "Hong Kong, China", "Macao, China", "Taiwan (Province of China)" and overseas Chinese, of which most same-day visitors are from "Hong Kong, China" and "Macao, China"; (4.1-4.3) Excluding ethnic Chinese arriving from "Hong Kong, China", "Macao, China", "Taiwan (Province of China)" and overseas Chinese; (7.1,9.1,9.2) Only refer to the star-rated hotels; (8.1) Including air crew members and other servicemen; (9.3) Rooms; (9.4) Inbound tourism only. Sources: (1.1-5.4,7.1,8.1,9.1-9.4) National Tourism Administration; (6.1-6.3,8.2-8.4) International Monetary Fund.
Basic macroeconomic aggregates (c)
CH
N
2002
RMB
Billions
• 94.85
• 8.7066
• 86.143
• 0.42002
• 49.962
• 44.663
•
• 1,063.4
•
•
• 1,009.8
(¶)
Inbound tourism consumption
Domestic tourism consumption
Imports of goods and services
Outbound tourism consumption
Gross value added of tourism industriesTourism direct gross value added b.p.
Exports of goods and services
Internal tourism consumption
Tourism direct gross domestic product p.p
Total jobs
Comments
Tab
le 1
. B
asic
ag
gre
gat
es
Year
Currency
Units
Gross domestic product (GDP p.p.)
(c) These data are the same as those reproduced in T.1. of Chapter 3. Selected aggregates and tables of results

124
COLOMBIA (a)
Units2000
(TSA latest reference year)
2007
INBOUND TOURISM
Arrivals
1.1 Visitors ('000) 557 1,1951.2 Tourists (overnight visitors) ('000) .. ..1.3 Same-day vis itors ('000) .. ..1.4 Cruise passengers ('000) 150 127
Arrivals by region
2.1 Africa ('000) 1 ..2.2 Americas ('000) 413 ..2.3 Europe ('000) 127 ..2.4 East Asia and the Pacific ('000) 13 ..2.5 South Asia ('000) 1 ..2.6 Middle East ('000) 1 ..
Arrivals by means of transport used
3.1 Air ('000) 520 ..3.2 Rail ('000) .. ..3.3 Road ('000) 37 ..3.4 Sea ('000) .. ..
Arrivals by purpose of visit
4.1 Leisure, recreation and holidays ('000) 469 ..4.2 Business and professional ('000) 68 ..4.3 Other ('000) 21 ..
Accommodation
5.1 Overnight stays in hotels and similar establishments ('000) .. ..5.2 Guests in hotels and similar establishments ('000) .. ..5.3 Overnight stays in all types of accommodation establishments ('000) .. ..5.4 Average length of stay of non-resident tourists in all accommodation
establishments Nights .. ..
6.1 Tourism expenditure in the country US$ Mn 1,313 2,2626.2 "Travel" (b) US$ Mn 1,030 1,6696.3 "Passenger transport" (b) US$ Mn 283 593
DOMESTIC TOURISM
Accommodation
7.1 Overnight stays in hotels and similar establishments ('000) .. ..7.2 Guests in hotels and similar establishments ('000) .. ..7.3 Overnight stays in all types of accommodation establishments ('000) .. ..7.4 Average length of stay of resident tourists in all accommodation
establishments Nights .. ..
OUTBOUND TOURISM
8.1 Departures ('000) 1,235 ..
8.2 Tourism expenditure in other countries US$ Mn 1,452 2,0938.3 "Travel" (b) US$ Mn 1,060 1,5378.4 "Passenger transport" (b) US$ Mn 392 556
TOURISM INDUSTRIES
Hotels and similar establishments
9.1 Number of rooms Units 47,104 ..9.2 Number of bed-places Units 92,876 ..9.3 Occupancy rate Percent 43.04 57.509.4 Average length of stay Nights .. ..
(a) As in the UNWTO Compendium of Tourism Statistics(b) Balance of Payments items: 6.1 to 6.3 correspond to the "Credit" side (and are receipts for the country) while 8.2 to 8.4 correspond to the "Debit" side (and are expenditures in other countries).

125
General comments (country notes) (1.1,2.1-2.6,3.1-3.4,4.1-4.3) Arrivals of non-resident visitors at national borders. Excluding cruise passengers; (9.3) Rooms. Note 2006: Provisional data. Sources: (1.1-4.3,8.1) "Dirección de Extranjería - Departamento Administrativo de Seguridad (DAS)"; (6.1-6.3,8.2-8.4) International Monetary Fund; (9.1-9.3) "Dirección de Turismo - Ministerio de Comercio, Industria y Turismo, Asociación Hotelera de Colombia (COTELCO)". Balance of Payments items (IMF notes) Transportation Regarding passenger services and other transportation, BR compiles credit and debit entries on the basis of data supplied by national and foreign airlines. It bases freight credit entries on data supplied by national airlines and shipping companies. It bases freight debit entries on data supplied by DIAN for imports of goods. Travel The travel component measures nonborder travel (via airports) and cross-border travel (through land-border crossing points). The data for nonborder travel are estimated on the basis of information on international passenger movements provided by the Civil Aviation authorities and the Administrative Department of Security. Regarding cross-border travel, BR derives data from quarterly surveys conducted at five land-border crossing points.
Basic macroeconomic aggregates (c)
CO
L
2000
• 7,115,356
• 1,893,002
• 5,222,354
• 2,499,757
• 27,349,003
• 3,403,704
• 3,717,115
• 196,373,851
• 34,142,398
• 37,051,610
• (¶)
Inbound tourism consumption
Domestic tourism consumption
Imports of goods and services
Outbound tourism consumptionGross value added of tourism industriesTourism direct gross value added b.p.
Exports of goods and services
Internal tourism consumption
Tourism direct gross domestic product p.p
Total jobs
Comments
Tab
le 1
. B
asic
ag
gre
ga
tes
Year
Currency
Units
Gross domest ic product (GDP p.p.)
(c) These data are the same as those reproduced in T.1. of Chapter 3. Selected aggregates and tables of results

126
CUBA (a)
Units2007
(TSA latest reference year)
INBOUND TOURISM
Arrivals
1.1 Visitors ('000) 2,1521.2 Tourists (overnight visitors) ('000) 2,1191.3 Same-day visitors ('000) 331.4 Cruise passengers ('000) 7
Arrivals by region
2.1 Africa ('000) 72.2 Americas ('000) 1,1732.3 Europe ('000) 9242.4 East Asia and the Pacific ('000) 422.5 South Asia ('000) 42.6 Middle East ('000) 2
Arrivals by means of transport used
3.1 Air ('000) 2,1193.2 Rail ('000) ..3.3 Road ('000) ..3.4 Sea ('000) ..
Arrivals by purpose of visit
4.1 Leisure, recreation and holidays ('000) 1,9894.2 Business and professional ('000) 124.3 Other ('000) 118
Accommodation
5.1 Overnight stays in hotels and similar establishments ('000) 14,5145.2 Guests in hotels and similar establishments ('000) 3,0515.3 Overnight stays in all types of accommodation establishments ('000) 15,2215.4 Average length of stay of non-resident tourists in all accommodation
establishments Nights 11.70
6.1 Tourism expenditure in the country US$ Mn 2,4156.2 "Travel" (b) US$ Mn 2,1416.3 "Passenger transport" (b) US$ Mn 274
DOMESTIC TOURISM
Accommodation
7.1 Overnight stays in hotels and similar establishments ('000) 3,0017.2 Guests in hotels and similar establishments ('000) ..7.3 Overnight stays in all types of accommodation establishments ('000) 7,8987.4 Average length of stay of resident tourists in all accommodation
establishments Nights ..
OUTBOUND TOURISM
8.1 Departures ('000) 194
8.2 Tourism expenditure in other countries US$ Mn ..8.3 "Travel" (b) US$ Mn ..8.4 "Passenger transport" (b) US$ Mn ..
TOURISM INDUSTRIES
Hotels and similar establishments
9.1 Number of rooms Units 47,1039.2 Number of bed-places Units 89,6259.3 Occupancy rate Percent 60.909.4 Average length of stay Nights ..
(a) As in the UNWTO Compendium of Tourism Statistics(b) Balance of Payments items: 6.1 to 6.3 correspond to the "Credit" side (and are receipts for the country) while 8.2 to 8.4 correspond to the "Debit" side (and are expenditures in other countries).

127
General comments (country notes) (1.1,2.1-2.6) Arrivals of non-resident visitors at national borders; (1.2,4.1-4.3) Air arrivals; (1.3) Including cruise passengers; (5.1,7.1,9.1,9.2) Hotels, motels & apart-hotels; (5.3,7.3) Hotels, motels, apart-hotels, camping/caravaning and other; (6.1-6.3) The expenditure figures are those provided by the country to UNWTO, which do not appear in the International Monetary Fund data used in the preparation of this edition of the Compendium; (8.1) Including only tours authorized by the "Instituto de Turismo"; (9.3) Rooms. Source: "Oficina Nacional de Estadísticas".
Basic macroeconomic aggregates (c)
CU
B
2007
Pesos
Millions
•
• 1,982.2
•
•
• 15,043.2
•
•
• 58,603.6
• 11,917.9
• 10,332.6
• 4,867.7
(¶)
Inbound tourism consumption
Domestic tourism consumption
Imports of goods and services
Outbound tourism consumption
Gross value added of tourism industriesTourism direct gross value added b.p.
Exports of goods and services
Internal tourism consumption
Tourism direct gross domestic product p.p
Total jobs
Comments
Tab
le 1
. B
asic
ag
gre
gat
es
Year
Currency
Units
Gross domestic product (GDP p.p.)
(c) These data are the same as those reproduced in T.1. of Chapter 3. Selected aggregates and tables of results

128
CYPRUS (a)
Units2006
(TSA latest reference year)
2007
INBOUND TOURISM
Arrivals
1.1 Visitors ('000) 2,629 2,6711.2 Tourists (overnight visitors) ('000) 2,401 2,4161.3 Same-day vis itors ('000) 228 2551.4 Cruise passengers ('000) 220 246
Arrivals by region
2.1 Africa ('000) 7 72.2 Americas ('000) 26 302.3 Europe ('000) 2,308 2,3042.4 East Asia and the Pacific ('000) 16 172.5 South Asia ('000) 4 62.6 Middle East ('000) 39 51
Arrivals by means of transport used
3.1 Air ('000) 2,408 2,4253.2 Rail ('000) .. ..3.3 Road ('000) .. ..3.4 Sea ('000) 221 246
Arrivals by purpose of visit
4.1 Leisure, recreation and holidays ('000) 2,091 1,9734.2 Business and professional ('000) 151 1754.3 Other ('000) 159 268
Accommodation
5.1 Overnight stays in hotels and similar establishments ('000) 13,227 13,1295.2 Guests in hotels and similar establishments ('000) 1,761 1,7755.3 Overnight stays in all types of accommodation establishments ('000) 13,310 13,1975.4 Average length of stay of non-resident tourists in all accommodation
establishments Nights 7.52 7.39
6.1 Tourism expenditure in the country US$ Mn 2,691 3,1096.2 "Travel" (b) US$ Mn 2,381 2,6876.3 "Passenger transport" (b) US$ Mn 310 422
DOMESTIC TOURISM
Accommodation
7.1 Overnight stays in hotels and similar establishments ('000) 1,114 1,1697.2 Guests in hotels and similar establishments ('000) 509 5357.3 Overnight stays in all types of accommodation establishments ('000) 1,128 1,1817.4 Average length of stay of resident tourists in all accommodation
establishments Nights 2.18 2.18
OUTBOUND TOURISM
8.1 Departures ('000) 789 932
8.2 Tourism expenditure in other countries US$ Mn 1,031 1,5548.3 "Travel" (b) US$ Mn 967 1,4798.4 "Passenger transport" (b) US$ Mn 64 75
TOURISM INDUSTRIES
Hotels and similar establishments
9.1 Number of rooms Units 44,404 43,7999.2 Number of bed-places Units 89,490 87,8049.3 Occupancy rate Percent 59.91 61.799.4 Average length of stay Nights 6.32 6.19
(a) As in the UNWTO Compendium of Tourism Statistics(b) Balance of Payments items: 6.1 to 6.3 correspond to the "Credit" side (and are receipts for the country) while 8.2 to 8.4 correspond to the "Debit" side (and are expenditures in other countries).

129
General comments (country notes) (1.2,2.1-2.6) Arrivals of non-resident tourists at national borders; (1.3) Including transit & cruise passengers; (3.4) Including transit passengers; (5.4) From 2000 onwards, average length of stay calculations are based on guest nights and arrivals at all licensed accommodation establishments; (9.3) Bed-places; (9.4) From 2000 onwards, average length of stay calculations are based on guest nights and arrivals at hotels and similar establishments. Sources: (1.1-4.3,8.1) Statistical Service of Cyprus; (5.1-5.4,7.1-7.4,9.1-9.4) Cyprus Tourism Organization; (6.1-6.3,8.2-8.4) International Monetary Fund. Balance of Payments items (IMF notes) Transportation This category covers freight and passenger services provided by sea and air transport operators. CBC derives debit entries for freight services from the estimates made to convert imports from a c.i.f. to an f.o.b. basis (i.e., freight and insurance are assumed to equal 8 percent of imports c.i.f.). Concerning passenger transport, banks report the data through the settlements system. With respect to credits, CBC cross-checks the figures with data obtained from an annual survey of major resident passenger transport operators. The staff supplement settlement data for supporting, auxiliary, and other transport services with data from the financial statements or reports of international business companies engaged in such activities. Travel For travel credits for tourism, the central bank obtains data from CYSTAT, which conducts a monthly frontier survey on tourist expenditure in Cyprus. To obtain geographical allocation for travel credits, the CBC combines per person expenditure derived from the survey with the number of tourist arrivals, as given by the frontier survey of incoming travelers, which CYSTAT also conducts. With regard to education-related revenue, CBC conducts an annual survey among those colleges that provide educational services to nonresidents and compares the survey results with data reported by banks under the settlements system. In 2004, CYSTAT launched a new survey to measure the expenditures of nonresidents in their residential properties in Cyprus. The results of the survey are included in the “travel” item. For travel debits, CBC obtains the value from the settlements system. Reported data include foreign exchange allowances issued to resident travelers for tourism purposes, foreign exchange issued for education, private medical spending abroad, payments by resident travel agents, and foreign exchange outflows through credit or debit cards.
Basic macroeconomic aggregates (c)
CY
P
2006
•• 1,300,763,082
• 247,262,558
• 468,612,405
• 2,337,898,635
• 696,348,288
• 1,008,585,991
• 8,287,000,000
• 3,959,000,000
• 4,315,900,000
•
Inbound tourism consumption
Domestic tourism consumption
Imports of goods and services
Outbound tourism consumptionGross value added of tourism industriesTourism direct gross value added b.p.
Exports of goods and services
Internal tourism consumption
Tourism direct gross domestic product p.p
Total jobs
Comments
Tab
le 1
. B
asic
ag
gre
ga
tes
Year
Currency
Units
Gross domest ic product (GDP p.p.)
(c) These data are the same as those reproduced in T.1. of Chapter 3. Selected aggregates and tables of results

130
CZECH REPUBLIC (a)
Units2006
(TSA latest reference year)
2007
INBOUND TOURISM
Arrivals
1.1 Visitors ('000) .. ..1.2 Tourists (overnight visitors) ('000) 6,435 6,6801.3 Same-day vis itors ('000) .. ..1.4 Cruise passengers ('000) .. ..
Arrivals by region
2.1 Africa ('000) 19 202.2 Americas ('000) 435 4412.3 Europe ('000) 5,488 5,7152.4 East Asia and the Pacific ('000) 493 5042.5 South Asia ('000) .. ..2.6 Middle East ('000) .. ..
Arrivals by means of transport used
3.1 Air ('000) .. ..3.2 Rail ('000) .. ..3.3 Road ('000) .. ..3.4 Sea ('000) .. ..
Arrivals by purpose of visit
4.1 Leisure, recreation and holidays ('000) .. ..4.2 Business and professional ('000) .. ..4.3 Other ('000) .. ..
Accommodation
5.1 Overnight stays in hotels and similar establishments ('000) 17,035 17,8385.2 Guests in hotels and similar establishments ('000) 5,781 6,0985.3 Overnight stays in all types of accommodation establishments ('000) 20,090 20,6105.4 Average length of stay of non-resident tourists in all accommodation
establishments Nights 3.10 3.09
6.1 Tourism expenditure in the country US$ Mn 6,359 7,4966.2 "Travel" (b) US$ Mn 5,541 6,6376.3 "Passenger transport" (b) US$ Mn 818 859
DOMESTIC TOURISM
Accommodation
7.1 Overnight stays in hotels and similar establishments ('000) 8,854 9,2067.2 Guests in hotels and similar establishments ('000) 3,595 3,7957.3 Overnight stays in all types of accommodation establishments ('000) 21,357 20,2217.4 Average length of stay of resident tourists in all accommodation
establishments Nights 3.40 3.22
OUTBOUND TOURISM
8.1 Departures ('000) .. ..
8.2 Tourism expenditure in other countries US$ Mn 2,874 3,7718.3 "Travel" (b) US$ Mn 2,765 3,6478.4 "Passenger transport" (b) US$ Mn 109 124
TOURISM INDUSTRIES
Hotels and similar establishments
9.1 Number of rooms Units 101,563 106,9079.2 Number of bed-places Units 236,104 248,0779.3 Occupancy rate Percent 35.80 35.809.4 Average length of stay Nights 2.80 2.70
(a) As in the UNWTO Compendium of Tourism Statistics(b) Balance of Payments items: 6.1 to 6.3 correspond to the "Credit" side (and are receipts for the country) while 8.2 to 8.4 correspond to the "Debit" side (and are expenditures in other countries).

131
General comments (country notes) (1.2,2.1-2.4) Non-resident tourists staying in all types of accommodation establishments. Sources: (1.2-5.4,7.1-7.4,9.1-9.4) Ministry for Regional Development; (6.1-6.3,8.2-8.4) International Monetary Fund. Balance of Payments items (IMF notes) Transportation For 1993–2003, the CNB collected data on air transport of goods and passengers directly from transportation companies. For other kinds of transport, the data were based on the commercial banks’ records. Additional data were required from companies involved with transporting natural gas through the territory of the Czech Republic to Western Europe (credit) and transporting gas and oil through the Slovak Republic to the Czech Republic (debit). For data on freight services connected with exports and included in the contractual export price, the CNB made estimates from customs declarations and reported them under transportation–credits. The cost of transportation for imports, when included in the import price, remained part of the trade balance with a debit entry. A new system for collecting data on transport services via the CZSO is used from the first quarter of 2007. Data from a CZSO pilot survey-based project have been used for a 2004–06 revision. Travel For 1993–98, the CNB compiled the travel item using data the CZSO provided on the number of travelers; the CZSO obtained the information from police on the arrivals of foreign visitors and on the trips of Czech residents abroad. For average expenditures by foreigners during their stay in the Czech Republic and of Czech tourists during their trips abroad, the CNB based estimates on regular inquiries at selected border crossings. The estimates were also based on information from the banking sector on purchases of Czech currency by nonresidents and foreign currency by residents, on the use of credit and payment cards, and on the receipts and expenditures of hotels and travel agencies. Since 1999, the banking statistics, complemented by the CZSO survey of travelers at accommodation establishments, have been the main source of information used to compile the travel item. From 1998 onwards, CNB has supplemented the travel data with data on personal expenditures on goods and services by foreigners in the Czech Republic and Czechs employed abroad for less than one year. Starting from 2001, the CNB produces data showing the split between business and personal travel.
Basic macroeconomic aggregates (c)
CZ
E
2006
€
Millions
• 7,648
• 4,184
• 3,464
• 2,475
• 2,161
• 2,998
• 3,492
• 114,605
• 86,863
• 82,941
• 5,047,221
Inbound tourism consumption
Domestic tourism consumption
Imports of goods and services
Outbound tourism consumptionGross value added of tourism industriesTourism direct gross value added b.p.
Exports of goods and services
Internal tourism consumption
Tourism direct gross domestic product p.p
Total jobs
Comments
Tab
le 1
. B
asic
ag
gre
ga
tes
Year
Currency
Units
Gross domest ic product (GDP p.p.)
(c) These data are the same as those reproduced in T.1. of Chapter 3. Selected aggregates and tables of results

132
DENMARK (a)
Units2006
(TSA latest reference year)
2007
INBOUND TOURISM
Arrivals
1.1 Visitors ('000) 22,333 22,5351.2 Tourists (overnight visitors) ('000) 4,653 4,6811.3 Same-day visitors ('000) 17,306 17,3061.4 Cruise passengers ('000) 374 548
Arrivals by region
2.1 Africa ('000) .. ..2.2 Americas ('000) 160 1402.3 Europe ('000) 4,273 4,3252.4 East Asia and the Pacific ('000) 110 1032.5 South Asia ('000) .. ..2.6 Middle East ('000) .. ..
Arrivals by means of transport used
3.1 Air ('000) .. ..3.2 Rail ('000) .. ..3.3 Road ('000) .. ..3.4 Sea ('000) .. ..
Arrivals by purpose of visit
4.1 Leisure, recreation and holidays ('000) 21,115 21,3604.2 Business and professional ('000) 1,218 1,1754.3 Other ('000) .. ..
Accommodation
5.1 Overnight stays in hotels and similar establishments ('000) 5,021 4,8465.2 Guests in hotels and similar establishments ('000) 2,164 2,1005.3 Overnight stays in all types of accommodation establishments ('000) 23,429 23,9285.4 Average length of stay of non-resident tourists in all accommodation
establishments Nights 5.04 5.11
6.1 Tourism expenditure in the country US$ Mn .. ..6.2 "Travel" (b) US$ Mn 5,587 6,2186.3 "Passenger transport" (b) US$ Mn .. ..
DOMESTIC TOURISM
Accommodation
7.1 Overnight stays in hotels and similar establishments ('000) 6,352 6,9997.2 Guests in hotels and similar establishments ('000) 3,799 4,1867.3 Overnight stays in all types of accommodation establishments ('000) 23,203 24,5187.4 Average length of stay of resident tourists in all accommodation
establishments Nights 3.40 3.35
OUTBOUND TOURISM
8.1 Departures ('000) 6,129 6,564
8.2 Tourism expenditure in other countries US$ Mn .. ..8.3 "Travel" (b) US$ Mn 7,428 8,7918.4 "Passenger transport" (b) US$ Mn .. ..
TOURISM INDUSTRIES
Hotels and similar establishments
9.1 Number of rooms Units 43,446 44,0689.2 Number of bed-places Units 108,900 109,7789.3 Occupancy rate Percent 38.00 39.009.4 Average length of stay Nights .. ..
(a) As in the UNWTO Compendium of Tourism Statistics(b) Balance of Payments items: 6.1 to 6.3 correspond to the "Credit" side (and are receipts for the country) while 8.2 to 8.4 correspond to the "Debit" side (and are expenditures in other countries).

133
General comments (country notes) (1.2,2.2-2.4) Non-resident tourists staying in all types of accommodation establishments; (1.2-5.3,7.1-7.3,8.1) New methodology from 2004 and 2006; (5.2,7.2) Hotels only; (9.1-9.3) Only hotels and holiday dwellings with 40 beds or more; (9.3) Bed-places; (10.1-10.3) This section includes only the “travel” item because the “passenger transport” item was not included in the data provided by the International Monetary Fund for the preparation of this edition of the Compendium. Sources: (1.1-5.4,7.1-7.4,8.1,9.1-9.3) (6.2,8.3/2005-2007) VisitDenmark; (6.2,8.3/2003/2004) International Monetary Fund.
Basic macroeconomic aggregates (c)
DN
K
2006
DKK
Millions
• 71,800
• 36,417
• 35,383
•
• 99,636
• 33,831
•
• 1,658,917
• 557,658
• 557,375
• 2,821,641
Inbound tourism consumption
Domestic tourism consumption
Imports of goods and services
Outbound tourism consumption
Gross value added of tourism industriesTourism direct gross value added b.p.
Exports of goods and services
Internal tourism consumption
Tourism direct gross domestic product p.p
Total jobs
Comments
Tab
le 1
. B
asic
ag
gre
gat
es
Year
Currency
Units
Gross domestic product (GDP p.p.)
(c) These data are the same as those reproduced in T.1. of Chapter 3. Selected aggregates and tables of results

134
ECUADOR (a)
Units2003
(TSA latest reference year)
2007
INBOUND TOURISM
Arrivals
1.1 Visitors ('000) 761 9371.2 Tourists (overnight visitors) ('000) .. ..1.3 Same-day vis itors ('000) .. ..1.4 Cruise passengers ('000) .. ..
Arrivals by region
2.1 Africa ('000) 2 12.2 Americas ('000) 617 7302.3 Europe ('000) 124 1802.4 East Asia and the Pacific ('000) 18 252.5 South Asia ('000) .. ..2.6 Middle East ('000) .. ..
Arrivals by means of transport used
3.1 Air ('000) 450 6393.2 Rail ('000) .. ..3.3 Road ('000) 306 2913.4 Sea ('000) 5 7
Arrivals by purpose of visit
4.1 Leisure, recreation and holidays ('000) .. ..4.2 Business and professional ('000) .. ..4.3 Other ('000) .. ..
Accommodation
5.1 Overnight stays in hotels and similar establishments ('000) .. ..5.2 Guests in hotels and similar establishments ('000) .. ..5.3 Overnight stays in all types of accommodation establishments ('000) .. ..5.4 Average length of stay of non-resident tourists in all accommodation
establishments Nights .. ..
6.1 Tourism expenditure in the country US$ Mn 408 6266.2 "Travel" (b) US$ Mn 406 6236.3 "Passenger transport" (b) US$ Mn 2 3
DOMESTIC TOURISM
Accommodation
7.1 Overnight stays in hotels and similar establishments ('000) .. ..7.2 Guests in hotels and similar establishments ('000) .. ..7.3 Overnight stays in all types of accommodation establishments ('000) .. ..7.4 Average length of stay of resident tourists in all accommodation
establishments Nights .. ..
OUTBOUND TOURISM
8.1 Departures ('000) 613 801
8.2 Tourism expenditure in other countries US$ Mn 500 7338.3 "Travel" (b) US$ Mn 354 5048.4 "Passenger transport" (b) US$ Mn 146 229
TOURISM INDUSTRIES
Hotels and similar establishments
9.1 Number of rooms Units 38,237 52,1279.2 Number of bed-places Units 86,466 112,5359.3 Occupancy rate Percent .. ..9.4 Average length of stay Nights .. ..
(a) As in the UNWTO Compendium of Tourism Statistics(b) Balance of Payments items: 6.1 to 6.3 correspond to the "Credit" side (and are receipts for the country) while 8.2 to 8.4 correspond to the "Debit" side (and are expenditures in other countries).

135
General comments (country notes) (1.1) Excluding nationals residing abroad. Sources: (1.1-3.4,8.1,9.1,9.2) "Ministerio de Turismo"; (6.1-6.3,8.2-8.4) International Monetary Fund. Balance of Payments items (IMF notes) Transportation For credits and debits on sea transport, the CBE uses its quarterly and annual surveys of shipping companies operating in Ecuador. To supplement that data, it uses information on passengers and cargo from the Merchant Marine and Coastal Administration (Dirección de la Marina Mercante y del Litoral, DIMERC)—the government regulatory authority for maritime traffic in Ecuador. For air transport, the CBE uses information supplied by the Civil Aviation Administration (Dirección General de Aviación Civil, DAC). The CBE also obtains data from its merchandise trade database, containing information about f.o.b. and c.i.f. goods imports. Travel The National Migration and Aliens Office (Dirección Nacional de Migración y Extranjería) supplies data on inbound and outbound tourism, obtained through nationwide surveys based on type of visa and place of entry/exit (ports and airports). Only nonimmigrant visas are considered for balance of payments purposes. These sources will be supplemented by surveys of hotels, travel agencies, etc. to be carried out by the Ministry of Tourism. For travel expenditures, the CBE estimates data from information derived from surveys on travelers and hotels on the length of stay and type of accommodation. The CBE applies the estimated average daily expenditure to the number of visitors recorded.
Basic macroeconomic aggregates (c)
EC
U
2003
US $
Thousands
• 619,096
• 1,401,551
• 589,213
• 1,124,120
•
• 1,164,801
• 27,087,919
• 7,329,470
• 7,992,678
• 67.1
•
Inbound tourism consumption
Domestic tourism consumption
Imports of goods and services
Outbound tourism consumptionGross value added of tourism industriesTourism direct gross value added b.p.
Exports of goods and services
Internal tourism consumption
Tourism direct gross domestic product p.p
Total jobs
Comments
Tab
le 1
. B
asic
ag
gre
ga
tes
Year
Currency
Units
Gross domest ic product (GDP p.p.)
(c) These data are the same as those reproduced in T.1. of Chapter 3. Selected aggregates and tables of results

136
EGYPT (a)
Units2007
(TSA latest reference year)
INBOUND TOURISM
Arrivals
1.1 Visitors ('000) 11,0911.2 Tourists (overnight visitors) ('000) 10,6101.3 Same-day vis itors ('000) 4811.4 Cruise passengers ('000) ..
Arrivals by region
2.1 Africa ('000) 3872.2 Americas ('000) 4302.3 Europe ('000) 7,9372.4 East Asia and the Pacific ('000) 5262.5 South Asia ('000) 1062.6 Middle East ('000) 1,687
Arrivals by means of transport used
3.1 Air ('000) 9,3953.2 Rail ('000) ..3.3 Road ('000) 9063.4 Sea ('000) 790
Arrivals by purpose of visit
4.1 Leisure, recreation and holidays ('000) 10,3664.2 Business and professional ('000) 1594.3 Other ('000) 85
Accommodation
5.1 Overnight stays in hotels and similar establishments ('000) 111,4665.2 Guests in hotels and similar establishments ('000) ..5.3 Overnight stays in all types of accommodation establishments ('000) ..5.4 Average length of stay of non-resident tourists in all accommodation
establishments Nights 10.00
6.1 Tourism expenditure in the country US$ Mn 10,3276.2 "Travel" (b) US$ Mn 9,3036.3 "Passenger transport" (b) US$ Mn 1,024
DOMESTIC TOURISM
Accommodation
7.1 Overnight stays in hotels and similar establishments ('000) ..7.2 Guests in hotels and similar establishments ('000) ..7.3 Overnight stays in all types of accommodation establishments ('000) ..7.4 Average length of stay of resident tourists in all accommodation
establishments Nights ..
OUTBOUND TOURISM
8.1 Departures ('000) ..
8.2 Tourism expenditure in other countries US$ Mn 2,8868.3 "Travel" (b) US$ Mn 2,4468.4 "Passenger transport" (b) US$ Mn 440
TOURISM INDUSTRIES
Hotels and similar establishments
9.1 Number of rooms Units 190,1919.2 Number of bed-places Units 380,3829.3 Occupancy rate Percent 63.009.4 Average length of stay Nights 10.00
(a) As in the UNWTO Compendium of Tourism Statistics(b) Balance of Payments items: 6.1 to 6.3 correspond to the "Credit" side (and are receipts for the country) while 8.2 to 8.4 correspond to the "Debit" side (and are expenditures in other countries).
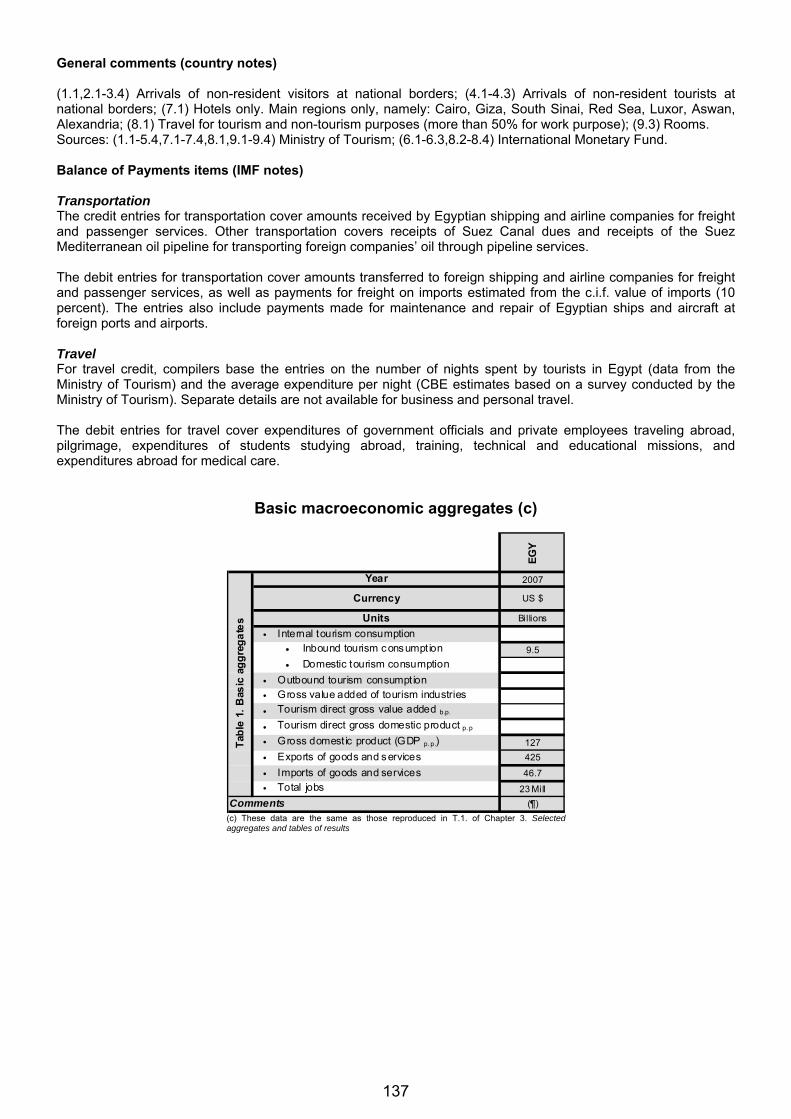
137
General comments (country notes) (1.1,2.1-3.4) Arrivals of non-resident visitors at national borders; (4.1-4.3) Arrivals of non-resident tourists at national borders; (7.1) Hotels only. Main regions only, namely: Cairo, Giza, South Sinai, Red Sea, Luxor, Aswan, Alexandria; (8.1) Travel for tourism and non-tourism purposes (more than 50% for work purpose); (9.3) Rooms. Sources: (1.1-5.4,7.1-7.4,8.1,9.1-9.4) Ministry of Tourism; (6.1-6.3,8.2-8.4) International Monetary Fund. Balance of Payments items (IMF notes) Transportation The credit entries for transportation cover amounts received by Egyptian shipping and airline companies for freight and passenger services. Other transportation covers receipts of Suez Canal dues and receipts of the Suez Mediterranean oil pipeline for transporting foreign companies’ oil through pipeline services. The debit entries for transportation cover amounts transferred to foreign shipping and airline companies for freight and passenger services, as well as payments for freight on imports estimated from the c.i.f. value of imports (10 percent). The entries also include payments made for maintenance and repair of Egyptian ships and aircraft at foreign ports and airports. Travel For travel credit, compilers base the entries on the number of nights spent by tourists in Egypt (data from the Ministry of Tourism) and the average expenditure per night (CBE estimates based on a survey conducted by the Ministry of Tourism). Separate details are not available for business and personal travel. The debit entries for travel cover expenditures of government officials and private employees traveling abroad, pilgrimage, expenditures of students studying abroad, training, technical and educational missions, and expenditures abroad for medical care.
Basic macroeconomic aggregates (c)
EG
Y
2007
US $
Billions
•• 9.5
•
••
•
•• 127
• 425
• 46.7
• 23 Mill
(¶)
Inbound tourism consumption
Domestic tourism consumption
Imports of goods and services
Outbound tourism consumptionGross value added of tourism industriesTourism direct gross value added b.p.
Exports of goods and services
Internal tourism consumption
Tourism direct gross domestic product p.p
Total jobs
Comments
Tab
le 1
. B
asic
ag
gre
ga
tes
Year
Currency
Units
Gross domest ic product (GDP p.p.)
(c) These data are the same as those reproduced in T.1. of Chapter 3. Selected aggregates and tables of results

138
FINLAND (a)
Units2006
(TSA latest reference year)
2007
INBOUND TOURISM
Arrivals
1.1 Visitors ('000) 5,345 5,7361.2 Tourists (overnight visitors) ('000) 3,375 3,5191.3 Same-day vis itors ('000) 1,970 2,2171.4 Cruise passengers ('000) .. ..
Arrivals by region
2.1 Africa ('000) 13 112.2 Americas ('000) 167 1742.3 Europe ('000) 4,891 5,2052.4 East Asia and the Pacific ('000) 262 3122.5 South Asia ('000) 8 222.6 Middle East ('000) 4 12
Arrivals by means of transport used
3.1 Air ('000) 1,999 2,0493.2 Rail ('000) 79 1103.3 Road ('000) 1,674 1,8833.4 Sea ('000) 1,593 1,694
Arrivals by purpose of visit
4.1 Leisure, recreation and holidays ('000) 2,189 2,3084.2 Business and professional ('000) 1,607 1,6964.3 Other ('000) 1,549 1,732
Accommodation
5.1 Overnight stays in hotels and similar establishments ('000) 4,339 4,6355.2 Guests in hotels and similar establishments ('000) 2,045 2,1885.3 Overnight stays in all types of accommodation establishments ('000) 5,004 5,3285.4 Average length of stay of non-resident tourists in all accommodation
establishments Nights 2.16 2.16
6.1 Tourism expenditure in the country US$ Mn 3,509 3,8906.2 "Travel" (b) US$ Mn 2,380 2,8226.3 "Passenger transport" (b) US$ Mn 1,129 1,068
DOMESTIC TOURISM
Accommodation
7.1 Overnight stays in hotels and similar establishments ('000) 10,676 11,1827.2 Guests in hotels and similar establishments ('000) 6,203 6,5207.3 Overnight stays in all types of accommodation establishments ('000) 13,165 13,7087.4 Average length of stay of resident tourists in all accommodation
establishments Nights 1.80 1.80
OUTBOUND TOURISM
8.1 Departures ('000) 5,756 5,749
8.2 Tourism expenditure in other countries US$ Mn 4,094 4,6328.3 "Travel" (b) US$ Mn 3,424 3,9868.4 "Passenger transport" (b) US$ Mn 670 646
TOURISM INDUSTRIES
Hotels and similar establishments
9.1 Number of rooms Units 54,936 54,7319.2 Number of bed-places Units 119,045 118,8889.3 Occupancy rate Percent 49.90 51.609.4 Average length of stay Nights 1.82 1.82
(a) As in the UNWTO Compendium of Tourism Statistics(b) Balance of Payments items: 6.1 to 6.3 correspond to the "Credit" side (and are receipts for the country) while 8.2 to 8.4 correspond to the "Debit" side (and are expenditures in other countries).

139
General comments (country notes) (1.1,2.1-4.3) Arrivals of non-resident visitors at national borders. Border Survey; (1.2) Arrivals of non-resident tourists at national borders; (5.1-5.3,7.1-7.3) Due to a change in the methodology, data for 2004 are not comparable to previous years; (8.1) Overnight trips abroad, including cruises abroad with overnight on board only. Sources: (1.1-5.4,7.1-7.4,8.1,9.1-9.4) Tourism Statistics - Statistics Finland; (6.1-6.3,8.2-8.4) International Monetary Fund. Balance of Payments items (IMF notes) Transportation This category covers freight and passenger services by all modes of transport and port services. For sea transport, the BOF derives data from a quarterly survey of shipping companies; the survey seeks information on freight earnings from foreign traffic, passenger transport, and port expenditures abroad. For the estimates of freight that are deducted from imports in the trade statistics on the debit side (the cif-fob adjustment), the BOF derives the data from a survey conducted by the National Board of Customs. For air transport and railway traffic, the BOF obtains data from Finnair, the National Board of Aviation, and the State Railways, respectively. Travel From 1999 onward, the data are based on border interviews and other tourism statistics conducted and compiled by Statistics Finland. Until 1998, data were derived from settlements reported by domestic banks; they included purchases of foreign currency by residents at home and abroad and sales of Finnish markkas to nonresidents in Finland and abroad. In addition, an estimate of foreign exchange transactions by Finnish residents abroad was added to travel income and expenditure. Other sources of information on travel included the use of travelers’ checks and credit cards.
Basic macroeconomic aggregates (c)
FIN
2006
€
Millions
• 10,233
• 2,788
• 5,293
•• 5,572
• (¶)
• (¶)
• 167,041
• 75,489
• 67,195
• (¶)
(¶)
Inbound tourism consumption
Domestic tourism consumption
Imports of goods and services
Outbound tourism consumptionGross value added of tourism industriesTourism direct gross value added b.p.
Exports of goods and services
Internal tourism consumption
Tourism direct gross domestic product p.p
Total jobs
Comments
Tab
le 1
. B
asic
ag
gre
ga
tes
Year
Currency
Units
Gross domest ic product (GDP p.p.)
(c) These data are the same as those reproduced in T.1. of Chapter 3. Selected aggregates and tables of results

140
FRANCE (a)
Units2005
(TSA latest reference year)
2007
INBOUND TOURISM
Arrivals
1.1 Visitors ('000) 189,608 195,9011.2 Tourists (overnight visitors) ('000) 75,908 81,9401.3 Same-day visitors ('000) 113,700 113,9611.4 Cruise passengers ('000) .. ..
Arrivals by region
2.1 Africa ('000) 1,252 1,3842.2 Americas ('000) 5,086 5,8292.3 Europe ('000) 66,029 71,1552.4 East Asia and the Pacific ('000) 3,192 3,0042.5 South Asia ('000) .. ..2.6 Middle East ('000) 349 568
Arrivals by means of transport used
3.1 Air ('000) 16,297 20,5133.2 Rail ('000) 4,335 4,8343.3 Road ('000) 47,783 48,7483.4 Sea ('000) 7,495 7,845
Arrivals by purpose of visit
4.1 Leisure, recreation and holidays ('000) 53,475 59,3404.2 Business and professional ('000) 9,074 8,6364.3 Other ('000) 13,361 13,964
Accommodation
5.1 Overnight stays in hotels and similar establishments ('000) 72,054 72,3915.2 Guests in hotels and similar establishments ('000) 34,806 33,2525.3 Overnight stays in all types of accommodation establishments ('000) 481,111 497,5305.4 Average length of stay of non-resident tourists in all accommodation
establishments Nights 6.34 6.10
6.1 Tourism expenditure in the country US$ Mn 52,150 63,6096.2 "Travel" (b) US$ Mn 43,942 54,1656.3 "Passenger transport" (b) US$ Mn 8,208 9,444
DOMESTIC TOURISM
Accommodation
7.1 Overnight stays in hotels and similar establishments ('000) 122,222 126,5367.2 Guests in hotels and similar establishments ('000) 72,587 74,8927.3 Overnight stays in all types of accommodation establishments ('000) 1,021,838 1,026,2107.4 Average length of stay of resident tourists in all accommodation
establishments Nights 4.90 4.80
OUTBOUND TOURISM
8.1 Departures ('000) 22,270 22,467
8.2 Tourism expenditure in other countries US$ Mn 37,546 44,5448.3 "Travel" (b) US$ Mn 30,458 36,7438.4 "Passenger transport" (b) US$ Mn 7,088 7,801
TOURISM INDUSTRIES
Hotels and similar establishments
9.1 Number of rooms Units 613,798 614,5329.2 Number of bed-places Units 1,227,596 1,229,0649.3 Occupancy rate Percent 59.10 62.009.4 Average length of stay Nights 1.81 2.18
(a) As in the UNWTO Compendium of Tourism Statistics(b) Balance of Payments items: 6.1 to 6.3 correspond to the "Credit" side (and are receipts for the country) while 8.2 to 8.4 correspond to the "Debit" side (and are expenditures in other countries).

141
General comments (country notes) (1.1-4.3,5.3/2003) Estimates based on surveys at national borders (1996-2000); (1.1-4.3,5.3/2004-2007) Non resident visitor survey (EVE); (4.1) Holidays and visits to friends, relatives; (4.2) Business, pleasure; (4.3) Transit and other purposes; (5.1,5.2,7.1,7.2,9.1-9.4) 2003: only hotels 0 to 4 stars. 2004-2007: including unclassified hotels. 2006: renewal of the survey, data not comparable with previous years; (5.3,7.3) All types of accommodation; (5.4) Inbound average length of stay; (7.1-7.4/2005-2007) Resident population aged 15 years and above; (9.3) Net room occupancy rate. 2007: Provisional data. Sources: (1.1-5.4,7.1-7.4,8.1,9.1-9.4) "Bureau des études, des statistiques et des comptes économiques - Direction du Tourisme"; (6.2,8.3) International Monetary Fund; (6.3,8.4) "Banque de France".
Basic macroeconomic aggregates (c)
FR
A
2005
€
Billions
• 145.1
• 43.4
• 101.7
• 30.9
•
•
• 64.0
• 1,726.1
• 449.8
• 464,6
• 24,775
(¶)
Inbound tourism consumption
Domestic tourism consumption
Imports of goods and services
Outbound tourism consumption
Gross value added of tourism industriesTourism direct gross value added b.p.
Exports of goods and services
Internal tourism consumption
Tourism direct gross domestic product p.p
Total jobs
Comments
Tab
le 1
. B
asic
ag
gre
gat
es
Year
Currency
Units
Gross domestic product (GDP p.p.)
(c) These data are the same as those reproduced in T.1. of Chapter 3. Selected aggregates and tables of results

142
HONDURAS (a)
Units2005
(TSA latest reference year)
2007
INBOUND TOURISM
Arrivals
1.1 Visitors ('000) 1,118 1,3371.2 Tourists (overnight visitors) ('000) 673 8311.3 Same-day vis itors ('000) 445 5051.4 Cruise passengers ('000) 277 297
Arrivals by region
2.1 Africa ('000) 0.2 0.22.2 Americas ('000) 610 7852.3 Europe ('000) 53 382.4 East Asia and the Pacific ('000) 8 72.5 South Asia ('000) 0.3 0.32.6 Middle East ('000) 0.1 0.1
Arrivals by means of transport used
3.1 Air ('000) 301 3833.2 Rail ('000) .. ..3.3 Road ('000) 348 4203.4 Sea ('000) 23 28
Arrivals by purpose of visit
4.1 Leisure, recreation and holidays ('000) 309 2684.2 Business and professional ('000) 102 2504.3 Other ('000) 262 313
Accommodation
5.1 Overnight stays in hotels and similar establishments ('000) .. ..5.2 Guests in hotels and similar establishments ('000) .. ..5.3 Overnight stays in all types of accommodation establishments ('000) .. ..5.4 Average length of stay of non-resident tourists in all accommodation
establishments Nights 10.80 12.70
6.1 Tourism expenditure in the country US$ Mn 466 5596.2 "Travel" (b) US$ Mn 464 5576.3 "Passenger transport" (b) US$ Mn 2 2
DOMESTIC TOURISM
Accommodation
7.1 Overnight stays in hotels and similar establishments ('000) .. ..7.2 Guests in hotels and similar establishments ('000) .. ..7.3 Overnight stays in all types of accommodation establishments ('000) .. ..7.4 Average length of stay of resident tourists in all accommodation
establishments Nights .. 5.60
OUTBOUND TOURISM
8.1 Departures ('000) 296 315
8.2 Tourism expenditure in other countries US$ Mn 327 3858.3 "Travel" (b) US$ Mn 262 3068.4 "Passenger transport" (b) US$ Mn 65 79
TOURISM INDUSTRIES
Hotels and similar establishments
9.1 Number of rooms Units 20,453 19,6799.2 Number of bed-places Units 29,032 31,6609.3 Occupancy rate Percent .. 55.009.4 Average length of stay Nights .. 4.19
(a) As in the UNWTO Compendium of Tourism Statistics(b) Balance of Payments items: 6.1 to 6.3 correspond to the "Credit" side (and are receipts for the country) while 8.2 to 8.4 correspond to the "Debit" side (and are expenditures in other countries).

143
General comments (country notes) (1.2,2.1-4.3) Arrivals of non-resident tourists at national borders. Sources: (1.1-5.4,8.1,9.1-9.4) "Instituto Hondureño de Turismo" (6.1-6.3,8.2-8.4) International Monetary Fund. Balance of Payments items (IMF notes) Transportation This category covers freight and passenger services by all modes of transport, plus port services. The Economic Research Department derives the credit entries for transportation services from information provided by airport and seaport authorities and annual surveys of Honduran airline and shipping companies. It obtains debit entries for freight from information on freight and insurance reported in customs declaration forms, received monthly. The Economic Research Department obtains debit entries for passenger transportation by a survey of foreign airlines. Travel The department bases credit and debit entries for travel on surveys conducted by the Tourism Institute and the General Department of Migratory Policy. Estimates are compiled by combining the number of foreign visitors with estimates of average expenditures.
Basic macroeconomic aggregates (c)
HN
D
2005
Lempiras
Millions
• 20,589
• 9,359
• 11,230
• 6,078
• 9,741
•
•• 183,748
• 108,802
• 141,471
• 139,713
(¶)
Inbound tourism consumption
Domestic tourism consumption
Imports of goods and services
Outbound tourism consumptionGross value added of tourism industriesTourism direct gross value added b.p.
Exports of goods and services
Internal tourism consumption
Tourism direct gross domestic product p.p
Total jobs
Comments
Tab
le 1
. B
asic
ag
gre
ga
tes
Year
Currency
Units
Gross domest ic product (GDP p.p.)
(c) These data are the same as those reproduced in T.1. of Chapter 3. Selected aggregates and tables of results

144
INDIA (a)
Units2003
(TSA latest reference year)
2007
INBOUND TOURISM
Arrivals
1.1 Visitors ('000) 2,774 ..1.2 Tourists (overnight visitors) ('000) 2,726 5,0821.3 Same-day vis itors ('000) .. ..1.4 Cruise passengers ('000) 48 ..
Arrivals by region
2.1 Africa ('000) 89 ..2.2 Americas ('000) 540 ..2.3 Europe ('000) 942 ..2.4 East Asia and the Pacific ('000) 393 ..2.5 South Asia ('000) 667 ..2.6 Middle East ('000) 69 ..
Arrivals by means of transport used
3.1 Air ('000) 2,265 ..3.2 Rail ('000) .. ..3.3 Road ('000) 447 ..3.4 Sea ('000) 14 ..
Arrivals by purpose of visit
4.1 Leisure, recreation and holidays ('000) 2,538 ..4.2 Business and professional ('000) 188 ..4.3 Other ('000) .. ..
Accommodation
5.1 Overnight stays in hotels and similar establishments ('000) .. ..5.2 Guests in hotels and similar establishments ('000) .. ..5.3 Overnight stays in all types of accommodation establishments ('000) .. ..5.4 Average length of stay of non-resident tourists in all accommodation
establishments Nights .. ..
6.1 Tourism expenditure in the country US$ Mn 4,560 ..6.2 "Travel" (b) US$ Mn 4,463 10,7296.3 "Passenger transport" (b) US$ Mn 97 ..
DOMESTIC TOURISM
Accommodation
7.1 Overnight stays in hotels and similar establishments ('000) .. ..7.2 Guests in hotels and similar establishments ('000) .. ..7.3 Overnight stays in all types of accommodation establishments ('000) .. ..7.4 Average length of stay of resident tourists in all accommodation
establishments Nights .. ..
OUTBOUND TOURISM
8.1 Departures ('000) 5,351 9,780
8.2 Tourism expenditure in other countries US$ Mn 4,385 ..8.3 "Travel" (b) US$ Mn 3,585 ..8.4 "Passenger transport" (b) US$ Mn 800 ..
TOURISM INDUSTRIES
Hotels and similar establishments
9.1 Number of rooms Units 91,720 ..9.2 Number of bed-places Units 183,440 ..9.3 Occupancy rate Percent 60.70 ..9.4 Average length of stay Nights .. ..
(a) As in the UNWTO Compendium of Tourism Statistics(b) Balance of Payments items: 6.1 to 6.3 correspond to the "Credit" side (and are receipts for the country) while 8.2 to 8.4 correspond to the "Debit" side (and are expenditures in other countries).

145
General comments (country notes) (1.2,2.1-4.2) Arrivals of non-resident tourists at national borders; excluding nationals residing abroad; (4.1) Including other purposes; (8.1) Departures of nationals only, irrespective of purpose; (9.1,9.2) In classified hotels; (9.3) Rooms. Sources: (1.1-4.2,8.1,9.1-9.3) Market Research Division - Government of India; (6.1-6.3,8.2-8.4) International Monetary Fund. Balance of Payments items (IMF notes) Transportation This category covers all modes of transport and port services; RBI bases the data mainly on the receipts and payments reported by the banks in respect of transportation items. In addition to the foreign exchange transactions records, a source is the survey of unclassified receipts. These sources are supplemented by information collected from major airline and shipping companies in respect of payments from foreign accounts. The RBI also uses a benchmark Survey of Freight and Insurance on Exports to estimate freight receipts on account of exports. Travel For travel, the RBI obtains data from foreign exchange transactions records, supplemented by information from the surveys of unclassified receipts. The estimates of travel receipts also use the information on foreign tourist arrivals and expenditure, received from the Ministry of Tourism, as a cross-check of the foreign exchange transactions and survey data.
Basic macroeconomic aggregates (c)
IND
2002-03
NR
Millions
• 1,728,540
• 314,080
• 1,414,460
• 52,660
• 2,223,560
• 624,360
• 22,494,930
• 24,695,640
• 3,758,730
• 3,852,710
• 468.7
(¶)
Inbound tourism consumption
Domestic tourism consumption
Imports of goods and services
Outbound tourism consumptionGross value added of tourism industriesTourism direct gross value added b.p.
Exports of goods and services
Internal tourism consumption
Tourism direct gross domestic product p.p
Total jobs
Comments
Tab
le 1
. B
asic
ag
gre
ga
tes
Year
Currency
Units
Gross domest ic product (GDP p.p.)
(c) These data are the same as those reproduced in T.1. of Chapter 3. Selected aggregates and tables of results

146
INDONESIA (a)
Units2007
(TSA latest reference year)
INBOUND TOURISM
Arrivals
1.1 Visitors ('000) 5,5061.2 Tourists (overnight visitors) ('000) ..1.3 Same-day visitors ('000) ..1.4 Cruise passengers ('000)
Arrivals by region 282.1 Africa ('000) 2202.2 Americas ('000) 7972.3 Europe ('000) 4,3162.4 East Asia and the Pacific ('000) 902.5 South Asia ('000) 552.6 Middle East ('000)
Arrivals by means of transport used ..3.1 Air ('000) ..3.2 Rail ('000) ..3.3 Road ('000) ..3.4 Sea ('000)
Arrivals by purpose of visit ..4.1 Leisure, recreation and holidays ('000) ..4.2 Business and professional ('000) ..4.3 Other ('000)
Accommodation ..5.1 Overnight stays in hotels and similar establishments ('000) ..5.2 Guests in hotels and similar establishments ('000) ..5.3 Overnight stays in all types of accommodation establishments ('000) 35.4 Average length of stay of non-resident tourists in all accommodation
establishments Nights5833
6.1 Tourism expenditure in the country US$ Mn 5,3466.2 "Travel" (b) US$ Mn 4876.3 "Passenger transport" (b) US$ Mn
DOMESTIC TOURISM
Accommodation ..7.1 Overnight stays in hotels and similar establishments ('000) 13,1137.2 Guests in hotels and similar establishments ('000) ..7.3 Overnight stays in all types of accommodation establishments ('000) 27.4 Average length of stay of resident tourists in all accommodation
establishments Nights
OUTBOUND TOURISM ..
8.1 Departures ('000) 6,120
8.2 Tourism expenditure in other countries US$ Mn 4,4468.3 "Travel" (b) US$ Mn 1,6748.4 "Passenger transport" (b) US$ Mn
TOURISM INDUSTRIES
Hotels and similar establishments ..9.1 Number of rooms Units ..9.2 Number of bed-places Units 479.3 Occupancy rate Percent ..9.4 Average length of stay Nights ..
(a) As in the UNWTO Compendium of Tourism Statistics(b) Balance of Payments items: 6.1 to 6.3 correspond to the "Credit" side (and are receipts for the country) while 8.2 to 8.4 correspond to the "Debit" side (and are expenditures in other countries).

147
General comments (country notes) (5.2,5.4,7.2,7.4,9.3,9.4) Classified hotels only; (9.1,9.2) All forms of commercial accommodation; (9.3) Rooms. Sources: (1.2-5.4,7.2,7.4,8.1,9.1-9.4) Ministry of Culture and Tourism and BPS Statistics Indonesia; (6.1-6.3,8.2-8.4) International Monetary Fund.
Basic macroeconomic aggregates (c)
IDN
•
•
•
•
•
•
•
•
•
•
•(¶)
Inbound tourism consumption
Domestic tourism consumption
Imports of goods and services
Outbound tourism consumption
Gross value added of tourism industriesTourism direct gross value added b.p.
Exports of goods and services
Internal tourism consumption
Tourism direct gross domestic product p.p
Total jobs
Comments
Tab
le 1
. B
asic
ag
gre
gat
esYear
Currency
Units
Gross domestic product (GDP p.p.)
(c) These data are the same as those reproduced in T.1. of Chapter 3. Selected aggregates and tables of results

148
IRELAND (a)
Units2000
(TSA latest reference year)
2007
INBOUND TOURISM
Arrivals
1.1 Visitors ('000) .. ..1.2 Tourists (overnight visitors) ('000) 6,646 8,3321.3 Same-day vis itors ('000) 345 ..1.4 Cruise passengers ('000) .. ..
Arrivals by region
2.1 Africa ('000) 27 392.2 Americas ('000) 1,068 1,0992.3 Europe ('000) 5,329 6,9462.4 East Asia and the Pacific ('000) 222 2492.5 South Asia ('000) .. ..2.6 Middle East ('000) .. ..
Arrivals by means of transport used
3.1 Air ('000) 4,450 ..3.2 Rail ('000) .. ..3.3 Road ('000) 650 ..3.4 Sea ('000) 1,545 ..
Arrivals by purpose of visit
4.1 Leisure, recreation and holidays ('000) 2,898 ..4.2 Business and professional ('000) 1,829 ..4.3 Other ('000) 1,919 ..
Accommodation
5.1 Overnight stays in hotels and similar establishments ('000) 16,903 ..5.2 Guests in hotels and similar establishments ('000) 5,491 ..5.3 Overnight stays in all types of accommodation establishments ('000) 21,516 ..5.4 Average length of stay of non-resident tourists in all accommodation
establishments Nights 7.30 ..
6.1 Tourism expenditure in the country US$ Mn 3,517 8,8636.2 "Travel" (b) US$ Mn 2,615 6,1406.3 "Passenger transport" (b) US$ Mn 902 2,723
DOMESTIC TOURISM
Accommodation
7.1 Overnight stays in hotels and similar establishments ('000) 6,786 ..7.2 Guests in hotels and similar establishments ('000) 2,773 ..7.3 Overnight stays in all types of accommodation establishments ('000) 20,703 ..7.4 Average length of stay of resident tourists in all accommodation
establishments Nights 3.80 ..
OUTBOUND TOURISM
8.1 Departures ('000) 3,783 ..
8.2 Tourism expenditure in other countries US$ Mn 2,626 8,8118.3 "Travel" (b) US$ Mn 2,525 8,6828.4 "Passenger transport" (b) US$ Mn 101 129
TOURISM INDUSTRIES
Hotels and similar establishments
9.1 Number of rooms Units 60,350 ..9.2 Number of bed-places Units .. ..9.3 Occupancy rate Percent 65.00 64.009.4 Average length of stay Nights .. ..
(a) As in the UNWTO Compendium of Tourism Statistics(b) Balance of Payments items: 6.1 to 6.3 correspond to the "Credit" side (and are receipts for the country) while 8.2 to 8.4 correspond to the "Debit" side (and are expenditures in other countries).

149
General comments (country notes) (1.2,2.3,3.3,4.1-4.3,5.4) Including tourists from North Ireland; (3.3) Including rail; (8.1) Including same-day visitors; (9.1) Excluding hostels; (9.3) Rooms, hotels only. Sources: (1.2-5.4,7.1-7.4,8.1,9.1-9.3) Fáilte Ireland; (6.1-6.3,8.2-8.4) International Monetary Fund. Balance of Payments items (IMF notes) Transportation Because merchandise imports have been valued on an f.o.b. basis since 1998, the freight element of the c.i.f. to f.o.b. adjustment on merchandise imports is now split and included under the transportation and insurance service headings. Apart from this, the CSO collects data primarily by means of quarterly inquiries to resident airline and shipping companies. Passenger fares paid by residents of Ireland to foreign transport companies generally cannot be distinguished and are instead included in the travel (debit) item. Disbursements in Irish ports and airports by foreign carriers, time charters, and other receipts from abroad by Irish carriers are included in the air and sea transport items. These data are collected from administrative sources. Travel Data are based on estimates of the number of travelers and their per capita expenditures, provided internally by the CSO’s Tourism and Travel Section. These estimates of the number of travelers cover those traveling by public carriers (based on information supplied by sea, air, and land transport companies operating in international traffic) and those traveling privately by road across the Northern Ireland border. Expenditures by Irish residents abroad and by foreign visitors to Ireland are estimated from information from the large sample survey of travelers (i.e., the Passenger Card Inquiry) conducted by the CSO, as well as information from CSO’s Household Travel Survey. See also information under Transportation above.
Basic macroeconomic aggregates (c)
IRL
2000
€
Millions
• 6,803.38
• 3,637.00
• 3,141.39
• 2,644.15
• 33,894.20
• 2,487.59
• 3,002.87
• 104,845
• 102,885
• 88,691
• 1,670,700
Inbound tourism consumption
Domestic tourism consumption
Imports of goods and services
Outbound tourism consumption
Gross value added of tourism industriesTourism direct gross value added b.p.
Exports of goods and services
Internal tourism consumption
Tourism direct gross domestic product p.p
Total jobs
Comments
Tab
le 1
. B
asic
ag
gre
gat
es
Year
Currency
Units
Gross domestic product (GDP p.p.)
(c) These data are the same as those reproduced in T.1. of Chapter 3. Selected aggregates and tables of results

150
ISRAEL (a)
Units1995
(TSA latest reference year)
2007
INBOUND TOURISM
Arrivals
1.1 Visitors ('000) 2,530 2,2941.2 Tourists (overnight visitors) ('000) 2,215 2,0671.3 Same-day vis itors ('000) .. 2011.4 Cruise passengers ('000) 318 26
Arrivals by region
2.1 Africa ('000) 57 662.2 Americas ('000) 582 6732.3 Europe ('000) 1,289 1,1682.4 East Asia and the Pacific ('000) 102 1092.5 South Asia ('000) 10 282.6 Middle East ('000) 152 13
Arrivals by means of transport used
3.1 Air ('000) 1,678 1,7473.2 Rail ('000) .. ..3.3 Road ('000) 515 3183.4 Sea ('000) 22 1
Arrivals by purpose of visit
4.1 Leisure, recreation and holidays ('000) 1,765 5374.2 Business and professional ('000) 354 2274.3 Other ('000) 95 1,303
Accommodation
5.1 Overnight stays in hotels and similar establishments ('000) 9,790 8,4065.2 Guests in hotels and similar establishments ('000) .. 2,7485.3 Overnight stays in all types of accommodation establishments ('000) 10,084 8,8605.4 Average length of stay of non-resident tourists in all accommodation
establishments Nights 16.10 14.00
6.1 Tourism expenditure in the country US$ Mn 3,491 3,7126.2 "Travel" (b) US$ Mn 2,993 3,0596.3 "Passenger transport" (b) US$ Mn 498 653
DOMESTIC TOURISM
Accommodation
7.1 Overnight stays in hotels and similar establishments ('000) 6,737 12,0737.2 Guests in hotels and similar establishments ('000) .. 5,1017.3 Overnight stays in all types of accommodation establishments ('000) 6,952 15,5227.4 Average length of stay of resident tourists in all accommodation
establishments Nights .. 3.00
OUTBOUND TOURISM
8.1 Departures ('000) 2,259 4,147
8.2 Tourism expenditure in other countries US$ Mn 2,626 4,2508.3 "Travel" (b) US$ Mn 2,120 3,2608.4 "Passenger transport" (b) US$ Mn 506 990
TOURISM INDUSTRIES
Hotels and similar establishments
9.1 Number of rooms Units 35,792 46,7889.2 Number of bed-places Units 75,100 128,3569.3 Occupancy rate Percent 60.30 51.809.4 Average length of stay Nights 3.20 2.61
(a) As in the UNWTO Compendium of Tourism Statistics(b) Balance of Payments items: 6.1 to 6.3 correspond to the "Credit" side (and are receipts for the country) while 8.2 to 8.4 correspond to the "Debit" side (and are expenditures in other countries).

151
General comments (country notes) (1.1) Arrivals of non-resident visitors at national borders; excluding nationals residing abroad; (1.2,2.1-4.3) Arrivals of non-resident tourists at national borders; excluding nationals residing abroad; (3.3) Including tourists' reentry after a visit of up to 7 days in Sinai; (3.4) Including US Navy personnel on courtesy visits; (4.3) Including visit friends and relatives and pilgrimage; (5.1) Tourist hotels and aparthotels; (6.2) Including the expenditures of foreign workers in Israel (US$ Million): 2003: 997 2004: 904 2005: 847 2006: 909 2007: 894 (9.3) Bed-occupancy in hotels and similar establishments open; (9.4) Inbound tourism in tourist hotels. Sources: (1.1-5.4,7.1-7.3,8.1,9.1-9.4) Ministry of Tourism; (6.1-6.3,8.2-8.4) International Monetary Fund. Balance of Payments items (IMF notes) Transportation The major sources for freight and transportation are Israeli companies that operate ships and aircraft on international routes, foreign shipping and aviation companies that operate in Israel, the Ports Authority in Israel, ship and aircraft repair companies, companies that supply food and bunker oil to ships and aircraft, and the Civil Aviation Service of the Ministry of Transport. Transactions include receipts resulting from the transport of cargo by foreign carriers temporarily leased by Israeli companies. The data also include receipts and payments by ships owned by Israeli subsidiaries under a foreign flag (convenience flag), operated by Israeli agents only. Some reports of Israeli shipping and aviation companies include a detailed breakdown of expenditures according to type of currency and not according to the location of the expenditures—in Israel or abroad. Compilers correct or adjust the item other expenditures in these reports (which includes information from other sources), such as the purchase of tickets for travel abroad by Israelis in foreign currency or the purchase in Israel of bunker oil in foreign currency. Beginning in 1971, repairs of Israeli ships and aircraft performed abroad by foreign insurance agents have been included in expenditures of Israeli shipping and aviation companies. At the same time, these expenditures have been recorded as income from insurance claims in the insurance item. Until 1971, this listing, as well as that included in the insurance item, was a net figure. Travel For estimation of credit entries, compilers use a semiannual survey of foreign tourists, conducted by the Ministry of Tourism and under the supervision of the Central Bureau of Statistics (CBS). The survey provides the average expenditure per tourist during each half year, while the total expenditure of foreign tourists is estimated according to the average expenditure and the total number of tourists leaving Israel each quarter. (This latter figure is obtained from the statistics of the CBS Demography Department.) Debits are estimated on the basis of a quarterly updated survey conducted by the CBS for 1997, regarding the average expenditure per tourist, and on current data on departures abroad of Israel residents, published by the CBS.
Basic macroeconomic aggregates (c)
ISR
2004
NIS
Millions
•
• 8,424
• 13,340
• 12,531
• 61,148
• 8,970
• 9,922
• 565,576
• 236,028
• 226,063
• 2,401
(¶)
Inbound tourism consumption
Domestic tourism consumption
Imports of goods and services
Outbound tourism consumption
Gross value added of tourism industries
Tourism direct gross value added b.p.
Exports of goods and services
Internal tourism consumption
Tourism direct gross domestic product p.p
Total jobs
Comments
Tab
le 1
. Bas
ic a
gg
reg
ates
Year
Currency
Units
Gross domestic product (GDP p.p.)
(c) These data are the same as those reproduced in T.1. of Chapter 3. Selected aggregates and tables of results

152
JAPAN (a)
Units2007
(TSA latest reference year)
INBOUND TOURISM
Arrivals
1.1 Visitors ('000) 8,3471.2 Tourists (overnight visitors) ('000) ..1.3 Same-day visitors ('000) ..1.4 Cruise passengers ('000) ..
Arrivals by region
2.1 Africa ('000) 202.2 Americas ('000) 1,0542.3 Europe ('000) 8982.4 East Asia and the Pacific ('000) 6,2682.5 South Asia ('000) 1032.6 Middle East ('000) 3
Arrivals by means of transport used
3.1 Air ('000) 8,4863.2 Rail ('000) ..3.3 Road ('000) ..3.4 Sea ('000) 666
Arrivals by purpose of visit
4.1 Leisure, recreation and holidays ('000) 5,9544.2 Business and professional ('000) 1,5764.3 Other ('000) 817
Accommodation
5.1 Overnight stays in hotels and similar establishments ('000) ..5.2 Guests in hotels and similar establishments ('000) ..5.3 Overnight stays in all types of accommodation establishments ('000) ..5.4 Average length of stay of non-resident tourists in all accommodation
establishments Nights 6.50
6.1 Tourism expenditure in the country US$ Mn 12,4226.2 "Travel" (b) US$ Mn 9,3456.3 "Passenger transport" (b) US$ Mn 3,077
DOMESTIC TOURISM
Accommodation
7.1 Overnight stays in hotels and similar establishments ('000) ..7.2 Guests in hotels and similar establishments ('000) ..7.3 Overnight stays in all types of accommodation establishments ('000) ..7.4 Average length of stay of resident tourists in all accommodation
establishments Nights ..
OUTBOUND TOURISM
8.1 Departures ('000) 17,295
8.2 Tourism expenditure in other countries US$ Mn 37,2618.3 "Travel" (b) US$ Mn 26,5118.4 "Passenger transport" (b) US$ Mn 10,750
TOURISM INDUSTRIES
Hotels and similar establishments
9.1 Number of rooms Units ..9.2 Number of bed-places Units ..9.3 Occupancy rate Percent ..9.4 Average length of stay Nights ..
(a) As in the UNWTO Compendium of Tourism Statistics(b) Balance of Payments items: 6.1 to 6.3 correspond to the "Credit" side (and are receipts for the country) while 8.2 to 8.4 correspond to the "Debit" side (and are expenditures in other countries).

153
General comments (country notes) (1.1,2.1-2.6,4.1-4.3) Arrivals of non-resident visitors at national borders; excluding nationals residing abroad; (3.1,3.4) Arrivals of non-resident visitors at national borders; including foreign residents in Japan; (5.4) Days; (6.2,8.3/2003) The calculation method has been changed since January 2003; (6.2,8.3/2006) The calculation method has been changed since January 2006; (7.1/2005) Data are not available from 2005; (9.1) Government registered and unregistered hotels and "ryokans" (inns); (9.3) Occupancy rate of major government registered hotels (rooms); (9.1,9.3/2006) Data are not available from 2006. Sources: (1.1-5.4,7.1,8.1,9.1,9.3) Japan National Tourist Organization; (6.1-6.3,8.2-8.4) International Monetary Fund.
Basic macroeconomic aggregates (c)
JPN
2007
Yens
Billions
• 22,810
• 1,483
• 21,327
• 4,338
•
•
• 9,569
• 515,084
• 92,222
• 84,218
• 64,246,000
Inbound tourism consumption
Domestic tourism consumption
Imports of goods and services
Outbound tourism consumption
Gross value added of tourism industriesTourism direct gross value added b.p.
Exports of goods and services
Internal tourism consumption
Tourism direct gross domestic product p.p
Total jobs
Comments
Tab
le 1
. B
asic
ag
gre
gat
es
Year
Currency
Units
Gross domestic product (GDP p.p.)
(c) These data are the same as those reproduced in T.1. of Chapter 3. Selected aggregates and tables of results

154
KAZAKHSTAN (a)
Units2006
(TSA latest reference year)
2007
INBOUND TOURISM
Arrivals
1.1 Visitors ('000) 4,707 5,3111.2 Tourists (overnight visitors) ('000) 3,468 3,8761.3 Same-day vis itors ('000) 1,239 1,4351.4 Cruise passengers ('000) .. ..
Arrivals by region
2.1 Africa ('000) 5 22.2 Americas ('000) 32 332.3 Europe ('000) 4,487 5,0192.4 East Asia and the Pacific ('000) 153 2202.5 South Asia ('000) 22 262.6 Middle East ('000) 3 5
Arrivals by means of transport used
3.1 Air ('000) 504 5843.2 Rail ('000) 1,298 1,4663.3 Road ('000) 2,891 3,2453.4 Sea ('000) 14 15
Arrivals by purpose of visit
4.1 Leisure, recreation and holidays ('000) 110 1164.2 Business and professional ('000) 1,023 1,2604.3 Other ('000) 3,574 3,934
Accommodation
5.1 Overnight stays in hotels and similar establishments ('000) 331 5485.2 Guests in hotels and similar establishments ('000) .. ..5.3 Overnight stays in all types of accommodation establishments ('000) .. ..5.4 Average length of stay of non-resident tourists in all accommodation
establishments Nights 3.00 3.00
6.1 Tourism expenditure in the country US$ Mn 973 1,2136.2 "Travel" (b) US$ Mn 838 1,0136.3 "Passenger transport" (b) US$ Mn 135 200
DOMESTIC TOURISM
Accommodation
7.1 Overnight stays in hotels and similar establishments ('000) 1,140 1,4167.2 Guests in hotels and similar establishments ('000) .. ..7.3 Overnight stays in all types of accommodation establishments ('000) .. ..7.4 Average length of stay of resident tourists in all accommodation
establishments Nights .. ..
OUTBOUND TOURISM
8.1 Departures ('000) 3,688 4,544
8.2 Tourism expenditure in other countries US$ Mn 1,060 1,3558.3 "Travel" (b) US$ Mn 821 1,0418.4 "Passenger transport" (b) US$ Mn 239 314
TOURISM INDUSTRIES
Hotels and similar establishments
9.1 Number of rooms Units 18,838 19,5529.2 Number of bed-places Units 43,045 43,8019.3 Occupancy rate Percent 24.30 28.709.4 Average length of stay Nights .. ..
(a) As in the UNWTO Compendium of Tourism Statistics(b) Balance of Payments items: 6.1 to 6.3 correspond to the "Credit" side (and are receipts for the country) while 8.2 to 8.4 correspond to the "Debit" side (and are expenditures in other countries).

155
General comments (country notes) (2.1-2.6,3.1-4.3) Arrivals of non-resident visitors at national borders. Sources: (1.1-5.4,7.1,8.1,9.1-9.3) Agency of Statistics of the Republic of Kazakhstan; (6.1-6.3,8.2-8.4) International Monetary Fund. Balance of Payments items (IMF notes) Transportation This category covers all modes of transport and port services. NBK bases the data for passenger fares and port charges mainly on reports it collects from marine shipping, airline, railway, and road companies. Freight includes the data reported by cargo enterprises and estimated transportation of goods carried from/to the frontier countries and the rest of the countries. Freight estimates for frontier countries and for the rest of the countries are based on the yearly survey and used for the data beginning in 2000. Travel NBK estimates data on travel on the basis of estimated average expenditures, number of residents traveling abroad and nonresidents traveling in Kazakhstan, and the estimated duration of their stay. Also available is information on travelers by country of origin or destination and type of travel.
Basic macroeconomic aggregates (c)
KA
Z
2006
Tengue
Billions
• 354.9
• 122.0
• 232.9
• 132.9
• 7.4
• 180.1
• 190.1
• 10,213.7
• 5,176.1
• 4,082.9
•
Inbound tourism consumption
Domestic tourism consumption
Imports of goods and services
Outbound tourism consumptionGross value added of tourism industriesTourism direct gross value added b.p.
Exports of goods and services
Internal tourism consumption
Tourism direct gross domestic product p.p
Total jobs
Comments
Tab
le 1
. B
asic
ag
gre
ga
tes
Year
Currency
Units
Gross domest ic product (GDP p.p.)
(c) These data are the same as those reproduced in T.1. of Chapter 3. Selected aggregates and tables of results

156
LATVIA (a)
Units2004
(TSA latest reference year)
2007
INBOUND TOURISM
Arrivals
1.1 Visitors ('000) 3,127 5,2091.2 Tourists (overnight visitors) ('000) 1,079 1,6531.3 Same-day vis itors ('000) 1,954 3,5831.4 Cruise passengers ('000) 69 120
Arrivals by region
2.1 Africa ('000) 1 32.2 Americas ('000) 32 322.3 Europe ('000) 2,985 5,1502.4 East Asia and the Pacific ('000) 13 182.5 South Asia ('000) 1 22.6 Middle East ('000) .. 2
Arrivals by means of transport used
3.1 Air ('000) 299 8573.2 Rail ('000) 139 1763.3 Road ('000) 2,481 3,8583.4 Sea ('000) 208 318
Arrivals by purpose of visit
4.1 Leisure, recreation and holidays ('000) 857 1,7374.2 Business and professional ('000) 466 7244.3 Other ('000) 1,710 2,748
Accommodation
5.1 Overnight stays in hotels and similar establishments ('000) 1,158 1,7805.2 Guests in hotels and similar establishments ('000) 520 7655.3 Overnight stays in all types of accommodation establishments ('000) 1,201 1,9365.4 Average length of stay of non-resident tourists in all accommodation
establishments Nights 2.20 2.29
6.1 Tourism expenditure in the country US$ Mn 343 8806.2 "Travel" (b) US$ Mn 267 6716.3 "Passenger transport" (b) US$ Mn 76 209
DOMESTIC TOURISM
Accommodation
7.1 Overnight stays in hotels and similar establishments ('000) 717 9797.2 Guests in hotels and similar establishments ('000) 287 5417.3 Overnight stays in all types of accommodation establishments ('000) 865 1,3897.4 Average length of stay of resident tourists in all accommodation
establishments Nights 2.43 2.16
OUTBOUND TOURISM
8.1 Departures ('000) 2,457 3,398
8.2 Tourism expenditure in other countries US$ Mn 428 1,0218.3 "Travel" (b) US$ Mn 377 9278.4 "Passenger transport" (b) US$ Mn 51 94
TOURISM INDUSTRIES
Hotels and similar establishments
9.1 Number of rooms Units 8,826 10,0179.2 Number of bed-places Units 17,933 20,6859.3 Occupancy rate Percent 31.49 36.549.4 Average length of stay Nights 2.32 2.11
(a) As in the UNWTO Compendium of Tourism Statistics(b) Balance of Payments items: 6.1 to 6.3 correspond to the "Credit" side (and are receipts for the country) while 8.2 to 8.4 correspond to the "Debit" side (and are expenditures in other countries).
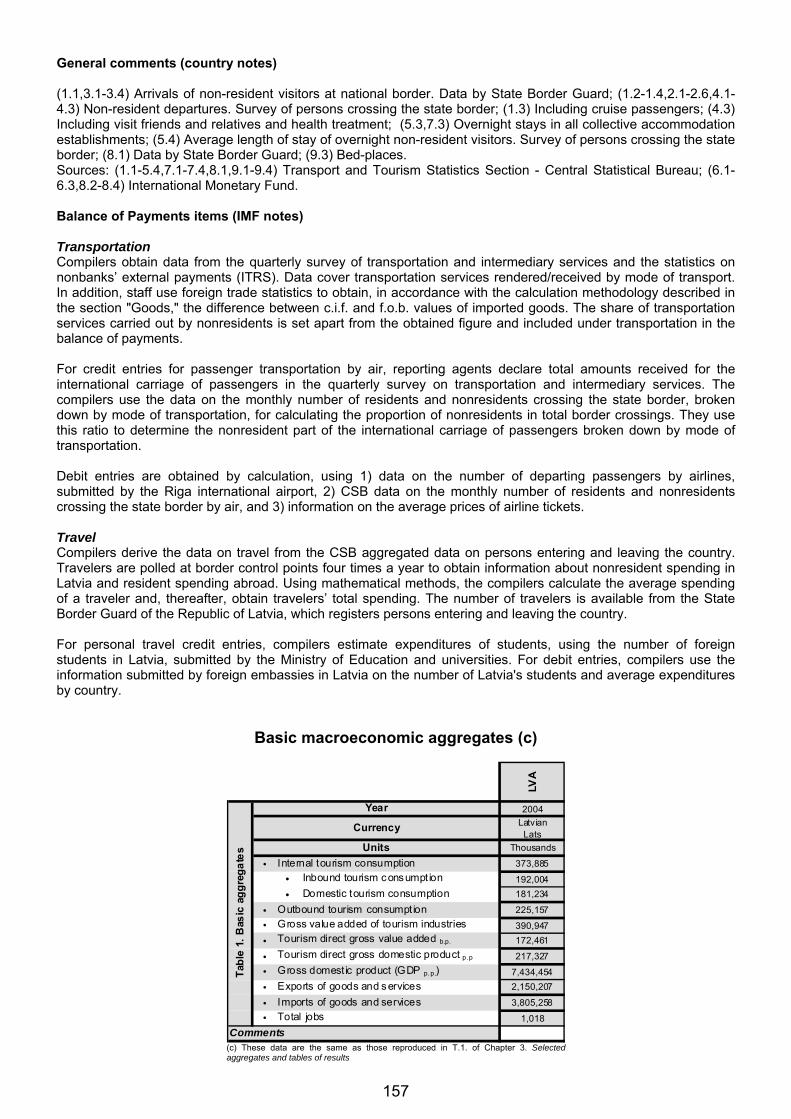
157
General comments (country notes) (1.1,3.1-3.4) Arrivals of non-resident visitors at national border. Data by State Border Guard; (1.2-1.4,2.1-2.6,4.1-4.3) Non-resident departures. Survey of persons crossing the state border; (1.3) Including cruise passengers; (4.3) Including visit friends and relatives and health treatment; (5.3,7.3) Overnight stays in all collective accommodation establishments; (5.4) Average length of stay of overnight non-resident visitors. Survey of persons crossing the state border; (8.1) Data by State Border Guard; (9.3) Bed-places. Sources: (1.1-5.4,7.1-7.4,8.1,9.1-9.4) Transport and Tourism Statistics Section - Central Statistical Bureau; (6.1-6.3,8.2-8.4) International Monetary Fund. Balance of Payments items (IMF notes) Transportation Compilers obtain data from the quarterly survey of transportation and intermediary services and the statistics on nonbanks’ external payments (ITRS). Data cover transportation services rendered/received by mode of transport. In addition, staff use foreign trade statistics to obtain, in accordance with the calculation methodology described in the section "Goods," the difference between c.i.f. and f.o.b. values of imported goods. The share of transportation services carried out by nonresidents is set apart from the obtained figure and included under transportation in the balance of payments. For credit entries for passenger transportation by air, reporting agents declare total amounts received for the international carriage of passengers in the quarterly survey on transportation and intermediary services. The compilers use the data on the monthly number of residents and nonresidents crossing the state border, broken down by mode of transportation, for calculating the proportion of nonresidents in total border crossings. They use this ratio to determine the nonresident part of the international carriage of passengers broken down by mode of transportation. Debit entries are obtained by calculation, using 1) data on the number of departing passengers by airlines, submitted by the Riga international airport, 2) CSB data on the monthly number of residents and nonresidents crossing the state border by air, and 3) information on the average prices of airline tickets. Travel Compilers derive the data on travel from the CSB aggregated data on persons entering and leaving the country. Travelers are polled at border control points four times a year to obtain information about nonresident spending in Latvia and resident spending abroad. Using mathematical methods, the compilers calculate the average spending of a traveler and, thereafter, obtain travelers’ total spending. The number of travelers is available from the State Border Guard of the Republic of Latvia, which registers persons entering and leaving the country. For personal travel credit entries, compilers estimate expenditures of students, using the number of foreign students in Latvia, submitted by the Ministry of Education and universities. For debit entries, compilers use the information submitted by foreign embassies in Latvia on the number of Latvia's students and average expenditures by country.
Basic macroeconomic aggregates (c)
LVA
2004
LatvianLats
Thousands
• 373,885
• 192,004
• 181,234
• 225,157
• 390,947
• 172,461
• 217,327
• 7,434,454
• 2,150,207
• 3,805,258
• 1,018
Inbound tourism consumption
Domestic tourism consumption
Imports of goods and services
Outbound tourism consumptionGross value added of tourism industriesTourism direct gross value added b.p.
Exports of goods and services
Internal tourism consumption
Tourism direct gross domestic product p.p
Total jobs
Comments
Tab
le 1
. B
asic
ag
gre
ga
tes
Year
Currency
Units
Gross domest ic product (GDP p.p.)
(c) These data are the same as those reproduced in T.1. of Chapter 3. Selected aggregates and tables of results
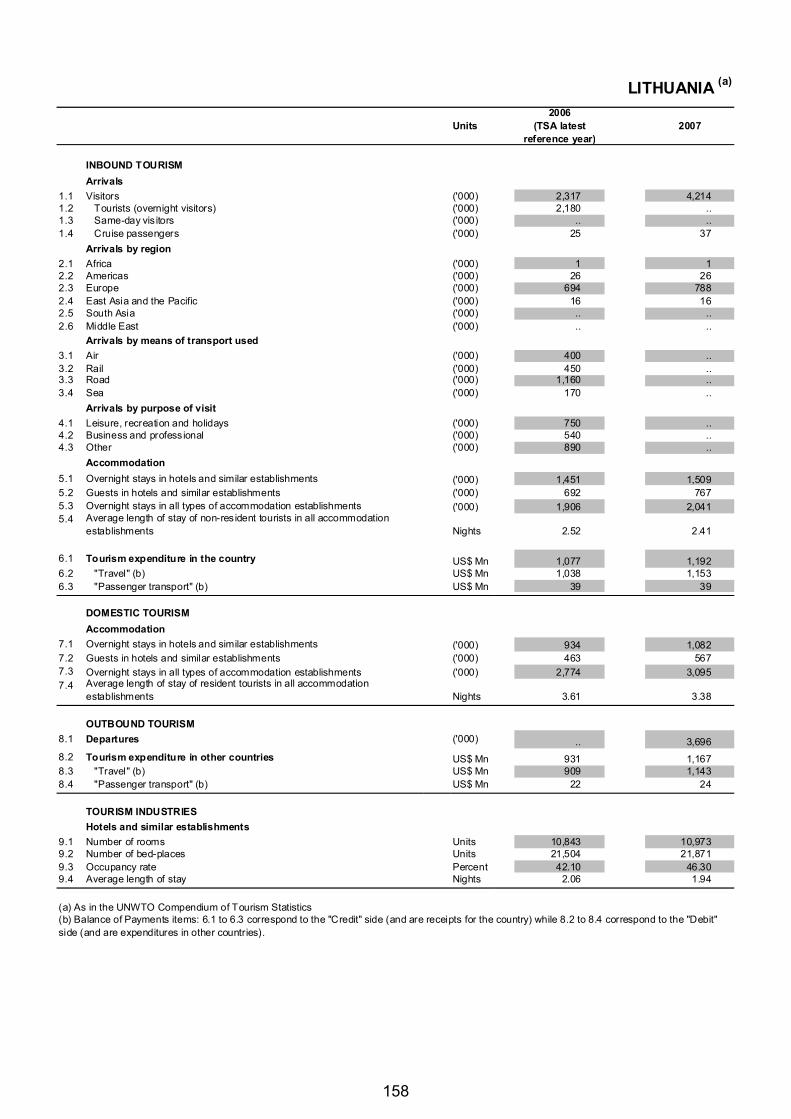
158
LITHUANIA (a)
Units2006
(TSA latest reference year)
2007
INBOUND TOURISM
Arrivals
1.1 Visitors ('000) 2,317 4,2141.2 Tourists (overnight visitors) ('000) 2,180 ..1.3 Same-day vis itors ('000) .. ..1.4 Cruise passengers ('000) 25 37
Arrivals by region
2.1 Africa ('000) 1 12.2 Americas ('000) 26 262.3 Europe ('000) 694 7882.4 East Asia and the Pacific ('000) 16 162.5 South Asia ('000) .. ..2.6 Middle East ('000) .. ..
Arrivals by means of transport used
3.1 Air ('000) 400 ..3.2 Rail ('000) 450 ..3.3 Road ('000) 1,160 ..3.4 Sea ('000) 170 ..
Arrivals by purpose of visit
4.1 Leisure, recreation and holidays ('000) 750 ..4.2 Business and professional ('000) 540 ..4.3 Other ('000) 890 ..
Accommodation
5.1 Overnight stays in hotels and similar establishments ('000) 1,451 1,5095.2 Guests in hotels and similar establishments ('000) 692 7675.3 Overnight stays in all types of accommodation establishments ('000) 1,906 2,0415.4 Average length of stay of non-resident tourists in all accommodation
establishments Nights 2.52 2.41
6.1 Tourism expenditure in the country US$ Mn 1,077 1,1926.2 "Travel" (b) US$ Mn 1,038 1,1536.3 "Passenger transport" (b) US$ Mn 39 39
DOMESTIC TOURISM
Accommodation
7.1 Overnight stays in hotels and similar establishments ('000) 934 1,0827.2 Guests in hotels and similar establishments ('000) 463 5677.3 Overnight stays in all types of accommodation establishments ('000) 2,774 3,0957.4 Average length of stay of resident tourists in all accommodation
establishments Nights 3.61 3.38
OUTBOUND TOURISM
8.1 Departures ('000) .. 3,696
8.2 Tourism expenditure in other countries US$ Mn 931 1,1678.3 "Travel" (b) US$ Mn 909 1,1438.4 "Passenger transport" (b) US$ Mn 22 24
TOURISM INDUSTRIES
Hotels and similar establishments
9.1 Number of rooms Units 10,843 10,9739.2 Number of bed-places Units 21,504 21,8719.3 Occupancy rate Percent 42.10 46.309.4 Average length of stay Nights 2.06 1.94
(a) As in the UNWTO Compendium of Tourism Statistics(b) Balance of Payments items: 6.1 to 6.3 correspond to the "Credit" side (and are receipts for the country) while 8.2 to 8.4 correspond to the "Debit" side (and are expenditures in other countries).

159
General comments (country notes) (1.1) Data by the State Border Guard Service of the Ministry of Interior. 2004-2006: citizens from third countries are calculated. Data of the statistical survey on the flow of visitors crossing border posts for 2007; (2.1-2.4) Non-resident tourists staying in all types of accommodation establishments; (3.1-3.4,4.1-4.3) Arrivals of non-resident tourists at national borders; (5.1,5.2,7.1,7.2,9.1,9.2) Hotels and motels; (9.3) Rooms. Note 2007: Provisional data. Sources: (1.1-5.4,7.1-7.4,8.1,9.1-9.4) Lithuanian State Department of Tourism; (6.1-6.3,8.2-8.4) International Monetary Fund. Balance of Payments items (IMF notes) Transportation This category includes cargo and passenger transportation services using all means of transportation, including seaport and airport services. The primary data source is the quarterly survey of the cross-border transactions of nonbank entities with nonresidents, conducted by SL. The quarterly survey is supplemented by a comprehensive annual survey of small road transport operators, covering their quarterly and annual transactions. Approximately 1,000 enterprises provide the data. Travel Travel services include all goods and services acquired by travelers in foreign countries. (A person living in a country in which he/she is not a resident for less than one year is considered a traveler.) Services for international passenger transportation (i.e., the transportation of passengers between countries) are not included in the travel item. Such services belong to the category of passenger transportation services. Data on travel services are calculated on the basis of (1) the monthly data on the number of incoming foreigners from non-EU countries and departing residents from Lithuania, provided by the State Border Guard Service at the Ministry of the Interior; (2) the Department of Tourism’s annual selective research on incoming foreigners and their average expenditure and length of stay; (3) the SL selective research on Lithuanian travelers and their average expenditure and length of stay; and (4) the data of quarterly surveys of enterprises providing accommodation services (hotels, health spa, etc.) and of enterprises involved in sales of touring packages.
Basic macroeconomic aggregates (c)
LTU
2006
LTL
Millions
• 3,689.3
• 1,607.7
• 2,081.6
• 2,949.3
•
• 2.7
••
•
••
Inbound tourism consumption
Domestic tourism consumption
Imports of goods and services
Outbound tourism consumptionGross value added of tourism industriesTourism direct gross value added b.p.
Exports of goods and services
Internal tourism consumption
Tourism direct gross domestic product p.p
Total jobs
Comments
Tab
le 1
. B
asic
ag
gre
ga
tes
Year
Currency
Units
Gross domest ic product (GDP p.p.)
(c) These data are the same as those reproduced in T.1. of Chapter 3. Selected aggregates and tables of results

160
MEXICO (a)
Units2006
(TSA latest reference year)
2007
INBOUND TOURISM
Arrivals
1.1 Visitors ('000) 97,701 92,2331.2 Tourists (overnight visitors) ('000) 21,353 21,4241.3 Same-day visitors ('000) 69,832 63,9951.4 Cruise passengers ('000) 6,516 6,814
Arrivals by region
2.1 Africa ('000) .. ..2.2 Americas ('000) 18,713 18,8682.3 Europe ('000) 1,295 1,4232.4 East Asia and the Pacific ('000) 100 1092.5 South Asia ('000) .. ..2.6 Middle East ('000) .. ..
Arrivals by means of transport used
3.1 Air ('000) 10,153 10,6673.2 Rail ('000) .. ..3.3 Road ('000) 11,199 10,7573.4 Sea ('000) .. ..
Arrivals by purpose of visit
4.1 Leisure, recreation and holidays ('000) 7,743 8,3214.2 Business and professional ('000) 775 8494.3 Other ('000) 12,835 12,255
Accommodation
5.1 Overnight stays in hotels and similar establishments ('000) 30,236 48,7805.2 Guests in hotels and similar establishments ('000) 9,689 13,2505.3 Overnight stays in all types of accommodation establishments ('000) .. ..5.4 Average length of stay of non-resident tourists in all accommodation
establishments Nights 9.93 9.92
6.1 Tourism expenditure in the country US$ Mn 13,329 14,0726.2 "Travel" (b) US$ Mn 12,177 12,9016.3 "Passenger transport" (b) US$ Mn 1,152 1,171
DOMESTIC TOURISM
Accommodation
7.1 Overnight stays in hotels and similar establishments ('000) 64,124 74,6007.2 Guests in hotels and similar establishments ('000) 35,192 41,9617.3 Overnight stays in all types of accommodation establishments ('000) .. ..7.4 Average length of stay of resident tourists in all accommodation
establishments Nights .. ..
OUTBOUND TOURISM
8.1 Departures ('000) 14,002 15,089
8.2 Tourism expenditure in other countries US$ Mn 9,387 9,8438.3 "Travel" (b) US$ Mn 8,108 8,3788.4 "Passenger transport" (b) US$ Mn 1,279 1,465
TOURISM INDUSTRIES
Hotels and similar establishments
9.1 Number of rooms Units 562,039 583,7319.2 Number of bed-places Units 1,124,078 1,167,4629.3 Occupancy rate Percent 52.78 54.839.4 Average length of stay Nights 3.12 3.68
(a) As in the UNWTO Compendium of Tourism Statistics(b) Balance of Payments items: 6.1 to 6.3 correspond to the "Credit" side (and are receipts for the country) while 8.2 to 8.4 correspond to the "Debit" side (and are expenditures in other countries).

161
General comments (country notes) (1.2,2.2-4.3) Arrivals of non-resident tourists at national borders; including nationals residing abroad; (1.3) Including visitors of the US border zone with a length of stay under 24 hours; (2.2/2004) United States and Canada only; (2.2,2.3/2003/2004) Data compiled by country of residence; (2.2-2.4/2005-2007) Data compiled by nationality; (2.4) Japan and Republic of Korea only; (3.3) Including rail; (5.1) Selected tourism resorts; (5.2,7.2) Hotels only; (9.3) Rooms; (9.4) Foreign tourism only. Sources: (1.1-5.4,7.1,7.2,8.1,9.1-9.4) "Secretaría de Turismo de México (SECTUR)"; (6.1-6.3,8.2-8.4) International Monetary Fund.
Basic macroeconomic aggregates (c)
ME
X
2006
Pesos
Millions
• 1,215,479
• 166,599
• 1,048,880
• 102,527
• 298,382
• 809,406
•
• 10,306,839
• 2,904,137
• 3,037,584
• 36,193,069
(¶)
Inbound tourism consumption
Domestic tourism consumption
Imports of goods and services
Outbound tourism consumption
Gross value added of tourism industriesTourism direct gross value added b.p.
Exports of goods and services
Internal tourism consumption
Tourism direct gross domestic product p.p
Total jobs
Comments
Tab
le 1
. B
asic
ag
gre
gat
es
Year
Currency
Units
Gross domestic product (GDP p.p.)
(c) These data are the same as those reproduced in T.1. of Chapter 3. Selected aggregates and tables of results

162
MOROCCO (a)
Units2005
(TSA latest reference year)
2007
INBOUND TOURISM
Arrivals
1.1 Visitors ('000) 6.077 7.7011.2 Tourists (overnight visitors) ('000) 5.843 7.4081.3 Same-day visitors ('000) .. ..1.4 Cruise passengers ('000) 233 293
Arrivals by region
2.1 Africa ('000) 144 1932.2 Americas ('000) 140 1962.3 Europe ('000) 2.607 3.4062.4 East Asia and the Pacific ('000) 52 742.5 South Asia ('000) 8 122.6 Middle East ('000) 91 116
Arrivals by means of transport used
3.1 Air ('000) 2.986 4.3953.2 Rail ('000) .. ..3.3 Road ('000) 818 1.2683.4 Sea ('000) 2.040 1.745
Arrivals by purpose of visit
4.1 Leisure, recreation and holidays ('000) 3.145 4.0894.2 Business and professional ('000) 143 1854.3 Other ('000) 2.555 3.133
Accommodation
5.1 Overnight stays in hotels and similar establishments ('000) 12.259 13.7035.2 Guests in hotels and similar establishments ('000) 3.470 3.9105.3 Overnight stays in all types of accommodation establishments ('000) .. ..5.4 Average length of stay of non-resident tourists in all accommodation
establishments Nights .. ..
6.1 Tourism expenditure in the country US$ Mn 5.426 8.3076.2 "Travel" (b) US$ Mn 4.610 7.1816.3 "Passenger transport" (b) US$ Mn 816 1.126
DOMESTIC TOURISM
Accommodation
7.1 Overnight stays in hotels and similar establishments ('000) 2.956 3.1917.2 Guests in hotels and similar establishments ('000) 1.400 1.5027.3 Overnight stays in all types of accommodation establishments ('000) .. ..7.4 Average length of stay of resident tourists in all accommodation
establishments Nights .. ..
OUTBOUND TOURISM
8.1 Departures ('000) 2.247 2.669
8.2 Tourism expenditure in other countries US$ Mn 999 1.4188.3 "Travel" (b) US$ Mn 612 8808.4 "Passenger transport" (b) US$ Mn 387 538
TOURISM INDUSTRIES
Hotels and similar establishments
9.1 Number of rooms Units 59.864 68.4549.2 Number of bed-places Units 124.270 143.2219.3 Occupancy rate Percent 47,00 48,009.4 Average length of stay Nights 6,30 6,08
(a) As in the UNWTO Compendium of Tourism Statistics(b) Balance of Payments items: 6.1 to 6.3 correspond to the "Credit" side (and are receipts for the country) while 8.2 to 8.4 correspond to the "Debit" side (and are expenditures in other countries).

163
General comments (country notes) (1.2,3.1-4.3) Arrivals of non-resident tourists at national borders; including nationals residing abroad; (2.1-2.6) Arrivals of non-resident tourists at national borders; excluding nationals residing abroad; (5.1,5.2,7.1,7.2,9.1-9.3) Classified hotels, holiday villages and tourist residences; (9.3) Rooms; (9.4) Foreign tourists. Sources: (1.1-5.2,7.1,7.2,8.1,9.1-9.4) "Ministère du tourisme"; (6.1-6.3,8.2-8.4) International Monetary Fund.
Basic macroeconomic aggregates (c)
MA
R
2005
US $
• 7.786
• 5.544
• 2.242
• 3.499
•••• 4.217
••• 346.000
Inbound tourism consumptionDomestic tourism consumption
Imports of goods and services
Outbound tourism consumptionGross value added of tourism industriesTourism direct gross value added b.p.
Exports of goods and services
Internal tourism consumption
Tourism direct gross domestic product p.p
Total jobs
Comments
Tab
le 1
. B
asic
ag
gre
gat
es
Year
Currency
Units
Gross domestic product (GDP p.p.)
(c) These data are the same as those reproduced in T.1. of Chapter 3. Selected aggregates and tables of results

164
NETHERLANDS (a)
Units2007
(TSA latest reference year)
INBOUND TOURISM
Arrivals
1.1 Visitors ('000) ..1.2 Tourists (overnight visitors) ('000) 11,0081.3 Same-day vis itors ('000) ..1.4 Cruise passengers ('000) ..
Arrivals by region
2.1 Africa ('000) 922.2 Americas ('000) 1,2742.3 Europe ('000) 8,9042.4 East Asia and the Pacific ('000) 7382.5 South Asia ('000) ..2.6 Middle East ('000) ..
Arrivals by means of transport used
3.1 Air ('000) ..3.2 Rail ('000) ..3.3 Road ('000) ..3.4 Sea ('000) ..
Arrivals by purpose of visit
4.1 Leisure, recreation and holidays ('000) ..4.2 Business and professional ('000) ..4.3 Other ('000) ..
Accommodation
5.1 Overnight stays in hotels and similar establishments ('000) 16,3285.2 Guests in hotels and similar establishments ('000) 8,7135.3 Overnight stays in all types of accommodation establishments ('000) 27,9525.4 Average length of stay of non-resident tourists in all accommodation
establishments Nights 2.54
6.1 Tourism expenditure in the country US$ Mn 19,9816.2 "Travel" (b) US$ Mn 13,4166.3 "Passenger transport" (b) US$ Mn 6,565
DOMESTIC TOURISM
Accommodation
7.1 Overnight stays in hotels and similar establishments ('000) 17,8317.2 Guests in hotels and similar establishments ('000) 10,5167.3 Overnight stays in all types of accommodation establishments ('000) 60,3157.4 Average length of stay of resident tourists in all accommodation
establishments Nights 3.13
OUTBOUND TOURISM
8.1 Departures ('000) 17,556
8.2 Tourism expenditure in other countries US$ Mn 19,4758.3 "Travel" (b) US$ Mn 19,1108.4 "Passenger transport" (b) US$ Mn 365
TOURISM INDUSTRIES
Hotels and similar establishments
9.1 Number of rooms Units 98,9669.2 Number of bed-places Units 200,2549.3 Occupancy rate Percent 46.739.4 Average length of stay Nights 1.78
(a) As in the UNWTO Compendium of Tourism Statistics(b) Balance of Payments items: 6.1 to 6.3 correspond to the "Credit" side (and are receipts for the country) while 8.2 to 8.4 correspond to the "Debit" side (and are expenditures in other countries).

165
General comments (country notes) (1.2-2.4) Non-resident tourists staying in all types of accommodation establishments; (5.1,7.1) Hotels and boarding houses; (8.1) Holiday departures of nationals; (9.2) Hotels; (9.3) Bed-places; (9.4) All types of accommodation establishments. Sources: (1.2-5.4,7.1-7.3,8.1,9.1-9.4) Statistics Netherlands; (6.2,8.3) International Monetary Fund; (6.3,8.4) "De Nederlandsche Bank". Balance of Payments items (IMF notes) Services As of the second quarter of 2003, Statistics Netherlands has been producing quarterly data on international trade in services. To that end, it adopted a new quarterly survey. In 2005 the reporting population for this survey comprised a sample of about 2,200 reporting agents (approximately 7 percent of the total population). A small number of large entities directly reports. In addition, Statistics Netherlands surveys a larger number of small and medium enterprises with less detail. The results are grossed up to a national level.
Basic macroeconomic aggregates (c)
NL
D
2007
• 35,280
• 6,782
• 28,498
• 14,274
• 25,809
• 14,169
• 17,120
• 567,066
• 424,827
• 376,111
• 9,167,000
Internal tourism consumption
Tourism direct gross domestic product p.p
Total jobs
Comments
Tab
le 1
. B
asic
ag
gre
ga
tes
Year
Currency
Units
Gross domest ic product (GDP p.p.)
Inbound tourism consumption
Domestic tourism consumption
Imports of goods and services
Outbound tourism consumptionGross value added of tourism industriesTourism direct gross value added b.p.
Exports of goods and services
(c) These data are the same as those reproduced in T.1. of Chapter 3. Selected aggregates and tables of results

166
NEW ZEALAND (a)
Units2007
(TSA latest reference year)
INBOUND TOURISM
Arrivals
1.1 Visitors ('000) 2,4551.2 Tourists (overnight visitors) ('000) 2,4341.3 Same-day vis itors ('000) ..1.4 Cruise passengers ('000) 21
Arrivals by region
2.1 Africa ('000) 242.2 Americas ('000) 2902.3 Europe ('000) 5172.4 East Asia and the Pacific ('000) 1,5512.5 South Asia ('000) 242.6 Middle East ('000) 11
Arrivals by means of transport used
3.1 Air ('000) 2,4313.2 Rail ('000) ..3.3 Road ('000) ..3.4 Sea ('000) 25
Arrivals by purpose of visit
4.1 Leisure, recreation and holidays ('000) 1,2114.2 Business and professional ('000) 3304.3 Other ('000) 914
Accommodation
5.1 Overnight stays in hotels and similar establishments ('000) ..5.2 Guests in hotels and similar establishments ('000) ..5.3 Overnight stays in all types of accommodation establishments ('000) 13,8865.4 Average length of stay of non-resident tourists in all accommodation
establishments Nights ..
6.1 Tourism expenditure in the country US$ Mn ..6.2 "Travel" (b) US$ Mn 5,4066.3 "Passenger transport" (b) US$ Mn ..
DOMESTIC TOURISM
Accommodation
7.1 Overnight stays in hotels and similar establishments ('000) ..7.2 Guests in hotels and similar establishments ('000) ..7.3 Overnight stays in all types of accommodation establishments ('000) 19,0287.4 Average length of stay of resident tourists in all accommodation
establishments Nights ..
OUTBOUND TOURISM
8.1 Departures ('000) 1,978
8.2 Tourism expenditure in other countries US$ Mn ..8.3 "Travel" (b) US$ Mn 3,0668.4 "Passenger transport" (b) US$ Mn ..
TOURISM INDUSTRIES
Hotels and similar establishments
9.1 Number of rooms Units 22,8059.2 Number of bed-places Units ..9.3 Occupancy rate Percent 53.069.4 Average length of stay Nights 1.84
(a) As in the UNWTO Compendium of Tourism Statistics(b) Balance of Payments items: 6.1 to 6.3 correspond to the "Credit" side (and are receipts for the country) while 8.2 to 8.4 correspond to the "Debit" side (and are expenditures in other countries).

167
General comments (country notes) (1.1,3.1-4.3) Arrivals of non-resident visitors at national borders; including nationals residing abroad; (2.1-2.6) Arrivals of non-resident visitors at national borders; excluding nationals residing abroad; (5.3,7.3) Estimated from total guest nights in commercial accommodation establishments with an annual turnover at least NZ$30,000, based on average percentage of international and domestic guests in Jan, Apr, Jul and Oct; (8.1) Short-term departures of NZ residents (calendar year); (9.1) Refer to "staying units" capacity in hotels, motels and hosted guest houses; (10.1-10.3) This section includes only the “travel” item because the “passenger transport” item was not included in the data provided by the International Monetary Fund for the preparation of this edition of the Compendium. Sources: (1.1-5.3,7.3,8.1,9.1-9.4) Ministry of Tourism; (6.2,8.3) International Monetary Fund. Balance of Payments items (IMF notes) Transportation The main types of transportation services data collected are for the carriage of goods (freight) and passengers. Also included under transportation services are charters of carriers, tugboat services, airport and harbor fees, and goods consumed by carriers in the course of their operations, including bunkering and provisioning. These data are provided from quarterly and annual surveys of resident airlines and shipping companies, nonresident airlines (through their New Zealand offices), and New Zealand agents acting for nonresident ship operators. Travel Data on the expenditure of overseas tourists in New Zealand are derived from the International Visitors’ Survey (IVS), conducted by a marketing company for the New Zealand Ministry of Tourism. In January 2003, the sampling in the IVS was changed to a “flight-based” basis. Flight-based sampling is a nonrandom method of sampling, allowing the specific targeting of passengers with certain characteristics that are to be represented in the sample of international visitors. Data on the characteristics of passengers are generated from the departure cards of passengers. The sample is selected from departing visitors at New Zealand’s three largest international airports—Auckland, Wellington, and Christchurch. Estimates are also made for expenditure on education- and health-related travel by nonresidents. The estimates for education-related travel are derived from a Survey of English Language Providers and New Zealand Ministry of Education data. Health expenditure is derived from Crown Health Entity data. Information on the expenditure of New Zealand residents traveling overseas is derived from a model that uses information obtained from a benchmark survey of returned New Zealand travelers.
Basic macroeconomic aggregates (c)
NZ
L
2007
•• 8,798
• 11,286
• (¶)
• 4,143
• 7,871
• 20,084
• 166,243
• 48,199
• 50,528
• 181,200
(¶)
Internal tourism consumption
Tourism direct gross domestic product p.p
Total jobs
Comments
Tab
le 1
. B
asic
ag
gre
ga
tes
Year
Currency
Units
Gross domest ic product (GDP p.p.)
Inbound tourism consumption
Domestic tourism consumption
Imports of goods and services
Outbound tourism consumptionGross value added of tourism industriesTourism direct gross value added b.p.
Exports of goods and services
(c) These data are the same as those reproduced in T.1. of Chapter 3. Selected aggregates and tables of results

168
OMAN (a)
Units2007
(TSA latest reference year)
INBOUND TOURISM
Arrivals
1.1 Visitors ('000) ..1.2 Tourists (overnight visitors) ('000) ..1.3 Same-day visitors ('000) ..1.4 Cruise passengers ('000) ..
Arrivals by region
2.1 Africa ('000) 152.2 Americas ('000) 442.3 Europe ('000) 3622.4 East Asia and the Pacific ('000) 782.5 South Asia ('000) 1752.6 Middle East ('000) 190
Arrivals by means of transport used
3.1 Air ('000) ..3.2 Rail ('000) ..3.3 Road ('000) ..3.4 Sea ('000) ..
Arrivals by purpose of visit
4.1 Leisure, recreation and holidays ('000) ..4.2 Business and professional ('000) ..4.3 Other ('000) ..
Accommodation
5.1 Overnight stays in hotels and similar establishments ('000) 1,6945.2 Guests in hotels and similar establishments ('000) 1,1315.3 Overnight stays in all types of accommodation establishments ('000) ..5.4 Average length of stay of non-resident tourists in all accommodation
establishments Nights ..
6.1 Tourism expenditure in the country US$ Mn 9026.2 "Travel" (b) US$ Mn 6456.3 "Passenger transport" (b) US$ Mn 257
DOMESTIC TOURISM
Accommodation
7.1 Overnight stays in hotels and similar establishments ('000) 4557.2 Guests in hotels and similar establishments ('000) 3707.3 Overnight stays in all types of accommodation establishments ('000) ..7.4 Average length of stay of resident tourists in all accommodation
establishments Nights ..
OUTBOUND TOURISM
8.1 Departures ('000) ..
8.2 Tourism expenditure in other countries US$ Mn 9448.3 "Travel" (b) US$ Mn 7448.4 "Passenger transport" (b) US$ Mn 200
TOURISM INDUSTRIES
Hotels and similar establishments
9.1 Number of rooms Units 9,2989.2 Number of bed-places Units 14,6659.3 Occupancy rate Percent 52.509.4 Average length of stay Nights ..
(a) As in the UNWTO Compendium of Tourism Statistics(b) Balance of Payments items: 6.1 to 6.3 correspond to the "Credit" side (and are receipts for the country) while 8.2 to 8.4 correspond to the "Debit" side (and are expenditures in other countries).

169
General comments (country notes) (1.1-1.3,4.1-4.3) Inbound Tourism Survey; (2.1-2.6) Non-resident tourists staying in hotels and similar establishments; (4.1-4.3) Arrivals of non-resident visitors at national borders; (9.3) Rooms. Sources: (1.1-1.3,4.1-4.3) Ministry of National Economy and Ministry of Commerce and Industry; (2.1-2.6,5.1,5.2,7.1,7.2,9.1-9.3) Directorate General of Tourism - Ministry of Tourism; (6.1-6.3,8.2-8.4) International Monetary Fund.
Basic macroeconomic aggregates (c)
OM
N
2007
Thousands
• 726,127
• 162,925
• 563,202
• 328,054
• 457,497
• 457,497
•
• 16,010,320
• 8,950.0
• 6,433.0
•
Inbound tourism consumption
Domestic tourism consumption
Imports of goods and services
Outbound tourism consumption
Gross value added of tourism industriesTourism direct gross value added b.p.
Exports of goods and services
Internal tourism consumption
Tourism direct gross domestic product p.p
Total jobs
Comments
Tab
le 1
. B
asic
ag
gre
gat
es
Year
Currency
Units
Gross domestic product (GDP p.p.)
(c) These data are the same as those reproduced in T.1. of Chapter 3. Selected aggregates and tables of results

170
PERU (a)
Units2001
(TSA latest reference year)
2007
INBOUND TOURISM
Arrivals
1.1 Visitors ('000) .. 2,4521.2 Tourists (overnight visitors) ('000) 901 1,9161.3 Same-day visitors ('000) .. 5351.4 Cruise passengers ('000) 4 60
Arrivals by region
2.1 Africa ('000) 2 42.2 Americas ('000) 534 1,3992.3 Europe ('000) 221 4152.4 East Asia and the Pacific ('000) 38 942.5 South Asia ('000) 1 32.6 Middle East ('000) .. ..
Arrivals by means of transport used
3.1 Air ('000) 547 1,1323.2 Rail ('000) .. ..3.3 Road ('000) 347 7643.4 Sea ('000) 6 21
Arrivals by purpose of visit
4.1 Leisure, recreation and holidays ('000) 818 1,8044.2 Business and professional ('000) 33 494.3 Other ('000) 50 63
Accommodation
5.1 Overnight stays in hotels and similar establishments ('000) 2,788 6,7565.2 Guests in hotels and similar establishments ('000) 1,446 3,4375.3 Overnight stays in all types of accommodation establishments ('000) .. ..5.4 Average length of stay of non-resident tourists in all accommodation
establishments Nights 10.90 1.97
6.1 Tourism expenditure in the country US$ Mn 763 2,2226.2 "Travel" (b) US$ Mn 733 1,9386.3 "Passenger transport" (b) US$ Mn 30 284
DOMESTIC TOURISM
Accommodation
7.1 Overnight stays in hotels and similar establishments ('000) 12,273 24,0337.2 Guests in hotels and similar establishments ('000) 9,545 18,4587.3 Overnight stays in all types of accommodation establishments ('000) .. ..7.4 Average length of stay of resident tourists in all accommodation
establishments Nights .. 1.30
OUTBOUND TOURISM
8.1 Departures ('000) 1,060 1,966
8.2 Tourism expenditure in other countries US$ Mn 773 1,2748.3 "Travel" (b) US$ Mn 545 1,0078.4 "Passenger transport" (b) US$ Mn 228 267
TOURISM INDUSTRIES
Hotels and similar establishments
9.1 Number of rooms Units 120,123 165,4439.2 Number of bed-places Units 204,263 288,3829.3 Occupancy rate Percent 25.35 26.049.4 Average length of stay Nights 1.37 1.40
(a) As in the UNWTO Compendium of Tourism Statistics(b) Balance of Payments items: 6.1 to 6.3 correspond to the "Credit" side (and are receipts for the country) while 8.2 to 8.4 correspond to the "Debit" side (and are expenditures in other countries).

171
General comments (country notes) (1.2) Including nationals residing abroad; (1.4) Overnight cruise passengers; (3.4) Includes the arrivals by river and lake. Note 2005-2007: Preliminary data. Sources: (1.1-4.3,8.1) "Dirección General de Migraciones y Naturalización (DIGEMIN)"; (5.1-5.4,7.1-7.4,9.1-9.4) "Ministerio de Comercio Exterior y Turismo (MINCETUR)"; (6.1-6.3,8.2-8.4) International Monetary Fund.
Basic macroeconomic aggregates (c)
PE
R
2001
Nuevos Soles
Millions
• 10,439.5
• 2,672.9
• 7,766.6
• 2,624.5
• 5,269.1
• 5,846.0
• 6,164.4
• 187,251.0
• 30,019.6
• 32,955.5
• 251.3
Inbound tourism consumption
Domestic tourism consumption
Imports of goods and services
Outbound tourism consumption
Gross value added of tourism industriesTourism direct gross value added b.p.
Exports of goods and services
Internal tourism consumption
Tourism direct gross domestic product p.p
Total jobs
Comments
Tab
le 1
. B
asic
ag
gre
gat
es
Year
Currency
Units
Gross domestic product (GDP p.p.)
(c) These data are the same as those reproduced in T.1. of Chapter 3. Selected aggregates and tables of results

172
PHILIPPINES (a)
Units2007
(TSA latest reference year)
INBOUND TOURISM
Arrivals
1.1 Visitors ('000) ..1.2 Tourists (overnight visitors) ('000) 3,0921.3 Same-day vis itors ('000) ..1.4 Cruise passengers ('000) 17
Arrivals by region
2.1 Africa ('000) 32.2 Americas ('000) 6752.3 Europe ('000) 3002.4 East Asia and the Pacific ('000) 1,8292.5 South Asia ('000) 382.6 Middle East ('000) 32
Arrivals by means of transport used
3.1 Air ('000) 3,0423.2 Rail ('000) ..3.3 Road ('000) ..3.4 Sea ('000) 50
Arrivals by purpose of visit
4.1 Leisure, recreation and holidays ('000) 1,4394.2 Business and professional ('000) 4514.3 Other ('000) 1,152
Accommodation
5.1 Overnight stays in hotels and similar establishments ('000) 14,1495.2 Guests in hotels and similar establishments ('000) 1,0275.3 Overnight stays in all types of accommodation establishments ('000) ..5.4 Average length of stay of non-resident tourists in all accommodation
establishments Nights 16.70
6.1 Tourism expenditure in the country US$ Mn 5,5186.2 "Travel" (b) US$ Mn 4,9316.3 "Passenger transport" (b) US$ Mn 587
DOMESTIC TOURISM
Accommodation
7.1 Overnight stays in hotels and similar establishments ('000) ..7.2 Guests in hotels and similar establishments ('000) ..7.3 Overnight stays in all types of accommodation establishments ('000) ..7.4 Average length of stay of resident tourists in all accommodation
establishments Nights ..
OUTBOUND TOURISM
8.1 Departures ('000) ..
8.2 Tourism expenditure in other countries US$ Mn 2,0078.3 "Travel" (b) US$ Mn 1,6158.4 "Passenger transport" (b) US$ Mn 392
TOURISM INDUSTRIES
Hotels and similar establishments
9.1 Number of rooms Units 31,5239.2 Number of bed-places Units 63,0469.3 Occupancy rate Percent 73.069.4 Average length of stay Nights 2.45
(a) As in the UNWTO Compendium of Tourism Statistics(b) Balance of Payments items: 6.1 to 6.3 correspond to the "Credit" side (and are receipts for the country) while 8.2 to 8.4 correspond to the "Debit" side (and are expenditures in other countries).

173
General comments (country notes) (1.2,3.1-4.3) Arrivals of non-resident tourists at national borders; including nationals residing abroad; (2.1-2.6) Arrivals of non-resident tourists at national borders; excluding nationals residing abroad; (4.1-4.3) Air arrivals; (8.1) Including overseas contract workers; (9.1,9.2) Classified hotels only; (9.3,9.4) Classified hotels in Metro Manila. Sources: (1.2-5.4,8.1,9.1-9.4) Department of Tourism; (6.1-6.3,8.2-8.4) International Monetary Fund. Balance of Payments items (IMF notes) Transportation Transportation refers largely to data on merchandise freight, sourced from the foreign trade statistics. For other components of transportation services, the ITRS and the CAB company reports, obtained from the CBTS, provide the data. Travel For travel receipts, DES bases estimates on the Visitors Sample Survey (VSS), conducted by DOT. The VSS provides information on the average expenditure of foreign tourists and the average length of stay in the Philippines. For tourist-related travel expenditure abroad by residents, DES bases data on the ITRS. Beginning with the 1999 report, travel credits include expenditure in the Philippines of nonresident OFWs during home visits. Travel debits include expenditures of resident OFWs in the host countries.
Basic macroeconomic aggregates (c)
PH
L2007
PhP
Millions
• 1,069,799
• 201,942
• 862,938
• 79,640
• (¶)
• 411,918
• (¶)
• 6,648,235
• 2,833,634
• 2,802,659
• 33,641
(¶)
Internal tourism consumption
Tourism direct gross domestic product p.p
Total jobs
Comments
Tab
le 1
. B
asic
ag
gre
ga
tes
Year
Currency
Units
Gross domest ic product (GDP p.p.)
Inbound tourism consumption
Domestic tourism consumption
Imports of goods and services
Outbound tourism consumptionGross value added of tourism industriesTourism direct gross value added b.p.
Exports of goods and services
(c) These data are the same as those reproduced in T.1. of Chapter 3. Selected aggregates and tables of results

174
POLAND (a)
Units2000
(TSA latest reference year)
2007
INBOUND TOURISM
Arrivals
1.1 Visitors ('000) 84,515 66,2081.2 Tourists (overnight visitors) ('000) 17,400 14,9751.3 Same-day vis itors ('000) 67,115 51,2331.4 Cruise passengers ('000) .. ..
Arrivals by region
2.1 Africa ('000) 9 172.2 Americas ('000) 330 4532.3 Europe ('000) 84,043 65,3732.4 East Asia and the Pacific ('000) 88 2292.5 South Asia ('000) 9 202.6 Middle East ('000) 7 10
Arrivals by means of transport used
3.1 Air ('000) 1,161 2,8843.2 Rail ('000) 2,952 1,8313.3 Road ('000) 78,638 61,1223.4 Sea ('000) 1,764 371
Arrivals by purpose of visit
4.1 Leisure, recreation and holidays ('000) 4,460 2,6604.2 Business and professional ('000) 4,850 4,0854.3 Other ('000) 8,090 8,230
Accommodation
5.1 Overnight stays in hotels and similar establishments ('000) 4,944 8,4095.2 Guests in hotels and similar establishments ('000) 2,505 3,8335.3 Overnight stays in all types of accommodation establishments ('000) 6,891 10,9185.4 Average length of stay of non-resident tourists in all accommodation
establishments Nights 4.80 2.90
6.1 Tourism expenditure in the country US$ Mn 6,128 11,6866.2 "Travel" (b) US$ Mn 5,677 10,5996.3 "Passenger transport" (b) US$ Mn 451 1,087
DOMESTIC TOURISM
Accommodation
7.1 Overnight stays in hotels and similar establishments ('000) 9,352 15,8987.2 Guests in hotels and similar establishments ('000) 4,742 8,6527.3 Overnight stays in all types of accommodation establishments ('000) 41,903 44,0367.4 Average length of stay of resident tourists in all accommodation
establishments Nights .. 3.02
OUTBOUND TOURISM
8.1 Departures ('000) 56,677 47,561
8.2 Tourism expenditure in other countries US$ Mn 3,417 8,3418.3 "Travel" (b) US$ Mn 3,315 7,7538.4 "Passenger transport" (b) US$ Mn 102 588
TOURISM INDUSTRIES
Hotels and similar establishments
9.1 Number of rooms Units 60,853 93,9449.2 Number of bed-places Units 120,280 190,3879.3 Occupancy rate Percent 39.60 46.109.4 Average length of stay Nights 3.35 1.95
(a) As in the UNWTO Compendium of Tourism Statistics(b) Balance of Payments items: 6.1 to 6.3 correspond to the "Credit" side (and are receipts for the country) while 8.2 to 8.4 correspond to the "Debit" side (and are expenditures in other countries).

175
General comments (country notes) (1.1,2.1-3.4) Arrivals of non-resident visitors at national borders; (4.1-4.3) Arrivals of non-resident tourists at national borders, based on surveys by the Institute of Tourism; (5.4) Both collective and private accommodation establishments, based on surveys by the Institute of Tourism; (8.1) Outbound trips registered at frontiers; (9.3) Rooms. Sources: (1.1-5.4,7.1-7.4,8.1,9.1-9.4) Institute of Tourism; (6.1-6.3,8.2-8.4) International Monetary Fund. Balance of Payments items (IMF notes) Transportation Data provided by the banking system on payments and by the surveys on enterprises for transportation services include services broken down by type (sea, air, railway, and other). These data are broken down by passenger transportation, freight, and other forms. Data received from the c.i.f./f.o.b. adjustment of the goods item are also included in freight transportation services. The value of these services is compiled as a fixed rate of the value of goods imports in the foreign trade statistics. Travel The travel item is compiled using data of the Institute of Tourism, which come from border surveys. The NBP receives data on travelers’ expenditures: foreigners in Poland and Poles abroad. When compiling monthly data, NBP makes estimates using information of the Border Guard (on numbers of arrivals and departures) and payments data (including settlements on travel items recorded in the banking system and also purchases and sales of foreign banknotes).
Basic macroeconomic aggregates (c)
PO
L
2000
• 24,327,343
• 14,356,476
• 9,970,107
• (¶)
• 219,483,401
• 13,209,286
• 16,283,193
• 807,859,426
• 56,777,000
• 63,177,000
• 613,835
Internal tourism consumption
Tourism direct gross domestic product p.p
Total jobs
Comments
Tab
le 1
. B
asic
ag
gre
ga
tes
Year
Currency
Units
Gross domest ic product (GDP p.p.)
Inbound tourism consumption
Domestic tourism consumption
Imports of goods and services
Outbound tourism consumptionGross value added of tourism industriesTourism direct gross value added b.p.
Exports of goods and services
(c) These data are the same as those reproduced in T.1. of Chapter 3. Selected aggregates and tables of results

176
ROMANIA (a)
Units2001
(TSA latest reference year)
2007
INBOUND TOURISM
Arrivals
1.1 Visitors ('000) 4,938 7,7221.2 Tourists (overnight visitors) ('000) .. ..1.3 Same-day vis itors ('000) .. ..1.4 Cruise passengers ('000) .. ..
Arrivals by region
2.1 Africa ('000) 5 112.2 Americas ('000) 96 1892.3 Europe ('000) 4,757 7,3942.4 East Asia and the Pacific ('000) 36 802.5 South Asia ('000) 14 172.6 Middle East ('000) 28 29
Arrivals by means of transport used
3.1 Air ('000) 705 1,4603.2 Rail ('000) 476 2753.3 Road ('000) 3,621 5,7533.4 Sea ('000) 135 234
Arrivals by purpose of visit
4.1 Leisure, recreation and holidays ('000) .. ..4.2 Business and professional ('000) .. ..4.3 Other ('000) .. ..
Accommodation
5.1 Overnight stays in hotels and similar establishments ('000) 2,301 3,4975.2 Guests in hotels and similar establishments ('000) 895 1,5315.3 Overnight stays in all types of accommodation establishments ('000) 2,391 3,5865.4 Average length of stay of non-resident tourists in all accommodation
establishments Nights 2.61 2.30
6.1 Tourism expenditure in the country US$ Mn 419 1,9226.2 "Travel" (b) US$ Mn 362 1,4676.3 "Passenger transport" (b) US$ Mn 57 455
DOMESTIC TOURISM
Accommodation
7.1 Overnight stays in hotels and similar establishments ('000) 14,071 16,2597.2 Guests in hotels and similar establishments ('000) 3,575 5,1867.3 Overnight stays in all types of accommodation establishments ('000) 15,731 17,0077.4 Average length of stay of resident tourists in all accommodation
establishments Nights 4.00 3.10
OUTBOUND TOURISM
8.1 Departures ('000) 6,408 10,980
8.2 Tourism expenditure in other countries US$ Mn 475 1,7198.3 "Travel" (b) US$ Mn 449 1,5358.4 "Passenger transport" (b) US$ Mn 26 184
TOURISM INDUSTRIES
Hotels and similar establishments
9.1 Number of rooms Units 95,226 112,1779.2 Number of bed-places Units 199,320 228,1239.3 Occupancy rate Percent 38.40 37.209.4 Average length of stay Nights 3.70 2.94
(a) As in the UNWTO Compendium of Tourism Statistics(b) Balance of Payments items: 6.1 to 6.3 correspond to the "Credit" side (and are receipts for the country) while 8.2 to 8.4 correspond to the "Debit" side (and are expenditures in other countries).

177
General comments (country notes) Sources: (1.1-5.4,7.1-7.4,8.1,9.1-9.4) National Authority for Tourism - Ministry of Transports, Constructions and Tourism; (6.1-6.3,8.2-8.4) International Monetary Fund. Balance of Payments items (IMF notes) Transportation Banking records are the main source for compilation of export freight services. The credit side of the transportation balance is recorded on the basis of banks’ customers’ declarations. In the case of import freight services, an estimation method is used to determine the value of the freight services provided by nonresident carriers to residents. Assuming that the difference in c.i.f./f.o.b. of imported goods refers to transportation and insurance expenses, it is important to assess the weight of transportation services provided by nonresidents in total transportation payments. Insurance costs are calculated by applying an average insurance rate to imports calculated on a c.i.f. basis, and finally deducted from the c.i.f./f.o.b. difference. A breakdown of imports by carrier and by mode of transportation is available from the National Authority for Customs (NAC). Therefore, it is possible to assess, from the remaining part of the c.i.f./f.o.b. difference, the freight services performed by nonresident operators only. Travel Data are based on information obtained from the banks, on an individual basis (transaction-by-transaction data collected from bank customers), supplemented by additional data based on the transactions of the exchange offices, compiled by the SD. Estimates are made of the amounts of foreign exchange used by residents traveling abroad. The foreign exchange transactions of nonresidents made through bureaus of exchange (credits) are derived as the difference between the amounts of foreign exchange sold and purchased by nonresidents in the reporting period.
Basic macroeconomic aggregates (c)
RO
U
2001
RomanianLEU
Billions
• 48,419.9
• 21,083
• 23,109
•• 45,117.3
• 22,879.2
• 25,417.3
• 1,167,687
• 389,147.4
• 479,645.9
• 4,609.9
(¶)
Internal tourism consumption
Tourism direct gross domestic product p.p
Total jobs
Comments
Tab
le 1
. B
asic
ag
gre
ga
tes
Year
Currency
Units
Gross domest ic product (GDP p.p.)
Inbound tourism consumption
Domestic tourism consumption
Imports of goods and services
Outbound tourism consumptionGross value added of tourism industriesTourism direct gross value added b.p.
Exports of goods and services
(c) These data are the same as those reproduced in T.1. of Chapter 3. Selected aggregates and tables of results

178
SAUDI ARABIA (a)
Units2005
(TSA latest reference year)
2007
INBOUND TOURISM
Arrivals
1.1 Visitors ('000) 10,417 13,4791.2 Tourists (overnight visitors) ('000) 8,037 11,5311.3 Same-day vis itors ('000) 2,380 1,9481.4 Cruise passengers ('000) .. ..
Arrivals by region
2.1 Africa ('000) 436 6022.2 Americas ('000) 70 2362.3 Europe ('000) 340 6572.4 East Asia and the Pacific ('000) 439 5792.5 South Asia ('000) 1,142 2,0142.6 Middle East ('000) 5,607 7,444
Arrivals by means of transport used
3.1 Air ('000) 4,287 7,3413.2 Rail ('000) .. ..3.3 Road ('000) 3,301 3,6083.4 Sea ('000) 488 581
Arrivals by purpose of visit
4.1 Leisure, recreation and holidays ('000) 397 5914.2 Business and professional ('000) 1,951 2,6594.3 Other ('000) 5,689 8,280
Accommodation
5.1 Overnight stays in hotels and similar establishments ('000) 70,339 116,6835.2 Guests in hotels and similar establishments ('000) 6,310 8,7155.3 Overnight stays in all types of accommodation establishments ('000) 91,359 152,3725.4 Average length of stay of non-resident tourists in all accommodation
establishments Nights 10.70 13.00
6.1 Tourism expenditure in the country US$ Mn 5,626 6,0206.2 "Travel" (b) US$ Mn 5,149 5,2246.3 "Passenger transport" (b) US$ Mn 477 796
DOMESTIC TOURISM
Accommodation
7.1 Overnight stays in hotels and similar establishments ('000) 108,236 113,7797.2 Guests in hotels and similar establishments ('000) 17,031 17,4997.3 Overnight stays in all types of accommodation establishments ('000) 196,737 188,4037.4 Average length of stay of resident tourists in all accommodation
establishments Nights 6.50 6.60
OUTBOUND TOURISM
8.1 Departures ('000) 4,403 4,817
8.2 Tourism expenditure in other countries US$ Mn 4,178 6,2798.3 "Travel" (b) US$ Mn 3,975 4,8808.4 "Passenger transport" (b) US$ Mn 203 1,399
TOURISM INDUSTRIES
Hotels and similar establishments
9.1 Number of rooms Units 156,931 193,7209.2 Number of bed-places Units 389,354 434,0819.3 Occupancy rate Percent 51.30 51.909.4 Average length of stay Nights 2.23 2.20
(a) As in the UNWTO Compendium of Tourism Statistics(b) Balance of Payments items: 6.1 to 6.3 correspond to the "Credit" side (and are receipts for the country) while 8.2 to 8.4 correspond to the "Debit" side (and are expenditures in other countries).

179
General comments (country notes) (6.1-6.3,8.2-8.4) The expenditure figures are those provided by the country to UNWTO, which do not appear in the International Monetary Fund data used in the preparation of this edition of the Compendium; (9.1/2003) Hotels only. Source: The Supreme Commission for Tourism. Balance of Payments items (IMF notes) Transportation This item covers all air, marine, and land transport services and includes passenger, freight, and other services. Data on air, marine, and land transport are obtained from the Saudi Arabian Airlines, the Presidency of Civil Aviation, the General Ports Authority, and the Saudi Land Transportation Company. Data on freight are estimated. Travel Foreign visitors are mainly pilgrims and Umrah performers year-round—especially those who visit Saudi Arabia around the months of Dhul-Hijjah and Ramadan each year. Expenditures are estimated on the basis of data received from the Ministry of Interior on actual numbers of pilgrims and other visitors. Data on travel by residents of Saudi Arabia abroad are obtained from the commercial banks, which record the purpose for sales of foreign exchange.
Basic macroeconomic aggregates (c)
KS
A
2005
SAR
Millions
• 57,777
• 22,234
• 35,543
• 15,128
• 36,444
• 36,444
• 59,077
• 1,183
• 719,898
• 328,678
• 332,275
(¶)
Internal tourism consumption
Tourism direct gross domestic product p.p
Total jobs
Comments
Tab
le 1
. B
asic
ag
gre
ga
tes
Year
Currency
Units
Gross domest ic product (GDP p.p.)
Inbound tourism consumption
Domestic tourism consumption
Imports of goods and services
Outbound tourism consumptionGross value added of tourism industriesTourism direct gross value added b.p.
Exports of goods and services
(c) These data are the same as those reproduced in T.1. of Chapter 3. Selected aggregates and tables of results

180
SLOVENIA (a)
Units2003
(TSA latest reference year)
2007
INBOUND TOURISM
Arrivals
1.1 Visitors ('000) 59,388 61,2931.2 Tourists (overnight visitors) ('000) 1,373 1,7511.3 Same-day vis itors ('000) .. ..1.4 Cruise passengers ('000) .. ..
Arrivals by region
2.1 Africa ('000) .. 22.2 Americas ('000) 36 672.3 Europe ('000) 1,308 1,6172.4 East Asia and the Pacific ('000) 17 652.5 South Asia ('000) .. ..2.6 Middle East ('000) .. ..
Arrivals by means of transport used
3.1 Air ('000) 264 3643.2 Rail ('000) 41 583.3 Road ('000) 1,067 1,3273.4 Sea ('000) 1 2
Arrivals by purpose of visit
4.1 Leisure, recreation and holidays ('000) 894 1,0184.2 Business and professional ('000) 273 3404.3 Other ('000) 206 393
Accommodation
5.1 Overnight stays in hotels and similar establishments ('000) 3,166 3,7075.2 Guests in hotels and similar establishments ('000) 1,053 1,3545.3 Overnight stays in all types of accommodation establishments ('000) 4,175 4,8685.4 Average length of stay of non-resident tourists in all accommodation
establishments Nights 3.04 2.78
6.1 Tourism expenditure in the country US$ Mn 1,427 2,4006.2 "Travel" (b) US$ Mn 1,342 2,2186.3 "Passenger transport" (b) US$ Mn 85 182
DOMESTIC TOURISM
Accommodation
7.1 Overnight stays in hotels and similar establishments ('000) 1,725 1,8397.2 Guests in hotels and similar establishments ('000) 463 5237.3 Overnight stays in all types of accommodation establishments ('000) 3,327 3,3937.4 Average length of stay of resident tourists in all accommodation
establishments Nights 3.81 3.65
OUTBOUND TOURISM
8.1 Departures ('000) 2,114 2,496
8.2 Tourism expenditure in other countries US$ Mn 805 1,2198.3 "Travel" (b) US$ Mn 753 1,1038.4 "Passenger transport" (b) US$ Mn 52 116
TOURISM INDUSTRIES
Hotels and similar establishments
9.1 Number of rooms Units 15,534 17,2519.2 Number of bed-places Units 31,997 36,2479.3 Occupancy rate Percent 47.60 47.429.4 Average length of stay Nights 3.23 2.96
(a) As in the UNWTO Compendium of Tourism Statistics(b) Balance of Payments items: 6.1 to 6.3 correspond to the "Credit" side (and are receipts for the country) while 8.2 to 8.4 correspond to the "Debit" side (and are expenditures in other countries).

181
General comments (country notes) (1.1) Including all categories of travellers irrespective of purpose of visit; (1.2,2.1-2.4) Non-resident tourists staying in all types of accommodation establishments; (3.1-3.4,4.1-4.3) Non-resident tourists staying in all types of accommodation establishments; data from 3 yearly survey on foreign tourists in Slovenia; (8.1) Quarterly survey on travels of domestic population. Sources: (1.1-5.4,7.1-7.4,8.1,9.1-9.4) Statistical Office - Tourism Statistics; (6.1-6.3,8.2-8.4) International Monetary Fund. Balance of Payments items (IMF notes) Transportation Transportation services are broken down by categories of transport (sea, air, road, rail, other transport) and services (passenger, freight, other). The main source for recording transportation services is the ITRS. Travel The ITRS sources used in compiling the “incoming travel” category include (1) health- and education-related services; (2) payments made by nonresidents to Slovenian tourist agencies; (3) net withdrawals in tolars from nonresident accounts; (4) money spent in casinos by nonresidents; (5) data on sales of goods to nonresidents in duty-free shops and consignment warehouses; (6) payments with credit cards; and (7) sales of tolars to nonresidents abroad. Regarding sales of tolars to nonresidents in Slovenia, the Bank of Slovenia estimates the data based on the number of border crossings of foreign travelers and on the number of nights spent in the country by foreign tourists. Data for the category “expenditure on travel” come from the ITRS and estimations.
Basic macroeconomic aggregates (c)
SV
N
2003
• 2,166.7
• 1,157.9
• 932.6
• 744.8
• 1,342.2
• 824.0
• 1,229.0
• 24,875.6
• 11,954.8
• 14,259.0
• 896.0
(¶)
Internal tourism consumption
Tourism direct gross domestic product p.p
Total jobs
Comments
Tab
le 1
. B
asic
ag
gre
ga
tes
Year
Currency
Units
Gross domest ic product (GDP p.p.)
Inbound tourism consumption
Domestic tourism consumption
Imports of goods and services
Outbound tourism consumptionGross value added of tourism industriesTourism direct gross value added b.p.
Exports of goods and services
(c) These data are the same as those reproduced in T.1. of Chapter 3. Selected aggregates and tables of results

182
SLOVAKIA (a)
Units2005
(TSA latest reference year)
2007
INBOUND TOURISM
Arrivals
1.1 Visitors ('000) 29,396 32,6241.2 Tourists (overnight visitors) ('000) 1,515 1,6851.3 Same-day visitors ('000) .. ..1.4 Cruise passengers ('000) .. ..
Arrivals by region
2.1 Africa ('000) 2 22.2 Americas ('000) 42 442.3 Europe ('000) 1,413 1,5592.4 East Asia and the Pacific ('000) 56 742.5 South Asia ('000) 1 12.6 Middle East ('000) .. 4
Arrivals by means of transport used
3.1 Air ('000) 16 173.2 Rail ('000) 54 593.3 Road ('000) 13,807 14,7183.4 Sea ('000) 3 3
Arrivals by purpose of visit
4.1 Leisure, recreation and holidays ('000) .. ..4.2 Business and professional ('000) .. ..4.3 Other ('000) .. ..
Accommodation
5.1 Overnight stays in hotels and similar establishments ('000) 4,055 4,4065.2 Guests in hotels and similar establishments ('000) 1,307 1,4585.3 Overnight stays in all types of accommodation establishments ('000) 4,872 5,1995.4 Average length of stay of non-resident tourists in all accommodation
establishments Nights 3.20 3.10
6.1 Tourism expenditure in the country US$ Mn 1,282 2,3526.2 "Travel" (b) US$ Mn 1,210 2,0266.3 "Passenger transport" (b) US$ Mn 72 326
DOMESTIC TOURISM
Accommodation
7.1 Overnight stays in hotels and similar establishments ('000) 3,978 4,0827.2 Guests in hotels and similar establishments ('000) 1,495 1,5857.3 Overnight stays in all types of accommodation establishments ('000) 5,861 6,3687.4 Average length of stay of resident tourists in all accommodation
establishments Nights 3.10 3.04
OUTBOUND TOURISM
8.1 Departures ('000) 22,405 23,837
8.2 Tourism expenditure in other countries US$ Mn 1,122 1,8258.3 "Travel" (b) US$ Mn 844 1,5338.4 "Passenger transport" (b) US$ Mn 278 292
TOURISM INDUSTRIES
Hotels and similar establishments
9.1 Number of rooms Units 35,688 41,5699.2 Number of bed-places Units 90,093 105,6979.3 Occupancy rate Percent 35.00 33.709.4 Average length of stay Nights 2.80 3.10
(a) As in the UNWTO Compendium of Tourism Statistics(b) Balance of Payments items: 6.1 to 6.3 correspond to the "Credit" side (and are receipts for the country) while 8.2 to 8.4 correspond to the "Debit" side (and are expenditures in other countries).

183
General comments (country notes) (1.2,2.1-2.5) Non-resident tourists staying in all types of accommodation establishments. Sources: (1.1-5.4,7.1-7.4,8.1,9.1-9.4) Department of Tourism - Ministry of Economy and Statistical Office; (6.1-6.3,8.2-8.4) International Monetary Fund.
Basic macroeconomic aggregates (c)
SV
K
2005
SKK
Millions
• 64,099
• 30,180
• 32,597
• 23,943
• 139,121
• 28,162
• 34,257
• 1,485,671
• 1,132,828
• 1,200,966
• 20,057,045
Inbound tourism consumption
Domestic tourism consumption
Imports of goods and services
Outbound tourism consumption
Gross value added of tourism industriesTourism direct gross value added b.p.
Exports of goods and services
Internal tourism consumption
Tourism direct gross domestic product p.p
Total jobs
Comments
Tab
le 1
. B
asic
ag
gre
gat
es
Year
Currency
Units
Gross domestic product (GDP p.p.)
(c) These data are the same as those reproduced in T.1. of Chapter 3. Selected aggregates and tables of results

184
SPAIN (a)
Units2004
(TSA latest reference year)
2007
INBOUND TOURISM
Arrivals
1.1 Visitors ('000) 85,981 99,0631.2 Tourists (overnight visitors) ('000) 52,430 59,1931.3 Same-day vis itors ('000) 33,551 39,8701.4 Cruise passengers ('000) .. ..
Arrivals by region
2.1 Africa ('000) .. ..2.2 Americas ('000) 2,079 2,5362.3 Europe ('000) 49,239 55,1692.4 East Asia and the Pacific ('000) 151 3652.5 South Asia ('000) .. ..2.6 Middle East ('000) .. ..
Arrivals by means of transport used
3.1 Air ('000) 38,524 44,3243.2 Rail ('000) 298 2503.3 Road ('000) 12,097 13,0873.4 Sea ('000) 1,511 1,532
Arrivals by purpose of visit
4.1 Leisure, recreation and holidays ('000) 41,377 46,9634.2 Business and professional ('000) 5,286 6,5654.3 Other ('000) 5,767 5,665
Accommodation
5.1 Overnight stays in hotels and similar establishments ('000) 134,654 155,4285.2 Guests in hotels and similar establishments ('000) 27,620 35,8445.3 Overnight stays in all types of accommodation establishments ('000) 209,081 225,6475.4 Average length of stay of non-resident tourists in all accommodation
establishments Nights 4.88 5.11
6.1 Tourism expenditure in the country US$ Mn 49,996 65,1366.2 "Travel" (b) US$ Mn 45,067 57,8836.3 "Passenger transport" (b) US$ Mn 4,929 7,253
DOMESTIC TOURISM
Accommodation
7.1 Overnight stays in hotels and similar establishments ('000) 100,044 116,8157.2 Guests in hotels and similar establishments ('000) 39,211 48,7257.3 Overnight stays in all types of accommodation establishments ('000) 135,188 156,9987.4 Average length of stay of resident tourists in all accommodation
establishments Nights 2.55 2.70
OUTBOUND TOURISM
8.1 Departures ('000) 5,121 11,276
8.2 Tourism expenditure in other countries US$ Mn 14,864 24,1798.3 "Travel" (b) US$ Mn 12,153 19,7248.4 "Passenger transport" (b) US$ Mn 2,711 4,455
TOURISM INDUSTRIES
Hotels and similar establishments
9.1 Number of rooms Units 766,952 821,1439.2 Number of bed-places Units 1,511,592 1,642,4179.3 Occupancy rate Percent 53.47 56.139.4 Average length of stay Nights 3.51 3.22
(a) As in the UNWTO Compendium of Tourism Statistics(b) Balance of Payments items: 6.1 to 6.3 correspond to the "Credit" side (and are receipts for the country) while 8.2 to 8.4 correspond to the "Debit" side (and are expenditures in other countries).
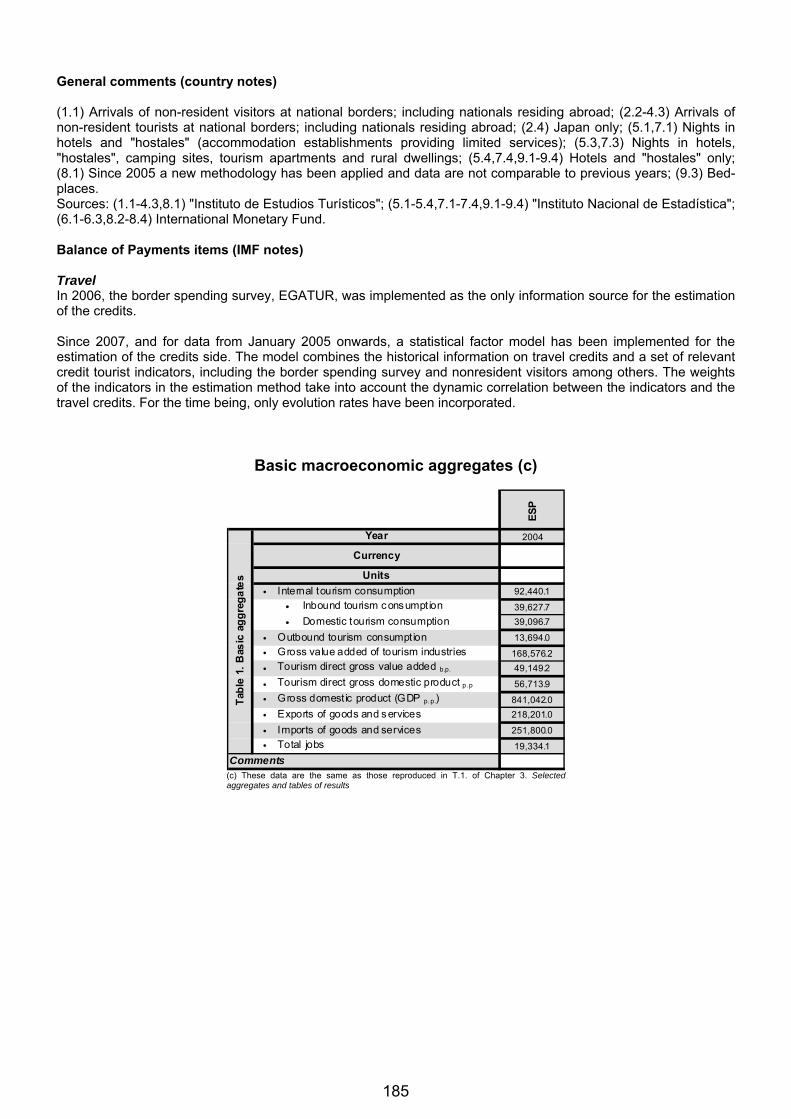
185
General comments (country notes) (1.1) Arrivals of non-resident visitors at national borders; including nationals residing abroad; (2.2-4.3) Arrivals of non-resident tourists at national borders; including nationals residing abroad; (2.4) Japan only; (5.1,7.1) Nights in hotels and "hostales" (accommodation establishments providing limited services); (5.3,7.3) Nights in hotels, "hostales", camping sites, tourism apartments and rural dwellings; (5.4,7.4,9.1-9.4) Hotels and "hostales" only; (8.1) Since 2005 a new methodology has been applied and data are not comparable to previous years; (9.3) Bed-places. Sources: (1.1-4.3,8.1) "Instituto de Estudios Turísticos"; (5.1-5.4,7.1-7.4,9.1-9.4) "Instituto Nacional de Estadística"; (6.1-6.3,8.2-8.4) International Monetary Fund. Balance of Payments items (IMF notes) Travel In 2006, the border spending survey, EGATUR, was implemented as the only information source for the estimation of the credits. Since 2007, and for data from January 2005 onwards, a statistical factor model has been implemented for the estimation of the credits side. The model combines the historical information on travel credits and a set of relevant credit tourist indicators, including the border spending survey and nonresident visitors among others. The weights of the indicators in the estimation method take into account the dynamic correlation between the indicators and the travel credits. For the time being, only evolution rates have been incorporated.
Basic macroeconomic aggregates (c)
ES
P2004
• 92,440.1
• 39,627.7
• 39,096.7
• 13,694.0
• 168,576.2
• 49,149.2
• 56,713.9
• 841,042.0
• 218,201.0
• 251,800.0
• 19,334.1
Internal tourism consumption
Tourism direct gross domestic product p.p
Total jobs
Comments
Tab
le 1
. B
asic
ag
gre
ga
tes
Year
Currency
Units
Gross domest ic product (GDP p.p.)
Inbound tourism consumption
Domestic tourism consumption
Imports of goods and services
Outbound tourism consumptionGross value added of tourism industriesTourism direct gross value added b.p.
Exports of goods and services
(c) These data are the same as those reproduced in T.1. of Chapter 3. Selected aggregates and tables of results

186
SWEDEN (a)
Units2007
(TSA latest reference year)
INBOUND TOURISM
Arrivals
1.1 Visitors ('000) ..1.2 Tourists (overnight visitors) ('000) 3,4341.3 Same-day vis itors ('000) ..1.4 Cruise passengers ('000) ..
Arrivals by region
2.1 Africa ('000) ..2.2 Americas ('000) ..2.3 Europe ('000) ..2.4 East Asia and the Pacific ('000) ..2.5 South Asia ('000) ..2.6 Middle East ('000) ..
Arrivals by means of transport used
3.1 Air ('000) ..3.2 Rail ('000) ..3.3 Road ('000) ..3.4 Sea ('000) ..
Arrivals by purpose of visit
4.1 Leisure, recreation and holidays ('000) ..4.2 Business and professional ('000) ..4.3 Other ('000) ..
Accommodation
5.1 Overnight stays in hotels and similar establishments ('000) 5,8425.2 Guests in hotels and similar establishments ('000) 2,9935.3 Overnight stays in all types of accommodation establishments ('000) 11,2005.4 Average length of stay of non-resident tourists in all accommodation
establishments Nights 2.14
6.1 Tourism expenditure in the country US$ Mn 13,7066.2 "Travel" (b) US$ Mn 12,0046.3 "Passenger transport" (b) US$ Mn 1,702
DOMESTIC TOURISM
Accommodation
7.1 Overnight stays in hotels and similar establishments ('000) 19,5747.2 Guests in hotels and similar establishments ('000) 12,4597.3 Overnight stays in all types of accommodation establishments ('000) 37,4057.4 Average length of stay of resident tourists in all accommodation
establishments Nights 2.08
OUTBOUND TOURISM
8.1 Departures ('000) 12,681
8.2 Tourism expenditure in other countries US$ Mn 15,6968.3 "Travel" (b) US$ Mn 13,9728.4 "Passenger transport" (b) US$ Mn 1,724
TOURISM INDUSTRIES
Hotels and similar establishments
9.1 Number of rooms Units 103,7939.2 Number of bed-places Units 207,4399.3 Occupancy rate Percent 37.209.4 Average length of stay Nights ..
(a) As in the UNWTO Compendium of Tourism Statistics(b) Balance of Payments items: 6.1 to 6.3 correspond to the "Credit" side (and are receipts for the country) while 8.2 to 8.4 correspond to the "Debit" side (and are expenditures in other countries).

187
General comments (country notes) (1.2) Non-resident tourists staying in all types of accommodation establishments, camping excluding; (2.1-4.3) Data according to IBIS-Survey (Incoming Visitors to Sweden) during the years 2001 to 2003, (no data collected before 2001 or after 2003). Source: Swedish Tourist Authority and Statistics Sweden; (5.1,7.1,9.1,9.2) Hotels only; (9.3) Bed-places. Sources: (1.2-5.4,7.1-7.4,8.1,9.1-9.3) NUTEK - The Swedish Agency for Economic and Regional Growth; (6.1-6.3,8.2-8.4) International Monetary Fund. Balance of Payments items (IMF notes) Transportation Transportation data are based on a survey compiled by Statistics Sweden. Travel For the travel component, Sveriges Riksbank uses three sources: (1) reports from banks and currency dealers on sales and purchases to/from the public of banknotes and travelers’ checks; the report also covers banks’ sales and purchases of Swedish banknotes vis-à-vis foreign banks; (2) reports on transactions made with credit cards; the estimation is made on gross flows of Swedish banknotes exchanged abroad by travelers from Sweden and resold to the public by foreign banks; and (3) quarterly surveys covering, for example, travel agencies. A recurrent supplementary household survey serves as a basis for estimation of a split between tourism and business travel; it also supplies information for geographical breakdown estimates.
Basic macroeconomic aggregates (c)
SW
E
2007
••
•
••
•
••
•
••
Internal tourism consumption
Tourism direct gross domestic product p.p
Total jobs
Comments
Tab
le 1
. B
asic
ag
gre
ga
tes
Year
Currency
Units
Gross domest ic product (GDP p.p.)
Inbound tourism consumption
Domestic tourism consumption
Imports of goods and services
Outbound tourism consumptionGross value added of tourism industriesTourism direct gross value added b.p.
Exports of goods and services
(c) These data are the same as those reproduced in T.1. of Chapter 3. Selected aggregates and tables of results

188
SWITZERLAND (a)
Units2005
(TSA latest reference year)
2007
INBOUND TOURISM
Arrivals
1.1 Visitors ('000) .. ..1.2 Tourists (overnight visitors) ('000) 7,229 8,4481.3 Same-day visitors ('000) .. ..1.4 Cruise passengers ('000) .. ..
Arrivals by region
2.1 Africa ('000) 78 852.2 Americas ('000) 830 9542.3 Europe ('000) 5,305 6,2262.4 East Asia and the Pacific ('000) 847 9412.5 South Asia ('000) 93 1322.6 Middle East ('000) 76 109
Arrivals by means of transport used
3.1 Air ('000) .. ..3.2 Rail ('000) .. ..3.3 Road ('000) .. ..3.4 Sea ('000) .. ..
Arrivals by purpose of visit
4.1 Leisure, recreation and holidays ('000) .. ..4.2 Business and professional ('000) .. ..4.3 Other ('000) .. ..
Accommodation
5.1 Overnight stays in hotels and similar establishments ('000) 18,321 20,9185.2 Guests in hotels and similar establishments ('000) 7,229 8,4485.3 Overnight stays in all types of accommodation establishments ('000) .. ..5.4 Average length of stay of non-resident tourists in all accommodation
establishments Nights .. 2.48
6.1 Tourism expenditure in the country US$ Mn 11,937 14,7776.2 "Travel" (b) US$ Mn 10,041 12,1856.3 "Passenger transport" (b) US$ Mn 1,896 2,592
DOMESTIC TOURISM
Accommodation
7.1 Overnight stays in hotels and similar establishments ('000) 14,622 15,4477.2 Guests in hotels and similar establishments ('000) 6,574 7,1857.3 Overnight stays in all types of accommodation establishments ('000) .. ..7.4 Average length of stay of resident tourists in all accommodation
establishments Nights 2.20 2.15
OUTBOUND TOURISM
8.1 Departures ('000) .. ..
8.2 Tourism expenditure in other countries US$ Mn 10,579 12,4498.3 "Travel" (b) US$ Mn 8,782 10,2658.4 "Passenger transport" (b) US$ Mn 1,797 2,184
TOURISM INDUSTRIES
Hotels and similar establishments
9.1 Number of rooms Units 127,410 127,7109.2 Number of bed-places Units 239,150 241,0199.3 Occupancy rate Percent 39.70 43.609.4 Average length of stay Nights 2.40 2.33
(a) As in the UNWTO Compendium of Tourism Statistics(b) Balance of Payments items: 6.1 to 6.3 correspond to the "Credit" side (and are receipts for the country) while 8.2 to 8.4 correspond to the "Debit" side (and are expenditures in other countries).

189
General comments (country notes) (1.2,2.1-2.6,5.1,5.2,7.1,7.2,9.1,9.2/2003/2004) Hotels, motels and inns; (1.2,2.1-2.6,5.1,5.2,7.1,7.2,9.1-9.4/2005-2007) Hotels and health establishments; (9.3) Net occupancy rates (bed-places available). Sources: (1.2-5.4,7.1-7.4,9.1-9.4) Swiss Federal Statistical Office; (6.1-6.3,8.2-8.4) International Monetary Fund.
Basic macroeconomic aggregates (c)
CH
E
2005
CHF
Millions
• 32,561
• 12,027
• 18,421
• 0
• 0
• 12,647
• 0
• 463,139
• 226,250
• 196,074
• 138,203
(¶)
Internal tourism consumption
Tourism direct gross domestic product p.p
Total jobs
Comments
Tab
le 1
. B
asic
ag
gre
gat
es
Year
Currency
Units
Gross domestic product (GDP p.p.)
Inbound tourism consumption
Domestic tourism consumption
Imports of goods and services
Outbound tourism consumption
Gross value added of tourism industriesTourism direct gross value added b.p.
Exports of goods and services
(c) These data are the same as those reproduced in T.1. of Chapter 3. Selected aggregates and tables of results

190
UNITED STATES (a)
Units2006
(TSA latest reference year)
2007
INBOUND TOURISM
Arrivals
1.1 Visitors ('000) .. ..1.2 Tourists (overnight visitors) ('000) 50,978 55,9861.3 Same-day visitors ('000) .. ..1.4 Cruise passengers ('000) .. ..
Arrivals by region
2.1 Africa ('000) 252 2762.2 Americas ('000) 33,129 36,4712.3 Europe ('000) 10,531 11,8392.4 East Asia and the Pacific ('000) 6,428 6,5632.5 South Asia ('000) 474 6412.6 Middle East ('000) 164 196
Arrivals by means of transport used
3.1 Air ('000) 27,807 30,3253.2 Rail ('000) .. ..3.3 Road ('000) 22,717 25,1433.4 Sea ('000) 453 503
Arrivals by purpose of visit
4.1 Leisure, recreation and holidays ('000) 10,776 10,8714.2 Business and professional ('000) 5,569 6,7854.3 Other ('000) 5,323 6,236
Accommodation
5.1 Overnight stays in hotels and similar establishments ('000) 28,805 30,0085.2 Guests in hotels and similar establishments ('000) 16,944 18,7555.3 Overnight stays in all types of accommodation establishments ('000) .. ..5.4 Average length of stay of non-resident tourists in all accommodation
establishments Nights 1.70 1.60
6.1 Tourism expenditure in the country US$ Mn 128,871 144,8086.2 "Travel" (b) US$ Mn 106,836 119,2236.3 "Passenger transport" (b) US$ Mn 22,035 25,585
DOMESTIC TOURISM
Accommodation
7.1 Overnight stays in hotels and similar establishments ('000) .. ..7.2 Guests in hotels and similar establishments ('000) .. ..7.3 Overnight stays in all types of accommodation establishments ('000) .. ..7.4 Average length of stay of resident tourists in all accommodation
establishments Nights .. ..
OUTBOUND TOURISM
8.1 Departures ('000) 63,662 64,052
8.2 Tourism expenditure in other countries US$ Mn 104,447 109,5788.3 "Travel" (b) US$ Mn 76,946 81,0928.4 "Passenger transport" (b) US$ Mn 27,501 28,486
TOURISM INDUSTRIES
Hotels and similar establishments
9.1 Number of rooms Units 4,389,443 4,476,1919.2 Number of bed-places Units .. ..9.3 Occupancy rate Percent 63.30 63.109.4 Average length of stay Nights .. ..
(a) As in the UNWTO Compendium of Tourism Statistics(b) Balance of Payments items: 6.1 to 6.3 correspond to the "Credit" side (and are receipts for the country) while 8.2 to 8.4 correspond to the "Debit" side (and are expenditures in other countries).

191
General comments (country notes) (1.2,2.2) Including Mexicans staying one or more nights in the US; (3.1-3.4) Preliminary estimates; (3.3) Including a very small percentage (0.2%) of travelers for whom transportation mode is not known; (4.1-4.3) Main trip purpose; (4.1-4.3,5.1-5.4) Overseas only; excluding Mexico (data are not available); (6.2,8.3) The country provides UNWTO with expenditure figures that differ significantly from the International Monetary Fund data used in the preparation of this edition of the Compendium. The country figures are as follows: 6.2 8.3 2003: 64,359 57,447 2004: 74,546 65,750 2005: 81,799 68,970 2006: 85,720 72,104 2007: 96,712 76,167 (8.1) Including Americans staying one or more nights in Mexico. Sources: (1.2-5.4,8.1) Office of Travel and Tourism Industries; (6.1-6.3,8.2-8.4) International Monetary Fund; (9.1,9.3) American Hotel & Lodging Association (AHLA).
Basic macroeconomic aggregates (c)
US
A
2006
US $
Billions
• 677,706
• 83,981
• 593,725
• 125,820
• 13,205,406
•
• 349,157
• 13,178,376
• 1,322,441
• 2,084,456
• 136,086,000
(¶)
Inbound tourism consumption
Domestic tourism consumption
Imports of goods and services
Outbound tourism consumption
Gross value added of tourism industriesTourism direct gross value added b.p.
Exports of goods and services
Internal tourism consumption
Tourism direct gross domestic product p.p
Total jobs
Comments
Tab
le 1
. B
asic
ag
gre
gat
es
Year
Currency
Units
Gross domestic product (GDP p.p.)
(c) These data are the same as those reproduced in T.1. of Chapter 3. Selected aggregates and tables of results