truth in advertising in the fitness industry. calorie myths more than the score september 8, 2007...
TRANSCRIPT

Truth in Advertising in the Fitness Industry

Calorie Myths
More than the ScoreSeptember 8, 2007
Glenn Gaesser, Ph.D.
Professor and Director
Kinesiology Program
Curry School of Education


Dr. Phil’s UltimateWeight Solution
TheSouth BeachDiet
Dr. Atkin’sNew DietRevolution
SugarBusters!
Enter the ZoneProtein Power
Pritikin
Ornish
Glucose Revolution

Good Carbs? Bad Carbs? No Carbs?
High Glycemic?
Low Glycemic?

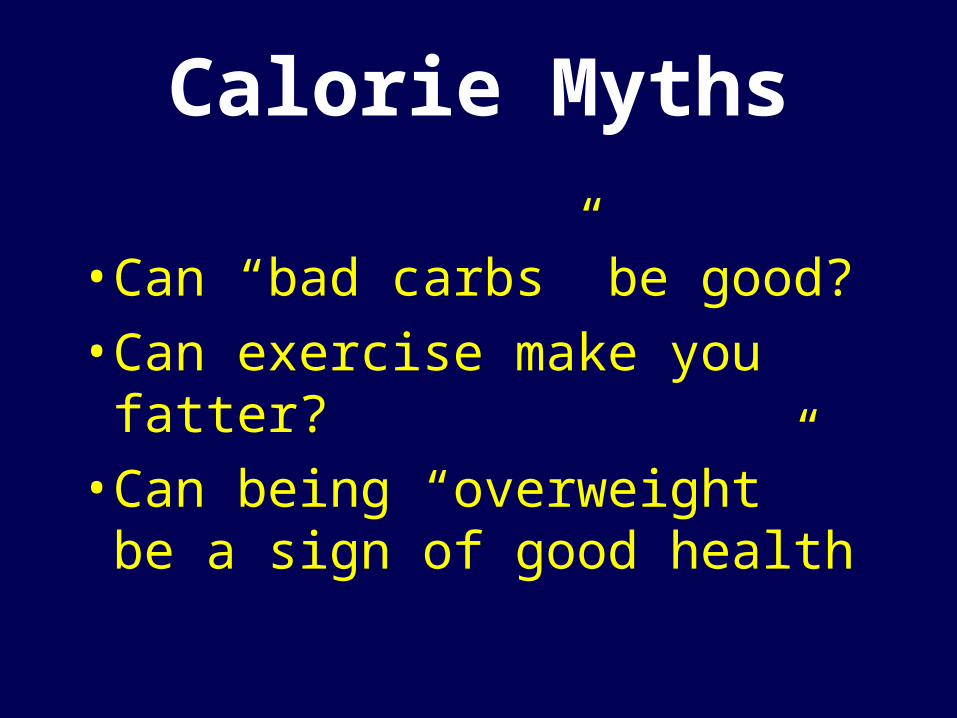
Calorie Myths
• Can “bad carbs” be good?
• Can exercise make you fatter?
• Can being “overweight” be a sign of good health

The Calorie Conundrum• Intense focus on weight (loss)
• Prevalence of weight loss attempts at all-time time
• Diet industry ~ $35 billion/year
• Exercise programs mainly geared to “burn fat”

Google Search:Weight Loss Options
Key words Hits
• “fat burning exercise” 42,300
• “fat burning foods” 167,000
• “permanent weight loss” 376,000• “six-pack abs” 573,000


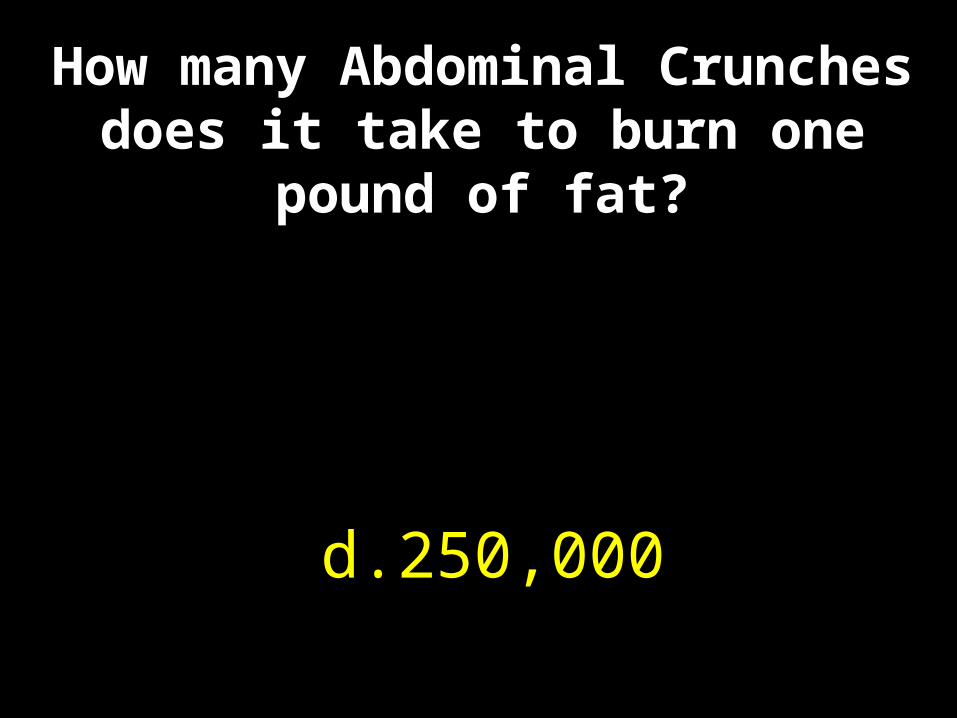
How many Abdominal Crunches does it take to burn one pound of fat?
a. 250
b. 2,500
c. 25,000
d. 250,000
How many Abdominal Crunches does it take to burn one pound of fat?
a. 250
b. 2,500
c. 25,000
d. 250,000

Measuring Calorie Burning During Exercise


What About Exercise?
• Burns Calories
• Reduces Body Fat
• Adds Muscle

Replacing 1 Pound of Fat with 1 Pound of Muscle will Burn how Many
Extra Calories each Day?
a. 5
b. 50
c. 75
d. 100

Replacing 1 Pound of Fat with 1 Pound of Muscle will Burn how Many
Extra Calories each Day?
a. 5
b. 50
c. 75
d. 100

Does Exercise Reduce Body Fat?
--Population Studies
--Exercise Intervention Studies

2021222324252627282930
0 1 2 3 4 5
Physical Activity Level
Bo
dy
Ma
ss
Ind
ex
. NHS
NHS (Post)
Finnish
IWHS
Copenhagen
German
Tromso
Association Between Physical Activity Level and Body Mass Index Among Women

22
23
24
25
26
27
28
29
0 1 2 3 4 5
Physical Activity Level
Bo
dy
Ma
ss
Ind
ex
. HPFS
Whitehall
Finnish
Copenhagen
German
Tromso
Zutphen
Goteborg
Association Between Physical Activity and Body Mass Index Among Men
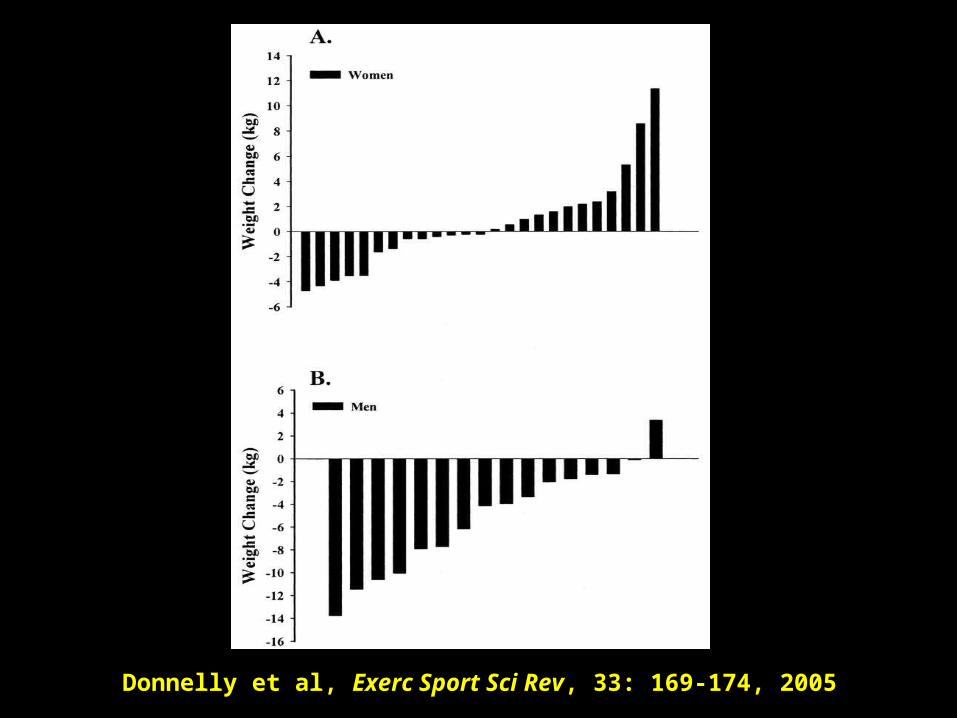
Donnelly et al, Exerc Sport Sci Rev, 33: 169-174, 2005
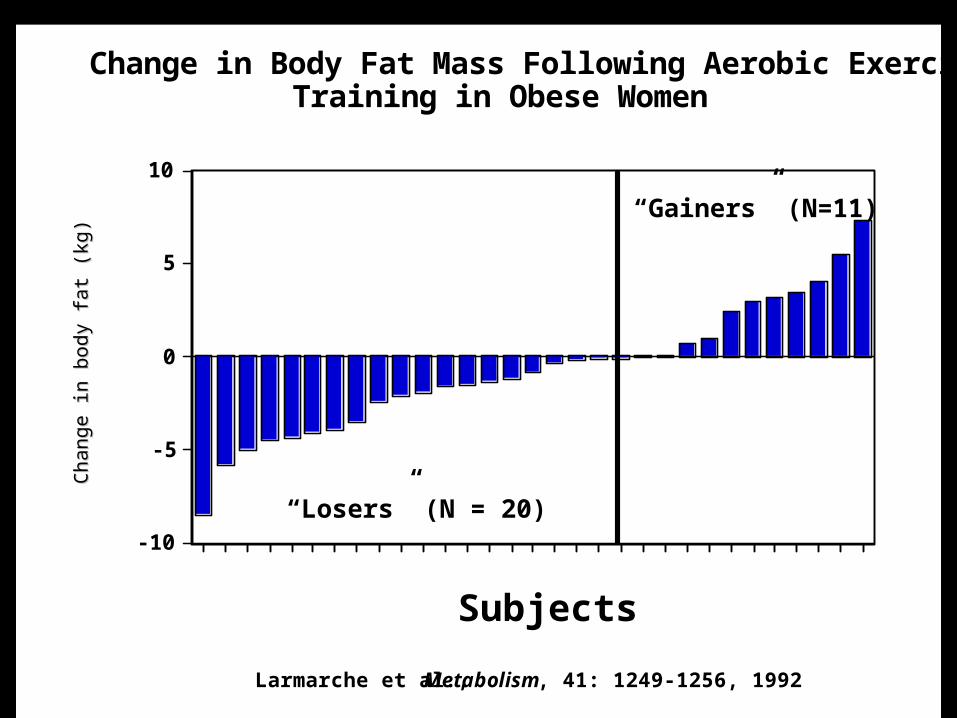
Change in Body Fat Mass Following Aerobic Exercise Training in Obese Women
-10
-5
0
5
10
Fat
Mas
s C
hang
e (k
g)
Subjects
“Losers” (N = 20)
“Gainers” (N=11)
Larmarche et al., Metabolism, 41: 1249-1256, 1992
Cha
nge
in b
ody
fat (
kg)
Cha
nge
in b
ody
fat (
kg)

Up to one-half of women will not lose a single pound of body fat with
exercise….
Up to one-third of women will actually gain body fat as a result of
exercise.

Change in BMI Over 10-year Follow-up in Active and Inactive Older Persons
2021222324252627282930
Active Inactive
Bod
y M
ass
Inde
x
.1987 1997
Petrella et al., Diabetes Care, 2005; 28: 694-701

Dr. Phil’s UltimateWeight Solution
TheSouth BeachDiet
Dr. Atkin’sNew DietRevolution
SugarBusters!
Enter the ZoneProtein Power
Pritikin
Ornish
Glucose Revolution

Prevalence of Obesity and Weight Loss Attempts1960’s – 2000’s
0
10
20
30
40
1960's 1980's 1990's 2000's
% o
f U
.S. A
dults
.
Obesity
Wt Loss Attempt

Major Predictor of Future Weight Gain and Obesity Risk
Frequent Weight Loss Attempts!

Carbohydrate Phobia
Are Carbs bad?

“Shape of the Future:R. Atkins Diet”
--Newsweek

“Atkins Diet:Is It Safe?”
--McCall’s

“Risks in the new low-carbohydrate
diet”
--Reader’s Digest

“Shape of the Future:R. Atkins Diet”
--Newsweek
1975

“Atkins Diet:Is It Safe?”
--McCall’s1973

“Risks in the new low-carbohydrate
diet”
--Reader’s Digest
1965

Déjà vuall over again?

The So-called“Low-Fat” Phase
of the American Diet1980s – 1990s

Carbohydrate Intake (Percent of Total Kcal)NHANES 1971 – 2000
30
35
40
45
50
55
1971-1974 1976-1980 1988-1994 1999-2000
Inta
ke (
Per
cen
t)
Men
Women
MMWR (2004), 53(04): 80-82
“Low Fat” Years

Fat Intake (Percent of Total Kcal)NHANES 1971 – 2000
20
25
30
35
40
45
1971-1974 1976-1980 1988-1994 1999-2000
Inta
ke (P
erce
nt)
Men
Women
MMWR (2004), 53(04): 80-82
“Low Fat” Years

Did we really go“low fat?”

Fat Intake (Grams/day)NHANES 1971 – 2000
0
20
40
60
80
100
120
1971-1974 1976-1980 1988-1994 1999-2000
Inta
ke (
Gra
ms/
day
)
Men
Women
“Low Fat” Years
MMWR (2004), 53(04): 80-82

Energy Intake, 1971 – 2000 [NHANES]
2618266624392450
1877179815221542
0
500
1000
1500
2000
2500
3000
1971-1974 1976-1980 1988-1994 1999-2000
Inta
ke (
Kca
l/day
)
Men
Women
MMWR (2004), 53(04): 80-82
“Low fat” years

“Low-fat” was a myth
The “low-fat” period of the American diet was, in reality,
HIGH CALORIE
Calories do Count

22
23
24
25
26
27
28
25 35 45 55 65
Carbohydrate (% of total)
Body
Mass
Index
.
NHANES (men)
NHANES (women)
CSFII (men)
CSFII (women)
WHS
NHS I
NHS II
HPFS
Association between CARBOHYDRATE intakeand BODY MASS INDEX
Adapted from: Gaesser, J. Am. Dietetic Assoc., in press

22
23
24
25
26
27
28
29
30
75 125 175 225
Glycemic Load
Body
Mass
Index
.
NHS I
NHS II
WHS
HPFS
Swedish (SMC)
Canadian NBSS
Association between GLYCEMIC LOADand BODY MASS INDEX
Adapted from: Gaesser, J. Am. Dietetic Assoc., in press

22
23
24
25
26
27
28
29
30
25 35 45 55 65 75 85 95
Glycemic Index
Body
Mass
Index
. NHS I
NHS II
WHS
HPFS
ARIC (Whites)
ARIC (Blacks)
Zutphen
Melbourne CCS
Canadian NBSS
Japan (JMETS)
Association between GLYCEMIC INDEXand BODY MASS INDEX
Adapted from: Gaesser, J. Am. Dietetic Assoc., in press

It’s the Calories,Not the Carbs

Is Overweight really a health problem?

Body Weight and Health
“Just a few extra pounds could mean fewer years”
--Washington Post, August 23, 2006

NIH-AARPDiet and Health Study
“Overweight, obesity, and mortality in a large prospective cohort of persons 50 to 71
years old”
New Engl J Med 2006; 355: 763-778
Authors’ Conclusion
“Excess body weight during midlife, including overweight, is associated with an increased
risk of death.”

NIH-AARP Diet and Health Study
• 3+ million surveys sent out in 1995/96• 567,169 returned (~18% return rate)• 527,265 used in main data analysis• 10-year follow-up• Main conclusion based 111,081 (21% of
those returned; <4% of surveys mailed) men and women who never smoked and provided information on “recalled weight” at age 50

BMI Standards
• <18.5 Underweight
• 18.5-24.9 Normal Weight
• 25.0-29.9 Overweight
• >30 Obese

BMI Category Associated with the Lowest, and Highest, Relative Risk For Mortality - Men
Variable Lowest risk BMI category* Highest risk BMI category*
Overall Overweight UnderweightWhite Overweight UnderweightBlack Overweight UnderweightHispanic Overweight ObeseAsian, Pac Island, NA Overweight ObeseAge 50-55 Overweight UnderweightAge 56-60 Overweight UnderweightAge 61-65 Overweight UnderweightAge 66-71 Overweight UnderweightSmoker Overweight UnderweightFormer smoker Overweight UnderweightNever smoked Overweight ObesePreexisting chronic disease Overweight UnderweightNo preexisting disease Overweight ObeseFollow-up <5 years Overweight UnderweightFollow-up >5 years Overweight ObeseBMI at age 50** Normal ObeseBMI at age 50, never smoked Normal Obese

BMI Category Associated with the Lowest, and Highest, Relative Risk For Mortality - Women
Variable Lowest risk BMI category* Highest risk BMI category*Overall Normal = Overweight UnderweightWhite Normal = Overweight UnderweightBlack Overweight UnderweightHispanic Normal ObeseAsian, Pac Island, NA Normal ObeseAge 50-55 Overweight UnderweightAge 56-60 Normal ObeseAge 61-65 Overweight UnderweightAge 66-71 Normal UnderweightSmoker Overweight UnderweightFormer smoker Normal = Overweight UnderweightNever smoked Normal ObesePreexisting chronic disease Overweight UnderweightNo preexisting disease Normal ObeseFollow-up <5 years Normal UnderweightFollow-up >5 years Overweight ObeseBMI at age 50** Normal ObeseBMI at age 50, never smoked Normal Obese

Authors’ Conclusion
“Excess body weight during midlife, including overweight, is associated with an increased
risk of death.”

This conclusion is based on results from 21% of the sample population
Results from the other 79% of the sample population do not support this
conclusion


Body Weight and Health
“Some Extra Heft May be Helpful, New Study Finds.”
--New York Times, April 20, 2005

All-Cause Mortality, Relative RiskNHANES I, II, III [Ages 25-59]
0.0
0.5
1.0
1.5
2.0
<18.5 18.5-25 25.0-30 30-35 >35
Flegal et al., JAMA 293: 1861-1867, 2005
Rel
ativ
e R
isk
BMI

“The idea that a given body weight, or percentage body fat, is a
meaningful indicator of health, fitness, or prospects for longevity is
one of our most firmly held beliefs—and one of our most dubious
propositions.”
--G. Gaesser, Big Fat Lies, 1996

What does it all mean?
• Health benefits of regular exercise are INDEPENDENT of changes in body weight, or loss of body fat
• Health benefits of healthy eating are INDEPENDENT of changes in body weight, or loss of body fat

Exercise
• 30 minutes of moderate-intensity activity,
5 days per week
OR:
• 20 minutes of vigorous-intensity activity,
3 days per week
AND:
• ~2 days per week of strengthening exercises

Diet
• Choose whole-grain, fiber-rich foods
• Fruits, vegetables
• Reduce intake of saturated and trans fats
• No need to count calories

Enjoy the Game!