trust for nature annual report 2017-18
TRANSCRIPT
Trust for NatureAnnual Report 2017-18

Published by Trust for Nature (Victoria), Melbourne, September 2018.© State of Victoria, Trust for Nature 2018. This publication is copyright. No part may be reproduced by any process except in accordance with the
provisions of the Copyright Act 1968. ISSN: 1838-9732 An electronic copy of this document is available online at www.trustfornature.org.au.
Recognition of Traditional OwnersTrust for Nature recognises the continuing spiritual and cultural connection of Traditional Owners to Victoria’s land, wildlife, freshwater and saltwater environments. The Trust shares with Victoria’s Traditional Owners a deep appreciation of native wildlife and habitats on both public and private land and in aquatic environments. The Trust recognises that all Victorians share in the benefits of the custodianship and caring for Country that Traditional Owners have practised for centuries. The Trust is committed to helping Traditional Owners conserve, restore where possible and protect natural environments, wildlife and cultural heritage values.
About Trust for NatureWe are one of Australia’s oldest conservation organisations, established in 1972 under an Act of Parliament in Victoria. Our mission is to work collaboratively to protect nature on private land so that Victoria’s most threatened plants and wildlife are conserved for future generations. We hold a unique power in Victoria, enshrined in legislation, to protect private land by applying conservation covenants to property titles in agreement with sympathetic landholders. So far, we have secured more than 100,000 ha of native habitat through a mix of conservation covenants and nature reserves.
We also work collaboratively on conservation projects with governments, communities, other organisations and partners who share our commitment to Victoria’s environment.
Conservation covenants
Trust for Nature properties/reserves
Land protected in Victoria by conservation covenants and Trust for Nature reserves
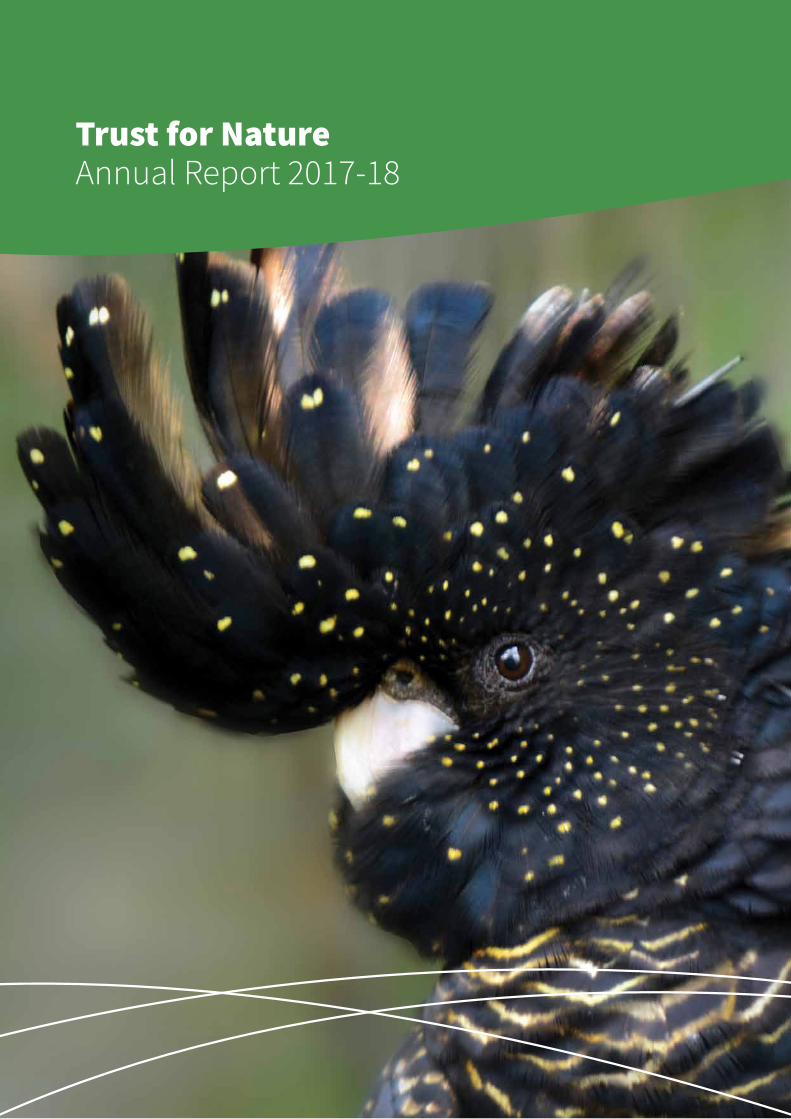
Cover image: Detail of a Red-tailed Black Cockatoo (Calyptorhynchus banksii).

MAJOR ACHIEVEMENTS 2017–18
CONTENTSChair and Chief Executive Officer report ...................2How we operate .............................................................4Key Services ....................................................................6Operational objectives and outcomes ......................9Conservation achievements ....................................11Community engagement ..........................................16Partners and volunteers ............................................19
Thank you to our donors ..........................................22Financial overview .....................................................23Board and employees ...............................................25Organisational chart ..................................................29Statutory compliance ................................................30Disclosure index..........................................................34Financial statements .................................................35
135ecological surveys on
covenanted properties and on our reserves
Co-hosted major national and regional events (such as the annual Women in
Conservation Breakfast and the 2017 Private Land Conservation conference) as a member of the
Australian Land Conservation Alliance
31conservation
covenants registered
1,449more ha of Victoria’s native vegetation, bringing the total area of Victoria that is
protected by conservation covenants or is in reserves owned by the Trust to more than 100,000 ha.
131conservation
management plans for covenanted
properties
68,000hectares of feral animal
control delivered
62field days and workshops across Victoria, including
Spring into Nature community events
Worked on more than 80 privately and publicly funded
projects with conservation partners to protect threatened species including Swift Parrot, Barking Owl, Plains-wanderer, Grey-crowned Babbler, Striped Legless Lizard, Squirrel Glider,
Brush-tailed Phascogale , Spiny Rice-flower, Spur-wing Wattle,
Northern Sandalwood and Warby Range Swamp-gum
Trust for Nature Annual Report 2017-18 1

CHAIR AND CHIEF EXECUTIVE OFFICER REPORT
A milestone year for the protection of biodiversity on private land in Victoria.In 2017-18, Trust for Nature celebrated two major milestones. The first milestone was recording more than 1,400 voluntary conservation covenant agreements on title since the Trust’s inception. These agreements with landholders protect native plants and animals on private land permanently - even after the land changes hands. Putting a protective conservation covenant on a property is one of the most important things landholders can do to help Victoria’s plants and animals survive thereby ensuring they are around for future generations. It is a selfless act and we’re proud to work with so many Victorians who value conservation.
Secondly the total area of land permanently protected by Trust for Nature through private landholders and our own reserves has surpassed 100,000 ha, a milestone 46 years in the making. In 2017–18, a further 1,449 ha of native habitat have been protected through conservation with private landholders. The state government’s 2017 Protecting Victoria’s Environment – Biodiversity 2037 plan has a target to protect 200,000 ha on private land in the next 20 years. This is an important target that Trust for Nature will continue to work with landholders and government to help achieve.
We are pleased to report on our long standing role of transferring properties from private to public ownership to become part of reserves or state and national parks. An achievement this year was the securing of two privately owned properties which have been transferred to public land, becoming part of the Yellingbo Nature Conservation Reserve. The two properties — Bilagal and Burrungma Biik — currently contain, or will contain through restoration, Swampy Riparian Woodland, which is extremely important habitat for the critically endangered Helmeted Honeyeater and Lowland Leadbeater’s Possum.
We have continued a leadership role in private land conservation across Victoria and have worked with many others to maximise our impact. In 2017-18 the Trust partnered and shared our expertise with more than 100 organisations, community groups, businesses and the Victorian and Australian governments.
Locally, our regional teams had a very busy year, supporting landholders and working on more than 80 conservation projects funded by philanthropic organisations, the Australian Government and the Victorian Government. Regional teams continued to deliver improvements to biodiversity protection, including 68,000 hectares of feral animal control, weed control across 3,700 ha, 135 ecological surveys, 131 management plans for covenanted properties, 179 stewardship visits, and the installation of 19 km of fencing. Through this work, the Trust maintained or improved the habitat for a variety of threatened species including the Swift Parrot, Barking Owl, Plains-wanderer, Grey-crowned Babbler, Striped Legless Lizard, Squirrel Glider, Brush-tailed Phascogale, Spiny Rice-flower, Spur-wing Wattle, Northern Sandalwood and Warby Range Swamp-gum.
In June 2017, Trust for Nature’s Board of Trustees adopted the Statement of Intent and Commitment to Victorian Traditional Owner Groups. The statement reflects the Trust’s recognition that all Victorians share in the benefits of the custodianship and caring for Country that Traditional Owners have practiced for centuries. We are building strong partnerships with Traditional Owners. In 2017–18, Trust for Nature participated in activities with Traditional Owners including developing and delivering new partnership projects, spending time together on Country, land management, joint funding applications and sharing knowledge at meetings, community events, workshops and presentations.
www.trustfornature.org.au2

Trust for Nature’s largest reserve — Neds Corner Station in north-west Victoria — saw the restoration of a 500 ha sand hill. This hill was transformed from a degraded site to a flourishing, diverse habitat. This work also included the installation and upgrading around the site of predator-proof fencing. This initiative is important to the future of Neds, as there is now scope to consider re-establishing some of the mammals and birds that once lived there.
The 7th annual Celebrating Women in Conservation Breakfast was held on 1 March 2018, in recognition of International Women’s Day. The annual event was jointly hosted by the Trust and Bush Heritage, attracted 460 guests and was attended by the Minister for Energy, Environment and Climate Change, the Hon. Lily D’Ambrosio. The keynote speaker was renowned ecologist, Professor Lesley Hughes, whose research has focused on the impacts of climate change on species and ecosystems.
At the national level, the Trust continued working with the Australian Land Conservation Alliance, particularly around its 4th annual National Private Land Conservation Conference in Hobart.
The Trust has agreements with voluntary committees of management to look after our reserves. This year, we proudly celebrated the vital contribution to conservation of nearly 100 volunteer committee members who manage the Trust’s reserves. The Trust recognised their contribution at a weekend workshop in Melbourne.
A long-time volunteer Elizabeth Fraser received an OAM this year for her community work, alongside Trust for Nature supporter John Sharwood. Congratulations to both Elizabeth and John.
Without our supporters, Trust for Nature would not be able to deliver many of the tangible outcomes and projects that we have delivered this year. Approximately $1.4 million was raised through overall philanthropic support in 2017—18.
Victoria’s environment is much better off, thanks to these generous gifts from the community.
Geoff Driver Victoria Marles Chair Chief Executive Officer
28 August 2018 28 August 2018
Trust for Nature Annual Report 2017-18 3

HOW WE OPERATEManner of Establishment and Responsible MinisterTrust for Nature operates under the Victorian Conservation Trust Act 1972. The responsible Minister for the period from 1 July 2017 to 30 June 2018 was the Hon Lily D’Ambrosio MP, Minister for Energy, Environment and Climate Change.
The Victorian Conservation Trust Act 1972 and the Trust’s key services
The objects of the Trust as set out in the Act are:
• For public scientific and public educational purposes encourage and assist in: › The preservation of areas which are:
» ecologically significant » of natural interest or beauty; or » of historical interest
› The conservation of wildlife and native plants; and › The conservation and creation of areas for scientific study relating to the above.
• Encourage and assist in the conservation and creation of areas of natural beauty or interest for use by the public for the purposes of enjoyment, recreation and education.
To meet these objects, Trust for Nature has the power to:
• Purchase, sell, transfer and hold land• Surrender land to the Crown• Enter into covenants with owners of land• Accept gifts, donations and bequests
Trust for Nature meets its statutory objects by providing private land conservation services to the Victorian community, government and private landowners. The key services are:
• Land protection services• Stewardship services• Environmental markets services• Conservation reserves• The Revolving Fund
Further detail about these services can be found on pages 6 to 18 of this report.
www.trustfornature.org.au4

Table 1: Links between Trust for Nature’s statutory objects and its activities and services
Victorian Conservation Trust Act 1972 objects
Our Statewide conservation planTrust for Nature is guided by its Statewide Conservation Plan. This provides an over-arching, statewide, scientific framework to inform conservation on private land in Victoria. It identifies private land most in need of protection.
Specifically, it identifies 12 landscapes across Victoria that will make the greatest contribution towards conservation on private land, and prioritises protection of the most threatened ecosystems, wetlands, and plant and wildlife species.
The preservation of areas which are
ecologically significant
The conservation of wildlife and native plants
The conservation and creation of areas for
scientific study, public enjoyment, recreation
and education
Trust for Nature activities and services• Land protection services:
covenants and land management agreements
• Environmental markets services
• Revolving Fund• Protecting ecologically
significant areas• Working collaboratively
Trust for Nature activities and services• Stewardship services• Focal landscapes and
connectivity• Managing protected areas• Improving threatened species
conservation
Trust for Nature activities and services• Education• Supporting research• Events• Development and
communications activities• Contributing to public policy
Trust for Nature Annual Report 2017-18 5

KEY SERVICESLand management and covenantingTrust for Nature registered 31 conservation covenants in 2017–18: These comprised:• 19 covenants voluntarily placed on title without the
landowner receiving an incentive to do so• 11 incentive covenants - where a covenant is agreed
upon as a result of the landowner’s participation in an incentive program
• one covenant developed in a commercial context - where a covenant is a agreed to due to a planning permit requirement, native vegetation offset requirement or fee-for-service arrangements with the land manager
An amendment was also made to an existing covenant (which resulted in increased areas of land under formal protection as part of project delivery).In addition, four technical amendments were registered on title to an existing covenant to clarify the terms of the covenant and survey plan.Regional staff conducted 59 property and covenant assessment visits during the year, compared with 102 visits in 2016–17. Properties were assessed for suitability for covenanting, resulting in the preparation of draft covenant proposals for a further 1,932 ha of land.
Table 2: Conservation covenants registered, area protected
Registered covenants in
2017–18
Registered covenants in
2016–17
Ten-year average registered annual
covenants (2008–2018)
Registered covenant total (1986–2018)
Total 31 34 57 1,416
Area protected in 2017–18
Area protected in 2016–17
Ten-year average total area protected 2008–18
Total area protected 1986–2018
Total 1,449 ha 1,802 ha 3,097 ha 65,565 ha
StewardshipThe objective of Trust for Nature’s stewardship program is to work cooperatively with landowners so that all areas of habitat covenanted by the Trust are managed to maintain and enhance their conservation value. The stewardship program represents a key contribution by the Trust towards the long-term conservation outcomes of government environmental programs.
The Trust works directly with landowners to provide advice on management issues, address threats to biodiversity values and monitor the condition of habitat and trends of species populations on covenanted properties. This is achieved through property visits, the development of management plans and the provision of conservation advice, support and information.
In addition, the stewardship program may identify funding opportunities for landowners to undertake conservation works on covenanted properties. This can include information about incentive and tender
programs, rate concessions, tax concessions or volunteer labour support. The types of activities covered may include revegetation, control of threats such as feral animals, or implementing long-term strategies to improve or protect threatened species.
Trust staff developed and reviewed a total of 131 management plans and conducted 179 stewardship visits to covenanted properties throughout the year.
An expanded set of landholder engagement measures was adopted in 2017–18.
Table 3: Stewardship Services
2017–18 2016-17
Stewardship visits 179 215
Management plans prepared
131 126
www.trustfornature.org.au6

Environmental markets servicesThe objective of Trust for Nature’s engagement in environmental markets is twofold: to ensure the highest conservation benefits flow from regulated offset sites by securing the biodiversity values through to a conservation covenant and stewardship monitoring; and to support and complement Trust for Nature’s activities to conserve native plants and wildlife.
Trust for Nature is engaged in the native vegetation offset market as its conservation covenant is one of the mechanisms permitted for securing the permanent protection of an offset site in Victoria. The Trust primarily provides services for on-title agreements through its covenant program and ongoing monitoring through its stewardship program. Identification of high-value habitat for protection is also available through its regional network. Commercial agreements are typically negotiated separately through a broker or directly between the parties. Planning and regulatory requirements are the responsibility of federal, state or local government.
The offset program operates in both state and federal jurisdictions. Initially, an agreement is completed between all parties to develop an offset arrangement, after which an offset covenant that meets regulatory requirements is developed and registered on the land. Covenants facilitated through native offset agreements are separate and distinct from voluntary covenants or those facilitated through incentive programs.
The number of registered offset covenants decreased this financial year following reduced demand for services in 2016–17. Demand for services in the native vegetation offset market increased in 2017–18, resulting in six new offset agreements completed.
Trust for Nature provides a stewardship and monitoring service for all covenants registered as a part of an offset agreement. This service provides guidance to landowners in meeting their offset obligations and ensures compliance monitoring.
The Trust continues to assess its role in the emerging carbon offset market and seeks to develop partnerships that will add to its expertise and resources to support conservation through these markets.
Table 4: Offset agreements completed
2017–18 2016–17
Offset agreements completed1 6 1
Area of habitat (ha ) 429.91 39.70
Table 5: Offset covenants registered on-title
2017–18 2016–17
Offset covenants registered2 4 6
Area of habitat (ha ) 104.01 293
1 Refers to agreements reached preceding covenant registration.
2 Refers to new covenants and amendments to existing covenants undertaken to meet a native vegetation offset requirement.
Trust for Nature Annual Report 2017-18 7

Revolving fundTrust for Nature’s Revolving Fund is a market-based conservation instrument. Its objective is to use the real estate market to achieve conservation outcomes, through the Trust’s statutory power to buy and sell land. The Revolving Fund matches the supply provided by the owners of private properties of high nature conservation value with demand from people in the community who wish to purchase and protect these values. The Revolving Fund protects conservation values through an obligation for all purchasers to covenant the property. As the Revolving Fund operates in the property market, factors that affect the market will also have an impact on the Fund. The Trust aims to maintain the value of the Revolving Fund over time.
Trust for Nature’s strategic plan has a goal to significantly increase the capital value of the Revolving Fund to support the conservation of more high priority private land. In 2017–18, the Revolving Fund focused on the preparation of a business plan for capital raising. The purchase and sales program saw four properties sold with a Conservation Covenant and one property purchased for protection. Since its inception, the Fund has purchased 691 properties, sold 611, and so protected 6,888 ha of conservation land.
Table 6: Revolving Fund statistics
2017–18 2016–17 2015–16
Properties sold4 properties, total 500 ha,
value $1,204,5340 0
Properties bought1 property, total 36 ha,
value $175,0001 property, total 17 ha,
value$126,0003 properties, total 166 ha,
value $480,675
Investment income $42,043 $66,713 $83,803
Donations/ transfers in $0 $45,000 $234,662
Properties retained8 properties, total 536 ha,
value $1,225,60711 properties1 , total 1,000
ha, value $1,700,9715 properties, total 982 ha,
value $1,577,504
Cash/amounts owing $2,596,574 $2,097,631 $2,458,685
Total value of Revolving Fund $3,822,181 $3,798,602 $4,036,189
Note: 1 A property held by Trust for Nature has been prepared for sale as six separate parcels. This increases the number of properties retained and sold, but does not affect the area
of land held.
KEY SERVICES (continued)
www.trustfornature.org.au8

OPERATIONAL OBJECTIVES AND OUTCOMESOperational and budgetary objectives for key servicesThe achievements of the Trust’s activities and services against the objects of the Victorian Conservation Trust Act 1972 can be found in summary throughout this report. In line with statutory disclosure requirements, the Trust also reports on the targets and outcomes of its operational objectives.
Table 7: Operational objective and outcomes
Services Target (qualitative & quantitative) Outcomes 2017–18
Conservation covenants
• To negotiate 1,200 ha for conservation covenants
• To register covenants over 3,100 ha
• 1,932 ha under negotiation for conservation covenant
• 1,449 ha protected by registered conservation covenants
Land stewardship
• To prepare and review 275 management plans for covenanted properties
• To visit 100 covenanted properties• To host 30 engagement events (field days,
workshops)
• 131 management plans prepared for covenanted properties
• 179 visits to covenanted properties• Over 62 engagement events hosted or co-
hosted
Environmental markets
• To increase the number and efficiency of agreements developed through the native vegetation offset market
• 6 offset agreements completed• 4 offset covenants registered
Revolving Fund
• To maintain the value of Revolving Fund contributions over time
• The value of the Revolving Fund increased by $23,579 in 2017–18
• Invested income on funds held decreased from $66,713 in 2016-17 to $42.043
• 4 properties sold with a total area of 500 ha at a value of $1,204,534
• 1 property purchased with a total area of 36 ha and a value of $175,075
• Retained $2,596,574 in cash for use by Revolving Fund
• Holding 8 properties comprising 536 ha with a value of $1,225,607
• To grow the value of private investment in nature conservation through contributions to the Revolving Fund
• NIL
Development
• To grow the value of private investment in nature conservation through development activities and prudent funds management
• Development income from donations (excluding bequests) increased from $635,836 in 2016–17 to $1,308,950
• Grant income increased from $445,334 in 2016-17 to $814,667
• Bequest income decreased from $212,634 in 2016–17 to $4,000
• Dividend income increased from $159,473 in 2016-17 to $272,612
• Interest income decreased from $332,878 in 2016-17 to $315,146
• To carry out two fundraising appeals with a total fundraising target of $170,000
• Christmas appeal in December 2017 raised $64,467
• End of Financial Year appeal in June 2018 raised $301,336
Trust for Nature Annual Report 2017-18 9

Table 8: Conservation covenants registered
Catchment Registered covenants in 2017–18
Registered covenants in 2016–17
Registered covenants total
Corangamite 3 0 99
East Gippsland 1 6 132
Glenelg Hopkins 2 7 98
Goulburn Broken 2 2 180
Mallee 4 2 44
North Central 3 6 243
North East 3 3 71
Port Phillip and Westernport 9 1 249
West Gippsland 2 2 137
Wimmera 2 5 162
Total 31 34 1,416
Table 9: Area protected by registered conservation covenants (excludes reserves)
Catchment Area protected in 2017–18 (ha)
Area protected in 2015-16 (ha)
Total area protected (ha)
Corangamite 43.01 0 2,314
East Gippsland 17.87 152 6,333
Glenelg Hopkins 21.87 544 4,122
Goulburn Broken 151.06 40 7,214
Mallee 282.29 17 3,881
North Central 196.53 335 11,584
North East 84.37 80 3,566
Port Phillip and Westernport 72.30 40 3,843
West Gippsland 25.57 286 6,152
Wimmera 553.88 308 15,519
Total 1,449 1,802 65,565
Note: The total area shown under covenant can change over time due to improved mapping techniques; and increases to areas already under covenant.
OPERATIONAL OBJECTIVES AND OUTCOMES (continued)
www.trustfornature.org.au10

CONSERVATION ACHIEVEMENTSProtecting ecologically significant areasIn 2017–18, Trust for Nature registered 31 new conservation covenants (excluding six offset covenants) and covenant amendments that increased the National Reserve System by 1,449 ha.
Covenants were registered in 11 of Victoria’s 28 bioregions including six of the 12 bioregions that are underrepresented (based on a 17% land area protection target). In total, 58% of all registered covenants in 2017–18 were located in the underrepresented bioregions, and these comprised 34% of the area protected.
Altogether, 90% of the registered covenants included native vegetation types assessed as being underrepresented in the National Reserve System. This collectively represented 37% of the extent protected through these new covenants in 2017–18. Further, of the 57 different ecological vegetation classes (EVCs) protected under covenant during 2017–18, 79% were classified as rare or threatened in Victoria and 32% as endangered.
Notable ecosystems protected by the Trust in 2017–18 included examples of five communities listed as nationally threatened under the Environment Protection and Biodiversity Conservation Act 1999, which were collectively represented on 39% of all covenants registered this financial year.
The Trust increased the level of protection in six of our 12 focal landscapes, with the total land protected in these landscapes comprising 49% of the total land area protected under covenant in this financial year. Collectively, 74% of the habitat area protected under covenant this year helped improve the representativeness of the National Reserve System (located in underrepresented bioregions) and/or increasing its adequacy (located in focal landscapes).
The Trust also contributed in 2017–18 to national and international programs and forums to protect biodiversity including:
• input into the International Union for Conservation of Nature’s Best Practice Guidelines on Privately Protected Areas
• representation on the steering committee of the International Land Conservation Network
• representation on the Australian Business Biodiversity Initiative
• membership of the Australian Land Conservation Alliance
• participation in the Convention on Biological Diversity Stakeholder Roundtable discussion
• a submission to the Australian Government’s Australia’s strategy for nature 2018–2030: Australia’s Biodiversity Conservation Strategy and Action Inventory
• representation on the Australian Government Department of Environment and Energy’s Partnerships CORE Co-Design Group steering committee
• presentations at the International Land Conservation Network Congress in Santiago
• presentations at the Australian Land Conservation Alliance Private Land Conservation Conference in Hobart
• Consulted on biodiversity offsets to professionals implementing the Colombian biodiversity offset program
• delivery of a conservation finance research project (funded by the Australian Government) on behalf of Australian Land Conservation Alliance
• a submission to the federal review of the Carbon Farming Initiative and Emissions Reduction Fund
• a submission to the federal review of the Environmental Protection and Biodiversity Conservation Act 1999.
With the support of the Victorian Government’s Sustainability Fund, the Trust continued reviewing our conservation planning approach in the context of climate change adaptation, accessing new scientific information about connectivity, rising sea level, carbon sequestration and catchment management authority (CMA) priority areas for protection and restoration.
Trust for Nature Annual Report 2017-18 11

Table 10: Bioregions, EVCs protected via conservation covenants (excluding offset covenants) and area in each catchment
Catchment Bioregion Victorian bioregionNumber of covenants Area (ha)
Number of EVCs
CorangamiteSouth East Coastal Plain Otway Plain 2 33.01 2
Victorian Midlands Central Victorian Uplands 1 11.39 3
East Gippsland South East Coastal Plain Gippsland Plain 1 17.87 1
Glenelg Hopkins Victorian Midlands Central Victorian Uplands 2 21.87 3
Goulburn Broken Victorian MidlandsCentral Victorian Uplands 1 46.43 3
Goldfields 1 19.23 2
Mallee Murray Darling Depression Murray Mallee 4 298.65 7
North CentralRiverina Victorian Riverina 1 97.14 3
Victorian Midlands Goldfields 2 99.39 5
North East
NSW South Western Slopes1 Northern Inland Slopes 2 43.26 5
South Eastern Highlands Highlands - Northern Fall 1 41.11 1
Port Phillip and Westernport
South East Coastal Plain Gippsland Plain 2 2.378 3
South Eastern Highlands Highlands - Southern Fall 5 41.545 8
Victorian Midlands Central Victorian Uplands 2 28.38 2
West Gippsland South East Coastal Plain Gippsland Plain 2 25.57 2
Wimmera Murray Darling DepressionLowan Mallee 1 495.7 4
Wimmera 1 56.38 3
Total 31 1,379.30 57
Note: 1 The NSW South Western Slopes is an IBRA region that includes parts of North East Victoria.of land held.
CONSERVATION ACHIEVEMENTS (continued)
www.trustfornature.org.au12

Working with others to ensure collaborative permanent protection at a landscape scaleIn 2017–18, Trust for Nature worked collaboratively with more than 100 organisations including the Australian Government, the Victorian Government, local governments, conservation organisations, Landcare, other community groups and businesses. Through these projects, the Trust delivered the permanent protection and stewardship outcomes explained on page 6. With partners, Trust staff participated in forums around Victoria including regional partnership and planning meetings and conservation planning workshops. It also joined working groups developing the implementation plan for the Victorian Government’s Protecting Victoria’s Environment – Biodiversity 2037.
The Trust and our partners also collaborated to develop funding proposals around Victoria, as part of the Victorian Government’s Biodiversity Response Planning program, and collaborated around the development of phase two of the Australian Government’s National Landcare Program.
Most of these project proposals were based on priority strategies in the landscape-scale conservation action plans (CAPs) which have been developed in the past few years. The Trust continued to develop CAPs for other priority landscapes identified in our Statewide conservation plan, and it also provided technical expertise and support to Parks Victoria and CMAs preparing CAPs for these landscapes. These partnerships are helping to align all partners priorities for conservation on protected areas of public and private land.
In 2017–18, the Trust also strengthened relationships with the catchments and water programs of the Department of Environment, Land, Water and Planning (DELWP) and of CMAs, as part of the implementation of the Victorian Waterway Management Strategy and Water for Victoria. Activities have included the signing of partnership agreements with the CMAs and involvement with the preparation of funding proposals; representation on a statewide working group delivering spatial analysis for Vic Catchments to investigate opportunities of alignment and collaboration. We also attended and presented at the 2018 Catchments Summit – Strengthening Catchment Partnerships. These involvements will help to better protect key areas of private land, particularly aquatic and riparian habitats, over the next three years.
During the year, the Trust also helped implement initiatives about water for the environment. It re-signed a long-term agreement with Mallee Catchment Management Authority to allow the release of water to the environment to Neds Corner Station, and it provided policy advice to CMAs and the Victorian Environmental Water Holder about the applicability of covenants to secure overbank flows. These are vital to ensure water-dependent ecosystems are managed to maintain their health and resilience.
As a member of the Australian Land Conservation Alliance, the Trust again co-presented the National Private Land Conservation Conference in Hobart, which was hosted by the Tasmanian Land Conservancy.
Trust for Nature Annual Report 2017-18 13
Managing protected areasIn 2017–18, Trust for Nature management activities on covenanted properties and on our reserves, as part of funded projects, included:
• weed management on more than 3,700 ha• feral animal management on more than 68,000 ha• installation of 19 km of fencing• improving the grazing regime on more than 850 ha• making other habitat improvements on more than
6,100 ha• conducting more than 135 ecological surveys
and assessments, mostly with threatened species projects.
Major achievements on the Trust’s flagship property, Neds Corner, were restoring a 500-ha sandhill from a degraded site to a flourishing, diverse habitat and helping protect significant cultural heritage sites. With funding from the Yulgilbar Foundation, we installed and upgraded predator-proof fencing around the 500-ha site.
Voluntary committees of management, friends’ groups and community members worked on many of the Trust’s reserves in 2017–18. Their invaluable assistance was supported by funding from the Biophilia Foundation and by a Victorian Government community development grant. This grant enabled many volunteers to be trained to use a chainsaw, protect cultural heritage, work safely and take action to mitigate climate change impacts.
Improving threatened species conservationIn 2017–18, the Trust collaborated with conservation and land management agencies and organisations to help secure, maintain or improve habitat for a variety of threatened species. These included the Swift Parrot, Barking Owl, Plains-wanderer, Grey-crowned Babbler, Striped Legless Lizard, Squirrel Glider, Brush-tailed Phascogale, Spiny Rice-flower, Spur-wing Wattle, Northern Sandalwood and Warby Range Swamp-gum.
This year we were proud to secure two privately owned properties which have been transferred to the Victorian Government and incorporated into Yellingbo Nature Conservation Reserve. The two properties contain or can be restored to Swampy Riparian Woodland. They were delivered through partnerships and funding from Judith Eardley Saves Wildlife Association and
the Myer Foundation and Victorian Government and National Landcare Program funds in partnership with the Port Phillip and Westernport CMA and the Department of Environment, Land, Water and Planning. Long term protection of this habitat is critical for the survival of threatened species including the Helmeted Honeyeater and lowland Leadbeater’s Possum. Trust for Nature will continue to build on this important work into the future. The Trust has also contributed to the conservation of this critically endangered bird through our participation as a member of the Yellingbo Conservation Area Coordinating Committee and Yarra 4 Life Coordination Committee.
Since the Trust’s purchase of Neds Corner Station in 2002, the native vegetation has recovered remarkably, there are fewer plant and animal pests, and we have discovered new populations of many species of plants and animals not recorded previously in Victoria or in the surrounding landscape. For example, in 2017–18 we discovered the Desert Groundsel (Senecio lanibracteus), which is an endangered daisy species only recorded twice previously in Victoria, flowering at Neds.
During the year, the Trust facilitated a project that helped land managers learn how to identify and manage habitat for several threatened invertebrates that are found in west Gippsland or nearby: the Giant Gippsland Earthworm, Warragul Burrowing Crayfish, Strzelecki Burrowing Crayfish and Narracan Burrowing Crayfish. It was encouraging to find evidence of the Strzelecki Burrowing Crayfish, the Narracan Burrowing Crayfish and the Giant Gippsland Earthworm at sites where they had not been previously identified. The project was supported by the Victorian Government’s Biodiversity On-ground Action program and run in partnership with DELWP. Participants included private landholders, Hancock Victorian Plantations, Gippsland Water, the West Gippsland Catchment Management Authority and the Latrobe Valley Landcare Network.
North Central Catchment Management Authority’s five-year Remnant Grassy Ecosystem project has revegetated over 115 ha of Buloke Woodland using a combination of direct seeding and tube stock planting. Buloke trees were once widespread in north-central Victoria, but Buloke Woodland community is now a nationally threatened ecological community due to land clearing. The project was conducted by the Trust in partnership with covenantors, landholders and the North Central Catchment Management Authority, with funding from the Australian Government’s National Landcare Program.
CONSERVATION ACHIEVEMENTS (continued)
www.trustfornature.org.au14
During the year, the Trust and Bush Heritage published a plan to conserve an area surrounding Wedderburn, Dunolly and the Kara Kara National Park in central Victoria. The area includes one of the most reliable habitats on mainland Australia for the critically endangered Swift Parrot. The plan was three years in the making, and it maps out a way forward to look after the landscape in conjunction with the Dja Dja Wurrung Traditional Owners, local landholders and conservationists.
EducationBuilding on last year’s initiative to provide VCE Outdoor Education and Environmental Science curriculum materials to all Victorian secondary schools, the Trust participated in a forum and workshop on nature conservation programs at the annual conference of the Victorian branch of the Australian Council For Health, Physical Education and Recreation. More than 50 VCE teachers from around the state attended the conference. Trust staff also hosted school and university education days on covenanted properties and reserves around the state, to increase knowledge about the Trust’s role and the importance of private land conservation in Victoria.
With support from the Victorian Government’s Sustainability Fund, the Trust developed information about how landholders can help mitigate the impacts of climate change on biodiversity at their property. The information was presented at six workshops and events for covenantors, landholders, staff, committees of management and friends’ groups during the year. Further events are planned for 2018–19.
During the year, the Trust co-hosted the 20th Wimmera Biodiversity Seminar with our partners in the region. Held in September, the seminar examined past, present and future biodiversity and conservation ideas and projects.
The Trust and our partners ran eight field days across the state as part of Spring into Nature, including a walk-and-talk on a covenanted property at Wooragee where participants learned about conservation covenants and about how to manage Woody Weed encroachment and identify plants. The Wanderslore Sanctuary at Launching Place opened its gates to the public to learn about plants and animals on the property, and visitors to a Huon Creek property learned about nest box design and making tree hollows.
Supporting scientific study In 2017–18, Trust for Nature staff provided data and advice to ecology and archaeology research projects. This included ongoing collaborations with The University of Melbourne and the Threatened Species Recovery Hub, where the Trust continued to support a masters research project about restoring Buloke Woodland through our Scholes Student Scholarship program. The Trust also continued research associations with La Trobe University, Deakin University, RMIT University and the University of Queensland.
During the year, Trust staff contributed to peer-reviewed scientific research by authoring or co-authoring five papers and book chapters and by providing expert input to and reviewing other articles. The Trust also supported scientific study by providing access to covenants and reserves, providing relevant datasets, contributing to science workshops, presenting at conferences and offering industry work placements and mentoring for students. Two Trust staff members were invited to participate in a national scientist-practitioner workshop on ecological monitoring in Canberra during the year, using Neds Corner Station as their case study. Trust staff also contributed content to a report about private land conservation in Australia, delivered by the Australian Land Conservation Alliance for the Australian Government Department of the Environment and Energy.
Special-purpose trustsTrust for Nature acts as a trustee for special-purpose trusts established through bequests or regulatory requirements for specified conservation activities. These trusts include:
• the Amateur Gardeners Foundation, established to accumulate and share knowledge about dwarfed and Alpine plants for the benefit of amateur gardeners
• the Pimelea Conservation Trust Fund, established to advance the protection and conservation of Spiny Rice-flower
• the Growling Grass Frog Trust, established for the protection and benefit of the Growling Grass Frog in the Merri Creek catchment.
The Trust also manages the Golden Sun Moth Conservation Fund, established for the protection and benefit of the Golden Sun Moth.
Trust for Nature Annual Report 2017-18 15

COMMUNITY ENGAGEMENTEventsAs part of our conservation mission, Trust for Nature engages with landowners, covenantors, supporters, volunteers, other conservation organisations, governments and the broader community. In 2017–18, Trust staff hosted or co-hosted 62 engagement events across the state. Among them were Spring into Nature events, held between September and November 2017. Spring into Nature enables people to experience nature by visiting covenanted properties and the Trust’s reserves.
As well, we held events to celebrate and acknowledge supporters, covenantors and volunteers including:
• a Celebrating Covenantors event at Bellbrae, to recognise a group of landholders for their collective work in protecting over 20 ha of shared remnant bushland, which is home to grass trees and echidnas, and is habitat for the Powerful Owl, a threatened species in Victoria
• a two-day workshop for the Trust’s committees of management and friends’ groups, members of which provide essential help to manage the Trust’s reserves
• two morning teas for the Trust’s major donors, to hear about the science and conservation outcomes of the Trust’s work that their generous gifts supported
• the 7th Celebrating Women in Conservation Breakfast, jointly hosted with Bush Heritage Australia and supported by National Australia Bank, at which the 470 attendees heard from keynote speaker Professor Lesley Hughes, whose research addresses the impacts of climate change on species and ecosystems.
Traditional Owner engagement and partnershipsTrust for Nature’s Statement of Intent and Commitment to Victorian Traditional Owner Groups recognises that all Victorians share in the benefits of Traditional Owners’ custodianship and caring for Country for millennia. The statement formalises Trust for Nature’s ongoing commitment to meaningful engagement and partnership with Traditional Owner groups, guided by the four principles of:
• recognition and respect• cultural learning and development• healthy natural environments and ecosystems• capacity building and economic developmentIn 2017–18, the Trust engaged with Australia’s first peoples by developing and delivering new partnership projects, spending time together on Country, joint land management, joint funding applications and sharing knowledge at meetings, community events, workshops and presentations. Some of these activities are outlined below.
During the year, the Trust employed an Aboriginal trainee in East Gippsland through the Indigenous Employment Program administered jointly by the National Landcare Program and the AFL SportsReady Program. The traineeship included higher education study in conservation and land management and on-ground experience learning techniques for revegetation and pest plant and animal control.
Trust for Nature continued to work with the Lake Tyers Aboriginal Trust during year through the National Landcare Program’s Protecting Ramsar Sites in the Gippsland Lakes Project, completing 35 hectares of follow-up weed control improving the ecological condition of Lake Tyers frontage.
The Gunaikurnai Land and Waters Aboriginal Corporation’s On Country works crew were employed this year to assist with on-ground delivery of project activities in East Gippsland including revegetation activities across private land. We also worked with the joint managers and Aboriginal rangers to undertake weed control in Lake Tyers Coastal Park.
www.trustfornature.org.au16
During the year, we also welcomed our first Aboriginal covenantors for the Gippsland area. The Mullett family own Wattlewood, one of the last remaining patches of Plains Grassy Woodland between Bairnsdale and the Gippsland Lakes. The intact vegetation means the property is rich in wildlife and it’s covered mostly in Red Gums.
In West Gippsland, Trust for Nature worked with the Gunaikurnai Land and Waters Aboriginal Corporation (GLaWAC) and local covenantors to facilitate habitat enhancement works by the GLaWAC bushland work crew on a property being covenanted in South Gippsland.
Trust for Nature also participated in a Close the Gap Day event facilitated by the West Gippsland Catchment Management Authority, which provided an important opportunity to learn from and exchange knowledge with representatives of the Bunurong Land Council. The event at Powlett River stimulated ideas that will lead to further discussion about possible project activities and partnerships in this area of significant natural and cultural heritage.
In the Corangamite region, Trust for Nature worked with the Wathaurong Aboriginal Co-operative, exploring avenues to secure sustainable funding for the management of their property Wurdi Youang near Little River. At this same property, we worked to establish a new population of the nationally endangered Spiny Rice-flower supported by a grant from the Australian Government’s Threatened Species Recovery Fund. We are also working in partnership with the Wathaurung Aboriginal co-operative, supported by a Victorian Government Biodiversity On-ground action community grant from the Victorian Government, to undertake priority weed control on covenanted properties across the Bellarine Peninsula and Geelong district.
Trust for Nature partnered with the Wurundjeri Tribe Land and Compensation Cultural Heritage Council (Wurundjeri) and their Naarap team on our Dandenong Ranges Project called ‘Protecting Properties, Connecting people’ supported by the Australian Government and Port Phillip Westernport Catchment Management Authority. To celebrate delivering this project together, we shared time on Country at a bushfoods planting day at Collingwood Children’s Farm. The council also assisted Trust for Nature this year with management of Trust for Nature reserves, technical advice and providing educational interpretation including participating in our Spring into Nature program.
We have established a memorandum of understanding with Bunurong Land Council Aboriginal Corporation to work in partnership on land management projects as they arise in the future.
In 2017–18, we partnered with the Wurundjeri and Bunurong Traditional Owners’ organisations to help Aboriginal people interested in conservation and land management with higher education and work opportunities for Traditional Owners that have an interest in conservation and land management, made possible with funding from the Victorian Government’s Biodiversity On-ground Action community grants, and supported by the Port Phillip Westernport Catchment Management Authority. Students began studying a Certificate III in Conservation and Land Management and are gaining experience undertaking conservation projects on land protected by Trust for Nature covenants.
At Neds Corner Station, Trust for Nature held an open day focused on Aboriginal heritage during our Spring into Nature program. More than 100 people learned from the Traditional Ngintait Owners about Ned’s extensive Aboriginal heritage — people have lived along the River Murray for over 20,000 years — and there was a guided cultural tour. The Trust continued to engage with Traditional Owners through La Trobe University’s archaeological work on the property and with Aboriginal facilitators and rangers from Parks Victoria and the Mallee Catchment Management Authority.
In the North Central region, Trust engaged Barapa Land and Water to do conservation works as part of projects funded by the Australian and Victorian governments. Dja Dja Wurrung elders spoke about the area’s rich cultural heritage at a Spring into Nature event at one of our newest covenants at Pine Grove. The Trust has asked for a Traditional Owner name for Long Swamp and continues to engage the Djandak works crew for conservation activities at the Murray Family Conservation Reserve at Long Swamp.
As part of an ongoing burning trial project funded by the National Landcare Program, Trust for Nature collaborated with the North East Catchment Management Authority to hold another traditional burning workshop on a covenanted property at Kiewa in June. Traditional Owners led the session and shared their knowledge with landholders keen to find out more about Aboriginal burning techniques.
Trust for Nature Annual Report 2017-18 17

In November, Trust for Nature celebrated with Taungurung Clans Aboriginal Corporation at the launch of their Country Plan which includes Aboriginal employment initiatives with NRM partners in north east Victoria and working with Aboriginal Victoria to protect sites of cultural significance on covenanted properties.
In south-west Victoria, the Barengi Gadjin Land Council are partners with the Trust and Greening Australia in Bank Australia’s Conservation Reserve project. During the year, council staff helped manage pest animals at the reserve, and Traditional Owners were involved in the Spring into Nature event at the reserve in October and at the Bank Australia staff event in May. In October, activities with school children and others shared cultural connections to Country through dance and storytelling. In May, Bank Australia staff were educated about scar trees, building their understanding of the reserve’s rich cultural values. Also, the council started the most comprehensive cultural heritage survey of the reserve to date, identifying sites and features of cultural importance. The ongoing work will help inform management of the reserve and protection of its cultural values.
Public policyDuring the year, Trust for Nature made submissions about or provided input relating to key public policy areas, including:
• the Australian Government’s Australia’s strategy for nature 2018–2030 Australia’s Biodiversity Conservation Strategy and Action Inventory
• the review of the Australian Government’s Carbon Farming Initiative and the Emissions Reduction Fund
• the review of Victoria’s Flora and Fauna Guarantee Act
• the State Environment Protection Policy (Waters) Review
• the Port Philip Bay (Western Shoreline) and Bellarine Peninsula Draft Ramsar Site Management Plan
• the Macedon Ranges Localised Planning Statement Consultation Draft
• the Victorian Environmental Assessment Council’s Central West investigation
• the review of the Commonwealth Environment Water Holder’s operations and business processes
• the International Union for Conservation of Nature’s Best Practice Guidelines on Privately Protected Areas Privately Protected Areas
• the Australian Land Conservation Alliance’s submission to the Australian Government about Australia’s performance under the Convention on Biological Diversity.
The Trust participated in the Australian Government’s Department of the Environment and Energy Partnerships CORE Co-Design Group, the Australian Business Biodiversity Initiative, the Australian Land Conservation Alliance and the International Land Conservation Network the Convention on Biological Diversity Stakeholder Roundtable discussions; and delivered presentations at the International Land Conservation Network (ILCN) Congress in Santiago,
Meanwhile, the Trust commenced delivery of a conservation finance research project (funded by the Australian Government) on behalf of the Australian Land Conservation Alliance; informed public policy makers of the need for tax and municipal rates reform, and consulted on biodiversity offsets to professionals implementing the Colombian biodiversity offset program.
Support and developmentFollowing successful implementation last year of a brand refresh to increase Trust for Nature’s profile, community engagement and associated fundraising activities, 2017—18 saw the Trust focus on developing its brand awareness including ongoing improvements and updates to the Trust’s website, print and media collateral to reflect current activities and objectives. Widespread media coverage in regional areas was achieved.
COMMUNITY ENGAGEMENT (continued)
www.trustfornature.org.au18

PARTNERS AND VOLUNTEERS
Trust for Nature carries out its work to protect native plants and wildlife on private land through partnership and collaboration. The Trust gratefully acknowledges the many individuals, community groups, covenantors, associations, foundations and companies who continue to lend their support, both financial and otherwise, to Trust for Nature. It is only through collaboration and cooperation that we can fully achieve our goals.Trust for Nature sincerely thanks the following individuals and organisations that have made contributions to Trust for Nature in 2017–18.
Government departments and statutory entities• Aboriginal Victoria• Australian Government Department of
the Environment and Energy• Baw Baw Shire Council• Commissioner for Environmental
Sustainability• Corangamite Catchment Management
Authority• Country Fire Authority• Department of Economic
Development, Jobs, Transport and Resources
• Department of Environment, Land, Water and Planning
• East Gippsland Catchment Management Authority
• Glenelg Hopkins Catchment Management Authority
• Goulburn Broken Catchment Management Authority
• Mallee Catchment Management Authority
• Melbourne Water• Nillumbik Shire• Native Titles Services Victoria• North Central Catchment
Management Authority• North East Catchment Management
Authority• Parks Victoria• Port Phillip and Westernport
Catchment Management Authority• Royal Botanic Gardens Victoria• West Gippsland Catchment
Management Authority• Wimmera Catchment Management
Authority• Victorian Catchment Management
Council• Victorian Environmental Assessment
Council• Zoos Victoria • Plus other local governments in
Victoria
NGO and not-for-profit partners• Alternative Technology Association• Australian Environmental Grantmakers
Network• Australian Wildlife Conservancy• Barapa Barapa Traditional Owners• Barengi Gadjin Land Council
Aboriginal Corporation• Biodiversity Conservation Trust (NSW)• Biophilia Foundation• Birdlife Australia and its regional
branches• Broken Boosey Conservation
Management Network• Bunurong Land Council Aboriginal
Corporation• Bush Heritage Australia• Cardinia Environment Coalition• Central Victorian Biolinks Alliance
• Connecting Country• Conservation Ecology Centre• Conservation Volunteers Australia• Dja Dja Wurrung Clans Aboriginal
Corporation• Earthwatch• East Gippsland Landcare Network• East Gippsland Rainforest
Conservation Management Network• Environmental Justice Australia
(Victoria)• Eucalypt Australia• Fairley, Bael Bael and Sandhill Lake
Landcare• Federation of Victorian Traditional
Owners Corporation• Field Naturalists Club of Victoria• First People of the Millewa Mallee• Friends of Merri Creek• Friends of the Helmeted Honeyeater• Gippsland Plains Conservation
Management Network• Greenfleet• Greening Australia (Victoria)• Gunaikurnai Land and Waters
Aboriginal Corporation• Gunditj Mirring Traditional Owners
Aboriginal Corporation• Habitat 141 Alliance• Heathmont Bushcare• Helen Macpherson Smith Trust• Hindmarsh Landcare Network• John T Reid Charitable Trusts• Johns Hill Landcare Group
Trust for Nature Annual Report 2017-18 19

• Kara Kara Conservation Management Network
• Lake Tyers Aboriginal Trust• Landcare Australia Ltd• Latrobe Valley Field Naturalist Club• Limb Family Foundation• Longwood Plains Conservation
Management Network• Mount Rothwell Biodiversity
Interpretation Centre• National Trust of Australia (WA)• Nature Conservation Trust of NSW• Nature Foundation SA• Nature Glenelg Trust• Norman Wettenhall Foundation• Northern Plains Conservation
Management Network• Odonata• Plains-wanderer National Recovery
Team• Project Platypus Association Inc
(Upper Wimmera Landcare)• Queensland Trust for Nature• RE Ross Trust• Southern Ranges Environment
Alliance• Southern-eastern Red Tailed Black-
Cockatoo Recovery Team• St Arnaud Field Naturalist Club• Strathbogie Ranges Conservation
Management Network• Tasmanian Land Conservancy• Taungurung Clans Aboriginal
Corporation• The Nature Conservancy• Victorian National Parks Association• Victorian Volcanic Plains Conservation
Management Network• Village Glen Bird Group• Volunteering Victoria• Wathaurong Aboriginal Co-operative
Ltd• Wedderburn Conservation
Management Network• Western Port Biosphere• Whroo Goldfields Conservation
Management Network• Wurundjeri Tribe Land and
Compensation and Cultural Heritage Council Incorporated
• Yorta Yorta Nation Aboriginal Corporation
• Yulgilbar Foundation
Educational institutions• 15 Mile Creek Outdoor School• Australian Council for Health, Physical
Education and Recreation• Bendigo Regional Institute of TAFE• Charles Sturt University• Deakin University• Federation University TAFE• La Trobe University• Monash University• RMIT University• The University of Melbourne• University of Queensland
Corporate partners• Bank Australia• Bush Blocks• Candida• Chris Tzaros photography (pro bono)• Doug Humann & Associates• Johanna Villani Design• Kinrara• National Australia Bank• Norton Rose Fulbright• Pearce Webster Dugdales• Property Valuers Australia• Rob Gration, Ecoaerial• Treed Environs• Vegetation Link
Committees of management, friends’ groups, organisations and individuals that provide special assistance on Trust for Nature properties
Friends of Bungalook Conservation Reserve• Karen Davies• Lisa Fleming• Michael Goddard• John Kelly• Dr Graeme Lorimer• Andrew Lorimer• Robert Murray• Georgette Page• Sharon Potter• Karin Smith• Fiona Sutton
Friends of Burge Reserve• Cathy Olive• Janet Hagen• Susan and Jonathan Hayman• Gary Hendy• Delphine and Bruce Marsh
Dexter’s Bush• Liz and Mick Dexter
Dog Rocks Flora and Fauna Sanctuary• Bill Honey
Friends of Harbury Reserve• Elizabeth and Ian Fraser
Friends of Pallister’s Reserve• Richard Alexander• Peter Bolte• Joy and Peter Carrucan• Nick Glover• Jan and Trevor Kennedy• Anthony Leddin• Julia Schlapp• James Smith• Margaret and Rob Whitehead
Mt Elephant Community Management• Lesley Brown• Janine Davis• Rod Eldridge• Jane French• Geoffrey Henderson• Val Lang AM and Chris Lang• Jan Porter• Judith Sarto• Lynnette and Gert Stammberger
Mt Elgin Swamp Committee of Management• Robyn and Gary Clark• Clive Crouch OAM• Wayne Donnell• Alan Frankham• Jennifer and Kent Goldsworthy• Cathy and Geoff Moll• Whimpey Reichelt OAM
PARTNERS AND VOLUNTEERS (continued)
www.trustfornature.org.au20

Ocean Grove Park Association• Phil Dix• Mark Edmonds• Betty Glasgow• Leigh Holloway• Shelley McKiernan• Mark McLean• Colleen McEwan• John Mamonski• Don Pietrapertosa• Terry Riordan• Murray Waugh
Friends of Ralph Illidge Sanctuary• Peter Battistello• Shirley Duffield• Frank Duggan• Annie Fraser• Pam and Ian McConnell• Janice Trenair• Kerrie Smith
Snape Reserve Committee of Management• Darryl Argall AO and Mary Argall• Ian Barry• Greg Bourke• Gillian and Clive Eastwood• Ian Flux• Jan John• Terry Lynch• John Rocke• Sue Smith and Lindsay Smith OAM • Diana Snape and Brian Snape AM • Jonathan Starks• Cliff Unger
Uambi Committee of Management• Gwyn Davies• David Harper AM• Will Harper• Roger Lord• Graeme Lorimer• Angie Loukas• Sue Mosley• Therese Starling• Pam Yarra
Friends of Uralla Nature Reserve• Louise Kennedy Young• Peter McDonald• Chris Mynard• Ken Savage• Tony Stewart
Wanderslore Sanctuary Committee of Management and the Friends of Wanderslore• Linda Clarke• Geoff Durham OAM• Gordon Coleman• John Grainger• Bronwyn Hatton• Paula Herlihy• Lincoln Kern• Patrick O’Shaughnessy• Janet Sowden• Griff Ward
Volunteers• Margaret and Richard Alcorn• Russell Barber• Andrea and Giovanni Barbera• Christine and Greg Barkla• Brett Barnes• Danny Barnes• Nathan Barnes• Val Barnes• Trace Beale• Wendy and Alan Bedggood• Jill, Lidia and Elena Best• Ruth and Allen Bickell• Bev Bingley• James Bond• Jason Bowden (Parks Victoria)• David Boyle• Michael Butcher• Kyle Cawood• Tyson Cawood• Garry Cheers• Richard Cosgrove• Lisa and Gary Deayton• Jennie and Greg de Freitas• Anthony Del Osto• Matt Driver• Aziz Elkhazzari• Max Ervin• Tom Fagan• Geoff Farrell• Stephen Firns• Rachael and Brad Fyfe• Jillian Garvey• Jill and Ron Gerts• Rob Gration• Maria and Mike Grazia Hall• Jess and Phil Hammett• Amy Heywood• Jim Heywood
• Phoebe Heywood• Bruce Hillas• Lestyn Hocking• Fatma Ipek• Damian Jackson• Nathan Johnson• Malcolm Just• Wendy and Ian Kelly• Trish and Garry Kelly• Brett Kelynack• Samantha Kirsopp• Angelo Lamontagna• Don Love• Mick Lumb• Glenda and Garry Mann• Di Marshall• Linda and John McGlashan• Graham McKechnie• Judy and Mal McKinty• Susie and Ed McNabb• Sharon and Ian Miles• Marita Miller• Ange and Josh Mills• Verna Monaghan• Jodie Morgan• Peter Morison• Peter Moulton• Carolyn Muir• Shannoa Munro• Emily Newell• Maddy, Annie, Willow and Tilly Noble• Murray Ogle• Murray Orr• Richard Palmer• Leigh Pike• Oliver Pitman• Anne and David Poulton• Sabatino Sapio and Angelo
Lamontagna • Libby Sakker• Janet and Mark Schapper• Jane Scott• Jenny and Mervyn Shaw• Melinda Scheele• Liz Tasmussen• Mirinda Thorpe• Robert Watson• Ana and Ian Westhead• Tamara Wetherall• Nell White• Trent and Glen Wilkins• Uncle Norm Wilson
Trust for Nature Annual Report 2017-18 21
THANK YOU TO OUR DONORS
Trust for Nature is grateful to all its donors. With their generosity, the Trust continues its work to protect nature on private land today, tomorrow and forever. We would especially like to thank the following supporters who have donated $1,000 or more in 2017–18. We also thank those who wished to remain anonymous. Together, we are making a difference.
Donors• Barbara Baird• Liz Balogh• Kirsty Bennett• Phyllis Bourke• Julia Bruce• Greg Burns• Ian Clarke• Vanessa Craigie• Leon Costermans• June Danks• Jennifer Davidson• Sue Davies• Tristan Douglas• Geoff Driver• Geoff Durham• Jane Edmanson• Pru and Max Ervin• Carrillo Gantner• Sylvia Geddes• Geoffrey Giles• Camilla Graves• Lesley Griffin• Peter Furneaux• Marg Henderson• Estelle Hewston• William Holsworth• Ian Hopkins• Angela and Richard Kirsner• Nancy Kimpton• Pamela and Bob Knight• Ellen Koshland• John Landy
• Peter Lemon• John Little• Mick Lumb• Victoria Marles• Kim Marriott• Ruth Marriott• Ruth McKenzie• David McLatchie• Ann Miller• David Minifie• Sarah Minifie• John Morgan• Susan Morgan• Amanda Noble• L Perkins• Pam Petschack• Douglas Pocock• The Late Jack Pollock• Keith Richards• Philip Robinson• Jennifer Rolland• Sally Romanes• Margaret and Ian Ross• Janet Schapper• Frank Schooneveldt• Rosemary Simpson• Brian Snape• Helen Symon• Michael Troy• James Vaux• Geoffrey Wescott• Paul Wiegard• Douglas Wilson• Elizabeth Xipell
Trusts and foundations and corporate donors, which supported specific projects• ABC Friends• Biophillia Foundation• Byron Writers• Friends of the Helmeted Honeyeater• Geoff and Helen Handbury
Foundation• Hazel L Henry Farmland Nature
Refuges• Judith Eardley Save the Wildlife
Association• Kel & Rosie Day Foundation• Koreen Conservation Ltd• Limb Family Foundation• Lord Mayor’s Charitable Foundation• Myer Family Trust• National Australia Bank• Paul Family Foundation• RE Ross Trust• Souter-Foale Family Trust• The Yulgibar Foundation
Bequests• Estate of Betty Moore
www.trustfornature.org.au22
FINANCIAL OVERVIEWFinance and business current year financial reviewFor 2017-18 the Trust had a net comprehensive result surplus of $376,683 compared to a deficit of $1,237,083 in 2016-17.
Overall revenue levels were higher than last year largely due to increased donations income received. Both of the Trust’s major appeals, Christmas and End of Financial Year, were strongly supported, and a number of larger gifts were also received. These funds are being used to support the Trust’s on-ground habitat management across the state including stewardship on covenanted properties. In addition, a $500,000 philanthropic grant was received towards a property acquisition, which is offset by an expense for the subsequent transfer of the property to the Crown at nil value.
Expenditure included the transfer of land to the Crown at nil value noted above. Elsewhere, employment expenditure increased due to an increase in our fundraising and communications team resourcing and a transfer of some of those costs from temporary contractors to salaried staff, which is also reflected in the decrease in other expenses. Other expenses include IT and communications, legal and governance, fundraising and marketing, and temporary contractors.
Other economic flows includes profits on the sale of four revolving fund properties settled during the year.
A minor upgrade to our financial system was completed during the year to enable our regionally-based staff to interact with the finance system using web-based apps.
Internal audit completed a review of the Trust’s land protection, covenanting and stewardship
programs and will commence a review of our revenue recognition approaches shortly. The Trust has also invested significant time through 2017-18 ensuring its governance practices continue to meet the requirements of the Government’s updated financial management standards and new Victorian Protective Data Security Standards.
Total assets were $68 million at year end. The increase of $8 million from last year relates to funds received and receivable on behalf of private landowners under 10-year offset arrangements. These funds are used by landowners to improve the habitat on their covenanted land and an offsetting liability is held in the accounts. Consequently net assets are similar to last year. Of these total assets, $21 million is represented by Trust owned properties which do not generate income. The remaining $47 million is held in financial assets, primarily against third party liabilities ($35 million), which includes funds held for the benefit of private landowners under 10-year native vegetation offset agreements, and reserves with specified purposes ($7 million) including the Trust’s revolving fund. Earnings on these funds are applied for the benefit of those funds and are not available for general use.
There are no significant matters which changed our financial position during the reporting period.
There were no significant changes or factors which affected our performance during the reporting period.
There were no events occurring after balance date which may significantly affect the Trust’s operations in subsequent reporting periods.
Trust for Nature Annual Report 2017-18 23

FINANCIAL OVERVIEW (continued)
Table 11: Five-year financial summary 2018 2017 2016 2015 2014
Operating grant 1,467,000 1,485,000 793,301 693,301 454,209
Government grants 2,309,691 1,909,451 2,255,263 2,385,555 2,476,545
Government and philanthropic grants used to acquire properties 500,000 219,213 135,000 0 15,000
Donations and appeals 1,308,950 635,836 766,945 1,110,900 601,639
Bequests 4,000 212,634 587,463 72,591 35,629
Interest and dividends, net of interest paid to third parties 587,758 492,351 586,651 673,372 706,079
Philanthropic grants, consulting and other income 876,113 1,302,045 735,885 653,095 630,017
Total income 7,053,512 6,256,530 5,860,508 5,588,814 4,919,118
Salary and associated expenses 3,918,291 3,502,692 3,398,635 3,449,943 3,439,600
Conservation program expenditure 1,489,645 1,058,487 756,151 745,218 888,158
Cost of land surrendered to government for nil consideration 0 0 0 0 251,290
Payments from appeals and other reserves with specified purposes 274,689 433,348 236,356 140,086 270,633
Other expenses 1,740,234 2,006,620 1,719,881 1,582,625 1,533,221
Total expenditure 7,422,859 7,001,147 6,111,023 5,917,872 6,382,902
Net result from transactions (369,347) (744,617) (250,515) (329,058) (1,463,784)
Gain/(loss) on non-financial assets 554,093 9,608 1,400 153,654 1,500
Gain/(loss) on financial instruments 191,937 264,826 2,135 25,914 342,230
Changes in revaluation surpluses 0 (766,900) 1,960,897 0 0
Total other economic flows 746,030 (492,466) 1,964,432 179,568 343,730
Comprehensive result 376,683 (1,237,083) 1,713,917 (149,490) (1,120,054)
Total assets 68,807,751 60,134,984 59,414,184 57,267,323 58,334,166
Net assets 33,720,672 33,343,989 34,581,072 32,867,155 33,016,645
Note: Interest income and total income in this table is stated net of interest income and the offsetting interest expense which is directly attributable to funds held on behalf of third parties. Also refer to Note 2B and Note 3E.
www.trustfornature.org.au24

BOARD AND EMPLOYEES
Trust for Nature is overseen by a Board of Trustees, appointed by the Governor-in-Council on the recommendation of the Minister administering the Victorian Conservation Trust Act 1972.
PatronHer Excellency the Honourable Linda Dessau AC, Governor of Victoria
Geoff Driver, ChairBEc, Grad Dip Finance (from 16 April 2013)
Geoff has been involved in the banking and funds management industry for more than 30 years. He is currently General Manager Business Development and Investor Relations for ASX-listed Australian Foundation Investment Company (AFIC) and for other listed investment companies Djerriwarrh Investments, Mirrabooka Investments and AMCIL Limited. He is a Director of AISC, the company that services these investment companies. Before joining AFIC, Geoff was with National Australia Bank in various executive roles and spent three years in the UK. His experience covers strategy development and planning, capital management, new business implementation and distribution and marketing. Geoff is a strong believer in the advantages of community-based participation in the conservation of Australia’s natural environment. His family has a property in the Victorian High Country that benefits from such an approach.
Amanda Noble, Deputy ChairMBA, BA, Dip Law (SAB) (from 8 December 2015)
Amanda’s experience extends across risk management, investment management, strategy and operational areas including business integration. She has worked in both the public and private sectors, predominantly in finance, with significant trust management experience. She has held executive and management positions at Equity Trustees, ANZ and Westpac, and is currently the Managing Director of Data Governance Australia. She is a Member of AICD, is a Senior Associate of Finsia, and also graduated from the Chief Executive Women’s leadership program in 2013. Amanda is particularly interested in providing opportunities for individuals to help solve global and local problems. Having attended an agricultural high school, she has long been passionate about sustainable land management balanced with active conservation of habitat and wildlife.
Amanda currently chairs Trust for Nature’s Finance & Investment and Executive Remuneration committees.
Gayle AustenBA (Media & Communications), Adv Cert App Language (Mandarin), Graduate AICD (from 8 December 2015)
Gayle is a communications specialist with extensive experience in strategic communications and community engagement. She has held senior executive positions at ANZ, Channel Seven, International CEO Forum and Foster’s. Her senior roles in journalism have been based in Australia, China and the UK including The Economist’s Intelligence Unit and The Age. She is currently Principal of Gayle Austen Communications and President of Camcare. As a former journalist with specialties in environment and rural affairs, and from a farming family, Gayle has a particular interest in the way agribusiness can help conserve the environment. She believes there are opportunities to energise and involve farmers in safeguarding our natural heritage for future generations. Gayle currently chairs Trust for Nature’s Fundraising Committee.
Cas BennettoMA (Organisational Communication), NFP Leadership (from 8 December 2015)
Cas has extensive experience across corporate and professional services, not-for-profits, government, the arts and tertiary sectors. She has worked in executive management positions at the Australian British Chamber of Commerce, Charles Darwin University, Australia Council for the Arts, the Museum of Contemporary Art and The Smith Family and is a recognised fundraiser and promoter. Cas is the CEO of the Kimberley Foundation Australia, an organisation dedicated to the research, protection and promotion of Kimberley rock art and culture. An advocate for the protection of Victoria’s native plants and wildlife, Cas believes protecting plants and animals on private land is paramount. She loves being involved with the Trust and to actively find new ways to help the Trust promote and protect private land forever through conservation covenants.
Trust for Nature Annual Report 2017-18 25

James BentleyBSc (Ecology), BCom (Economics) (from 23 August 2017)
Since 2015, James has been Associate Director, Natural Value at National Australia Bank where he leads the implementation of the bank’s commitment to embed the value of natural capital in business decisions. Previously, he worked as an Environmental Markets Manager with The Water and Carbon Group to develop and market the business case for biodiverse carbon sequestration and constructed wetland technology. He also has experience as an environmental economist consultant working for an international management services consultancy in London.
Dr Sandra BrizgaBA (Hons) (Geography, Psychology), Master of Environmental Law, Master of Applied Finance, PhD (Geomorphology), AFin, MAICD (from 23 August 2017)
Sandra has extensive experience in environmental and natural resource management. She has been an independent consultant in river, catchment and coastal management since 1995 and is also a sessional member of Planning Panels Victoria. She previously pursued a career in academia and has published a book on river management. Current and previous board and committee memberships include the Australian World Heritage Advisory Committee, Fraser Island World Heritage Area Scientific Advisory Committee, Central Coastal Board, Fisheries Co-management Council’s Inland Fishery Committee, Game Management Authority, Port Phillip and Westernport Catchment Management Authority and Victorian Catchment Management Council. She is a Fellow of the Peter Cullen Trust, an Honorary Life Member of the River Basin Management Society and has been Vice-President of the Australian and New Zealand Geomorphology Group.
Katherine CaryBCom, BA, MBA, GAICD (from 23 August 2017, on leave of absence since 28 March 2018)
Katherine has more than 15 years’ experience in strategy consulting at Seek, Westpac and National Australia Bank. Her experience has been in the formulation and development of corporate and business strategy and financial planning and analysis. Katherine has given her professional services on a volunteer basis to the Australian Indigenous Leadership Centre, to a charity for homeless women and to her local school council.
Dr Georgia GarrardPhD, BA (Hons)/BSc (from 23 August 2017)
Georgia is an ecologist and senior research fellow in RMIT’s Interdisciplinary Conservation Science Research Group. Her research draws on the fields of conservation science, urban planning, decision science and conservation psychology to develop tools to understand, plan for and manage biodiversity in human-dominated landscapes. She currently works as part of the National Environmental Science Programme’s Threatened Species Recovery Hub, investigating ways to increase community support for biodiversity conservation. Georgia is passionate about conserving Australia’s biodiversity, and she has a particular soft spot for Victoria’s threatened native grasslands, which have been the focus of much of her research. She has previously served on the Technical Advisory Group for the implementation of Melbourne’s Western Grassland Reserves.
Binda GokhaleMBA, BEc, Grad Dip (Applied Finance and Investments), GAICD (from 23 August 2017)
Binda is Chief Financial Officer with Wyndham City Council, having previously held senior finance, planning and treasury positions at Telstra. A certified public accountant, Binda currently chairs Trust for Nature’s Audit and Risk Committee after serving on this committee as an external member since 2008. She is also a member of the board of the Satellite Foundation.
Dr Charles MeredithBSc (Botany, Genetics), PhD (Zoology/Earth Sciences) (from 8 December 2015)
Charles is an ecologist and consultant with extensive experience in natural systems and conservation planning. After an early career in wildlife research, he founded Biosis Research, Australia’s largest ecological and heritage consulting firm. He was CEO there from 1984 until he retired in 2011. Charles is an inaugural Fellow of the Environment Institute of Australia and New Zealand. He is Chair of the Melbourne Strategic Assessment Land Protection Advisory Group, a member of the Course Advisory Committee for Wildlife and Conservation Biology Degree at La Trobe University and a board member of the Victorian Environmental Assessment Council. He says Trust for Nature’s significant role in contributing to the conservation of privately held vegetation and habitat is critical to the long-term conservation of Victoria’s biodiversity. Charles currently chairs Trust for Nature’s Conservation Committee.
BOARD AND EMPLOYEES (continued)
www.trustfornature.org.au26
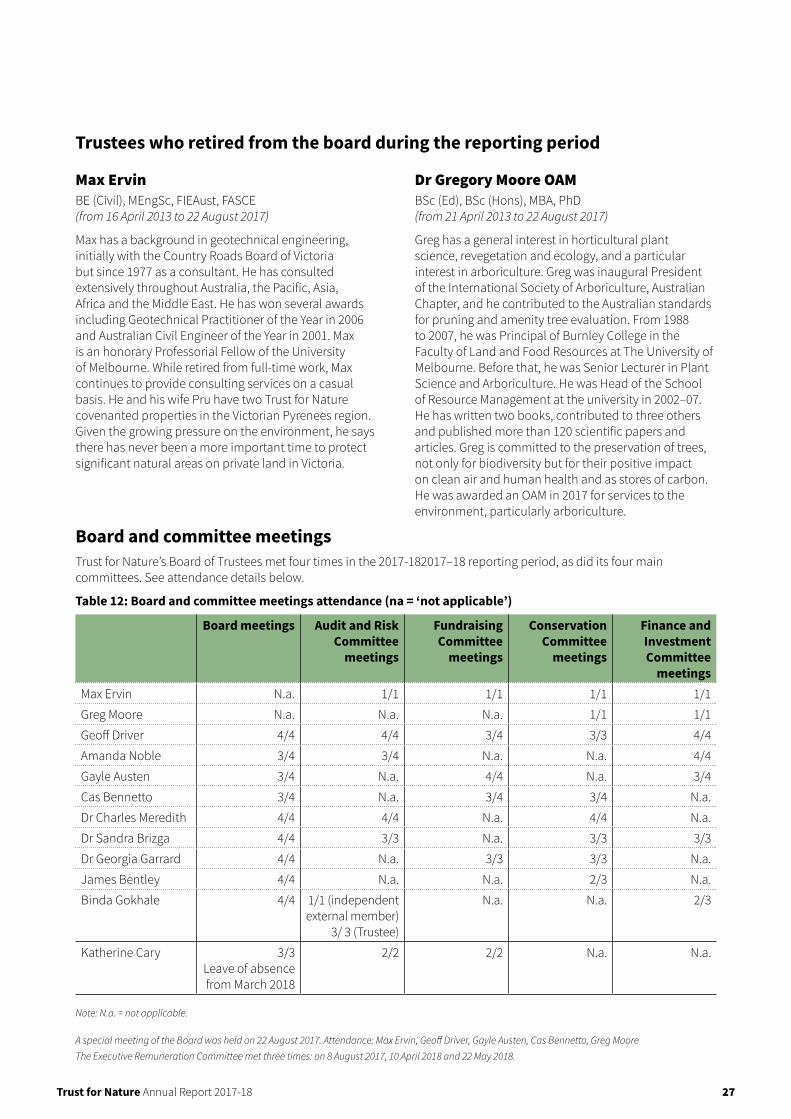
Trustees who retired from the board during the reporting period
Max ErvinBE (Civil), MEngSc, FIEAust, FASCE (from 16 April 2013 to 22 August 2017)
Max has a background in geotechnical engineering, initially with the Country Roads Board of Victoria but since 1977 as a consultant. He has consulted extensively throughout Australia, the Pacific, Asia, Africa and the Middle East. He has won several awards including Geotechnical Practitioner of the Year in 2006 and Australian Civil Engineer of the Year in 2001. Max is an honorary Professorial Fellow of the University of Melbourne. While retired from full-time work, Max continues to provide consulting services on a casual basis. He and his wife Pru have two Trust for Nature covenanted properties in the Victorian Pyrenees region. Given the growing pressure on the environment, he says there has never been a more important time to protect significant natural areas on private land in Victoria.
Dr Gregory Moore OAMBSc (Ed), BSc (Hons), MBA, PhD (from 21 April 2013 to 22 August 2017)
Greg has a general interest in horticultural plant science, revegetation and ecology, and a particular interest in arboriculture. Greg was inaugural President of the International Society of Arboriculture, Australian Chapter, and he contributed to the Australian standards for pruning and amenity tree evaluation. From 1988 to 2007, he was Principal of Burnley College in the Faculty of Land and Food Resources at The University of Melbourne. Before that, he was Senior Lecturer in Plant Science and Arboriculture. He was Head of the School of Resource Management at the university in 2002–07. He has written two books, contributed to three others and published more than 120 scientific papers and articles. Greg is committed to the preservation of trees, not only for biodiversity but for their positive impact on clean air and human health and as stores of carbon. He was awarded an OAM in 2017 for services to the environment, particularly arboriculture.
Board and committee meetingsTrust for Nature’s Board of Trustees met four times in the 2017-182017–18 reporting period, as did its four main committees. See attendance details below.
Table 12: Board and committee meetings attendance (na = ‘not applicable’)
Board meetings Audit and Risk Committee
meetings
Fundraising Committee
meetings
Conservation Committee
meetings
Finance and Investment Committee
meetingsMax Ervin N.a. 1/1 1/1 1/1 1/1
Greg Moore N.a. N.a. N.a. 1/1 1/1
Geoff Driver 4/4 4/4 3/4 3/3 4/4
Amanda Noble 3/4 3/4 N.a. N.a. 4/4
Gayle Austen 3/4 N.a. 4/4 N.a. 3/4
Cas Bennetto 3/4 N.a. 3/4 3/4 N.a.
Dr Charles Meredith 4/4 4/4 N.a. 4/4 N.a.
Dr Sandra Brizga 4/4 3/3 N.a. 3/3 3/3
Dr Georgia Garrard 4/4 N.a. 3/3 3/3 N.a.
James Bentley 4/4 N.a. N.a. 2/3 N.a.
Binda Gokhale 4/4 1/1 (independent external member)
3/ 3 (Trustee)
N.a. N.a. 2/3
Katherine Cary 3/3Leave of absence from March 2018
2/2 2/2 N.a. N.a.
Note: N.a. = not applicable.
A special meeting of the Board was held on 22 August 2017. Attendance: Max Ervin, Geoff Driver, Gayle Austen, Cas Bennetto, Greg Moore The Executive Remuneration Committee met three times: on 8 August 2017, 10 April 2018 and 22 May 2018.
Trust for Nature Annual Report 2017-18 27

Audit and Risk committeeIn 2017–18, the Trust for Nature’s Audit and Risk Committee comprised the following independent members:
• Amanda Noble (Chair until November 2017)• Binda Gokhale (Chair December 2017)• Sandra Brizga• Katherine Cary• Geoff Driver• Charles Meredith.
Binda Gokhale was an external independent member until taking on the position of Chair as an appointed trustee.
Key responsibilities of the Audit and Risk Committee are to:• review and report independently to the board on the
annual report• assist the board in reviewing the effectiveness of
Trust for Nature’s internal control environment covering: › the effectiveness and efficiency of operations › the reliability of financial reporting › compliance with applicable laws and regulations
• determine the scope of the internal audit function and ensure its resources are adequate and used effectively, including coordination with the external auditors
• maintain effective communication with external auditors
• consider recommendations made by internal and external auditors and review the implementation of actions to resolve issues raised
• oversee the effective operation of the risk management framework.
Members are appointed by the board and are subject to the committee’s terms of reference.
Meetings are held quarterly and at any other time on request of a committee member or the internal or external auditor. In 2017–18, the committee met four times.
Table 13: Trust for Nature staffing statistics by full-time equivalent
30 June 2018
30 June 2017
Regional program staff 28.0 25.6
Commercial services 1.6 2.4
Fundraising 4.6 4.4
Executive and support, policy, strategy
7.4 6.0
Other – reserve projects 0.8 0.8
Total 42.4 39.2
Table 14: Trust for Nature staffing statistics by gender (head count)
30 June 2018
30 June 2017
Females 33 30
Males 25 21
Total 58 51
Chief Executive Officer
• Victoria Marles, BA, Dip Ed, Dip Arts, LLB (Hons), LLM, FAICD
Senior officers
• Chief Financial Officer, Greg Bowers, BBus, CPA• Regional Operations Manager, Anna Foley,
BSc (Hons), Master of Environment• Strategic Conservation Futures Executive Manager,
Stephen Thuan, Cert IV in Governance, Dip. Horticulture
• Major Projects Manager, Chris Cook, BEng, MA (Env Management)
• Fundraising and Marketing Executive Manager, Leanne Down, BCom (Marketing)
• Strategic Projects Manager, Marnie Lassen, LLB (Hons), BA, GAICD
• General Counsel, Alison Gough, BA, LLB• Human Resources Manager, Richard Gales,
Dip Personnel Admin, Grad Dip Adult Education & Training, Cert in Horticultural Studies, LAHRI
BOARD AND EMPLOYEES (continued)
www.trustfornature.org.au28

ORGANISATIONAL CHART
Board of Trustees
Audit & Risk Committee
Chief Executive Officer Executive Assistant
Fundraising and Marketing Executive Manager
Parnerships Manager
Communications Coordinator
Communications and Media Manager
Digital Engagements Officer
Fundraising Coordinator
Strategic Project ManagerGeneral Counsel
Conservation Administration Officer Policy Advisor
Strategic Conservation Futures Executive Manager
Stewardship Coordinator
Conservation Science Officer
Senior Science Officer
GIS Officer
Regional Operations Manager
Regional Volunteers Coordinator
Regional Operations Admin Officer
Health & Safety Advisor
Regional Staff
Chief Finance Officer
Finance Accountant
Assistant Accountant
Administration Officer
Payroll Officer
Risk & Compliance Officer
Human Resources Manager
HR Coordinator
Commercial Services Manager
Conservation Projects Coordinator
Pimelea Conservation Officer
Revolving Fund Coordinator
Trust for Nature Annual Report 2017-18 29
Occupational health and safetyTrust for Nature continues to review and improve the effectiveness of its Health and Safety Management system in line with Australian Standard AS/NZS 4801:2001. The system’s plan has health and safety goals, objectives and performance indicators, and it helps us monitor our compliance with our OH&S legal and other regulatory requirements.
Occupational health and safety continues to be integrated into our organisational culture and is a core component of our general operations. Regular reporting to the Audit and Risk Committee and the board enables us to identify OH&S risks and to implement and oversee risk mitigation activities.
Major achievements during the year included the election and training of six designated workgroup representatives, who convene as the Trust’s OH&S Committee. These local champions of OH&S are now an additional touchpoint for OH&S matters in our organisation.
Table 15: Occupational health and safety statistics
2017–18 2016–17 2015–16OH&S committee meetings
10 3 3
Number of reported accidents and near misses received
7 11 4
Number of reported injuries received
2 4 3
Reports proceeding to Worksafe claims
0 0 0
Average cost per claim
0 0 0
Lost time standard claims
0 1 0
Employment and conduct principlesTrust for Nature has policies and practices that are consistent with the Victorian Public Sector Commission’s employment standards and provide for fair treatment, career opportunities and the early resolution of workplace issues. Trust for Nature has advised its employees on how to avoid conflicts of interest, how to respond to offers of gifts and how it deals with misconduct. The Trust offered free flu vaccinations for all staff in May 2018.
Organisational sustainabilityThis year, Trust for Nature continued to work towards minimising its impact on the environment through measures focusing on office-based activities and transportation, including reducing consumption of energy and paper and increasing recycling and environmentally sound purchases, by utilising shared fleet vehicles and flexicars.
STATUTORY COMPLIANCE
www.trustfornature.org.au30

Details of consultancies over $10,000In 2017-18 there were no consultancies engaged where the total fees payable to the consultant were $10,000 or greater.
Details of consultancies under $10,000In 2017-18 there were two consultancies engaged where the total fees payable to the consultants were less than $10,000. The total expenditure incurred during 2017-18 in relation to these consultancies was $10,300 (excl GST).
Major contractsMajor contracts are defined for Victorian Government reporting purposes as greater than $10 million. Trust for Nature did not award any major contracts during 2017–18.
Government advertisingNo government advertising expenditure was incurred by Trust for Nature during the reporting year.
Capital projectsTrust for Nature does not manage any capital projects.
Freedom of informationThe Freedom of Information Act 1982 allows the public a right of access to documents held by Trust for Nature, which is considered to be a ‘Government Agency’ under the Act. For the 12 months ending 30 June 2018, no FOI applications were received by Trust for Nature.
Making a requestAccess to documents may be obtained through written request to the Freedom of Information Manager or Authorised Officer, as detailed in s17 of the Freedom of Information Act 1982.
When making a FOI request, applicants should ensure the request:
• is in writing to the authorised officer• clearly identifies which document is being sought• is accompanied by an application fee of $28.90
(as at the time of this report’s publication): the fee may be waived in certain circumstances.
Access charges may also be applicable.
A decision to release information is made by Trust for Nature’s Authorised Officer. FOI requests can be made to Chief Finance Officer, Trust for Nature, 5/379 Collins Street, Melbourne VIC [email protected]. FOI requests can also be lodged online at www.foi.vic.gov.au.
Further information about freedom of information can be found at www.foi.vic.gov.au.
Compliance with the Building Act 1993Trust for Nature does not own or control any government buildings and consequently is exempt from notifying its compliance with the building and maintenance provisions of the Building Act 1993.
Trust for Nature Annual Report 2017-18 31
Compliance with the Protected Disclosure Act 2012The Protected Disclosure Act 2012 enables people to make disclosures about improper conduct by public officers and public bodies. The Act aims to ensure openness and accountability by encouraging people to make disclosures and protecting them when they do.
What is a protected disclosure?A protected disclosure is a complaint of corrupt or improper conduct by a public officer or a public body. Trust for Nature is a public body for the purposes of the Act.
What is improper or corrupt conduct?Improper or corrupt conduct involves substantial mismanagement of public resources, or risk to public health or safety or the environment, or corruption. The conduct must be criminal in nature or a matter for which an officer could be dismissed.
How do I make a protected disclosure?You can make a protected disclosure about Trust for Nature or its board members, officers or employees by contacting Independent Broad-Based Anti-Corruption Commission via the contact details provided below. Please note that Trust for Nature is not able to receive protected disclosures.
Protected disclosure contactsIndependent Broad-Based Anti-Corruption Commission (IBAC) Victoria
Level 1 North Tower, 459 Collins Street, Melbourne Victoria 3000;
or at Mail: IBAC GPO Box 24234 Melbourne Victoria 3001
Website: www.ibac.vic.gov.au
The IBAC website — www.ibac.vic.gov.au — has details about its secure email disclosure process, which provides for anonymous disclosures.
Trust for Nature cannot receive protected disclosures.
National competition policyCompetitive neutrality seeks to enable fair competition between government and private sector businesses. Advantages that government businesses may experience, simply as a result of government ownership, should be neutralised. Trust for Nature continues to implement and apply this principle in its business undertakings. Trust for Nature complies with the Competitive Neutrality Policy Victoria Statement issued in September 2012.
Local Jobs First – Victorian Industry Participation PolicyThe Victorian Industry Participation Policy Act 2003 requires departments and public sector bodies to report on the implementation of the Local Jobs First – Victorian Industry Participation Policy (Local Jobs First – VIPP). Departments and public sector bodies are required to apply the Local Jobs First - VIPP in all procurement activities valued at $3 million or more in metropolitan Melbourne and for state-wide projects, or $1 million or more for procurement activities in regional Victoria. Trust for Nature has not commenced or completed any contracts during 2017–18 to which Local Jobs First - VIPP applied.
Financial management compliance attestationI, Geoff Driver, certify that Trust for Nature has complied with the applicable Standing Directions of the Minister for Finance under the Financial Management Act 1994 and Instructions.
Geoff Driver, Chair 28 August 2018
Responsible body declarationIn accordance with the Financial Management Act 1994, I am pleased to present Trust for Nature’s Annual Report for the year ending 30 June 2018.
Geoff Driver, Chair 28 August 2018
STATUTORY COMPLIANCE (continued)
www.trustfornature.org.au32

Availability of other informationOther information to be made available upon request (subject to the Freedom of Information Act 1982) is as follows:
• a statement that declarations of pecuniary interests were duly completed by all relevant officers
• details of shares held in subsidiaries• details of publications produced and how these can
be obtained• details of changes in prices, fees, charges, rates and
levies charged• details of any major external reviews• details of major research and development activities• details of overseas visits• details of major promotional, public relations and
marketing activities
• details of assessments and measures undertaken to improve occupational health and safety of employees
• a general statement on industrial relations and details of time lost through industrial accidents and disputes
• a list of major committees, the purpose of each committee and the extent to which the purposes have been achieved
• details of all consultancies and contractors.The information is available on request from Chief Finance Officer, Trust for Nature, Level 5/379 Collins Street, Melbourne Victoria 3000.
Information and communication technology expenditureNOTE: In 2017—18, the Trust had a total ICT expenditure of $385,541. See below.
Business As Usual ICT expenditure
Non Business As Usual ICT expenditure
Operational expenditure Capital expenditure
Total Total Operational and Capital
226 160 16 144
Disclosure of grants and transfer paymentsTrust for Nature made the following payments in 2017–18.
Offset agreements
Total amount Recipients
$4,473,723 44 private landowners under 150 agreements
These are payments, provided by offset credit purchasers, made to landowners under biodiversity offset agreements to meet approvals under Victorian and Commonwealth legislation. Annual payments are made to landowners upon meeting the requirements of an agreed management plan. In addition, payments to landowners are made when surplus offset credits are traded.
Incentive programs
Total amount Recipients$157,320 16 private landowners
These are payments made to landowners under government incentive programs and administered under land management agreements to achieve improved on-ground biodiversity outcomes.
Trust for Nature Annual Report 2017-18 33

DISCLOSURE INDEXThe Annual Report of Trust for Nature is prepared in accordance with all relevant Victorian legislation and pronouncements. This index identifies the Trust’s compliance with statutory disclosure requirements.
Legislation Requirement Page referenceMinisterial Directions & Financial Reporting DirectionsCharter and purposeFRD 22H Manner of establishment and relevant Minister Page 4FRD 22H Purpose, functions, powers and duties Page 4-5FRD 22H Nature and range of services provided Page 6-8FRD 22H Operational objectives and outcomes Page 9-10FRD 22H Key initiatives and projects Page 11-18Management and structureFRD 22H Governing board Page 25-28FRD 22H Board committee structure Page 27SD 3.2.1 Audit committee membership and role Page 28FRD 22H Organisational structure Page 29FRD 21C Executive Officer data and disclosure Page 86FRD 29B Workforce data Page 28Other informationFRD 10A Disclosure index Page 34FRD 25C Victorian Industry Participation Policy disclosure Page 32FRD 22H Statement on National Competition Policy Page 32FRD 22H Occupational health and safety Page 30FRD 22H Employment and conduct principles Page 30FRD 22H Application and operation of Freedom of Information Act 1982 Page 31FRD 22H Application and operation of the Protected Disclosure Act 2012 Page 32FRD 22H Compliance with Building Act 1993 Page 31FRD 24C Office based environmental impacts Page 30FRD 22H Statement of availability of other information Page 33FRD 30D Standard requirements for print and design of annual reports Entire documentFinancial informationFRD 22H Summary of the financial results for the year Page 23FRD 22H Consultancies over $10,000 Page 31FRD 22H Consultancies under $10,000 Page 31FRD 12B Disclosure of major contracts Page 31FRD 22H Disclosure of government advertising expenditure Page 31FRD 22H Disclosure of capital projects Page 31FRD 22H Disclosure of grants and transfer payments Page 33FRD 22H Disclosure of ICT expenditure Page 33FRD 22H Significant changes in financial position during the year Page 23FRD 22H Major changes or factors affecting performance Page 23FRD 22H Subsequent events Page 23Compliance attestation and declarationSD 5.2.3 Declaration in report of operations Page 32SD 5.2.2 Declaration in financial statements Page 35SD 3.7.1 Risk management attestation Page 32Other requirements under Standing Directions 5.2SD 5.2.1 (a) Compliance with Australian accounting standards and other authoritative pronouncements Page 35SD 5.2.1 (a) Compliance with Ministerial Directions Page 35SD 5.2.1 (b) Compliance with Model Financial Report Page 35-91LegislationVictorian Conservation Trust Act 1972 Page 4-5Freedom of Information Act 1982 Page 31Building Act 1993 Page 31Protected Disclosure Act 2012 Page 32Victorian Industry Participation Policy Act 2003 Page 32Financial Management Act 1994 Page 35
www.trustfornature.org.au34

FINANCIALS
DECLARATION IN THE FINANCIAL STATEMENTS
The attached financial statements for Trust for Nature (Victoria) have been prepared in accordance with Standing Direction 5.2 of the Standing Directions of the Minister of Finance under the Financial Management Act 1994, Australian Charities and Not-for-profit Commission Act 2012, the Australian Charities and Not-for-profit Commission Regulations 2013, applicable Financial Reporting Directions, Australian Accounting Standards including Interpretations, and other mandatory professional reporting requirements.
We further state that, in our opinion, the information set out in the comprehensive operating statement, balance sheet, statement of changes in equity, cash flow statement and accompanying notes, presents fairly the financial transactions during the year ended 30 June 2018 and financial position of the Trust at 30 June 2018.
At the time of signing, we are not aware of any circumstance which would render any particulars included in the financial statements to be misleading or inaccurate.
We authorise the attached financial statements for issue on 11 September 2018.
Greg BowersChief Finance Officer Trust for Nature
Melbourne
11 September 2018
Victoria MarlesChief Executive Officer Trust for Nature
Melbourne
11 September 2018
Geoff Driver ChairmanTrust for Nature
Melbourne
11 September 2018
Trust for Nature Annual Report 2017-18 35

www.trustfornature.org.au36
Trust for Nature Annual Report 2017-18 37
www.trustfornature.org.au38

Trust for Nature (Victoria) financial statements
Comprehensive operating statementFor the financial year ended 30 June 2018
Notes 2018 2017
$ $Continuing operations
Income from transactions
Grant and consulting income 2(a) 4,738,884 4,278,751
Interest on investments 2(b) 783,512 854,116
Dividends 2(c) 272,612 159,473
Donations 2(d) 1,384,206 949,207
Fair value of services received free of charge or for nominal consideration 2(e) 20,060 5,518
Other income 2(f) 322,604 530,703
Total income from transactions 7,521,878 6,777,768
Expenses from transactions
Employee benefits 3(a) (3,918,291) (3,502,692)
Depreciation & amortisation 3(b) (302,539) (280,424)
Conservation, covenant and stewardship programs 3(c) (1,489,645) (1,058,487)
Payments from appeals and other reserves with specified purpose 3(d) (274,689) (433,348)
Other operating expenses 3(e) (1,906,061) (2,247,434)
Total expenses from transactions (7,891,225) (7,522,385)
Net result from transactions (net operating balance) (369,347) (744,617)
Other economic flows included in net result
Net gain/(loss) on non-financial assets (i) 4(a) 554,093 9,608
Net gain/(loss) on financial instruments (ii) 4(b) 191,937 264,826
Total other economic flows included in net result 746,030 274,434
Net result 376,683 (470,183)
Other economic flows - other comprehensive income
Items that will not be reclassified to net result
Changes in physical asset revaluation surplus 20 - (766,900)
Total other economic flows - other comprehensive income - (766,900)
Comprehensive result 376,683 (1,237,083)
The accompanying notes form part of these financial statements.
Notes:(i) 'Net gain/(loss) on non-financial assets' includes unrealised and realised gains/(losses) from revaluations, impairments, and disposals ofall physical assets and intangible assets, except when these are taken through the asset revaluation surplus.
(ii) 'Net gain/(loss) on financial instruments' includes unrealised and realised gains/(losses) from revaluations, impairments and reversals ofimpairment, and gains/(losses) from disposals of financial instruments.
Page 5
Trust for Nature Annual Report 2017-18 39

Balance sheetAs at 30 June 2018
Notes 2018 2017
$ $Assets
Financial assets
Cash and deposits 19 7,937,327 4,723,575
Receivables 5 7,164,985 1,136,886
Investments and other financial assets 6 32,666,137 32,368,128
Other assets 7 128,525 223,880
Total financial assets 47,896,974 38,452,469
Non-financial assets
Non-financial physical assets classified as held for sale 8 1,050,532 1,574,972
Property, plant and equipment 9 19,625,632 19,804,614
Intangible assets 10 234,613 302,929
Total non-financial assets 20,910,777 21,682,515
Total assets 68,807,751 60,134,984
Liabilities
Payables 11 1,596,086 805,158
Borrowings 12 23,523 34,912
Provisions 13 1,607,122 1,304,310
Other liabilities 14 31,860,348 24,646,615
Total liabilities 35,087,079 26,790,995
Net assets 33,720,672 33,343,989
Equity
Accumulated surplus 21 11,341,598 12,135,301
Reserves 20 22,279,074 21,108,688
Contributed capital 100,000 100,000
Net Worth 33,720,672 33,343,989
Commitments for expenditure 16 26,063 45,609
Contingent liabilities and contingent assets 17
The accompanying notes form part of these financial statements.
Page 6
www.trustfornature.org.au40

Balance sheetAs at 30 June 2018
Notes 2018 2017
$ $Assets
Financial assets
Cash and deposits 19 7,937,327 4,723,575
Receivables 5 7,164,985 1,136,886
Investments and other financial assets 6 32,666,137 32,368,128
Other assets 7 128,525 223,880
Total financial assets 47,896,974 38,452,469
Non-financial assets
Non-financial physical assets classified as held for sale 8 1,050,532 1,574,972
Property, plant and equipment 9 19,625,632 19,804,614
Intangible assets 10 234,613 302,929
Total non-financial assets 20,910,777 21,682,515
Total assets 68,807,751 60,134,984
Liabilities
Payables 11 1,596,086 805,158
Borrowings 12 23,523 34,912
Provisions 13 1,607,122 1,304,310
Other liabilities 14 31,860,348 24,646,615
Total liabilities 35,087,079 26,790,995
Net assets 33,720,672 33,343,989
Equity
Accumulated surplus 21 11,341,598 12,135,301
Reserves 20 22,279,074 21,108,688
Contributed capital 100,000 100,000
Net Worth 33,720,672 33,343,989
Commitments for expenditure 16 26,063 45,609
Contingent liabilities and contingent assets 17
The accompanying notes form part of these financial statements.
Page 6
Cash flow statementFor the financial year ended 30 June 2018
Notes 2018 2017
$ $Cash flows from operating activities
Receipts
State Government - Operating grant 797,000 1,485,000
GST recovered from the ATO 268,622 314,020
Interest received 700,151 938,505
Donations, grants and other receipts 7,324,786 5,861,297
Total receipts 9,090,559 8,598,822
Payments
Payments to employees (3,830,473) (3,460,380)
Payments to suppliers (3,452,095) (3,604,221)
Interest paid to landowners (93,390) (450,054)
GST paid to the ATO (603,047) (464,020)
Total payments (7,979,005) (7,978,675)
Net cash flows from/(used in) operating activities 19(b) 1,111,554 620,147
Cash flows from investing activities
Proceeds from sale of non-financial assets 1,260,564 -
Proceeds from other liabilities 5,402,470 4,202,293
Proceeds from financial assets 6,154,592 1,389,329
Payments for non-financial assets, land and buildings - (66,440)
Payments to landowners (4,473,723) (2,825,806)
Payments for fixed assets (19,156) (163,803)
Payments for intangible assets (36,085) (191,208)
Payments for financial assets (6,175,075) (126,000)
Net cash flows from/(used in) investing activities 2,113,587 2,218,365
Cash flows from financing activities
Repayment of finance leases (11,389) (3,367)
Net cash flows from/(used in) financing activities (11,389) (3,367)
Net increase/(decrease) in cash and cash equivalents 3,213,752 2,835,145
Cash and cash equivalents at the beginning of the financial year 4,723,575 1,888,430
Cash and cash equivalents at the end of the financial year 19(a) 7,937,327 4,723,575
The accompanying notes form part of these financial statements.
Page 7
Trust for Nature Annual Report 2017-18 41
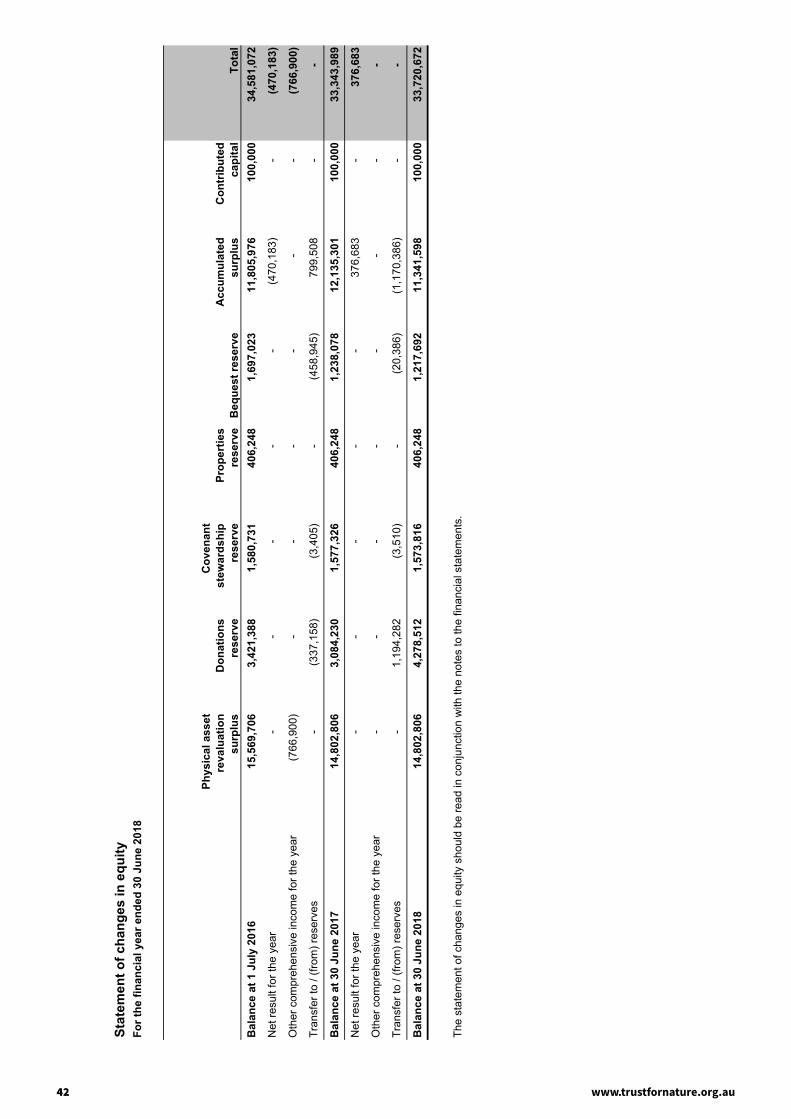
Stat
emen
t of c
hang
es in
equ
ityFo
r the
fina
ncia
l yea
r end
ed 3
0 Ju
ne 2
018
Phys
ical
ass
etre
valu
atio
nsu
rplu
sD
onat
ions
rese
rve
Cov
enan
tst
ewar
dshi
pre
serv
ePr
oper
ties
rese
rve
Beq
uest
rese
rve
Acc
umul
ated
surp
lus
Con
trib
uted
capi
tal
Tota
lB
alan
ce a
t 1 J
uly
2016
15,5
69,7
063,
421,
388
1,58
0,73
140
6,24
81,
697,
023
11,8
05,9
7610
0,00
034
,581
,072
Net
resu
lt fo
r the
yea
r-
--
--
(470
,183
)-
(470
,183
)
Oth
er c
ompr
ehen
sive
inco
me
for t
he y
ear
(766
,900
)-
--
--
-(7
66,9
00)
Tran
sfer
to /
(from
) res
erve
s-
(337
,158
)(3
,405
)-
(458
,945
)79
9,50
8-
-
Bal
ance
at 3
0 Ju
ne 2
017
14,8
02,8
063,
084,
230
1,57
7,32
640
6,24
81,
238,
078
12,1
35,3
0110
0,00
033
,343
,989
Net
resu
lt fo
r the
yea
r-
--
--
376,
683
-37
6,68
3
Oth
er c
ompr
ehen
sive
inco
me
for t
he y
ear
--
--
--
--
Tran
sfer
to /
(from
) res
erve
s-
1,19
4,28
2(3
,510
)-
(20,
386)
(1,1
70,3
86)
--
Bal
ance
at 3
0 Ju
ne 2
018
14,8
02,8
064,
278,
512
1,57
3,81
640
6,24
81,
217,
692
11,3
41,5
9810
0,00
033
,720
,672
The
stat
emen
t of c
hang
es in
equ
ity s
houl
d be
read
in c
onju
nctio
n w
ith th
e no
tes
to th
e fin
anci
al s
tate
men
ts.
Pag
e 8
www.trustfornature.org.au42

Page 9
Notes to the financial statements
Note 1 Summary of significant accounting policies .......................................................................... 10
Note 2 Income from transactions...................................................................................................... 25
Note 3 Expenses from transactions.................................................................................................. 26
Note 4 Other economic flows............................................................................................................ 26
Note 5 Receivables........................................................................................................................... 27
Note 6 Investments and other financial assets................................................................................. 27
Note 7 Other assets .......................................................................................................................... 28
Note 8 Non-financial assets classified as held for sale .................................................................... 28
Note 9 Property, plant and equipment .............................................................................................. 29
Note 10 Intangible assets .................................................................................................................. 35
Note 11 Payables............................................................................................................................... 35
Note 12 Borrowings ........................................................................................................................... 36
Note 13 Provisions............................................................................................................................. 36
Note 14 Other liability disclosures ..................................................................................................... 38
Note 15 Leases.................................................................................................................................. 39
Note 16 Commitments for expenditure .............................................................................................. 39
Note 17 Contingent assets and contingent liabilities ......................................................................... 40
Note 18 Financial instruments ........................................................................................................... 40
Note 19 Cash flow information........................................................................................................... 50
Note 20 Reserves .............................................................................................................................. 51
Note 21 Accumulated surplus............................................................................................................ 52
Note 22 Responsible persons............................................................................................................ 52
Note 23 Remuneration of executives................................................................................................. 53
Note 24 Related parties ..................................................................................................................... 53
Note 25 Ex-gratia expenses .............................................................................................................. 54
Note 26 Remuneration of auditors..................................................................................................... 54
Note 27 Subsequent events .............................................................................................................. 54
Note 28 Glossary of terms ................................................................................................................. 55
Trust for Nature Annual Report 2017-18 43
Page 10
Notes to the financial statementsFor the financial year ended 30 June 2018
Note 1 Summary of significant accounting policies
These annual financial statements represent the audited general purpose financial statements for the Trust for Nature (Victoria) (the Trust) for the period ended 30 June 2018. The purpose of the report is to provide users with information about the Trust’s stewardship of resources entrusted to it.
(A) Statement of compliance
These general purpose financial statements have been prepared in accordance with the Financial Management Act 1994 (FMA), Australian Charities and Not-for-profit Commission Act 2012, the Australian Charities and Not-for-profit Commission Regulations 2013 and applicable Australian Accounting Standards (AAS) which include Interpretations, issued by the Australian Accounting Standards Board (AASB).
Where appropriate, those AAS paragraphs applicable to not-for-profit entities have been applied.
Accounting policies are selected and applied in a manner which ensures that the resulting financial information satisfies the concepts of relevance and reliability, thereby ensuring that the substance of the underlying transactions or other events is reported.
To gain a better understanding of the terminology used in this report, a glossary of terms can be found in Note 28.
The annual financial statements were authorised for issue by the Board of Trustees for the Trust on the 11th of September 2018.
(B) Basis of accounting preparation and measurement
The accrual basis of accounting has been applied in the preparation of these financial statements whereby assets, liabilities, equity, income and expenses are recognised in the reporting period to which they relate, regardless of when cash is received or paid.
Judgements, estimates and assumptions are required to be made about the carrying values of assets and liabilities that are not readily apparent from other sources. The estimates and associated assumptions are based on professional judgements derived from historical experience and various other factors that are believed to be reasonable under the circumstances. Actual results may differ from these estimates.
Revisions to accounting estimates are recognised in the period in which the estimate is revised and also in future periods that are affected by the revision. Judgements and assumptions made by management in the application of AASs that have significant effects on the financial statements and estimates relate to:
the fair value of land, buildings, leasehold improvements, plant and equipment and motor vehicles, (refer to Note 1(K)); and actuarial assumptions for employee benefit provisions based on likely tenure of existing staff, patterns of leave claims, future
salary movements and future discount rates (refer to Note 1(L)) the estimated useful life of assets (refer to Note 1(G) impairment of non-financial assets (refer Note 1(H).
These financial statements are presented in Australian dollars, and prepared in accordance with the historical cost convention exceptfor:
non-financial physical assets which, subsequent to acquisition, are measured at a revalued amount being their fair value at thedate of the revaluation less any subsequent accumulated depreciation and subsequent impairment losses. Revaluations aremade with sufficient regularity to ensure that the carrying amounts do not materially differ from their fair value;
managed investment schemes, which are measured at fair value with changes reflected in the comprehensive operatingstatement (fair value through profit and loss);
certain liabilities, most notably provisions and other liabilities; and
available-for-sale investments which are measured at fair value with movements reflected in ‘other economic flows – othercomprehensive income’.
Consistent with AASB 13 Fair Value Measurement, the Trust determines the policies and procedures for both recurring fair valuemeasurements such as property, plant and equipment, investment properties and financial instruments and for non-recurring fairvalue measurements such as non-financial physical assets held for sale, in accordance with the requirements of AASB 13 and therelevant Financial Reporting Directions.
www.trustfornature.org.au44

Page 11
Note 1 Summary of significant accounting policies (continued)
All assets and liabilities for which fair value is measured or disclosed in the financial statements are categorised within the fair valuehierarchy, described as follows, based on the lowest level input that is significant to the fair value measurement as a whole:
Level 1 — Quoted (unadjusted) market prices in active markets for identical assets or liabilities
Level 2 — Valuation techniques for which the lowest level input that is significant to the fair value measurement is directly orindirectly observable; and
Level 3 — Valuation techniques for which the lowest level input that is significant to the fair value measurement isunobservable.
For the purpose of fair value disclosures, the Trust has determined classes of assets and liabilities on the basis of the nature,characteristics and risks of the asset or liability and the level of the fair value hierarchy as explained above.
In addition, the Trust determines whether transfers have occurred between levels in the hierarchy by reassessing categorisation(based on the lowest level input that is significant to the fair value measurement as a whole) at the end of each reporting period.
The Valuer-General Victoria (VGV) is the Trust’s independent valuation agency.
The Trust, in conjunction with VGV, monitors changes in the fair value of each asset through relevant data sources to determinewhether revaluation is required.
(C) Reporting entity
The financial statements cover Trust for Nature (Victoria) as an individual reporting entity. The Trust is a body corporate establishedunder the Victorian Conservation Trust Act 1972 (the Act). Its principal address is:
Level 5, 379 Collins StreetMelbourne VIC 3000
The financial statements include all the controlled activities of the Trust.
Objectives and fundingUnder the Act, the Trust’s objectives are to:
conserve areas which are ecologically significant, of natural interest or beauty, or of historical interest; conserve wildlife and native plants; conserve and create areas for scientific study; and encourage and assist in the conservation and creation of areas of natural beauty or interest for recreation and/or
educational use by the public.
The objectives under the Act form the basis of the goals and operations of the Trust.
Trust for Nature has five goals for driving nature conservation and operational excellence: maximise the biodiversity outcomes of nature conservation actions; protect and manage land for biodiversity; achieve growth and excellence in its business; encourage investment in nature conservation; and capture new opportunities for achieving biodiversity gains.
The Trust obtains its funding from a number of sources including State and Commonwealth Governments, donations and bequests,investment income and the sale of goods and services.
(D) Scope and presentation of financial statements
Comprehensive operating statement
The comprehensive operating statement comprises three components, being ‘net result from transactions’ (or termed as ‘netoperating balance’), ‘other economic flows included in net result’, as well as ‘other economic flows – other comprehensive income’.The sum of the former two, together with the net result from discontinued operations, represents the net result.
The net result is equivalent to profit or loss derived in accordance with AASs.
Trust for Nature Annual Report 2017-18 45

Page 12
Note 1 Summary of significant accounting policies (continued)
This classification is consistent with the whole of government reporting format and is allowed under AASB 101 Presentation ofFinancial Statements.
Balance sheetAssets and liabilities are presented in liquidity order with assets aggregated into financial assets and non-financial assets.
Current and non-current assets and liabilities are disclosed in the notes, where relevant. In general, non-current assets or liabilitiesare expected to be recovered or settled more than 12 months after the reporting period, except for the provisions of employeebenefits, which are classified as current liabilities if the Trust does not have the unconditional right to defer settlement of the liabilitieswithin 12 months after the end of the reporting period.
Cash flow statement
Cash flows are classified according to whether or not they arise from operating activities, investing activities, or financing activities.This classification is consistent with requirements under AASB 107 Statement of cash flows.
Statement of changes in equityThe statement of changes in equity presents reconciliations of non-owner and owner changes in equity from opening balances atthe beginning of the reporting period to the closing balances at the end of the reporting period. It also shows separately changes dueto amounts recognised in the ‘Comprehensive result’ and amounts related to ‘Transactions with owner in its capacity as owner’.
RoundingAmounts in the financial statements have been rounded to the nearest dollar.
(E) Changes in accounting policies
Subsequent to the 2016-17 reporting period, no new or revised Standards have been adopted in the current period that resulted ina financial or accounting policy impact.
(F) Income from transactions
Income is recognised to the extent that it is probable that the economic benefits will flow to the entity and the income can be reliablymeasured at fair value.
InterestInterest income is recognised on a time proportionate basis that takes into account the effective yield on the financial asset.
Interest income includes interest received on bank term deposits and other investments.
Net realised and unrealised gains and losses on the revaluation of investments do not form part of income from transactions, but arereported as part of income from other economic flows in the net result or as unrealised gains and losses taken directly to equity,forming part of the total change in net worth in the comprehensive result.
Sales of goods and servicesIncome from the supply of services
Income from the provision of services is recognised by reference to the stage of completion of the contract. The income is recognisedwhen the amount of the income, stage of completion and transaction costs incurred can be reliably measured, and it is probable thatthe economic benefits associated with the transaction will flow to the entity.
The stage of completion is measured by reference to completion of milestones.
Income from sale of goodsIncome from the sale of goods is recognised when: the significant risks and rewards of ownership of the goods have transferred to the buyer; the Trust retains neither continuing managerial involvement to the degree usually associated with ownership nor effective control
over the goods sold; the amount of income can be reliably measured; it is probable that the economic benefits associated with the transaction will flow to the Trust; and costs incurred or to be incurred in respect of the transaction can be measured reliably.
Page 13
Note 1 Summary of significant accounting policies (continued)
GrantsGrants are recognised as income when the Trust gains control of the underlying assets in accordance with AASB 1004 Contributions.For reciprocal grants, the Trust is deemed to have assumed control when the performance has occurred under the grant. For non-reciprocal grants, the Trust is deemed to have assumed control when the grant is received or receivable. Conditional grants may bereciprocal or non-reciprocal depending on the terms of the grant.
Fair value of assets and services received free of charge or for nominal considerationIf applicable, material contributions of resources received free of charge or for nominal consideration are recognised at their fair valuewhen the transferee obtains control over them, irrespective of whether restrictions or conditions are imposed over the use of thecontributions, unless received from another government department or agency as a consequence of a restructuring of administrativearrangements. In the latter case, such a transfer will be recognised at carrying value. Contributions in the form of services are onlyrecognised when fair value can be reliably determined and the services would have been purchased if not donated.
Other incomeDividend income
Dividend revenue is recognised when the right to receive payment is established.
Donation income
Donation revenue is recognised when the cash is received. Donations and bequests of shares and properties are brought to accountat their values on the date of transfer.
(G) Expenses from transactions
Expenses from transactions are recognised as they are incurred, and reported in the financial year to which they relate.
Employee expenses
These expenses include all costs related to employment including wages and salaries, fringe benefits tax, leave entitlements,redundancy payments and WorkCover premiums.
Superannuation – State superannuation defined benefit plansThere are no defined benefit superannuation contribution plans.
Depreciation and amortisation
All infrastructure assets, buildings, plant and equipment and other non-current physical assets (excluding items under operatingleases, assets held-for-sale and investment properties) that have a limited useful life are depreciated. Depreciation is generallycalculated on a straight-line basis, at rates that allocate the asset’s value, less any estimated residual value, over its estimated usefullife.
The estimated useful lives, residual values and depreciation method are reviewed at the end of each annual reporting period.
The following are typical estimated useful lives for the different asset classes for current and prior years.
Asset class Useful lifeBuildings 40 yearsFencing 20 yearsLeasehold improvements Minimum lease termPlant and equipment 3 to 10 yearsVehicles 7 to 10 yearsIntangible non-produced assets - software 3 to 5 years
Land which is considered to have an indefinite life is not depreciated. Depreciation is not recognised in respect of such assets astheir service potential has not, in any material sense, been consumed during the reporting period.
The consumption of intangible non-produced assets with finite useful lives is not classified as a transaction, but as amortisation.Consequently, the amortisation is included as an other economic flow in the net result.
www.trustfornature.org.au46

Page 13
Note 1 Summary of significant accounting policies (continued)
GrantsGrants are recognised as income when the Trust gains control of the underlying assets in accordance with AASB 1004 Contributions.For reciprocal grants, the Trust is deemed to have assumed control when the performance has occurred under the grant. For non-reciprocal grants, the Trust is deemed to have assumed control when the grant is received or receivable. Conditional grants may bereciprocal or non-reciprocal depending on the terms of the grant.
Fair value of assets and services received free of charge or for nominal considerationIf applicable, material contributions of resources received free of charge or for nominal consideration are recognised at their fair valuewhen the transferee obtains control over them, irrespective of whether restrictions or conditions are imposed over the use of thecontributions, unless received from another government department or agency as a consequence of a restructuring of administrativearrangements. In the latter case, such a transfer will be recognised at carrying value. Contributions in the form of services are onlyrecognised when fair value can be reliably determined and the services would have been purchased if not donated.
Other incomeDividend income
Dividend revenue is recognised when the right to receive payment is established.
Donation income
Donation revenue is recognised when the cash is received. Donations and bequests of shares and properties are brought to accountat their values on the date of transfer.
(G) Expenses from transactions
Expenses from transactions are recognised as they are incurred, and reported in the financial year to which they relate.
Employee expenses
These expenses include all costs related to employment including wages and salaries, fringe benefits tax, leave entitlements,redundancy payments and WorkCover premiums.
Superannuation – State superannuation defined benefit plansThere are no defined benefit superannuation contribution plans.
Depreciation and amortisation
All infrastructure assets, buildings, plant and equipment and other non-current physical assets (excluding items under operatingleases, assets held-for-sale and investment properties) that have a limited useful life are depreciated. Depreciation is generallycalculated on a straight-line basis, at rates that allocate the asset’s value, less any estimated residual value, over its estimated usefullife.
The estimated useful lives, residual values and depreciation method are reviewed at the end of each annual reporting period.
The following are typical estimated useful lives for the different asset classes for current and prior years.
Asset class Useful lifeBuildings 40 yearsFencing 20 yearsLeasehold improvements Minimum lease termPlant and equipment 3 to 10 yearsVehicles 7 to 10 yearsIntangible non-produced assets - software 3 to 5 years
Land which is considered to have an indefinite life is not depreciated. Depreciation is not recognised in respect of such assets astheir service potential has not, in any material sense, been consumed during the reporting period.
The consumption of intangible non-produced assets with finite useful lives is not classified as a transaction, but as amortisation.Consequently, the amortisation is included as an other economic flow in the net result.
Trust for Nature Annual Report 2017-18 47
Page 14
Note 1 Summary of significant accounting policies (continued)
Conservation, covenant and stewardship programs expense
Conservation, covenant and stewardship programs expense generally represent costs incurred in connection with the Trust’s regionalconservation service delivery and include payments to suppliers of fencing and revegetation services, landowner incentive programs,payments to grant project partners and contributions to property acquired by the Crown.
Conservation, covenant and stewardship programs expenses are recognised in the period in which they are incurred, including,where income is received for the purpose, provision for future stewardship, which is recognised at the time a new covenant is securedand the stewardship obligation commences.
Interest expense
Interest expense represents costs incurred in connection with interest bearing liabilities.
Interest expenses are recognised in the period in which they are incurred. Refer to Note 28 for an explanation of interest expenseitems.
Other operating expenses
Other operating expenses generally represent the day to day running costs incurred in normal operations and include:
Supplies and services
Supplies and services expenses are recognised as an expense in the reporting period in which they are incurred.
(H) Other economic flows included in net result
Other economic flows measure the change in volume or value of assets or liabilities that does not result from transactions. Theseinclude:
Net gain/(loss) on non-financial assets
Net gain/(loss) on non-financial assets and liabilities includes realised and unrealised gains and losses as follows:
Revaluation gains/(losses) of non-financial physical assets
Refer to Note 1(K) Revaluations of non-financial physical assets.
Net gain/(loss) on disposal of non-financial assets
Any gain or loss on the sale of non-financial assets is recognised at the date of disposal and is determined after deducting from theproceeds the carrying value of the asset at the time.
Amortisation of non-produced intangible assets (refer Note 1(K)).
Intangible non-produced assets with finite lives are amortised as an other economic flow on a systematic (typically straight-line) basisover the asset’s useful life. Amortisation begins when the asset is available for use, that is, when it is in the location and conditionnecessary for it to be capable of operating in the manner intended by management.
Impairment of non-financial assets
All assets are assessed annually for indications of impairment except for:
financial assets (refer Note 1(J));
non-financial physical assets held for sale (refer Note 1(K));
If there is an indication of impairment, the assets concerned are tested as to whether their carrying value exceeds their possiblerecoverable amount. Where an asset’s carrying value exceeds its recoverable amount, the difference is written off as an othereconomic flow, except to the extent that the write-down can be debited to an asset revaluation reserve amount applicable to thatclass of asset.
If there is an indication that there has been a reversal in the estimate of an asset’s recoverable amount since the last impairmentloss was recognised, the carrying amount shall be increased to its recoverable amount. The impairment loss is reversed only to theextent that the asset’s carrying amount does not exceed the carrying amount that would have been determined, net of depreciationor amortisation, if no impairment loss had been recognised in prior years.
Page 15
Note 1 Summary of significant accounting policies (continued)
It is deemed that, in the event of the loss of an asset, the future economic benefits arising from the use of the asset will be replacedunless a specific decision to the contrary has been made. The recoverable amount for most assets is measured at the higher ofdepreciated replacement cost and fair value less costs to sell. Recoverable amount for assets held primarily to generate net cashinflows is measured at the higher of the present value of future cash flows expected to be obtained from the asset and fair value lesscosts to sell.
Net gain/(loss) on financial instruments
Net gain/(loss) on financial instruments includes realised and unrealised gains and losses from revaluations of financial instrumentsthat are designated at fair value through profit or loss or held-for-trading, impairment and reversal of impairment for financialinstruments at amortised cost, and disposals of financial assets.
Revaluations of financial instruments at fair value
The revaluation gain/(loss) on financial instruments at fair value excludes dividends or interest earned on financial assets, which isreported as part of income from transactions.
Other gains/(losses) from other economic flows
Other gains/(losses) from other economic flows include the gains or losses from:
transfer of amounts from the reserves and/or accumulated surplus to net result due to disposal or derecognition orreclassification; and
the revaluation of the present value of the long service leave liability due to changes in the bond interest rates.
(I) Financial instruments
Financial instruments arise out of contractual agreements that give rise to a financial asset of one entity and a financial l iability orequity instrument of another entity. Due to the nature of the Trust’s activities, certain financial assets and financial liabilities ariseunder statute rather than a contract. Such financial assets and financial liabilities do not meet the definition of financial instrumentsin AASB 132 Financial Instruments: Presentation. For example, statutory receivables arising from taxes, fines and penalties do notmeet the definition of financial instruments as they do not arise under contract.
Where relevant, for note disclosure purposes, a distinction is made between those financial assets and financial liabilities that meetthe definition of financial instruments in accordance with AASB 132 and those that do not.
The following refers to financial instruments unless otherwise stated.
Categories of non-derivative financial instrumentsLoans and receivables
Loans and receivables are financial instrument assets with fixed and determinable payments that are not quoted on an active market.These assets are initially recognised at fair value plus any directly attributable transaction costs. Subsequent to initial measurement,loans and receivables are measured at amortised cost using the effective interest method, less any impairment.
Loans and receivables category includes cash and deposits (refer to Note 1(J)), term deposits with maturity greater than threemonths, trade receivables, loans and other receivables, but not statutory receivables.
Financial assets and liabilities at fair value through profit and loss
Financial assets are categorised as fair value through profit or loss at trade date if they are classified as held for trading or designatedas such upon initial recognition. Financial instrument assets are designated at fair value through profit or loss on the basis that thefinancial assets form part of a group of financial assets that are managed by the entity concerned based on their fair values, andhave their performance evaluated in accordance with documented risk management and investment strategies.
Financial instruments at fair value through profit or loss are initially measured at fair value and attributable transaction costs areexpensed as incurred. Subsequently, any changes in fair value are recognised in the net result as other economic flows. Any dividendor interest on a financial asset is recognised in the net result from transactions.
Financial assets and liabilities at fair value through profit or loss include the majority of the Trust’s equity investments and managedinvestment schemes.
Financial liabilities at amortised cost
Financial instrument liabilities are initially recognised on the date they are originated. They are initially measured at fair value plusany directly attributable transaction costs. Subsequent to initial recognition, these financial instruments are measured at amortisedcost with any difference between the initial recognised amount and the redemption value being recognised in profit and loss over theperiod of the interest-bearing liability, using the effective interest rate method (refer to Note 28).
www.trustfornature.org.au48
Page 14
Note 1 Summary of significant accounting policies (continued)
Conservation, covenant and stewardship programs expense
Conservation, covenant and stewardship programs expense generally represent costs incurred in connection with the Trust’s regionalconservation service delivery and include payments to suppliers of fencing and revegetation services, landowner incentive programs,payments to grant project partners and contributions to property acquired by the Crown.
Conservation, covenant and stewardship programs expenses are recognised in the period in which they are incurred, including,where income is received for the purpose, provision for future stewardship, which is recognised at the time a new covenant is securedand the stewardship obligation commences.
Interest expense
Interest expense represents costs incurred in connection with interest bearing liabilities.
Interest expenses are recognised in the period in which they are incurred. Refer to Note 28 for an explanation of interest expenseitems.
Other operating expenses
Other operating expenses generally represent the day to day running costs incurred in normal operations and include:
Supplies and services
Supplies and services expenses are recognised as an expense in the reporting period in which they are incurred.
(H) Other economic flows included in net result
Other economic flows measure the change in volume or value of assets or liabilities that does not result from transactions. Theseinclude:
Net gain/(loss) on non-financial assets
Net gain/(loss) on non-financial assets and liabilities includes realised and unrealised gains and losses as follows:
Revaluation gains/(losses) of non-financial physical assets
Refer to Note 1(K) Revaluations of non-financial physical assets.
Net gain/(loss) on disposal of non-financial assets
Any gain or loss on the sale of non-financial assets is recognised at the date of disposal and is determined after deducting from theproceeds the carrying value of the asset at the time.
Amortisation of non-produced intangible assets (refer Note 1(K)).
Intangible non-produced assets with finite lives are amortised as an other economic flow on a systematic (typically straight-line) basisover the asset’s useful life. Amortisation begins when the asset is available for use, that is, when it is in the location and conditionnecessary for it to be capable of operating in the manner intended by management.
Impairment of non-financial assets
All assets are assessed annually for indications of impairment except for:
financial assets (refer Note 1(J));
non-financial physical assets held for sale (refer Note 1(K));
If there is an indication of impairment, the assets concerned are tested as to whether their carrying value exceeds their possiblerecoverable amount. Where an asset’s carrying value exceeds its recoverable amount, the difference is written off as an othereconomic flow, except to the extent that the write-down can be debited to an asset revaluation reserve amount applicable to thatclass of asset.
If there is an indication that there has been a reversal in the estimate of an asset’s recoverable amount since the last impairmentloss was recognised, the carrying amount shall be increased to its recoverable amount. The impairment loss is reversed only to theextent that the asset’s carrying amount does not exceed the carrying amount that would have been determined, net of depreciationor amortisation, if no impairment loss had been recognised in prior years.
Page 15
Note 1 Summary of significant accounting policies (continued)
It is deemed that, in the event of the loss of an asset, the future economic benefits arising from the use of the asset will be replacedunless a specific decision to the contrary has been made. The recoverable amount for most assets is measured at the higher ofdepreciated replacement cost and fair value less costs to sell. Recoverable amount for assets held primarily to generate net cashinflows is measured at the higher of the present value of future cash flows expected to be obtained from the asset and fair value lesscosts to sell.
Net gain/(loss) on financial instruments
Net gain/(loss) on financial instruments includes realised and unrealised gains and losses from revaluations of financial instrumentsthat are designated at fair value through profit or loss or held-for-trading, impairment and reversal of impairment for financialinstruments at amortised cost, and disposals of financial assets.
Revaluations of financial instruments at fair value
The revaluation gain/(loss) on financial instruments at fair value excludes dividends or interest earned on financial assets, which isreported as part of income from transactions.
Other gains/(losses) from other economic flows
Other gains/(losses) from other economic flows include the gains or losses from:
transfer of amounts from the reserves and/or accumulated surplus to net result due to disposal or derecognition orreclassification; and
the revaluation of the present value of the long service leave liability due to changes in the bond interest rates.
(I) Financial instruments
Financial instruments arise out of contractual agreements that give rise to a financial asset of one entity and a financial l iability orequity instrument of another entity. Due to the nature of the Trust’s activities, certain financial assets and financial liabilities ariseunder statute rather than a contract. Such financial assets and financial liabilities do not meet the definition of financial instrumentsin AASB 132 Financial Instruments: Presentation. For example, statutory receivables arising from taxes, fines and penalties do notmeet the definition of financial instruments as they do not arise under contract.
Where relevant, for note disclosure purposes, a distinction is made between those financial assets and financial liabilities that meetthe definition of financial instruments in accordance with AASB 132 and those that do not.
The following refers to financial instruments unless otherwise stated.
Categories of non-derivative financial instrumentsLoans and receivables
Loans and receivables are financial instrument assets with fixed and determinable payments that are not quoted on an active market.These assets are initially recognised at fair value plus any directly attributable transaction costs. Subsequent to initial measurement,loans and receivables are measured at amortised cost using the effective interest method, less any impairment.
Loans and receivables category includes cash and deposits (refer to Note 1(J)), term deposits with maturity greater than threemonths, trade receivables, loans and other receivables, but not statutory receivables.
Financial assets and liabilities at fair value through profit and loss
Financial assets are categorised as fair value through profit or loss at trade date if they are classified as held for trading or designatedas such upon initial recognition. Financial instrument assets are designated at fair value through profit or loss on the basis that thefinancial assets form part of a group of financial assets that are managed by the entity concerned based on their fair values, andhave their performance evaluated in accordance with documented risk management and investment strategies.
Financial instruments at fair value through profit or loss are initially measured at fair value and attributable transaction costs areexpensed as incurred. Subsequently, any changes in fair value are recognised in the net result as other economic flows. Any dividendor interest on a financial asset is recognised in the net result from transactions.
Financial assets and liabilities at fair value through profit or loss include the majority of the Trust’s equity investments and managedinvestment schemes.
Financial liabilities at amortised cost
Financial instrument liabilities are initially recognised on the date they are originated. They are initially measured at fair value plusany directly attributable transaction costs. Subsequent to initial recognition, these financial instruments are measured at amortisedcost with any difference between the initial recognised amount and the redemption value being recognised in profit and loss over theperiod of the interest-bearing liability, using the effective interest rate method (refer to Note 28).
Trust for Nature Annual Report 2017-18 49

Page 16
Note 1 Summary of significant accounting policies (continued)
Financial instrument liabilities measured at amortised cost include all of the Trust’s contractual payables and interest-bearingarrangements other than those designated at fair value through profit or loss.
(J) Financial assets
Cash and deposits
Cash and deposits recognised on the balance sheet comprise cash on hand and cash at bank, deposits at call and those highlyliquid investments (with an original maturity of three months or less), which are held for the purpose of meeting short term cashcommitments rather than for investment purposes, and readily convertible to known amounts of cash with an insignificant risk ofchanges in value.
For cash flow statement presentation purposes, cash and cash equivalents which are included as borrowings on the balance sheet.
Receivables
Receivables consist predominantly of debtors in relation to goods and services, accrued investment income and GST input tax creditsrecoverable.
Receivables are recognised initially at fair value plus any directly attributable transaction costs and subsequently measured atamortised cost, using the effective interest rate method, less any accumulated impairment.
A provision for doubtful receivables is made when there is objective evidence that the debts may not be collected and bad debts arewritten off when identified.
Investments and other financial assets
Investments are recognised and de-recognised on trade date where purchase or sale of an investment is under a contract whoseterms require delivery of the investment within the timeframe established by the market concerned, and are initially measured at fairvalue, net of transaction costs.
The Trust classifies its other investments into the following categories: financial assets at fair value through profit or loss; and loansand receivables. The classification depends on the purpose for which the investments were acquired. Management determines theclassification of its investments at initial recognition.
Any dividend or interest on a financial asset is recognised in the comprehensive operating statement as a transaction.
Impairment of financial assetsThe Trust assesses at the end of each reporting period whether there is objective evidence that a financial asset or group of financialassets is impaired. All financial assets, except those measured at fair value through profit or loss, are subject to annual review forimpairment.
Receivables are assessed for bad and doubtful debts are assessed on a regular basis. Those bad debts considered as written offby mutual consent are classified as a transaction expense. The allowance for doubtful receivables and bad debts not written off bymutual consent are adjusted as ‘other economic flows’ in the net result.
(K) Non-financial assets
Non-financial physical assets classified as held for sale, including disposal group assets
Non-financial physical assets (including disposal group assets) are treated as current and classified as held for sale if their carryingamount will be recovered through a sale transaction rather than through continuing use.
This condition is regarded as met only when:
the asset is available for immediate use in the current condition; and
the sale is highly probable and the asset’s sale is expected to be completed in 12 months from the date of classification.
These non-financial physical assets, related liabilities and financial assets are measured at the lower of carrying amount andfair value less costs of disposal, and are not subject to depreciation or amortisation.
Page 17
Note 1 Summary of significant accounting policies (continued)
Property, plant and equipment
All non-current physical assets are measured initially at cost and subsequently revalued at fair value less accumulated depreciationand impairment. Where an asset is acquired for no or nominal cost, the cost is its fair value at the date of acquisition. More detailsabout the valuation techniques and inputs used in determining the fair value of non-financial physical assets are discussed in Note9 Property, plant and equipment.
The initial cost for non-financial physical assets under a finance lease (refer to Note 1(M)) is measured at amounts equal to the fairvalue of the leased asset or, if lower, the present value of the minimum lease payments, each determined at the inception of thelease.
Non-financial physical assets such as land and buildings are measured at fair value with regard to the property’s highest and bestuse after due consideration is made for any legal or physical restrictions imposed on the asset, public announcements orcommitments made in relation to the intended use of the asset. Theoretical opportunities that may be available in relation to the assetare not taken into account until it is virtually certain that the restrictions will no longer apply. Therefore, unless otherwise disclosed,the current use of these non-financial physical assets will be their highest and best uses.
The fair value of infrastructure systems and plant, equipment and vehicles, is normally determined by reference to the asset’sdepreciated replacement cost, or where the infrastructure is held by a for-profit entity, the fair value may be derived from estimatesof the present value of future cash flows.
For the accounting policy on impairment of non-financial physical assets, refer to impairment of non-financial assets under Note 1(H)Impairment of non-financial assets.
Leasehold improvements
The cost of leasehold improvements is capitalised as an asset and depreciated over the shorter of the remaining term of the leaseor the estimated useful life of the improvements.
Restrictive nature of land assets
During the reporting period, the Trust holds land assets that the Trust intends to preserve because of their environmental attributes.
In general, the fair value of those assets is measured at the depreciated replacement cost. In addition, as there are limitat ions andrestrictions imposed on those assets use and/or disposal, they may impact the fair value of those assets, and should be taken intoaccount when the fair value is determined.
Revaluations of non-current physical assets
Non-current physical assets are measured at fair value on a cyclical basis, in accordance with FRD 103F issued by the Minister forFinance. A full revaluation normally occurs every five years, based on the asset’s government purpose classification, but may occurmore frequently if fair value assessments indicate material changes in values. Independent valuers are used to conduct thesescheduled revaluations and any interim revaluations are determined in accordance with the requirements of the FRDs.
Revaluation increases or decreases arise from differences between an asset’s carrying value and fair value.
Net revaluation increases (where the carrying amount of a class of assets is increased as a result of a revaluation) are recognisedin ‘other economic flows – other comprehensive income’, and accumulated in equity under the asset revaluation surplus, except thatthe net revaluation increase shall be recognised in the net result to the extent that it reverses a net revaluation decrease in respectof the same class of property, plant and equipment previously recognised as an expense (other economic flows) in the net result.
Net revaluation decreases are recognised in ‘other economic flows – other comprehensive income’ to the extent that a credit balanceexists in the asset revaluation surplus in respect of the same class of property, plant and equipment. Otherwise, the net revaluationdecreases are recognised are recognised immediately as other economic flows in the net result. The net revaluation decreaserecognised in ‘other economic flows – other comprehensive income’ reduces the amount accumulated in equity under assetrevaluation surplus.
Revaluation increases and decreases relating to individual assets within a class of property, plant and equipment, are offset againstone another within that class but are not offset in respect of assets in different classes. Any revaluation surplus is not normallytransferred to accumulated funds on de-recognition of the relevant asset.
Intangible assets
Intangible assets are initially recognised at cost. Subsequently, intangible assets with finite useful lives are carried at cost lessaccumulated depreciation/amortisation and accumulated impairment losses. Costs incurred subsequent to initial acquisition arecapitalised when it is expected that additional future economic benefits will flow to the Trust.
Refer to Note 1(G) Depreciation and amortisation and Note 1(H) Impairment of non-financial assets.
www.trustfornature.org.au50
Page 16
Note 1 Summary of significant accounting policies (continued)
Financial instrument liabilities measured at amortised cost include all of the Trust’s contractual payables and interest-bearingarrangements other than those designated at fair value through profit or loss.
(J) Financial assets
Cash and deposits
Cash and deposits recognised on the balance sheet comprise cash on hand and cash at bank, deposits at call and those highlyliquid investments (with an original maturity of three months or less), which are held for the purpose of meeting short term cashcommitments rather than for investment purposes, and readily convertible to known amounts of cash with an insignificant risk ofchanges in value.
For cash flow statement presentation purposes, cash and cash equivalents which are included as borrowings on the balance sheet.
Receivables
Receivables consist predominantly of debtors in relation to goods and services, accrued investment income and GST input tax creditsrecoverable.
Receivables are recognised initially at fair value plus any directly attributable transaction costs and subsequently measured atamortised cost, using the effective interest rate method, less any accumulated impairment.
A provision for doubtful receivables is made when there is objective evidence that the debts may not be collected and bad debts arewritten off when identified.
Investments and other financial assets
Investments are recognised and de-recognised on trade date where purchase or sale of an investment is under a contract whoseterms require delivery of the investment within the timeframe established by the market concerned, and are initially measured at fairvalue, net of transaction costs.
The Trust classifies its other investments into the following categories: financial assets at fair value through profit or loss; and loansand receivables. The classification depends on the purpose for which the investments were acquired. Management determines theclassification of its investments at initial recognition.
Any dividend or interest on a financial asset is recognised in the comprehensive operating statement as a transaction.
Impairment of financial assetsThe Trust assesses at the end of each reporting period whether there is objective evidence that a financial asset or group of financialassets is impaired. All financial assets, except those measured at fair value through profit or loss, are subject to annual review forimpairment.
Receivables are assessed for bad and doubtful debts are assessed on a regular basis. Those bad debts considered as written offby mutual consent are classified as a transaction expense. The allowance for doubtful receivables and bad debts not written off bymutual consent are adjusted as ‘other economic flows’ in the net result.
(K) Non-financial assets
Non-financial physical assets classified as held for sale, including disposal group assets
Non-financial physical assets (including disposal group assets) are treated as current and classified as held for sale if their carryingamount will be recovered through a sale transaction rather than through continuing use.
This condition is regarded as met only when:
the asset is available for immediate use in the current condition; and
the sale is highly probable and the asset’s sale is expected to be completed in 12 months from the date of classification.
These non-financial physical assets, related liabilities and financial assets are measured at the lower of carrying amount andfair value less costs of disposal, and are not subject to depreciation or amortisation.
Page 17
Note 1 Summary of significant accounting policies (continued)
Property, plant and equipment
All non-current physical assets are measured initially at cost and subsequently revalued at fair value less accumulated depreciationand impairment. Where an asset is acquired for no or nominal cost, the cost is its fair value at the date of acquisition. More detailsabout the valuation techniques and inputs used in determining the fair value of non-financial physical assets are discussed in Note9 Property, plant and equipment.
The initial cost for non-financial physical assets under a finance lease (refer to Note 1(M)) is measured at amounts equal to the fairvalue of the leased asset or, if lower, the present value of the minimum lease payments, each determined at the inception of thelease.
Non-financial physical assets such as land and buildings are measured at fair value with regard to the property’s highest and bestuse after due consideration is made for any legal or physical restrictions imposed on the asset, public announcements orcommitments made in relation to the intended use of the asset. Theoretical opportunities that may be available in relation to the assetare not taken into account until it is virtually certain that the restrictions will no longer apply. Therefore, unless otherwise disclosed,the current use of these non-financial physical assets will be their highest and best uses.
The fair value of infrastructure systems and plant, equipment and vehicles, is normally determined by reference to the asset’sdepreciated replacement cost, or where the infrastructure is held by a for-profit entity, the fair value may be derived from estimatesof the present value of future cash flows.
For the accounting policy on impairment of non-financial physical assets, refer to impairment of non-financial assets under Note 1(H)Impairment of non-financial assets.
Leasehold improvements
The cost of leasehold improvements is capitalised as an asset and depreciated over the shorter of the remaining term of the leaseor the estimated useful life of the improvements.
Restrictive nature of land assets
During the reporting period, the Trust holds land assets that the Trust intends to preserve because of their environmental attributes.
In general, the fair value of those assets is measured at the depreciated replacement cost. In addition, as there are limitat ions andrestrictions imposed on those assets use and/or disposal, they may impact the fair value of those assets, and should be taken intoaccount when the fair value is determined.
Revaluations of non-current physical assets
Non-current physical assets are measured at fair value on a cyclical basis, in accordance with FRD 103F issued by the Minister forFinance. A full revaluation normally occurs every five years, based on the asset’s government purpose classification, but may occurmore frequently if fair value assessments indicate material changes in values. Independent valuers are used to conduct thesescheduled revaluations and any interim revaluations are determined in accordance with the requirements of the FRDs.
Revaluation increases or decreases arise from differences between an asset’s carrying value and fair value.
Net revaluation increases (where the carrying amount of a class of assets is increased as a result of a revaluation) are recognisedin ‘other economic flows – other comprehensive income’, and accumulated in equity under the asset revaluation surplus, except thatthe net revaluation increase shall be recognised in the net result to the extent that it reverses a net revaluation decrease in respectof the same class of property, plant and equipment previously recognised as an expense (other economic flows) in the net result.
Net revaluation decreases are recognised in ‘other economic flows – other comprehensive income’ to the extent that a credit balanceexists in the asset revaluation surplus in respect of the same class of property, plant and equipment. Otherwise, the net revaluationdecreases are recognised are recognised immediately as other economic flows in the net result. The net revaluation decreaserecognised in ‘other economic flows – other comprehensive income’ reduces the amount accumulated in equity under assetrevaluation surplus.
Revaluation increases and decreases relating to individual assets within a class of property, plant and equipment, are offset againstone another within that class but are not offset in respect of assets in different classes. Any revaluation surplus is not normallytransferred to accumulated funds on de-recognition of the relevant asset.
Intangible assets
Intangible assets are initially recognised at cost. Subsequently, intangible assets with finite useful lives are carried at cost lessaccumulated depreciation/amortisation and accumulated impairment losses. Costs incurred subsequent to initial acquisition arecapitalised when it is expected that additional future economic benefits will flow to the Trust.
Refer to Note 1(G) Depreciation and amortisation and Note 1(H) Impairment of non-financial assets.
Trust for Nature Annual Report 2017-18 51

Page 18
Note 1 Summary of significant accounting policies (continued)
(L) Liabilities
Payables
Payables consist predominantly of accounts payable, accrued wages and salaries, and other sundry liabilities. Accounts payablerepresent liabilities for goods and services provided to the Trust prior to the end of the financial year that are unpaid, and arise whenthe Trust becomes obliged to make future payments in respect of the purchase of those goods and services, and accrued interestincome payable on funds held on behalf of third party landowners under offset arrangements.
Other liabilities included in payables mainly consist of unearned/prepaid income, goods and services tax and fringe benefits taxpayables.
Payables are initially recognised at fair value, being the cost of the goods and services, and subsequently measured at amortisedcost.
Payables are classified as financial instruments and categorised as financial liabilities at amortised cost (refer to Note 1(I)). Statutorypayables are recognised and measured similarly to contractual payables, but are not classified as financial instruments and notincluded in the category of financial liabilities at amortised cost, because they do not arise from a contract.
Borrowings
All interest bearing liabilities are initially measured at fair value of the consideration received, less directly attributable transactioncosts (refer to Note 1(M) Leases). Subsequent to initial recognition, borrowings are measured at amortised cost with any differencebetween the initial recognised amount and the redemption value being recognised in net result over the period of the borrowing usingthe effective interest method.
The above classification depends on the nature and purpose of the interest bearing liabilities. The Trust determines the classificationof its interest bearing liabilities at initial recognition.
Provisions
Provisions are recognised when the Trust has a present obligation, the future sacrifice of economic benefits is probable, and theamount of the provision can be measured reliably.
The amount recognised as a provision is the best estimate of the consideration required to settle the present obligation at reportingdate, taking into account the risks and uncertainties surrounding the obligation. Where a provision is measured using the cashflowsestimated to settle the present obligation, its carrying amount is the present value of those cashflows, using a discount rate thatreflects the time value of money and risks specific to the provision.
When some or all of the economic benefits required to settle a provision are expected to be received from a third party, the receivableis recognised as an asset if it is virtually certain that recovery will be received and the amount of the receivable can be measuredreliably.
Employee benefits
Provision is made for benefits accruing to employees in respect of annual leave and long service leave for services rendered to thereporting date.
(i) Annual leave
Liabilities for annual leave are recognised in the provision for employee benefits as ‘current liabilities’ because the Trust does nothave an unconditional right to defer settlements of these liabilities.
Depending on the expectation of the timing of settlement, liabilities for wages and salaries and annual leave are measured at:
undiscounted value – if the Trust expects to wholly settle within 12 months; or Present value – if the Trust does not expect to wholly settle within 12 months.
(ii) Long service leave
Liability for long service leave (LSL) is recognised in the provision for employee benefits.
Unconditional LSL is disclosed in the notes to the financial statements as a current liability even where the Trust does not expect tosettle the liability within 12 months because it will not have the unconditional right to defer the settlement of the entitlement shouldan employee take leave within 12 months.
Page 19
Note 1 Summary of significant accounting policies (continued)
The components of this current LSL liability are measured at:
undiscounted value – if the Trust expects to wholly settle within 12 months; and present value - if the Trust does not expect to wholly settle within 12 months.
Conditional LSL is disclosed as a non-current liability. There is an unconditional right to defer the settlement of the entitlement untilthe employee has completed the requisite years of service. This non-current LSL liability is measured at present value.
Any gain or loss following revaluation of the present value of non-current LSL liability is recognised as a transaction, except to theextent that a gain or loss arises due to changes in bond interest rates for which it is then recognised in the net result as an othereconomic flow (refer to Note 1(G)).
(iii) Termination benefits
Termination benefits are payable when employment is terminated before the normal retirement date, or when an employee acceptsvoluntary redundancy in exchange for these benefits. The Trust recognises termination benefits when it is demonstrably committedto either terminating the employment of current employees according to a detailed formal plan without possibil ity of withdrawal orproviding termination benefits as a result of an offer made to encourage voluntary redundancy. Benefits falling due more than 12months after balance sheet date are discounted to present value.
On-costs
Provisions for on-costs such as workers compensation and superannuation are recognised separately from provision for employeebenefits.
(M) Leases
A lease is a right to use an asset for an agreed period of time in exchange for payment.
Leases are classified at their inception as either operating or finance leases based on the economic substance of the agreement soas to reflect the risks and rewards incidental to ownership. Leases of property, plant and equipment are classified as finance leaseswhenever the terms of the lease transfer substantially all the risks and rewards of ownership from the lessor to the lessee. All otherleases are classified as operating leases.
Finance leases (the Trust as lessee)
At the commencement of the lease term, finance leases are initially recognised as assets and liabilities at amounts equal to the fairvalue of the lease property or, if lower, the present value of the minimum lease payment, each determined at the inception of thelease. The lease asset is accounted for as a non-financial physical asset. If there is certainty that the Trust will obtain the ownershipof the lease asset by the end of the lease term, the asset shall be depreciated over the useful life of the asset. If there is no reasonablecertainty that the lessee will obtain ownership by the end of the lease term, the asset shall be fully depreciated over the shorter ofthe lease term and its useful life.
Minimum finance lease payments are apportioned between reduction of the outstanding lease liability, and periodic finance expensewhich is calculated using the interest rate implicit in the lease and charged directly to the comprehensive operating statement.Contingent rentals associated with finance leases are recognised as an expense in the period in which they are incurred.
Operating leases (the Trust as lessee)
Operating lease payments, including any contingent rentals, are recognised as an expense in the comprehensive operatingstatement on a straight-line basis over the lease term, except where another systematic basis is more representative of the timepattern of the benefits derived from the use of the leased asset. The leased asset is not recognised in the balance sheet.
All incentives for the agreement of a new or renewed operating lease are recognised as an integral part of the net considerationagreed for the use of the leased asset, irrespective of the incentive’s nature or form or the timing of payments.
In the event that lease incentives are received to enter into operating leases, the aggregate cost of incentives are recognised as areduction of rental expense over the lease term on a straight-line basis, unless another systematic basis is more representative ofthe time pattern in which economic benefits from the leased asset are consumed.
www.trustfornature.org.au52

Page 18
Note 1 Summary of significant accounting policies (continued)
(L) Liabilities
Payables
Payables consist predominantly of accounts payable, accrued wages and salaries, and other sundry liabilities. Accounts payablerepresent liabilities for goods and services provided to the Trust prior to the end of the financial year that are unpaid, and arise whenthe Trust becomes obliged to make future payments in respect of the purchase of those goods and services, and accrued interestincome payable on funds held on behalf of third party landowners under offset arrangements.
Other liabilities included in payables mainly consist of unearned/prepaid income, goods and services tax and fringe benefits taxpayables.
Payables are initially recognised at fair value, being the cost of the goods and services, and subsequently measured at amortisedcost.
Payables are classified as financial instruments and categorised as financial liabilities at amortised cost (refer to Note 1(I)). Statutorypayables are recognised and measured similarly to contractual payables, but are not classified as financial instruments and notincluded in the category of financial liabilities at amortised cost, because they do not arise from a contract.
Borrowings
All interest bearing liabilities are initially measured at fair value of the consideration received, less directly attributable transactioncosts (refer to Note 1(M) Leases). Subsequent to initial recognition, borrowings are measured at amortised cost with any differencebetween the initial recognised amount and the redemption value being recognised in net result over the period of the borrowing usingthe effective interest method.
The above classification depends on the nature and purpose of the interest bearing liabilities. The Trust determines the classificationof its interest bearing liabilities at initial recognition.
Provisions
Provisions are recognised when the Trust has a present obligation, the future sacrifice of economic benefits is probable, and theamount of the provision can be measured reliably.
The amount recognised as a provision is the best estimate of the consideration required to settle the present obligation at reportingdate, taking into account the risks and uncertainties surrounding the obligation. Where a provision is measured using the cashflowsestimated to settle the present obligation, its carrying amount is the present value of those cashflows, using a discount rate thatreflects the time value of money and risks specific to the provision.
When some or all of the economic benefits required to settle a provision are expected to be received from a third party, the receivableis recognised as an asset if it is virtually certain that recovery will be received and the amount of the receivable can be measuredreliably.
Employee benefits
Provision is made for benefits accruing to employees in respect of annual leave and long service leave for services rendered to thereporting date.
(i) Annual leave
Liabilities for annual leave are recognised in the provision for employee benefits as ‘current liabilities’ because the Trust does nothave an unconditional right to defer settlements of these liabilities.
Depending on the expectation of the timing of settlement, liabilities for wages and salaries and annual leave are measured at:
undiscounted value – if the Trust expects to wholly settle within 12 months; or Present value – if the Trust does not expect to wholly settle within 12 months.
(ii) Long service leave
Liability for long service leave (LSL) is recognised in the provision for employee benefits.
Unconditional LSL is disclosed in the notes to the financial statements as a current liability even where the Trust does not expect tosettle the liability within 12 months because it will not have the unconditional right to defer the settlement of the entitlement shouldan employee take leave within 12 months.
Page 19
Note 1 Summary of significant accounting policies (continued)
The components of this current LSL liability are measured at:
undiscounted value – if the Trust expects to wholly settle within 12 months; and present value - if the Trust does not expect to wholly settle within 12 months.
Conditional LSL is disclosed as a non-current liability. There is an unconditional right to defer the settlement of the entitlement untilthe employee has completed the requisite years of service. This non-current LSL liability is measured at present value.
Any gain or loss following revaluation of the present value of non-current LSL liability is recognised as a transaction, except to theextent that a gain or loss arises due to changes in bond interest rates for which it is then recognised in the net result as an othereconomic flow (refer to Note 1(G)).
(iii) Termination benefits
Termination benefits are payable when employment is terminated before the normal retirement date, or when an employee acceptsvoluntary redundancy in exchange for these benefits. The Trust recognises termination benefits when it is demonstrably committedto either terminating the employment of current employees according to a detailed formal plan without possibil ity of withdrawal orproviding termination benefits as a result of an offer made to encourage voluntary redundancy. Benefits falling due more than 12months after balance sheet date are discounted to present value.
On-costs
Provisions for on-costs such as workers compensation and superannuation are recognised separately from provision for employeebenefits.
(M) Leases
A lease is a right to use an asset for an agreed period of time in exchange for payment.
Leases are classified at their inception as either operating or finance leases based on the economic substance of the agreement soas to reflect the risks and rewards incidental to ownership. Leases of property, plant and equipment are classified as finance leaseswhenever the terms of the lease transfer substantially all the risks and rewards of ownership from the lessor to the lessee. All otherleases are classified as operating leases.
Finance leases (the Trust as lessee)
At the commencement of the lease term, finance leases are initially recognised as assets and liabilities at amounts equal to the fairvalue of the lease property or, if lower, the present value of the minimum lease payment, each determined at the inception of thelease. The lease asset is accounted for as a non-financial physical asset. If there is certainty that the Trust will obtain the ownershipof the lease asset by the end of the lease term, the asset shall be depreciated over the useful life of the asset. If there is no reasonablecertainty that the lessee will obtain ownership by the end of the lease term, the asset shall be fully depreciated over the shorter ofthe lease term and its useful life.
Minimum finance lease payments are apportioned between reduction of the outstanding lease liability, and periodic finance expensewhich is calculated using the interest rate implicit in the lease and charged directly to the comprehensive operating statement.Contingent rentals associated with finance leases are recognised as an expense in the period in which they are incurred.
Operating leases (the Trust as lessee)
Operating lease payments, including any contingent rentals, are recognised as an expense in the comprehensive operatingstatement on a straight-line basis over the lease term, except where another systematic basis is more representative of the timepattern of the benefits derived from the use of the leased asset. The leased asset is not recognised in the balance sheet.
All incentives for the agreement of a new or renewed operating lease are recognised as an integral part of the net considerationagreed for the use of the leased asset, irrespective of the incentive’s nature or form or the timing of payments.
In the event that lease incentives are received to enter into operating leases, the aggregate cost of incentives are recognised as areduction of rental expense over the lease term on a straight-line basis, unless another systematic basis is more representative ofthe time pattern in which economic benefits from the leased asset are consumed.
Trust for Nature Annual Report 2017-18 53
Page 20
Note 1 Summary of significant accounting policies (continued)
(N) Equity
Contributions by owners
Consistent with the requirements of AASB 1004 Contributions, contributions by owners (that is, contributed capital and its repayment)are treated as equity transactions and, therefore, do not form part of the income and expenses of the Trust.
Additions to net assets which have been designated as contributions by owners are recognised as contributed capital. Other transfersthat are in the nature of contributions to or distributions by owners have also been designated as contributions by owners.
Transfers of net assets arising from administrative restructurings are treated as distributions to or contributions by owners. Transfersof net liabilities arising from administrative restructurings are treated as distributions to owners.
(O) CommitmentsCommitments for future expenditure include operating and capital commitments arising from contracts. These commitments aredisclosed by way of a note (refer to Note 16 Commitments for expenditure) at their nominal value and inclusive of the GST payable.
(P) Contingent assets and contingent liabilities
Contingent assets and contingent liabilities are not recognised in the balance sheet, but are disclosed by way of a note (refer to Note17 Contingent assets and contingent liabilities) and, if quantifiable, are measured at nominal value. Contingent assets and liabilitiesare presented inclusive of GST receivable or payable respectively.
(Q) Rounding of amounts
Amounts in the financial statements have been rounded to the nearest dollar.
(R) Tax status
As a State Government body corporate, the Trust is exempt from income tax.
(S) Allocation between current and non-current
In the determination of whether an asset other than cash and cash equivalents is current, consideration is given as to whether theTrust expects to realise or consume the asset within the twelve months after the reporting date. All cash, cash equivalents andproperty held for re-sale are deemed current. All other assets are recognised as non-current.
Current liabilities are recognised when the liability is due to be settled within the twelve months after reporting date or the Trust doesnot have an unconditional right to defer settlement of the liability for at least twelve months after the reporting date.
(T) Goods and Services Tax (GST)
Income, expenses and assets are recognised net of the amount of associated GST, unless the GST incurred is not recoverable fromthe taxation authority. In this case it is recognised as part of the cost of acquisition of the asset or as part of the expense.
Receivables and payables are stated inclusive of the amount of GST receivable or payable. The net amount of GST recoverablefrom, or payable to, the taxation authority is included with other receivables or payables in the balance sheet.
Cash flows are presented on a gross basis. The GST components of cash flows arising from investing or financing activities whichare recoverable from, or payable to the taxation authority, are presented as operating cash flow.
Commitments and contingent assets or liabilities are also stated inclusive of GST (refer to Note 1(O) and Note 1(P).
www.trustfornature.org.au54

Page 21
Note 1 Summary of significant accounting policies (continued)
(U) Australian Accounting Standards (AAS) issued that are not yet effective
The table below outlines the accounting pronouncements that have been issued but not yet effective for 2017-18, which may resultin potential impacts on the Trust’s reporting for future periods.
Standard/Interpretation 1 Summary
Applicablefor annualreportingperiodsbeginning on
Impact on public sector entityfinancial statements
AASB 9 FinancialInstruments
The key changes include the simplifiedrequirements for the classification andmeasurement of financial assets, a newhedging accounting model and a revisedimpairment loss model to recogniseimpairment losses earlier, as opposed tothe current approach that recognisesimpairment only when incurred.
1 Jan 2018 The assessment has identified that theamendments are likely to result inearlier recognition of impairment lossesand at more regular intervals.While there will be no significant impactarising from AASB 9, there will be achange to the way financial instrumentsare disclosed.
AASB 2010-7Amendments toAustralian AccountingStandards arising fromAASB 9 (December 2010)
The requirements for classifying andmeasuring financial liabilities were addedto AASB 9. The existing requirements forthe classification of financial liabilities andthe ability to use the fair value optionhave been retained. However, where thefair value option is used for financialliabilities the change in fair value isaccounted for as follows: The change in fair value attributable
to changes in credit risk is presentedin other comprehensive income (OCI);and
Other fair value changes arepresented in profit and loss. If thisapproach creates or enlarges anaccounting mismatch in the profit orloss, the effect of the changes incredit risk are also presented in profitor loss.
1 Jan 2018 The assessment has identified that thefinancial impact of available for sale(AFS) assets will now be reportedthrough other comprehensive income(OCI) and no longer recycled to theprofit and loss.Changes in own credit risk in respect ofliabilities designated at fair valuethrough profit and loss will now bepresented within other comprehensiveincome (OCI).While the preliminary assessment hasnot identified any material impactarising from AASB 9, it will continue tobe monitored and assessed.
AASB 2014-1Amendments toAustralian AccountingStandards [Part EFinancial Instruments]
Amends various AASs to reflect theAASB’s decision to defer the mandatoryapplication date ofAASB 9 to annual reporting periodsbeginning on or after 1 January 2018 as aconsequence of Chapter 6 HedgeAccounting, and to amend reduceddisclosure requirements.
1 Jan 2018 This amending standard will defer theapplication period of AASB 9 to the2018-19 reporting period in accordancewith the transition requirements.
AASB 2014-7Amendments toAustralian AccountingStandards arising fromAASB 9
Amends various AASs to incorporate theconsequential amendments arising fromthe issuance of AASB 9.
1 Jan 2018 The assessment has indicated thatthere will be no significant impact for thepublic sector.
Trust for Nature Annual Report 2017-18 55
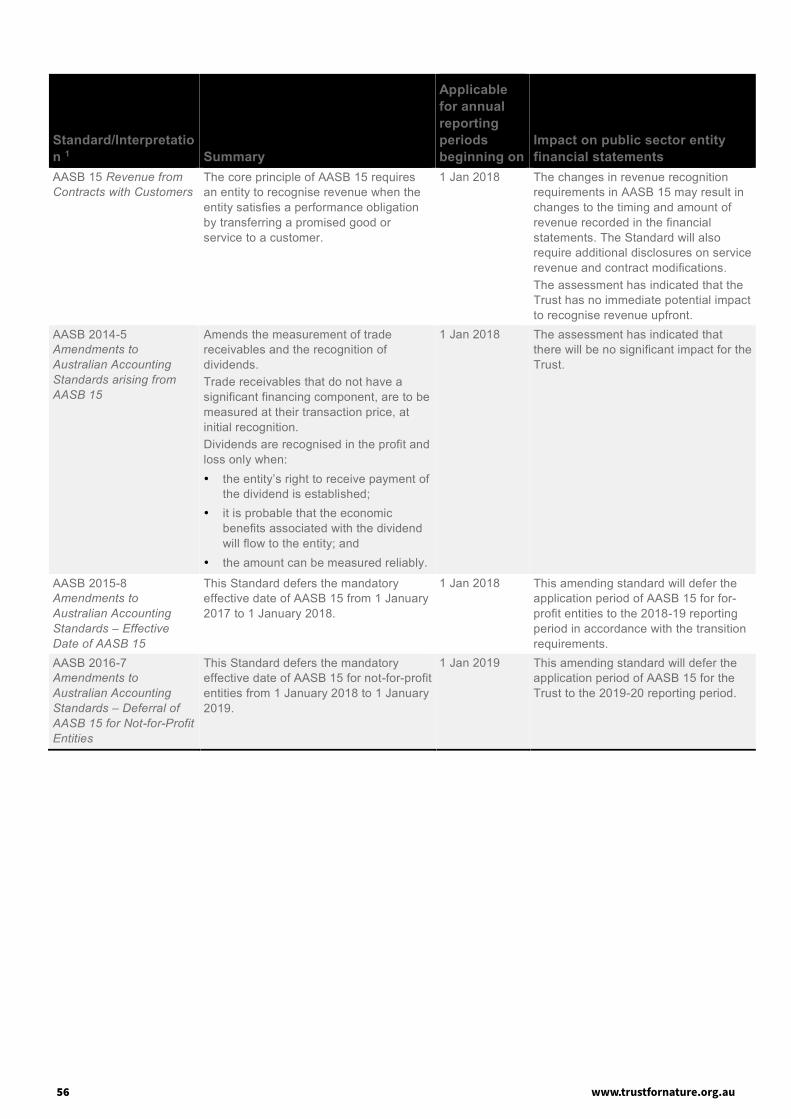
Page 22
Standard/Interpretation 1 Summary
Applicablefor annualreportingperiodsbeginning on
Impact on public sector entityfinancial statements
AASB 15 Revenue fromContracts with Customers
The core principle of AASB 15 requiresan entity to recognise revenue when theentity satisfies a performance obligationby transferring a promised good orservice to a customer.
1 Jan 2018 The changes in revenue recognitionrequirements in AASB 15 may result inchanges to the timing and amount ofrevenue recorded in the financialstatements. The Standard will alsorequire additional disclosures on servicerevenue and contract modifications.The assessment has indicated that theTrust has no immediate potential impactto recognise revenue upfront.
AASB 2014-5Amendments toAustralian AccountingStandards arising fromAASB 15
Amends the measurement of tradereceivables and the recognition ofdividends.Trade receivables that do not have asignificant financing component, are to bemeasured at their transaction price, atinitial recognition.Dividends are recognised in the profit andloss only when: the entity’s right to receive payment of
the dividend is established; it is probable that the economic
benefits associated with the dividendwill flow to the entity; and
the amount can be measured reliably.
1 Jan 2018 The assessment has indicated thatthere will be no significant impact for theTrust.
AASB 2015-8Amendments toAustralian AccountingStandards – EffectiveDate of AASB 15
This Standard defers the mandatoryeffective date of AASB 15 from 1 January2017 to 1 January 2018.
1 Jan 2018 This amending standard will defer theapplication period of AASB 15 for for-profit entities to the 2018-19 reportingperiod in accordance with the transitionrequirements.
AASB 2016-7Amendments toAustralian AccountingStandards – Deferral ofAASB 15 for Not-for-ProfitEntities
This Standard defers the mandatoryeffective date of AASB 15 for not-for-profitentities from 1 January 2018 to 1 January2019.
1 Jan 2019 This amending standard will defer theapplication period of AASB 15 for theTrust to the 2019-20 reporting period.
Page 23
Standard/Interpretation 1 Summary
Applicablefor annualreportingperiodsbeginning on
Impact on public sector entityfinancial statements
AASB 2016-8Amendments toAustralian AccountingStandards – AustralianImplementation Guidancefor Not-for-Profit Entities
AASB 2016-8 inserts Australianrequirements and authoritativeimplementation guidance for not-for-profit-entities into AASB 9 and AASB 15.This Standard amends AASB 9 andAASB 15 to include requirements toassist not-for-profit entities in applying therespective standards to particulartransactions and events.
1 Jan 2019 This standard clarifies the application ofAASB 15 and AASB 9 in a not-for-profitcontext. The areas within thesestandards that are amended for not-for-profit application include:AASB 9 Statutory receivables are
recognised and measuredsimilarly to financial assets
AASB 15 The “customer” does not need to
be the recipient of goods and/orservices;
The “contract” could include anarrangement entered into underthe direction of another party;
Contracts are enforceable if theyare enforceable by legal or“equivalent means”;
Contracts do not have to havecommercial substance, onlyeconomic substance; and
Performance obligations need tobe “sufficiently specific” to be ableto apply AASB 15 to thesetransactions.
AASB 16 Leases The key changes introduced by AASB 16include the recognition of most operatingleases (which are currently notrecognised) on balance sheet.
1 Jan 2019 The assessment has indicated thatmost operating leases, with theexception of short term and low valuelease, will come on to the balance sheetand will be recognised as right of useassets with a corresponding leaseliability.In the operating statement, theoperating lease expense will bereplaced by depreciation expense of theasset and an interest charge on leaseliabilities with marginal impact on theoperating surplus.
In addition to the new standards and amendments above, the AASB has issued a list of other amending standards that are noteffective for the 2017-18 reporting period (as listed below). In general, these amending standards include editorial and referenceschanges that are expected to have insignificant impacts on the Trust’s reporting.
AASB 2016-5 Amendments to Australian Accounting Standards – Classification and Measurements of Share-basedPayment Transactions
AASB 2016-6 Amendments to Australian Accounting Standards – Applying AASB 9 Financial Instruments with AASB 4Insurance Contracts
AASB 2017-1 Amendments to Australian Accounting Standards – Transfers of Investment Property, Annual Improvements2014-16 Cycle and Other Amendments
AASB 2017-3 Amendments to Australian Accounting Standards – Clarifications to AASB 4
www.trustfornature.org.au56

Page 23
Standard/Interpretation 1 Summary
Applicablefor annualreportingperiodsbeginning on
Impact on public sector entityfinancial statements
AASB 2016-8Amendments toAustralian AccountingStandards – AustralianImplementation Guidancefor Not-for-Profit Entities
AASB 2016-8 inserts Australianrequirements and authoritativeimplementation guidance for not-for-profit-entities into AASB 9 and AASB 15.This Standard amends AASB 9 andAASB 15 to include requirements toassist not-for-profit entities in applying therespective standards to particulartransactions and events.
1 Jan 2019 This standard clarifies the application ofAASB 15 and AASB 9 in a not-for-profitcontext. The areas within thesestandards that are amended for not-for-profit application include:AASB 9 Statutory receivables are
recognised and measuredsimilarly to financial assets
AASB 15 The “customer” does not need to
be the recipient of goods and/orservices;
The “contract” could include anarrangement entered into underthe direction of another party;
Contracts are enforceable if theyare enforceable by legal or“equivalent means”;
Contracts do not have to havecommercial substance, onlyeconomic substance; and
Performance obligations need tobe “sufficiently specific” to be ableto apply AASB 15 to thesetransactions.
AASB 16 Leases The key changes introduced by AASB 16include the recognition of most operatingleases (which are currently notrecognised) on balance sheet.
1 Jan 2019 The assessment has indicated thatmost operating leases, with theexception of short term and low valuelease, will come on to the balance sheetand will be recognised as right of useassets with a corresponding leaseliability.In the operating statement, theoperating lease expense will bereplaced by depreciation expense of theasset and an interest charge on leaseliabilities with marginal impact on theoperating surplus.
In addition to the new standards and amendments above, the AASB has issued a list of other amending standards that are noteffective for the 2017-18 reporting period (as listed below). In general, these amending standards include editorial and referenceschanges that are expected to have insignificant impacts on the Trust’s reporting.
AASB 2016-5 Amendments to Australian Accounting Standards – Classification and Measurements of Share-basedPayment Transactions
AASB 2016-6 Amendments to Australian Accounting Standards – Applying AASB 9 Financial Instruments with AASB 4Insurance Contracts
AASB 2017-1 Amendments to Australian Accounting Standards – Transfers of Investment Property, Annual Improvements2014-16 Cycle and Other Amendments
AASB 2017-3 Amendments to Australian Accounting Standards – Clarifications to AASB 4
Trust for Nature Annual Report 2017-18 57

Page 24
AASB 2017-4 Amendments to Australian Accounting Standards – Uncertainty over Income Tax Treatments AASB 2017-5 Amendments to Australian Accounting Standards – Effective Date of Amendments to AASB 10 and AASB 128
and Editorial Corrections AASB 2017-6 Amendments to Australian Accounting Standards – Prepayment Features with Negative Compensation AASB 2018-1 Amendments to Australian Accounting Standards – Annual Improvements 2015 – 2017 Cycle
Notes:
1. For the current year, given the number of consequential amendments to AASB 9 Financial Instruments and AASB 15 Revenue fromContracts with Customers, the standards/interpretations have been grouped together to provide a more relevant view of the upcoming changes.
Note 2 Income from transactions
2018 2017$ $
(a) Grant and consulting incomeState Government – Operating grant recurrent 417,000 435,000
State Government - Operating grant non-recurrent 1,050,000 1,050,000
Government grants 2,309,691 1,909,451
Government & philanthropic grants used to acquire properties (i) 500,000 219,213
Project grants and consulting – philanthropic and other parties 462,193 665,087Total grant and consulting income 4,738,884 4,278,751
(b) Interest on InvestmentsInterest on investments 315,146 332,878
468,366 521,238
Total interest on investments 783,512 854,116
(c) DividendsDividends from managed funds and equities 272,612 159,473
Total dividends 272,612 159,473
(d) DonationsGeneral donations 943,147 262,775Donations for appeals and properties(i) 365,803 373,061General bequests 4,000 212,634Other fundraising income 71,256 100,737
Total donations 1,384,206 949,207
(e) Fair value of services received free of charge or for nominal considerationLegal services 20,060 5,518
Total fair value of services received free of charge or for nominal consideration 20,060 5,518
(f) Other incomeRental and accomodation income 35,315 12,032Sale of goods and services - 155Offset program income 146,040 171,130Other 141,249 347,386
Total other income 322,604 530,703
Note:(i) From time to time Trust for Nature receives grant or donation and appeal revenue which is used to acquire properties. Such transactionsresult in an accounting profit equal to the acquisition cost which resides in the accumulated surplus (Note 21) until such time as the property issurrendered or sold.In 2017-18 one property was purchased by Trust for Nature ($497,253) with contributions from philanthropic revenue. (2016-17: one pro pertywas purchased by Trust for Nature ($69,213) and another was puchased by a partner organisation ($150,000) with contributions fromGovernment and philanthropic revenue, refer to Note 2(a), Note 2(d) and Note 9.
Interest on investments attributable to funds held awaiting remittance and landownerpayments held in trust
Page 25www.trustfornature.org.au58

Page 24
AASB 2017-4 Amendments to Australian Accounting Standards – Uncertainty over Income Tax Treatments AASB 2017-5 Amendments to Australian Accounting Standards – Effective Date of Amendments to AASB 10 and AASB 128
and Editorial Corrections AASB 2017-6 Amendments to Australian Accounting Standards – Prepayment Features with Negative Compensation AASB 2018-1 Amendments to Australian Accounting Standards – Annual Improvements 2015 – 2017 Cycle
Notes:
1. For the current year, given the number of consequential amendments to AASB 9 Financial Instruments and AASB 15 Revenue fromContracts with Customers, the standards/interpretations have been grouped together to provide a more relevant view of the upcoming changes.
Note 2 Income from transactions
2018 2017$ $
(a) Grant and consulting incomeState Government – Operating grant recurrent 417,000 435,000
State Government - Operating grant non-recurrent 1,050,000 1,050,000
Government grants 2,309,691 1,909,451
Government & philanthropic grants used to acquire properties (i) 500,000 219,213
Project grants and consulting – philanthropic and other parties 462,193 665,087Total grant and consulting income 4,738,884 4,278,751
(b) Interest on InvestmentsInterest on investments 315,146 332,878
468,366 521,238
Total interest on investments 783,512 854,116
(c) DividendsDividends from managed funds and equities 272,612 159,473
Total dividends 272,612 159,473
(d) DonationsGeneral donations 943,147 262,775Donations for appeals and properties(i) 365,803 373,061General bequests 4,000 212,634Other fundraising income 71,256 100,737
Total donations 1,384,206 949,207
(e) Fair value of services received free of charge or for nominal considerationLegal services 20,060 5,518
Total fair value of services received free of charge or for nominal consideration 20,060 5,518
(f) Other incomeRental and accomodation income 35,315 12,032Sale of goods and services - 155Offset program income 146,040 171,130Other 141,249 347,386
Total other income 322,604 530,703
Note:(i) From time to time Trust for Nature receives grant or donation and appeal revenue which is used to acquire properties. Such transactionsresult in an accounting profit equal to the acquisition cost which resides in the accumulated surplus (Note 21) until such time as the property issurrendered or sold.In 2017-18 one property was purchased by Trust for Nature ($497,253) with contributions from philanthropic revenue. (2016-17: one pro pertywas purchased by Trust for Nature ($69,213) and another was puchased by a partner organisation ($150,000) with contributions fromGovernment and philanthropic revenue, refer to Note 2(a), Note 2(d) and Note 9.
Interest on investments attributable to funds held awaiting remittance and landownerpayments held in trust
Page 25Trust for Nature Annual Report 2017-18 59
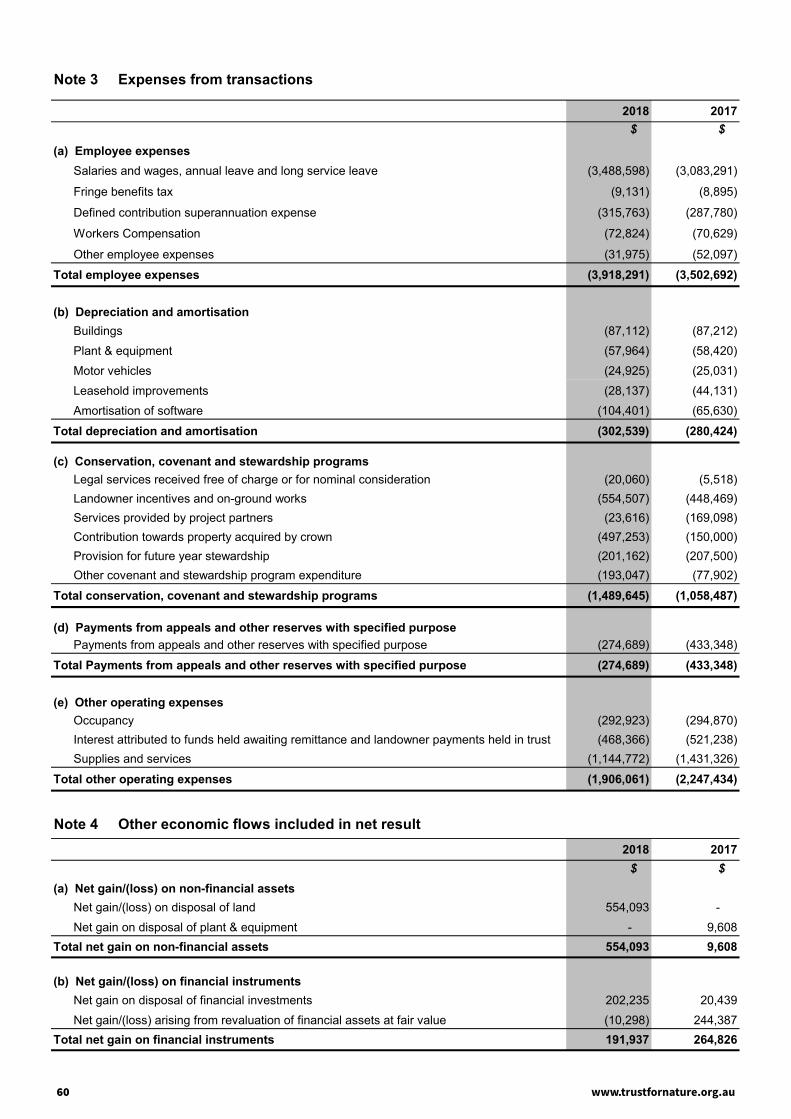
Note 3 Expenses from transactions
2018 2017$ $
(a) Employee expensesSalaries and wages, annual leave and long service leave (3,488,598) (3,083,291)
Fringe benefits tax (9,131) (8,895)
Defined contribution superannuation expense (315,763) (287,780)
Workers Compensation (72,824) (70,629)
Other employee expenses (31,975) (52,097)
Total employee expenses (3,918,291) (3,502,692)
(b) Depreciation and amortisationBuildings (87,112) (87,212)Plant & equipment (57,964) (58,420)Motor vehicles (24,925) (25,031)Leasehold improvements (28,137) (44,131)Amortisation of software (104,401) (65,630)
Total depreciation and amortisation (302,539) (280,424)
(c) Conservation, covenant and stewardship programsLegal services received free of charge or for nominal consideration (20,060) (5,518)Landowner incentives and on-ground works (554,507) (448,469)Services provided by project partners (23,616) (169,098)Contribution towards property acquired by crown (497,253) (150,000)Provision for future year stewardship (201,162) (207,500)Other covenant and stewardship program expenditure (193,047) (77,902)
Total conservation, covenant and stewardship programs (1,489,645) (1,058,487)
(d) Payments from appeals and other reserves with specified purposePayments from appeals and other reserves with specified purpose (274,689) (433,348)
Total Payments from appeals and other reserves with specified purpose (274,689) (433,348)
(e) Other operating expensesOccupancy (292,923) (294,870)Interest attributed to funds held awaiting remittance and landowner payments held in trust (468,366) (521,238)Supplies and services (1,144,772) (1,431,326)
Total other operating expenses (1,906,061) (2,247,434)
Note 4 Other economic flows included in net result2018 2017
$ $(a) Net gain/(loss) on non-financial assets
Net gain/(loss) on disposal of land 554,093 -Net gain on disposal of plant & equipment - 9,608
Total net gain on non-financial assets 554,093 9,608
(b) Net gain/(loss) on financial instrumentsNet gain on disposal of financial investments 202,235 20,439Net gain/(loss) arising from revaluation of financial assets at fair value (10,298) 244,387
Total net gain on financial instruments 191,937 264,826
Page 26
Note 5 Receivables
2018 2017$ $
Current receivablesContractual
Sale of goods and services(i) 6,726,213 750,018
Interest receivable 207,133 155,124Other receivables(ii) 175,075 126,000
Total current receivables 7,108,421 1,031,142
Non-current receivablesContractual
Interest receivable 56,564 105,744Total non-current receivables 56,564 105,744
Total receivables 7,164,985 1,136,886Note:(i) The average credit period on sales of services is 30 days. No interest is charged on other receivables.(ii) Other receivables includes $175,075 (2016-17: $126,000) paid for the acquisition of a property for which title has not transferred.
(a) Ageing analysis of contractual receivablesPlease refer to Table 18.4 in Note 18 for the ageing analysis of contractual receivables.
(b) Nature and extent of risk arising from contractual receivablesPlease refer to Note 18(b) for the nature and extent of credit risk arising from contractual receivables.
Note 6 Investments and other financial assets
2018 2017$ $
Current investments and other financial assetsAustralian dollar term deposits > 3 months(i)(iv) 18,121,952 24,160,178
Total current investments and other financial assets 18,121,952 24,160,178
Non-current investments and other financial assetsAustralian dollar term deposits > 12 months(i) 3,464,570 3,580,936
Managed investment schemes(ii)(iii) 11,079,615 4,627,014Total non-current investments and other financial assets 14,544,185 8,207,950
Total investments and other financial assets 32,666,137 32,368,128Notes:
(a) Ageing analysis of investments and other financial assetsPlease refer to Table 18.4 in Note 18 for the ageing analysis of investments and other financial assets.
(b) Nature and extent of risk arising from investments and other financial assetsPlease refer to Note 18 for the nature and extent of risks arising from investments and other financial assets.
(i) Term deposits under ’investments and other financial assets’ class include only term deposits with maturity greater than 90 days.
(ii) The Trust designated all its equities and managed investment schemes at fair value through the profit or loss. Therefore, unless they arepart of a disposal group held for sale, all equities and managed investment schemes are classified as non-current. This is consistent with theTrust’s purpose of holding the investment for long-term management of risk, not for short-term profit gain.
(iii) The managed investment schemes are managed by JBWere.
(iv) This balance includes a term deposit in the amount of $93,124 held as security against bank guarantees issued for rental sites. The bankguarantees outstanding at balance sheet date amounted to $93,124 (2017: $93,124).
Page 27www.trustfornature.org.au60

Note 3 Expenses from transactions
2018 2017$ $
(a) Employee expensesSalaries and wages, annual leave and long service leave (3,488,598) (3,083,291)
Fringe benefits tax (9,131) (8,895)
Defined contribution superannuation expense (315,763) (287,780)
Workers Compensation (72,824) (70,629)
Other employee expenses (31,975) (52,097)
Total employee expenses (3,918,291) (3,502,692)
(b) Depreciation and amortisationBuildings (87,112) (87,212)Plant & equipment (57,964) (58,420)Motor vehicles (24,925) (25,031)Leasehold improvements (28,137) (44,131)Amortisation of software (104,401) (65,630)
Total depreciation and amortisation (302,539) (280,424)
(c) Conservation, covenant and stewardship programsLegal services received free of charge or for nominal consideration (20,060) (5,518)Landowner incentives and on-ground works (554,507) (448,469)Services provided by project partners (23,616) (169,098)Contribution towards property acquired by crown (497,253) (150,000)Provision for future year stewardship (201,162) (207,500)Other covenant and stewardship program expenditure (193,047) (77,902)
Total conservation, covenant and stewardship programs (1,489,645) (1,058,487)
(d) Payments from appeals and other reserves with specified purposePayments from appeals and other reserves with specified purpose (274,689) (433,348)
Total Payments from appeals and other reserves with specified purpose (274,689) (433,348)
(e) Other operating expensesOccupancy (292,923) (294,870)Interest attributed to funds held awaiting remittance and landowner payments held in trust (468,366) (521,238)Supplies and services (1,144,772) (1,431,326)
Total other operating expenses (1,906,061) (2,247,434)
Note 4 Other economic flows included in net result2018 2017
$ $(a) Net gain/(loss) on non-financial assets
Net gain/(loss) on disposal of land 554,093 -Net gain on disposal of plant & equipment - 9,608
Total net gain on non-financial assets 554,093 9,608
(b) Net gain/(loss) on financial instrumentsNet gain on disposal of financial investments 202,235 20,439Net gain/(loss) arising from revaluation of financial assets at fair value (10,298) 244,387
Total net gain on financial instruments 191,937 264,826
Page 26
Note 5 Receivables
2018 2017$ $
Current receivablesContractual
Sale of goods and services(i) 6,726,213 750,018
Interest receivable 207,133 155,124Other receivables(ii) 175,075 126,000
Total current receivables 7,108,421 1,031,142
Non-current receivablesContractual
Interest receivable 56,564 105,744Total non-current receivables 56,564 105,744
Total receivables 7,164,985 1,136,886Note:(i) The average credit period on sales of services is 30 days. No interest is charged on other receivables.(ii) Other receivables includes $175,075 (2016-17: $126,000) paid for the acquisition of a property for which title has not transferred.
(a) Ageing analysis of contractual receivablesPlease refer to Table 18.4 in Note 18 for the ageing analysis of contractual receivables.
(b) Nature and extent of risk arising from contractual receivablesPlease refer to Note 18(b) for the nature and extent of credit risk arising from contractual receivables.
Note 6 Investments and other financial assets
2018 2017$ $
Current investments and other financial assetsAustralian dollar term deposits > 3 months(i)(iv) 18,121,952 24,160,178
Total current investments and other financial assets 18,121,952 24,160,178
Non-current investments and other financial assetsAustralian dollar term deposits > 12 months(i) 3,464,570 3,580,936
Managed investment schemes(ii)(iii) 11,079,615 4,627,014Total non-current investments and other financial assets 14,544,185 8,207,950
Total investments and other financial assets 32,666,137 32,368,128Notes:
(a) Ageing analysis of investments and other financial assetsPlease refer to Table 18.4 in Note 18 for the ageing analysis of investments and other financial assets.
(b) Nature and extent of risk arising from investments and other financial assetsPlease refer to Note 18 for the nature and extent of risks arising from investments and other financial assets.
(i) Term deposits under ’investments and other financial assets’ class include only term deposits with maturity greater than 90 days.
(ii) The Trust designated all its equities and managed investment schemes at fair value through the profit or loss. Therefore, unless they arepart of a disposal group held for sale, all equities and managed investment schemes are classified as non-current. This is consistent with theTrust’s purpose of holding the investment for long-term management of risk, not for short-term profit gain.
(iii) The managed investment schemes are managed by JBWere.
(iv) This balance includes a term deposit in the amount of $93,124 held as security against bank guarantees issued for rental sites. The bankguarantees outstanding at balance sheet date amounted to $93,124 (2017: $93,124).
Page 27Trust for Nature Annual Report 2017-18 61

Note 7 Other assets
2018 2017$ $
Current other assetsPrepayments 51,331 52,570
Consulting services provided but not yet invoiced 63,903 167,833
Deposits 8,214 3,477
Other current assets 5,077 -Total current other assets 128,525 223,880
Total other assets 128,525 223,880
Note 8 Non-financial physical assets classified as held for sale
2018 2017$ $
CurrentFreehold land held for sale 1,050,532 1,574,972
Total non-financial physical assets classified as held for sale 1,050,532 1,574,972
Land and buildings held for sale are valued at the lower of their carrying amount and fair value less costs to sell.
Level 1 (i) Level 2 (i) Level 3 (i)
2018 $ $ $ $Land at fair value
Specialised land 1,050,532 1,050,532Total of land at fair value 1,050,532 1,050,5322017Land at fair value
Specialised land 1,574,972 1,574,972Total of land at fair value 1,574,972 1,574,972Notes:
There have been no transfers between levels during the period.
(ii) Non-financial physical assets classified as held for sale have been classified as level 2 as the significant inputs to fair value measurementare indirectly observable, in this case the recent acquisition costs with reference to recent comparable sales in the area.
The Trust intends to dispose of certain freehold land within the next twelve months. This includes Revolving Fund land that wasacquired for purposes of conservation with the intention of reselling it with covenants established to ensure particular naturalaspects of the properties are conserved. A search is underway for buyers. No impairment loss was recognised onreclassification of the freehold land as held for sale or at reporting date.
Table 8.2: Fair value measurement hierarchy for assets
Carryingamount as at
30 June
Fair value measurement at end of reportingperiod using(ii):
Table 8.1: Non-financial physical assets classified as held for sale
(i) Classified in accordance with the fair value hierarchy, see Note 1 (B)
Page 28
Note 9 Property, plant and equipment
2018 2017$ $
Land at fair value 16,486,951 16,486,951
16,486,951 16,486,951
Buildings at fair value 3,137,000 3,137,000
Less accumulated depreciation (174,224) (87,112)
2,962,776 3,049,888
Leasehold improvements at fair value 306,012 306,012
Less accumulated depreciation (305,989) (277,852)
23 28,160
Plant and equipment at fair value 516,013 496,857
Less accumulated depreciation (388,191) (330,227)
127,822 166,630
Motor vehicles at fair value 227,161 227,161
Less accumulated depreciation (179,101) (154,176)
48,060 72,985
Total property, plant and equipment 19,625,632 19,804,614Note:
Table 9.2: Aggregate depreciation recognised as an expense during the year (i)
2018 2017$ $
Buildings 87,112 87,212
Plant & equipment 57,964 58,420
Motor vehicles 24,925 25,031
Leasehold improvements 28,137 44,131
Total property, plant and equipment 198,138 214,794Note:(i) The useful lives as stated in Note 1 are used in the calculation of depreciation.
Table 9.1: Classification by 'Public safety and environment' Purpose Group - Gross carrying amount and accumulated depreciation(i)
(i) Property, plant and equipment are classified primarily by the ‘purpose’ for which the assets are used, according to one of six purposegroups based upon government purpose classifications (GPC). All assets within a purpose group are further sub categorised according to theasset’s ‘nature’ (i.e. buildings, plant and equipment, etc), with each sub category being classified as a separate class of asset for financialreporting purposes.
Page 29www.trustfornature.org.au62

Note 9 Property, plant and equipment
2018 2017$ $
Land at fair value 16,486,951 16,486,951
16,486,951 16,486,951
Buildings at fair value 3,137,000 3,137,000
Less accumulated depreciation (174,224) (87,112)
2,962,776 3,049,888
Leasehold improvements at fair value 306,012 306,012
Less accumulated depreciation (305,989) (277,852)
23 28,160
Plant and equipment at fair value 516,013 496,857
Less accumulated depreciation (388,191) (330,227)
127,822 166,630
Motor vehicles at fair value 227,161 227,161
Less accumulated depreciation (179,101) (154,176)
48,060 72,985
Total property, plant and equipment 19,625,632 19,804,614Note:
Table 9.2: Aggregate depreciation recognised as an expense during the year (i)
2018 2017$ $
Buildings 87,112 87,212
Plant & equipment 57,964 58,420
Motor vehicles 24,925 25,031
Leasehold improvements 28,137 44,131
Total property, plant and equipment 198,138 214,794Note:(i) The useful lives as stated in Note 1 are used in the calculation of depreciation.
Table 9.1: Classification by 'Public safety and environment' Purpose Group - Gross carrying amount and accumulated depreciation(i)
(i) Property, plant and equipment are classified primarily by the ‘purpose’ for which the assets are used, according to one of six purposegroups based upon government purpose classifications (GPC). All assets within a purpose group are further sub categorised according to theasset’s ‘nature’ (i.e. buildings, plant and equipment, etc), with each sub category being classified as a separate class of asset for financialreporting purposes.
Page 29Trust for Nature Annual Report 2017-18 63
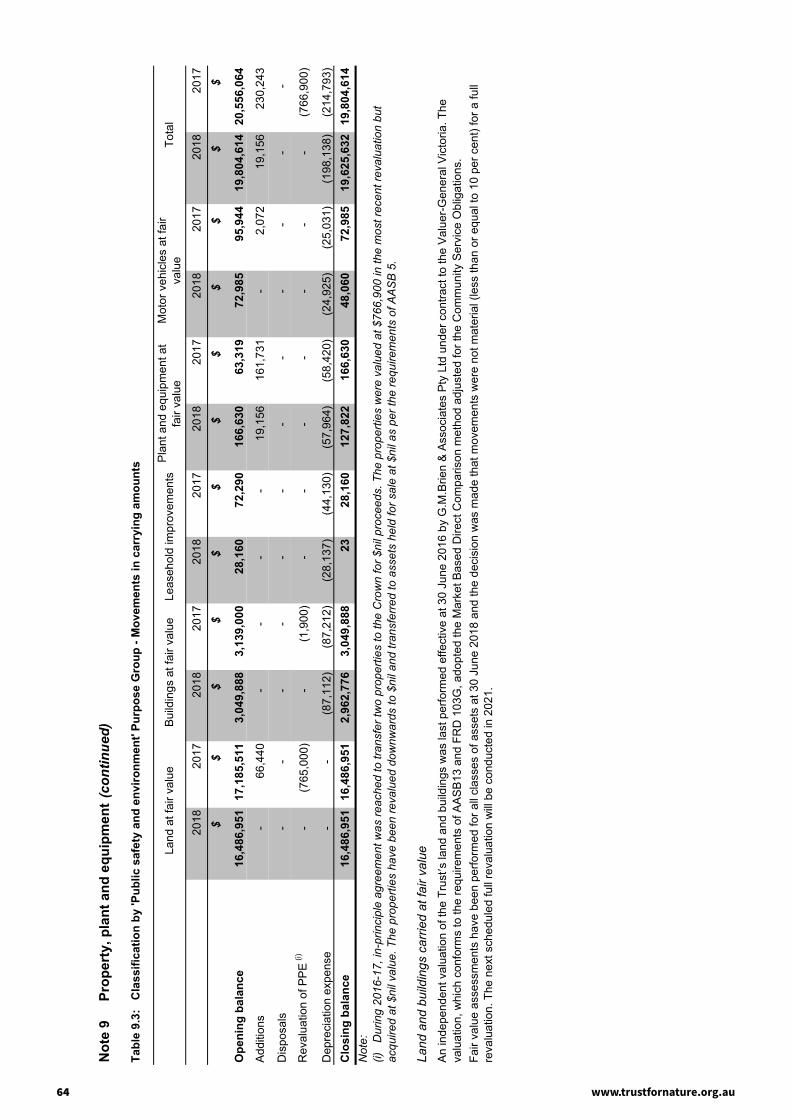
Not
e 9
P
rope
rty,
pla
nt a
nd e
quip
men
t (c
ontin
ued)
Tabl
e 9.
3:
Cla
ssifi
catio
n by
'Pub
lic s
afet
y an
d en
viro
nmen
t' Pu
rpos
e G
roup
- M
ovem
ents
in c
arry
ing
amou
nts
2018
2017
2018
2017
2018
2017
2018
2017
2018
2017
2018
2017
$$
$$
$$
$$
$$
$$
Ope
ning
bal
ance
16,4
86,9
5117
,185
,511
3,04
9,88
83,
139,
000
28,1
6072
,290
166,
630
63,3
1972
,985
95,9
4419
,804
,614
20,5
56,0
64
Add
ition
s-
66,4
40-
--
-19
,156
161,
731
-2,
072
19,1
5623
0,24
3
Dis
posa
ls-
--
--
--
--
--
-
Rev
alua
tion
of P
PE
(i)
-(7
65,0
00)
-(1
,900
)-
--
--
--
(766
,900
)
Dep
reci
atio
n ex
pens
e-
-(8
7,11
2)(8
7,21
2)(2
8,13
7)(4
4,13
0)(5
7,96
4)(5
8,42
0)(2
4,92
5)(2
5,03
1)(1
98,1
38)
(214
,793
)C
losi
ng b
alan
ce16
,486
,951
16,4
86,9
512,
962,
776
3,04
9,88
823
28,1
6012
7,82
216
6,63
048
,060
72,9
8519
,625
,632
19,8
04,6
14
Land
and
bui
ldin
gs c
arrie
d at
fair
valu
e
Not
e:
An
inde
pend
ent v
alua
tion
of th
e Tr
ust’ s
land
and
bui
ldin
gs w
as la
st p
erfo
rmed
effe
ctiv
e at
30
June
201
6 by
G.M
.Brie
n &
Ass
ocia
tes
Pty
Ltd
und
er c
ontra
ct to
the
Val
uer-
Gen
eral
Vic
toria
. The
valu
atio
n, w
hich
con
form
s to
the
requ
irem
ents
of A
AS
B13
and
FR
D 1
03G
, ado
pted
the
Mar
ket B
ased
Dire
ct C
ompa
rison
met
hod
adju
sted
for t
he C
omm
unity
Ser
vice
Obl
igat
ions
.
Tota
lM
otor
veh
icle
s at
fair
valu
eLa
nd a
t fai
r val
ueB
uild
ings
at f
air v
alue
Pla
nt a
nd e
quip
men
t at
fair
valu
eLe
aseh
old
impr
ovem
ents
Fair
valu
e as
sess
men
ts h
ave
been
per
form
ed fo
r all
clas
ses
of a
sset
s at
30
June
201
8 an
d th
e de
cisi
on w
as m
ade
that
mov
emen
ts w
ere
not m
ater
ial (
less
than
or e
qual
to 1
0 pe
r cen
t) fo
r a fu
llre
valu
atio
n. T
he n
ext s
ched
uled
full
reva
luat
ion
will
be
cond
ucte
d in
202
1.
(i)
Dur
ing
2016
-17,
in-p
rinci
ple
agre
emen
t was
reac
hed
to tr
ansf
er tw
o pr
oper
ties
to th
e C
row
n fo
r $ni
l pro
ceed
s. T
he p
rope
rties
wer
e va
lued
at $
766,
900
in th
e m
ost r
ecen
t rev
alua
tion
but
acqu
ired
at $
nil v
alue
. The
pro
perti
es h
ave
been
reva
lued
dow
nwar
ds to
$ni
l and
tran
sfer
red
to a
sset
s he
ld fo
r sal
e at
$ni
l as
per t
he re
quire
men
ts o
f AA
SB
5.
Pag
e 30
Note 9 Property, plant and equipment (continued)
Level 1 (i) Level 2 (i) Level 3 (i)
2018 $ $ $ $Land at fair value
Specialised land 16,486,951 16,486,951Total of land at fair value 16,486,951 16,486,951Buildings at fair value
Specialised buildings 2,962,776 2,962,776Total of buildings at fair value 2,962,776 2,962,776Leasehold improvements at fair value
Leasehold improvements 23 23Total of leasehold improvements at fair value 23 23Plant and equipment at fair value
Plant and equipment 127,822 127,822Total of plant and equipment at fair value 127,822 127,822Motor vehicles at fair value
Motor vehicles 48,060 48,060Total of motor vehicles at fair value 48,060 48,0602017Land at fair value
Specialised land 16,486,951 16,486,951Total of land at fair value 16,486,951 16,486,951Buildings at fair value
Specialised buildings 3,049,888 3,049,888Total of buildings at fair value 3,049,888 3,049,888Leasehold improvements at fair value
Leasehold improvements 28,160 28,160Total of leasehold improvements at fair value 28,160 28,160Plant and equipment at fair value
Plant and equipment 166,630 166,630Total of plant and equipment at fair value 166,630 166,630Motor vehicles at fair value
Motor vehicles 72,985 72,985Total of motor vehicles at fair value 72,985 72,985Note:
There have been no transfers between levels during the period.
Table 9.4 (a): Valuation Technique
Specialised land and buildingsSpecialised land is valued using the market approach, although it is adjusted for the community service obligation (CSO) toreflect the specialised nature of the land being valued.
The CSO adjustment is a reflection of the valuer’s assessment of the impact of restrictions associated with an asset to theextent that is also equally applicable to market participants. This approach is in light of the highest and best use considerationrequired for fair value measurement, and takes into account the use of the asset that is physically possible, legally permissable,and financially feasable. As adjustments of CSO are considered as significant unobservable inputs, specialised land would beclassified as Level 3 assets.
For the Trust’s majority of specialised buildings, the depreciated replacement cost method is used, adjusting for the associateddepreciations. As depreciation adjustments are considered as significant, unobservable inputs in nature, specialised buildingsare classified as Level 3 fair value measurements.An independent valuation of the Trust’s specialised land and buildings was last performed by G.M.Brien & Associates Pty Ltdunder contract to the Valuer-General Victoria. The valuation was performed using the market approach adjusted for CSO. Theeffective date of the valuation was 30 June 2016.
Table 9.4: Fair value measurement hierarchy for assets
Carryingamount
Fair value measurement at end of reportingperiod using:
(i) Classified in accordance with the fair value hierarchy, see Note 1 (B)
Page 31www.trustfornature.org.au64

Note 9 Property, plant and equipment (continued)
Level 1 (i) Level 2 (i) Level 3 (i)
2018 $ $ $ $Land at fair value
Specialised land 16,486,951 16,486,951Total of land at fair value 16,486,951 16,486,951Buildings at fair value
Specialised buildings 2,962,776 2,962,776Total of buildings at fair value 2,962,776 2,962,776Leasehold improvements at fair value
Leasehold improvements 23 23Total of leasehold improvements at fair value 23 23Plant and equipment at fair value
Plant and equipment 127,822 127,822Total of plant and equipment at fair value 127,822 127,822Motor vehicles at fair value
Motor vehicles 48,060 48,060Total of motor vehicles at fair value 48,060 48,0602017Land at fair value
Specialised land 16,486,951 16,486,951Total of land at fair value 16,486,951 16,486,951Buildings at fair value
Specialised buildings 3,049,888 3,049,888Total of buildings at fair value 3,049,888 3,049,888Leasehold improvements at fair value
Leasehold improvements 28,160 28,160Total of leasehold improvements at fair value 28,160 28,160Plant and equipment at fair value
Plant and equipment 166,630 166,630Total of plant and equipment at fair value 166,630 166,630Motor vehicles at fair value
Motor vehicles 72,985 72,985Total of motor vehicles at fair value 72,985 72,985Note:
There have been no transfers between levels during the period.
Table 9.4 (a): Valuation Technique
Specialised land and buildingsSpecialised land is valued using the market approach, although it is adjusted for the community service obligation (CSO) toreflect the specialised nature of the land being valued.
The CSO adjustment is a reflection of the valuer’s assessment of the impact of restrictions associated with an asset to theextent that is also equally applicable to market participants. This approach is in light of the highest and best use considerationrequired for fair value measurement, and takes into account the use of the asset that is physically possible, legally permissable,and financially feasable. As adjustments of CSO are considered as significant unobservable inputs, specialised land would beclassified as Level 3 assets.
For the Trust’s majority of specialised buildings, the depreciated replacement cost method is used, adjusting for the associateddepreciations. As depreciation adjustments are considered as significant, unobservable inputs in nature, specialised buildingsare classified as Level 3 fair value measurements.An independent valuation of the Trust’s specialised land and buildings was last performed by G.M.Brien & Associates Pty Ltdunder contract to the Valuer-General Victoria. The valuation was performed using the market approach adjusted for CSO. Theeffective date of the valuation was 30 June 2016.
Table 9.4: Fair value measurement hierarchy for assets
Carryingamount
Fair value measurement at end of reportingperiod using:
(i) Classified in accordance with the fair value hierarchy, see Note 1 (B)
Page 31Trust for Nature Annual Report 2017-18 65
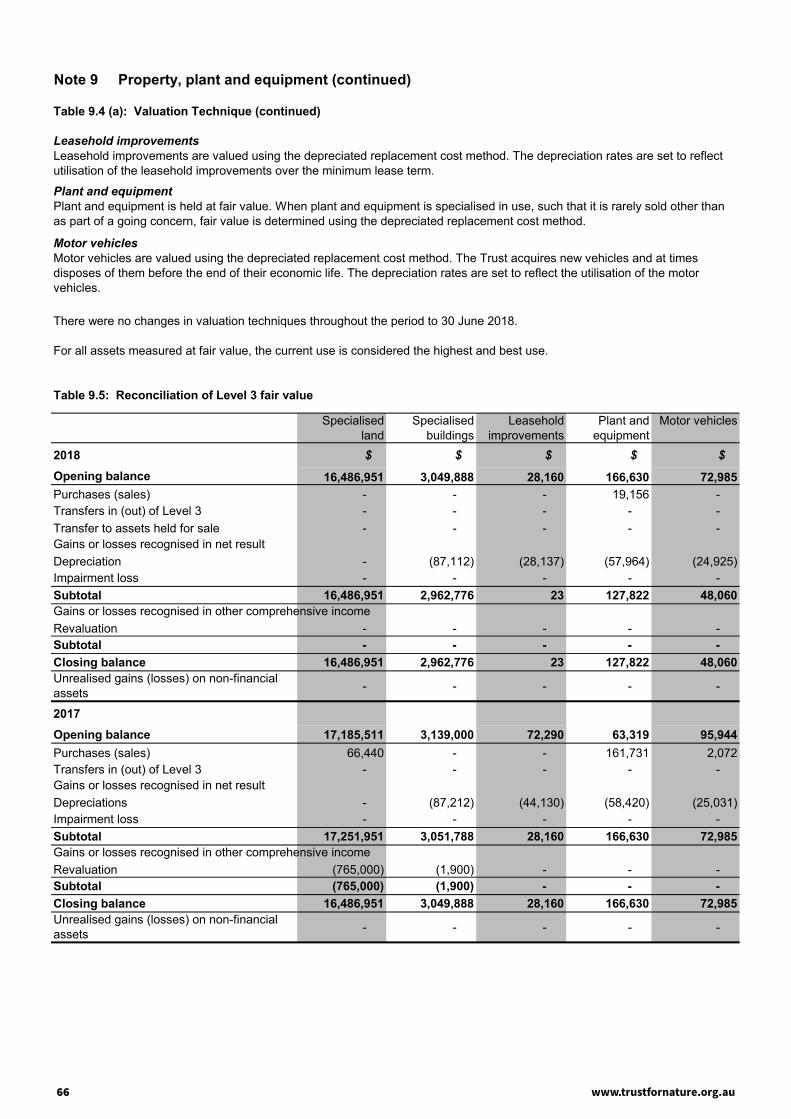
Note 9 Property, plant and equipment (continued)
Table 9.4 (a): Valuation Technique (continued)
Leasehold improvements
Plant and equipment
Motor vehicles
There were no changes in valuation techniques throughout the period to 30 June 2018.
For all assets measured at fair value, the current use is considered the highest and best use.
Specialisedland
Specialisedbuildings
Leaseholdimprovements
Plant andequipment
Motor vehicles
2018 $ $ $ $ $
Opening balance 16,486,951 3,049,888 28,160 166,630 72,985Purchases (sales) - - - 19,156 -Transfers in (out) of Level 3 - - - - -Transfer to assets held for sale - - - - -Gains or losses recognised in net resultDepreciation - (87,112) (28,137) (57,964) (24,925)Impairment loss - - - - -Subtotal 16,486,951 2,962,776 23 127,822 48,060Gains or losses recognised in other comprehensive incomeRevaluation - - - - -Subtotal - - - - -Closing balance 16,486,951 2,962,776 23 127,822 48,060Unrealised gains (losses) on non-financialassets - - - - -
2017Opening balance 17,185,511 3,139,000 72,290 63,319 95,944Purchases (sales) 66,440 - - 161,731 2,072Transfers in (out) of Level 3 - - - - -Gains or losses recognised in net resultDepreciations - (87,212) (44,130) (58,420) (25,031)Impairment loss - - - - -Subtotal 17,251,951 3,051,788 28,160 166,630 72,985Gains or losses recognised in other comprehensive incomeRevaluation (765,000) (1,900) - - -Subtotal (765,000) (1,900) - - -Closing balance 16,486,951 3,049,888 28,160 166,630 72,985Unrealised gains (losses) on non-financialassets - - - - -
Table 9.5: Reconciliation of Level 3 fair value
Motor vehicles are valued using the depreciated replacement cost method. The Trust acquires new vehicles and at timesdisposes of them before the end of their economic life. The depreciation rates are set to reflect the utilisation of the motorvehicles.
Plant and equipment is held at fair value. When plant and equipment is specialised in use, such that it is rarely sold other thanas part of a going concern, fair value is determined using the depreciated replacement cost method.
Leasehold improvements are valued using the depreciated replacement cost method. The depreciation rates are set to reflectutilisation of the leasehold improvements over the minimum lease term.
Page 32www.trustfornature.org.au66

Note 9 Property, plant and equipment (continued)
Table 9.4 (a): Valuation Technique (continued)
Leasehold improvements
Plant and equipment
Motor vehicles
There were no changes in valuation techniques throughout the period to 30 June 2018.
For all assets measured at fair value, the current use is considered the highest and best use.
Specialisedland
Specialisedbuildings
Leaseholdimprovements
Plant andequipment
Motor vehicles
2018 $ $ $ $ $
Opening balance 16,486,951 3,049,888 28,160 166,630 72,985Purchases (sales) - - - 19,156 -Transfers in (out) of Level 3 - - - - -Transfer to assets held for sale - - - - -Gains or losses recognised in net resultDepreciation - (87,112) (28,137) (57,964) (24,925)Impairment loss - - - - -Subtotal 16,486,951 2,962,776 23 127,822 48,060Gains or losses recognised in other comprehensive incomeRevaluation - - - - -Subtotal - - - - -Closing balance 16,486,951 2,962,776 23 127,822 48,060Unrealised gains (losses) on non-financialassets - - - - -
2017Opening balance 17,185,511 3,139,000 72,290 63,319 95,944Purchases (sales) 66,440 - - 161,731 2,072Transfers in (out) of Level 3 - - - - -Gains or losses recognised in net resultDepreciations - (87,212) (44,130) (58,420) (25,031)Impairment loss - - - - -Subtotal 17,251,951 3,051,788 28,160 166,630 72,985Gains or losses recognised in other comprehensive incomeRevaluation (765,000) (1,900) - - -Subtotal (765,000) (1,900) - - -Closing balance 16,486,951 3,049,888 28,160 166,630 72,985Unrealised gains (losses) on non-financialassets - - - - -
Table 9.5: Reconciliation of Level 3 fair value
Motor vehicles are valued using the depreciated replacement cost method. The Trust acquires new vehicles and at timesdisposes of them before the end of their economic life. The depreciation rates are set to reflect the utilisation of the motorvehicles.
Plant and equipment is held at fair value. When plant and equipment is specialised in use, such that it is rarely sold other thanas part of a going concern, fair value is determined using the depreciated replacement cost method.
Leasehold improvements are valued using the depreciated replacement cost method. The depreciation rates are set to reflectutilisation of the leasehold improvements over the minimum lease term.
Page 32
Note 9 Property, plant and equipment (continued)
2018 Valuationtechnique
Significantunobservableinputs (i)
Specialised land (i) Market approach Community ServiceObligation (CSO)adjustment
Specialised buildings Depreciatedreplacement cost
Cost per building
Useful life ofspecialisedbuildings
Leasehold improvements Depreciatedreplacement cost
Direct cost persquaremetre
Useful life ofleaseholdimprovements
Plant and equipment Depreciatedreplacement cost
Cost per unit
Useful life of plantand equipment
Motor vehicles Depreciatedreplacement cost
Cost per unit
Useful life of motorvehicles
Note:
Table 9.6: Description of significant unobservable inputs to Level 3 valuations
(i) CSO adjustments of 25 per cent were applied to some specialised land to reduce the market approach value.
Sensitivity of fair value measurement to changes insignificant unobservable inputs
A significant increase or decrease in the CSO adjustmentwould result in a significantly lower (higher) fair value.
A significant increase or decrease in direct cost per unitwould result in a significantly higher or lower fair value.
A significant increase or decrease in the estimated usefullife of the asset would result in a significantly higher or lowervaluation.
A significant increase or decrease in direct cost per squaremetre adjustment would result in a significantly higher orlower fair value.
A significant increase or decrease in the estimated usefullife of the asset would result in a significantly higher or lowervaluation.
A significant increase or decrease in direct cost per unitwould result in a significantly higher or lower fair value.
A significant increase or decrease in the estimated usefullife of the asset would result in a significantly higher or lowervaluation.
A significant increase or decrease in direct cost per unitwould result in a significantly higher or lower fair value.
A significant increase or decrease in the estimated usefullife of the asset would result in a significantly higher or lowervaluation.
Page 33Trust for Nature Annual Report 2017-18 67
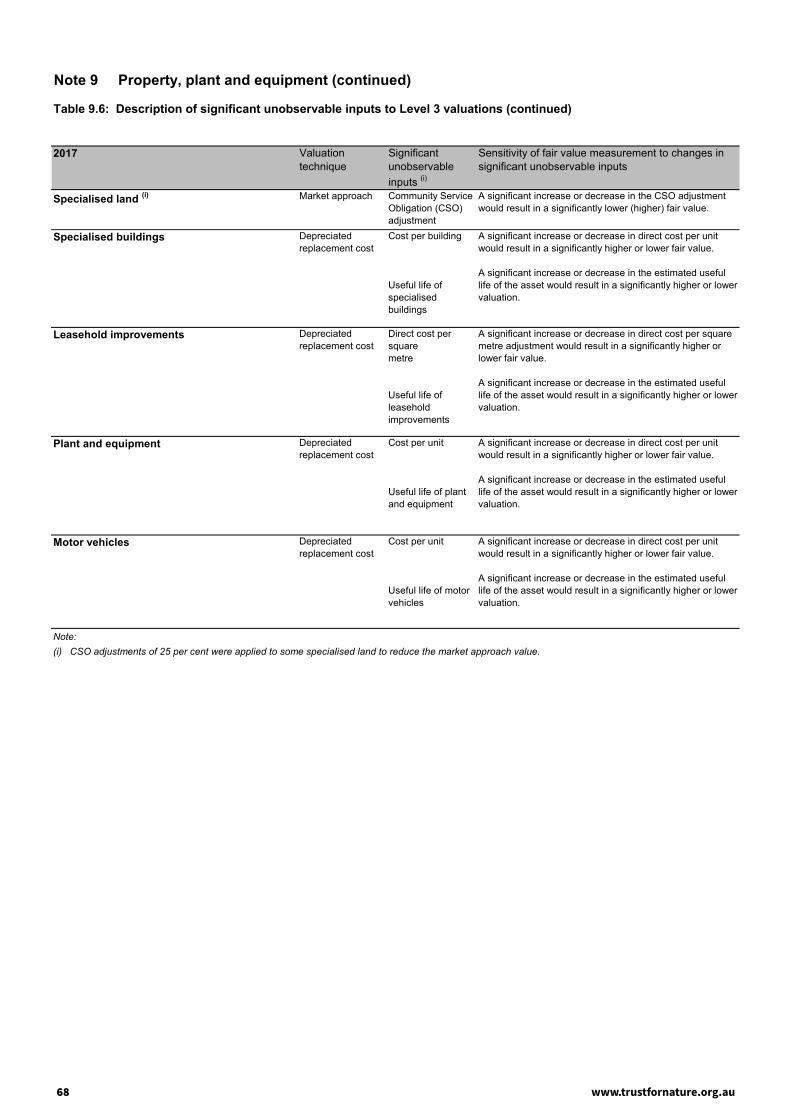
Note 9 Property, plant and equipment (continued)
2017 Valuationtechnique
Significantunobservableinputs (i)
Specialised land (i) Market approach Community ServiceObligation (CSO)adjustment
Specialised buildings Depreciatedreplacement cost
Cost per building
Useful life ofspecialisedbuildings
Leasehold improvements Depreciatedreplacement cost
Direct cost persquaremetre
Useful life ofleaseholdimprovements
Plant and equipment Depreciatedreplacement cost
Cost per unit
Useful life of plantand equipment
Motor vehicles Depreciatedreplacement cost
Cost per unit
Useful life of motorvehicles
Note:(i) CSO adjustments of 25 per cent were applied to some specialised land to reduce the market approach value.
Sensitivity of fair value measurement to changes insignificant unobservable inputs
A significant increase or decrease in the CSO adjustmentwould result in a significantly lower (higher) fair value.
A significant increase or decrease in direct cost per unitwould result in a significantly higher or lower fair value.
A significant increase or decrease in the estimated usefullife of the asset would result in a significantly higher or lowervaluation.
A significant increase or decrease in direct cost per squaremetre adjustment would result in a significantly higher orlower fair value.
A significant increase or decrease in the estimated usefullife of the asset would result in a significantly higher or lowervaluation.
A significant increase or decrease in direct cost per unitwould result in a significantly higher or lower fair value.
A significant increase or decrease in the estimated usefullife of the asset would result in a significantly higher or lowervaluation.
A significant increase or decrease in direct cost per unitwould result in a significantly higher or lower fair value.
A significant increase or decrease in the estimated usefullife of the asset would result in a significantly higher or lowervaluation.
Table 9.6: Description of significant unobservable inputs to Level 3 valuations (continued)
Page 34www.trustfornature.org.au68

Note 9 Property, plant and equipment (continued)
2017 Valuationtechnique
Significantunobservableinputs (i)
Specialised land (i) Market approach Community ServiceObligation (CSO)adjustment
Specialised buildings Depreciatedreplacement cost
Cost per building
Useful life ofspecialisedbuildings
Leasehold improvements Depreciatedreplacement cost
Direct cost persquaremetre
Useful life ofleaseholdimprovements
Plant and equipment Depreciatedreplacement cost
Cost per unit
Useful life of plantand equipment
Motor vehicles Depreciatedreplacement cost
Cost per unit
Useful life of motorvehicles
Note:(i) CSO adjustments of 25 per cent were applied to some specialised land to reduce the market approach value.
Sensitivity of fair value measurement to changes insignificant unobservable inputs
A significant increase or decrease in the CSO adjustmentwould result in a significantly lower (higher) fair value.
A significant increase or decrease in direct cost per unitwould result in a significantly higher or lower fair value.
A significant increase or decrease in the estimated usefullife of the asset would result in a significantly higher or lowervaluation.
A significant increase or decrease in direct cost per squaremetre adjustment would result in a significantly higher orlower fair value.
A significant increase or decrease in the estimated usefullife of the asset would result in a significantly higher or lowervaluation.
A significant increase or decrease in direct cost per unitwould result in a significantly higher or lower fair value.
A significant increase or decrease in the estimated usefullife of the asset would result in a significantly higher or lowervaluation.
A significant increase or decrease in direct cost per unitwould result in a significantly higher or lower fair value.
A significant increase or decrease in the estimated usefullife of the asset would result in a significantly higher or lowervaluation.
Table 9.6: Description of significant unobservable inputs to Level 3 valuations (continued)
Page 34
Note 10 Intangible assets
2018 2017$ $
Gross carrying amountOpening balance 511,057 511,057
Additions 36,085 -
Closing balance 547,142 511,057
Accumulated amortisation and impairmentOpening balance (208,128) (142,498)
Amortisation of intangible non-produced assets (104,401) (65,630)
Closing balance (312,529) (208,128)Net book value at end of financial year 234,613 302,929
Note 11 Payables
2018 2017$ $
Current payables
ContractualSupplies and services(i) 267,483 221,648
Interest payable to landowners 371,005 464,395
Other payables 12,602 -
651,090 686,043
Statutory
Net GST payable 872,173 48,710
Group taxes payables 72,823 70,405
944,996 119,115Total current payables 1,596,086 805,158
Total payables 1,596,086 805,158Note:(i) The average credit period is 30 days. No interest is charged on other payables.
(a) Maturity analysis of payablesPlease refer to Table 18.5 in Note 18 for the maturity analysis of payables.
Externally purchased software, including the Trust’s website, is measured at its initial cost, which includes its purchase price andany directly attributable costs and is amortised on a straight-line basis over an estimated useful life of between 3 and 5 years.
Computer software and
website
Page 35Trust for Nature Annual Report 2017-18 69
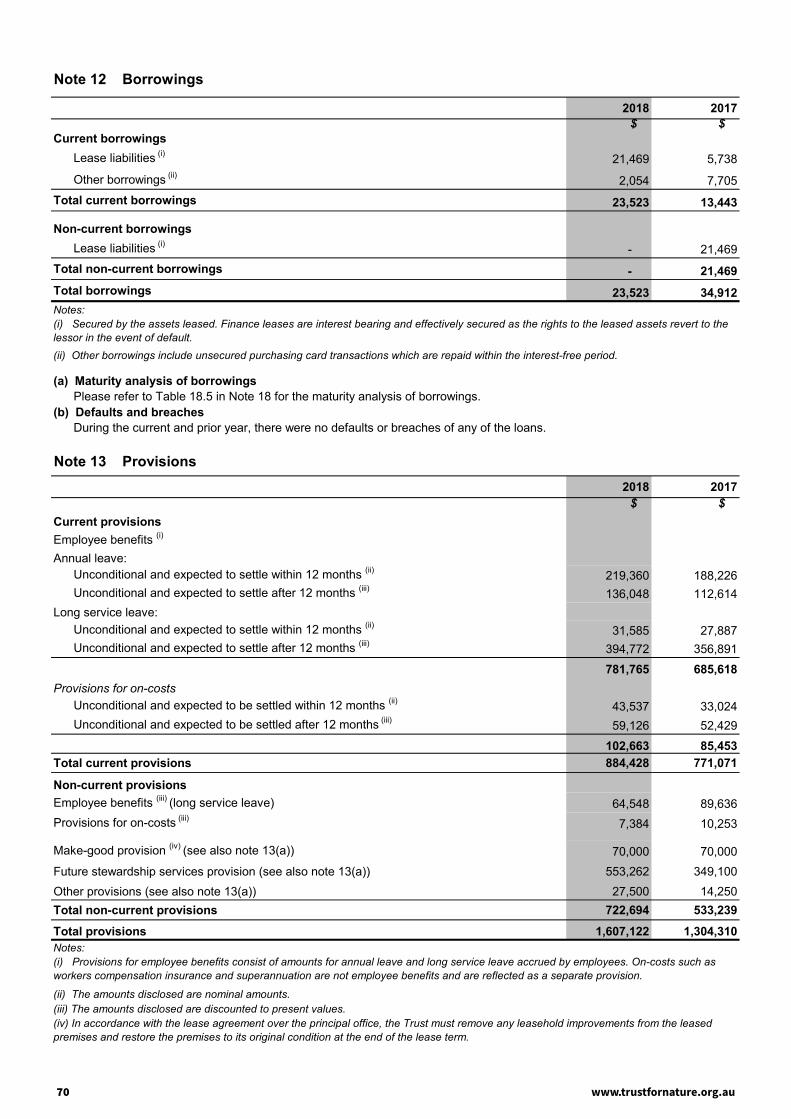
Note 12 Borrowings
2018 2017$ $
Current borrowingsLease liabilities (i) 21,469 5,738
Other borrowings (ii) 2,054 7,705Total current borrowings 23,523 13,443
Non-current borrowingsLease liabilities (i) - 21,469
Total non-current borrowings - 21,469Total borrowings 23,523 34,912Notes:
(a) Maturity analysis of borrowingsPlease refer to Table 18.5 in Note 18 for the maturity analysis of borrowings.
(b) Defaults and breachesDuring the current and prior year, there were no defaults or breaches of any of the loans.
Note 13 Provisions2018 2017
$ $Current provisionsEmployee benefits (i)
Annual leave:Unconditional and expected to settle within 12 months (ii) 219,360 188,226Unconditional and expected to settle after 12 months (iii) 136,048 112,614
Long service leave:Unconditional and expected to settle within 12 months (ii) 31,585 27,887Unconditional and expected to settle after 12 months (iii) 394,772 356,891
781,765 685,618Provisions for on-costs
Unconditional and expected to be settled within 12 months (ii) 43,537 33,024Unconditional and expected to be settled after 12 months (iii) 59,126 52,429
102,663 85,453Total current provisions 884,428 771,071
Non-current provisionsEmployee benefits (iii) (long service leave) 64,548 89,636Provisions for on-costs (iii) 7,384 10,253
Make-good provision (iv) (see also note 13(a)) 70,000 70,000Future stewardship services provision (see also note 13(a)) 553,262 349,100Other provisions (see also note 13(a)) 27,500 14,250Total non-current provisions 722,694 533,239
Total provisions 1,607,122 1,304,310Notes:
(ii) The amounts disclosed are nominal amounts.(iii) The amounts disclosed are discounted to present values.
(ii) Other borrowings include unsecured purchasing card transactions which are repaid within the interest-free period.
(i) Secured by the assets leased. Finance leases are interest bearing and effectively secured as the rights to the leased assets revert to thelessor in the event of default.
(i) Provisions for employee benefits consist of amounts for annual leave and long service leave accrued by employees. On-costs such asworkers compensation insurance and superannuation are not employee benefits and are reflected as a separate provision.
(iv) In accordance with the lease agreement over the principal office, the Trust must remove any leasehold improvements from the leasedpremises and restore the premises to its original condition at the end of the lease term.
Page 36www.trustfornature.org.au70

Note 12 Borrowings
2018 2017$ $
Current borrowingsLease liabilities (i) 21,469 5,738
Other borrowings (ii) 2,054 7,705Total current borrowings 23,523 13,443
Non-current borrowingsLease liabilities (i) - 21,469
Total non-current borrowings - 21,469Total borrowings 23,523 34,912Notes:
(a) Maturity analysis of borrowingsPlease refer to Table 18.5 in Note 18 for the maturity analysis of borrowings.
(b) Defaults and breachesDuring the current and prior year, there were no defaults or breaches of any of the loans.
Note 13 Provisions2018 2017
$ $Current provisionsEmployee benefits (i)
Annual leave:Unconditional and expected to settle within 12 months (ii) 219,360 188,226Unconditional and expected to settle after 12 months (iii) 136,048 112,614
Long service leave:Unconditional and expected to settle within 12 months (ii) 31,585 27,887Unconditional and expected to settle after 12 months (iii) 394,772 356,891
781,765 685,618Provisions for on-costs
Unconditional and expected to be settled within 12 months (ii) 43,537 33,024Unconditional and expected to be settled after 12 months (iii) 59,126 52,429
102,663 85,453Total current provisions 884,428 771,071
Non-current provisionsEmployee benefits (iii) (long service leave) 64,548 89,636Provisions for on-costs (iii) 7,384 10,253
Make-good provision (iv) (see also note 13(a)) 70,000 70,000Future stewardship services provision (see also note 13(a)) 553,262 349,100Other provisions (see also note 13(a)) 27,500 14,250Total non-current provisions 722,694 533,239
Total provisions 1,607,122 1,304,310Notes:
(ii) The amounts disclosed are nominal amounts.(iii) The amounts disclosed are discounted to present values.
(ii) Other borrowings include unsecured purchasing card transactions which are repaid within the interest-free period.
(i) Secured by the assets leased. Finance leases are interest bearing and effectively secured as the rights to the leased assets revert to thelessor in the event of default.
(i) Provisions for employee benefits consist of amounts for annual leave and long service leave accrued by employees. On-costs such asworkers compensation insurance and superannuation are not employee benefits and are reflected as a separate provision.
(iv) In accordance with the lease agreement over the principal office, the Trust must remove any leasehold improvements from the leasedpremises and restore the premises to its original condition at the end of the lease term.
Page 36
Note 13 Provisions (continued)
(a) Employee benefits and on-costs(i)
2018 2017
Current employee benefits $ $
Annual leave 355,408 300,840
Long service leave 426,357 384,778
Non-current employee benefits
Long service leave 64,548 89,636
Total employee benefits 846,313 775,254
Current on-costs 102,663 85,453
Non-current on-costs 7,384 10,253
Total on-costs 110,047 95,706
Total employee benefits and on-costs 956,360 870,960
Notes:
(b) Movement in provisions
Make-good On-costsFuture
stewardshipOther
Provisions Total2018 2018 2018 2018 2018
$ $ $ $ $Opening balance 70,000 95,706 349,100 14,250 529,056
Additional provisions recognised - 37,108 204,162 13,250 254,520Reductions arising from payments/othersacrifices of future economic benefits - (22,767) - - (22,767)
Closing balance 70,000 110,047 553,262 27,500 760,809
Current - 102,663 - - 102,663
Non-current 70,000 7,384 553,262 27,500 658,146
Closing balance 70,000 110,047 553,262 27,500 760,809
(i) Provisions for employee benefits consist of amounts for annual leave and long service leave accrued by employees. On-costs such asworkers compensation insurance and superannuation are not employee benefits and are reflected as a separate provision.
Page 37Trust for Nature Annual Report 2017-18 71

Note 14 Other liabilities
2018 2017$ $
Current other liabilities
Funds held awaiting remittance(i):
Land Conservation Strategy 14,344 14,312
Marcus Knapple 2,462 2,456
Potter Farmland 49,845 49,732
AGL – Growling Grass Frog 149,500 145,846
Hume – Native Grasslands 240,240 238,620
Pimelea Fund 512,766 579,653
Amateur Gardeners Foundation 689,646 685,369
Golden Sun Moth Conservation Fund 136,641 134,639
PTV - Biomass management study 35,709 42,442
Level Crossing Removal Authority 1,237,993 -
Landowner payments held in trust(ii) 2,319,418 1,856,838
Deferred stewardship revenue 64,997 61,018
Other project funds committed 836,537 560,913
Other revenue received in advance 4,208,915 3,014,065Total current other liabilities 10,499,013 7,385,903
Non-current other liabilitiesLandowner payments held in trust(ii) 20,776,365 16,711,547
Deferred stewardship revenue 584,970 549,165Total non-current other liabilities 21,361,335 17,260,712
Total other liabilities 31,860,348 24,646,615Notes:
(ii) Landowner payments held in trust are funds the Trust holds on behalf of third party land owners under offset arrangements payable over10 years from the date of covenant registration. Interest earned on the funds is credited to the benefit of the landowner and paid annually.
(i) Funds held awaiting remittance are funds the Trust holds on behalf of third parties for specific projects. The funds are spent inaccordance with the agreement the Trust has with the third party. Interest earned on the funds is credited to the benefit of the fund.
Page 38www.trustfornature.org.au72

Note 14 Other liabilities
2018 2017$ $
Current other liabilities
Funds held awaiting remittance(i):
Land Conservation Strategy 14,344 14,312
Marcus Knapple 2,462 2,456
Potter Farmland 49,845 49,732
AGL – Growling Grass Frog 149,500 145,846
Hume – Native Grasslands 240,240 238,620
Pimelea Fund 512,766 579,653
Amateur Gardeners Foundation 689,646 685,369
Golden Sun Moth Conservation Fund 136,641 134,639
PTV - Biomass management study 35,709 42,442
Level Crossing Removal Authority 1,237,993 -
Landowner payments held in trust(ii) 2,319,418 1,856,838
Deferred stewardship revenue 64,997 61,018
Other project funds committed 836,537 560,913
Other revenue received in advance 4,208,915 3,014,065Total current other liabilities 10,499,013 7,385,903
Non-current other liabilitiesLandowner payments held in trust(ii) 20,776,365 16,711,547
Deferred stewardship revenue 584,970 549,165Total non-current other liabilities 21,361,335 17,260,712
Total other liabilities 31,860,348 24,646,615Notes:
(ii) Landowner payments held in trust are funds the Trust holds on behalf of third party land owners under offset arrangements payable over10 years from the date of covenant registration. Interest earned on the funds is credited to the benefit of the landowner and paid annually.
(i) Funds held awaiting remittance are funds the Trust holds on behalf of third parties for specific projects. The funds are spent inaccordance with the agreement the Trust has with the third party. Interest earned on the funds is credited to the benefit of the fund.
Page 38
Note 15 Leases
Finance leases
2018 2017 2018 2017$ $ $ $
Finance lease liabilities payable- Not longer than one year 21,992 6,537 21,469 5,738
- Longer than one year and not longer than five years - 21,992 - 21,469
Minimum future lease payments 21,992 28,529 21,469 27,207- Less future finance charges (523) (1,321)
Present value of minimum lease payments 21,469 27,208 21,469 27,207
Included in the financial statements as:
- Current borrowings lease liabilities (Note 12) 21,469 5,738
- Non-current borrowings lease liabilities (Note 12) - 21,469
21,469 27,207Note:(i) Minimum future lease payments include the aggregate of all lease payments and any guaranteed residual.
Operating leases
2018 2017$ $
Non-cancellable operating lease payablesNot longer than one year 304,154 240,173
Longer than one year and not longer than five years 660,163 158,560
Total non-cancellable operating lease payables 964,317 398,733Total leases 964,317 398,733
Note 16 Commitments for expenditure
2018 2017$ $
Novated lease commitmentsPayable:Not longer than one year 19,547 19,547
Longer than one year and not longer than five years 6,516 26,062
Total novated lease commitments 26,063 45,609
Total commitments for expenditure 26,063 45,609
Finance leases relate to a motor vehicle lease held with Vicfleet Lease Management with a lease term of three years. The Trusthas an option to purchase the leased assets at expiry of the lease.Interest incurred on assets held under finance leases was $799 (2017: $983).The written down value of assets held under finance leases is $21,301 (2017: $27,010).
Minimum future leasepayments(i)
All amounts shown in the commitments note are nominal amounts inclusive of GST.
Present value of minimumfuture lease payments
Operating leases relate to office facilities with lease terms of between one and seven years and motor vehicle and IT equipmentleases with lease terms of three years. The Trust does not have an option to purchase the leased assets at lease expiry.Operating lease expenses recognised in the accounts was $347,279 (2017: $362,241).
All amounts shown in the commitments note are nominal amounts inclusive of GST.
The following commitments have not been recognised as liabilities in the financial statements:
Page 39Trust for Nature Annual Report 2017-18 73

Note 17 Contingent assets and contingent liabilitiesThere are no known contingent assets or contingent liabilities. (2017: nil).
Note 18 Financial instruments
(a) Financial risk management objectives and policies
The Trust’s principal financial instruments comprise of: – cash and deposits – investment and other financial assets – receivables (excluding statutory receivables) – payables (excluding statutory payables).
The carrying amounts of the Trust’s financial assets and financial liabilities by category are disclosed in Table 18.1.
Table 18.1: Categorisation of financial instruments
2018
Contractualfinancial
assets – loansand
receivables
Contractualfinancialassets
/liabilitiesdesignated at
fair valuethrough
profit/loss
Contractualfinancial
liabilities atamortised
cost
Total
$ $ $ $Contractual financial assets
Cash and deposits 7,937,327 7,937,327
Receivables: (i)
Sale of goods and services 6,726,213 6,726,213
Accrued investment income 263,697 263,697
Other receivables 175,075 175,075
Investments and other contractual financial assets:
Term deposits 21,586,522 21,586,522
Listed securities and managed investment schemes 11,079,615 11,079,615
Total contractual financial assets 36,688,834 11,079,615 - 47,768,449
Contractual financial liabilities
Payables (i) 651,090 651,090
Borrowings 23,523 23,523
Other financial liabilities 31,860,348 31,860,348
Total contractual financial liabilities - - 32,534,961 32,534,961
Note:(i) The total amounts disclosed here exclude statutory amounts (e.g. amounts owing from Victorian Government and GST input tax creditrecoverable and taxes payable).
The Trust’s main financial risks include credit risk, liquidity risk, interest rate risk and equity price risk. The Trust manages thesefinancial risks in accordance with its financial risk assessment reviews.
Details of the significant accounting policies and methods adopted, including the criteria for recognition, the basis ofmeasurement, and the basis on which income and expenses are recognised, with respect to each class of financial asset andfinancial liability above are disclosed in Note 1 to the financial statements.
Page 40www.trustfornature.org.au74

Note 17 Contingent assets and contingent liabilitiesThere are no known contingent assets or contingent liabilities. (2017: nil).
Note 18 Financial instruments
(a) Financial risk management objectives and policies
The Trust’s principal financial instruments comprise of: – cash and deposits – investment and other financial assets – receivables (excluding statutory receivables) – payables (excluding statutory payables).
The carrying amounts of the Trust’s financial assets and financial liabilities by category are disclosed in Table 18.1.
Table 18.1: Categorisation of financial instruments
2018
Contractualfinancial
assets – loansand
receivables
Contractualfinancialassets
/liabilitiesdesignated at
fair valuethrough
profit/loss
Contractualfinancial
liabilities atamortised
cost
Total
$ $ $ $Contractual financial assets
Cash and deposits 7,937,327 7,937,327
Receivables: (i)
Sale of goods and services 6,726,213 6,726,213
Accrued investment income 263,697 263,697
Other receivables 175,075 175,075
Investments and other contractual financial assets:
Term deposits 21,586,522 21,586,522
Listed securities and managed investment schemes 11,079,615 11,079,615
Total contractual financial assets 36,688,834 11,079,615 - 47,768,449
Contractual financial liabilities
Payables (i) 651,090 651,090
Borrowings 23,523 23,523
Other financial liabilities 31,860,348 31,860,348
Total contractual financial liabilities - - 32,534,961 32,534,961
Note:(i) The total amounts disclosed here exclude statutory amounts (e.g. amounts owing from Victorian Government and GST input tax creditrecoverable and taxes payable).
The Trust’s main financial risks include credit risk, liquidity risk, interest rate risk and equity price risk. The Trust manages thesefinancial risks in accordance with its financial risk assessment reviews.
Details of the significant accounting policies and methods adopted, including the criteria for recognition, the basis ofmeasurement, and the basis on which income and expenses are recognised, with respect to each class of financial asset andfinancial liability above are disclosed in Note 1 to the financial statements.
Page 40
Note 18 Financial instruments (continued)
Table 18.1: Categorisation of financial instruments (continued)
2017
Contractualfinancial
assets – loansand
receivables
Contractualfinancialassets
/liabilitiesdesignated at
fair valuethrough
profit/loss
Contractualfinancial
liabilities atamortised
cost
Total
$ $ $ $Contractual financial assets
Cash and deposits 4,723,575 - - 4,723,575
Receivables: (i)
Sale of goods and services 750,018 - - 750,018
Accrued investment income 260,868 - - 260,868
Other receivables 126,000 - - 126,000
Investments and other contractual financial assets:
Term deposits 27,741,114 - - 27,741,114
Listed securities and managed investment schemes - 4,627,014 - 4,627,014
Total contractual financial assets 33,601,575 4,627,014 - 38,228,589
Contractual financial liabilities
Payables (i) - - 686,043 686,043
Borrowings - - 34,912 34,912
Other financial liabilities - - 24,646,615 24,646,615
Total contractual financial liabilities - - 25,367,570 25,367,570Notes:(i) The total amounts disclosed here exclude statutory amounts (e.g. amounts owing from Victorian Government and GST input tax creditrecoverable and taxes payable).
Page 41Trust for Nature Annual Report 2017-18 75

Note 18 Financial instruments (continued)
Table 18.2: Net holding gain/(loss) on financial instruments by category(i)
2018Net holdinggain/(loss)
Total dividendincome
Total interestincome/
(expense)
Impairmentloss
Total
$ $ $ $ $Contractual financial assetsFinancial assets – loans and receivables 783,512 783,512Financial assets designated at fair valuethrough profit/loss 191,937 272,612 464,549
Total contractual financial assets 191,937 272,612 783,512 - 1,248,061
Contractual financial liabilities
Financial liabilities at amortised cost (469,165) (469,165)
Total contractual financial liabilities - - (469,165) - (469,165)Notes:
2017Net holdinggain/(loss)
Total dividendincome
Total interestincome/
(expense)
Impairmentloss
Total
$ $ $ $ $Contractual financial assetsFinancial assets – loans and receivables 854,116 - 854,116Financial assets designated at fair valuethrough profit/loss 264,826 159,473 - - 424,299
Total contractual financial assets 264,826 159,473 854,116 - 1,278,415
Contractual financial liabilities
Financial liabilities at amortised cost - - (522,221) - (522,221)
Total contractual financial liabilities - - (522,221) - (522,221)
The net holding gains or losses disclosed above are determined as follows:
(i) Amounts disclosed in this table exclude holding gains and losses related to statutory financial assets and liabilities.
– For financial liabilities measured at amortised cost, the net gain or loss is calculated by taking the interest expense, plus orminus foreign exchange gains or losses arising from revaluation of the financial liabilities measured at amortised cost.
– For cash and cash equivalents and loans or receivables, the net gain or loss is calculated by taking the interest revenue,plus dividend revenue, plus or minus foreign exchange gains or losses arising from revaluation of the financial assets, andminus any impairment recognised in the net result.
Page 42www.trustfornature.org.au76
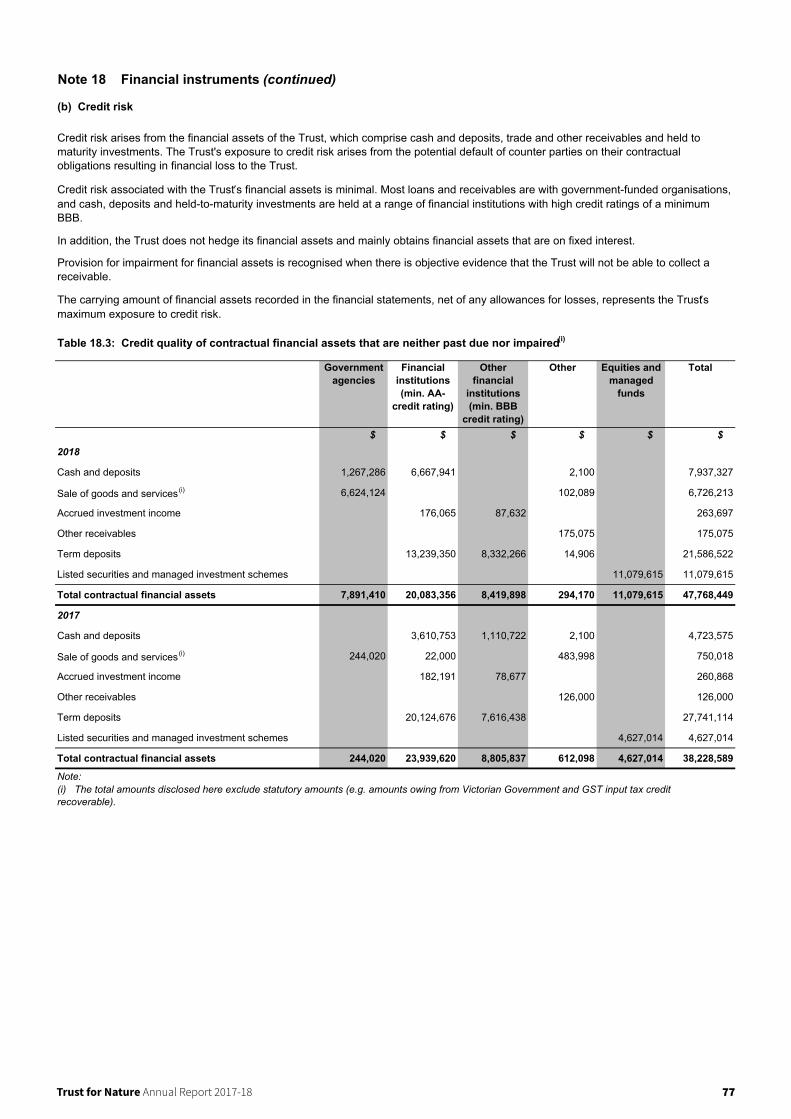
Note 18 Financial instruments (continued)
(b) Credit risk
Table 18.3: Credit quality of contractual financial assets that are neither past due nor impaired(i)
Governmentagencies
Financialinstitutions(min. AA-
credit rating)
Otherfinancial
institutions(min. BBB
credit rating)
Other Equities andmanaged
funds
Total
$ $ $ $ $ $2018
Cash and deposits 1,267,286 6,667,941 2,100 7,937,327
Sale of goods and services(i) 6,624,124 102,089 6,726,213
Accrued investment income 176,065 87,632 263,697
Other receivables 175,075 175,075
Term deposits 13,239,350 8,332,266 14,906 21,586,522
Listed securities and managed investment schemes 11,079,615 11,079,615
Total contractual financial assets 7,891,410 20,083,356 8,419,898 294,170 11,079,615 47,768,449
2017
Cash and deposits 3,610,753 1,110,722 2,100 4,723,575
Sale of goods and services(i) 244,020 22,000 483,998 750,018
Accrued investment income 182,191 78,677 260,868
Other receivables 126,000 126,000
Term deposits 20,124,676 7,616,438 27,741,114
Listed securities and managed investment schemes 4,627,014 4,627,014
Total contractual financial assets 244,020 23,939,620 8,805,837 612,098 4,627,014 38,228,589
Note:(i) The total amounts disclosed here exclude statutory amounts (e.g. amounts owing from Victorian Government and GST input tax creditrecoverable).
Credit risk arises from the financial assets of the Trust, which comprise cash and deposits, trade and other receivables and held tomaturity investments. The Trust's exposure to credit risk arises from the potential default of counter parties on their contractualobligations resulting in financial loss to the Trust.
Credit risk associated with the Trust’s financial assets is minimal. Most loans and receivables are with government-funded organisations,and cash, deposits and held-to-maturity investments are held at a range of financial institutions with high credit ratings of a minimumBBB.Financial assets available-for-sale includes managed investments which are managed by JBWere and listed securities.In addition, the Trust does not hedge its financial assets and mainly obtains financial assets that are on fixed interest.
Provision for impairment for financial assets is recognised when there is objective evidence that the Trust will not be able to collect areceivable.
The carrying amount of financial assets recorded in the financial statements, net of any allowances for losses, represents the Trust’smaximum exposure to credit risk.
Page 43
Trust for Nature Annual Report 2017-18 77
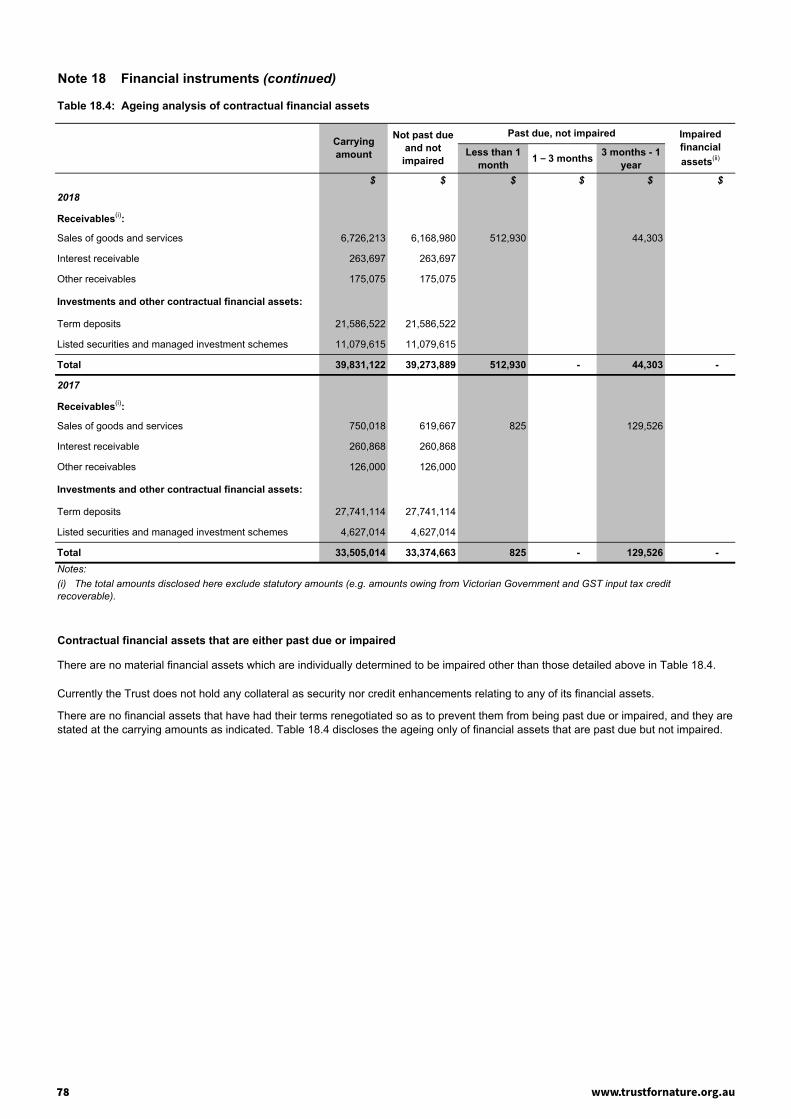
Note 18 Financial instruments (continued)
Table 18.4: Ageing analysis of contractual financial assets
Less than 1month 1 – 3 months 3 months - 1
year$ $ $ $ $ $
2018
Receivables(i):
Sales of goods and services 6,726,213 6,168,980 512,930 44,303
Interest receivable 263,697 263,697
Other receivables 175,075 175,075
Investments and other contractual financial assets:
Term deposits 21,586,522 21,586,522
Listed securities and managed investment schemes 11,079,615 11,079,615
Total 39,831,122 39,273,889 512,930 - 44,303 -
2017
Receivables(i):
Sales of goods and services 750,018 619,667 825 129,526
Interest receivable 260,868 260,868
Other receivables 126,000 126,000
Investments and other contractual financial assets:
Term deposits 27,741,114 27,741,114
Listed securities and managed investment schemes 4,627,014 4,627,014
Total 33,505,014 33,374,663 825 - 129,526 -Notes:
Contractual financial assets that are either past due or impaired
Page 44
Past due, not impaired
There are no material financial assets which are individually determined to be impaired other than those detailed above in Table 18.4.
Currently the Trust does not hold any collateral as security nor credit enhancements relating to any of its financial assets.
There are no financial assets that have had their terms renegotiated so as to prevent them from being past due or impaired, and they arestated at the carrying amounts as indicated. Table 18.4 discloses the ageing only of financial assets that are past due but not impaired.
Not past dueand not
impaired
(i) The total amounts disclosed here exclude statutory amounts (e.g. amounts owing from Victorian Government and GST input tax creditrecoverable).
Impairedfinancialassets(ii)
Carryingamount
www.trustfornature.org.au78

Note 18 Financial instruments (continued)
Table 18.4: Ageing analysis of contractual financial assets
Less than 1month 1 – 3 months 3 months - 1
year$ $ $ $ $ $
2018
Receivables(i):
Sales of goods and services 6,726,213 6,168,980 512,930 44,303
Interest receivable 263,697 263,697
Other receivables 175,075 175,075
Investments and other contractual financial assets:
Term deposits 21,586,522 21,586,522
Listed securities and managed investment schemes 11,079,615 11,079,615
Total 39,831,122 39,273,889 512,930 - 44,303 -
2017
Receivables(i):
Sales of goods and services 750,018 619,667 825 129,526
Interest receivable 260,868 260,868
Other receivables 126,000 126,000
Investments and other contractual financial assets:
Term deposits 27,741,114 27,741,114
Listed securities and managed investment schemes 4,627,014 4,627,014
Total 33,505,014 33,374,663 825 - 129,526 -Notes:
Contractual financial assets that are either past due or impaired
Page 44
Past due, not impaired
There are no material financial assets which are individually determined to be impaired other than those detailed above in Table 18.4.
Currently the Trust does not hold any collateral as security nor credit enhancements relating to any of its financial assets.
There are no financial assets that have had their terms renegotiated so as to prevent them from being past due or impaired, and they arestated at the carrying amounts as indicated. Table 18.4 discloses the ageing only of financial assets that are past due but not impaired.
Not past dueand not
impaired
(i) The total amounts disclosed here exclude statutory amounts (e.g. amounts owing from Victorian Government and GST input tax creditrecoverable).
Impairedfinancialassets(ii)
Carryingamount
Note 18 Financial instruments (continued)
(c) Liquidity risk
The following tables disclose the contractual maturity analysis for the Trust’s contractual financial liabilities.
Table 18.5: Maturity analysis of contractual financial liabilities(ii)
Less than 1month
1 month to 1year 1 year or more
$ $ $ $ $2018
Payables(i):
Contractual payables at amortised cost 651,090 651,090 563,045 88,045
Other financial liabilities at amortised cost 31,860,348 31,860,348 1,452,805 9,036,368 21,371,175
Borrowings:
Lease liabilities 21,469 21,469 1,789 19,680
Other borrowings 2,054 2,054 2,054
Total 32,534,961 32,534,961 2,019,693 9,144,093 21,371,175
2017
Payables(i):
Contractual payables at amortised cost 686,043 686,043 605,216 80,827
Other financial liabilities at amortised cost 24,646,615 24,646,615 1,025,017 6,360,887 17,260,711
Borrowings:
Lease liabilities 27,207 27,207 478 5,260 21,469
Other borrowings 7,705 7,705 7,705
Total 25,367,570 25,367,570 1,638,416 6,446,974 17,282,180Notes:
(ii) Maturity analysis is presented using the undiscounted cash flows.
(d) Market risk
Interest rate risk
Equity price risk
The Trust’s exposure to equity price risk is set out in Table 18.7.
Carryingamount
Nominalamount
Maturity dates
Liquidity risk arises when the Trust is unable to meet its financial obligations as they fall due. The Trust operates under theGovernment fair payments policy of settling financial obligations within 30 days and in the event of a dispute, making paymentswithin 30 days from the date of resolution. It also continuously manages risk through monitoring future cash flows and maturitiesplanning to ensure adequate holding of high quality liquid assets.
Maximum exposure to liquidity risk is the carrying amounts of financial liabilities as disclosed in the face of the Balance Sheet.
The Trust’s exposures to market risk are primarily through interest rate risk and equity price risks. Objectives, policies andprocesses used to manage each of these risks are disclosed in the paragraphs below.
(i) The carrying amount of financial liabilities disclosed here excludes statutory payables (e.g. taxes payable).
The carrying amounts of financial assets and financial liabilities that are exposed to interest rates are set out in Table 18.6. Inaddition, the Trust’s sensitivity to interest rate risk is set out in Table 18.7.
The Trust’s exposure to liquidity risk is deemed insignificant. Cash for unexpected events is generally sourced from funds heldat call.
The Trust manages interest rate risk by undertaking fixed rate financial instruments with maturity profiles mostly spread over 3to 24 months. The Trust does not enter into interest rate swaps.
The Trust is exposed to equity price risk through investments in managed investment schemes which are invested indomestically traded securities and managed funds. The value of dividend income and imputation credits will also vary. Themanaged investment schemes are administered by JB Were. The fund manager on behalf of the Trust closely monitorsperformance and manages the equity price risk through diversification of its investment portfolio. Direct equity investments aresometimes received from bequests and are liquidated once registered ownership is received.
Page 45Trust for Nature Annual Report 2017-18 79

Note 18 Financial instruments (continued)
Table 18.6: Interest rate exposure of financial instruments
Fixed interestrate
Variableinterest rate
Non-interestbearing
2018 % $ $ $ $Financial assets
Cash and deposits 2.17% 7,937,327 7,888,020 49,307
Receivables(i):
Sale of goods and services 6,726,213 6,726,213
Accrued investment income 263,697 263,697
Other receivables 175,075 175,075Investments and other contractual financialassets:
Term deposits 2.66% 21,586,522 21,571,616 14,906Listed securities and managed investmentschemes 2.02% 11,079,615 800,000 612,767 9,666,848
Total financial assets 47,768,449 22,371,616 8,515,693 16,881,140
Financial liabilities
Payables(i):Payables 2.40% 651,090 371,005 280,085
Borrowings 3.25% 23,523 21,469 2,054
Other financial liabilities(ii) 2.40% 31,860,348 26,164,929 5,695,419
Total financial liabilities 32,534,961 26,186,398 373,059 5,975,504
2017
Financial assets
Cash and cash equivalents 1.00% 4,723,575 4,502,343 221,232
Receivables(i):
Sale of goods and services 750,018 750,018
Accrued investment income 260,868 260,868
Other receivables 126,000 126,000Investments and other contractual financialassets:
Term deposits 2.68% 27,741,114 27,741,114Listed securities and managed investmentschemes 0.65% 4,627,014 1,001,295 3,625,719
Total financial assets 38,228,589 27,741,114 5,503,638 4,983,837
Financial liabilities
Payables(i):Payables 2.52% 686,043 464,395 221,648
Borrowings 3.25% 34,912 27,207 7,705
Other financial liabilities(ii) 2.52% 24,646,615 20,461,454 4,185,161
Total financial liabilities 25,367,570 20,488,661 472,100 4,406,809Notes:
Weightedaverageeffective
interest rate
Interest rate exposureCarryingamount
(ii) Weighted average effective interest rate reflects the interest earned and allocated to trust funds held in accordance with the variousagreements.
(i) The carrying amounts disclosed here exclude statutory amounts (e.g. amounts owing from Victorian Government, GST input tax creditrecoverable, and GST payables).
Page 46
Note 18 Financial instruments (continued)
Sensitivity disclosure analysis and assumptions
• a movement of 50 basis points up and down (2017: 50 basis points up and down) in market interest rates (AUD) • a movement of 10 per cent up and down (2017: 10 per cent) for the top ASX 200 index.
Table 18.7: Market risk exposure
- 0.5 per cent +0.5 per cent - 10 per cent +10 per cent
Net result Net result Net result Net result2018 $ $ $ $ $Contractual financial assets
Cash and cash equivalents 7,937,327 (39,440) 39,440 - -
Receivables:
Sale of goods and services 6,726,213 - - - -
Accrued investment income 263,697 - - - -
Other receivables 175,075 - - - -Investments and other contractual financialassets:
Term deposits 21,586,522 (107,933) 107,933 - -Listed securities and managed investmentschemes(i) 11,079,615 (7,064) 7,064 (966,685) 966,685
Total impact 47,768,449 (154,437) 154,437 (966,685) 966,685
- 0.5 per cent + 0.5 per cent - 10 per cent +10 per cent
Net result Net result Net result Net result2017 $ $ $ $ $Contractual financial assets
Cash and cash equivalents 4,723,575 (22,512) 22,512 - -
Receivables:
Sale of goods and services 750,018 - - - -
Accrued investment income 260,868 - - - -
Other receivables 126,000 - - - -Investments and other contractual financialassets:
Term deposits 27,741,114 (138,706) 138,706 - -Listed securities and managed investmentschemes(i) 4,627,014 (5,006) 5,006 (362,572) 362,572
Total impact 38,228,589 (166,224) 166,224 (362,572) 362,572Note:
Interest rate risk Other price risk
Interest rate risk
(i) Non-interest bearing managed funds include $4,029,190 of domestic equities and managed funds (2017: $2,897,401), $415,192 of fixedinterest trusts (2017: $728,319) and $5,222,466 of fixed income securities (2017: nil).
Table 18.7 discloses the material impact on net result and equity for each category of financial instrument held by the Trust atyear-end if the above movements were to occur.
Carryingamount
Other price riskCarryingamount
The Trust’s sensitivity to market risk is determined based on the observed range of actual historical data for the preceding five-year period, with all variables other than the primary risk variable held constant. The Trust’s fund managers cannot be expectedto predict movements in market rates and prices and sensitivity analyses shown are for illustrative purposes only. The followingmovements are ‘reasonably possible’ over the next 12 months:
Page 47www.trustfornature.org.au80

Note 18 Financial instruments (continued)
Table 18.6: Interest rate exposure of financial instruments
Fixed interestrate
Variableinterest rate
Non-interestbearing
2018 % $ $ $ $Financial assets
Cash and deposits 2.17% 7,937,327 7,888,020 49,307
Receivables(i):
Sale of goods and services 6,726,213 6,726,213
Accrued investment income 263,697 263,697
Other receivables 175,075 175,075Investments and other contractual financialassets:
Term deposits 2.66% 21,586,522 21,571,616 14,906Listed securities and managed investmentschemes 2.02% 11,079,615 800,000 612,767 9,666,848
Total financial assets 47,768,449 22,371,616 8,515,693 16,881,140
Financial liabilities
Payables(i):Payables 2.40% 651,090 371,005 280,085
Borrowings 3.25% 23,523 21,469 2,054
Other financial liabilities(ii) 2.40% 31,860,348 26,164,929 5,695,419
Total financial liabilities 32,534,961 26,186,398 373,059 5,975,504
2017
Financial assets
Cash and cash equivalents 1.00% 4,723,575 4,502,343 221,232
Receivables(i):
Sale of goods and services 750,018 750,018
Accrued investment income 260,868 260,868
Other receivables 126,000 126,000Investments and other contractual financialassets:
Term deposits 2.68% 27,741,114 27,741,114Listed securities and managed investmentschemes 0.65% 4,627,014 1,001,295 3,625,719
Total financial assets 38,228,589 27,741,114 5,503,638 4,983,837
Financial liabilities
Payables(i):Payables 2.52% 686,043 464,395 221,648
Borrowings 3.25% 34,912 27,207 7,705
Other financial liabilities(ii) 2.52% 24,646,615 20,461,454 4,185,161
Total financial liabilities 25,367,570 20,488,661 472,100 4,406,809Notes:
Weightedaverageeffective
interest rate
Interest rate exposureCarryingamount
(ii) Weighted average effective interest rate reflects the interest earned and allocated to trust funds held in accordance with the variousagreements.
(i) The carrying amounts disclosed here exclude statutory amounts (e.g. amounts owing from Victorian Government, GST input tax creditrecoverable, and GST payables).
Page 46
Note 18 Financial instruments (continued)
Sensitivity disclosure analysis and assumptions
• a movement of 50 basis points up and down (2017: 50 basis points up and down) in market interest rates (AUD) • a movement of 10 per cent up and down (2017: 10 per cent) for the top ASX 200 index.
Table 18.7: Market risk exposure
- 0.5 per cent +0.5 per cent - 10 per cent +10 per cent
Net result Net result Net result Net result2018 $ $ $ $ $Contractual financial assets
Cash and cash equivalents 7,937,327 (39,440) 39,440 - -
Receivables:
Sale of goods and services 6,726,213 - - - -
Accrued investment income 263,697 - - - -
Other receivables 175,075 - - - -Investments and other contractual financialassets:
Term deposits 21,586,522 (107,933) 107,933 - -Listed securities and managed investmentschemes(i) 11,079,615 (7,064) 7,064 (966,685) 966,685
Total impact 47,768,449 (154,437) 154,437 (966,685) 966,685
- 0.5 per cent + 0.5 per cent - 10 per cent +10 per cent
Net result Net result Net result Net result2017 $ $ $ $ $Contractual financial assets
Cash and cash equivalents 4,723,575 (22,512) 22,512 - -
Receivables:
Sale of goods and services 750,018 - - - -
Accrued investment income 260,868 - - - -
Other receivables 126,000 - - - -Investments and other contractual financialassets:
Term deposits 27,741,114 (138,706) 138,706 - -Listed securities and managed investmentschemes(i) 4,627,014 (5,006) 5,006 (362,572) 362,572
Total impact 38,228,589 (166,224) 166,224 (362,572) 362,572Note:
Interest rate risk Other price risk
Interest rate risk
(i) Non-interest bearing managed funds include $4,029,190 of domestic equities and managed funds (2017: $2,897,401), $415,192 of fixedinterest trusts (2017: $728,319) and $5,222,466 of fixed income securities (2017: nil).
Table 18.7 discloses the material impact on net result and equity for each category of financial instrument held by the Trust atyear-end if the above movements were to occur.
Carryingamount
Other price riskCarryingamount
The Trust’s sensitivity to market risk is determined based on the observed range of actual historical data for the preceding five-year period, with all variables other than the primary risk variable held constant. The Trust’s fund managers cannot be expectedto predict movements in market rates and prices and sensitivity analyses shown are for illustrative purposes only. The followingmovements are ‘reasonably possible’ over the next 12 months:
Page 47Trust for Nature Annual Report 2017-18 81
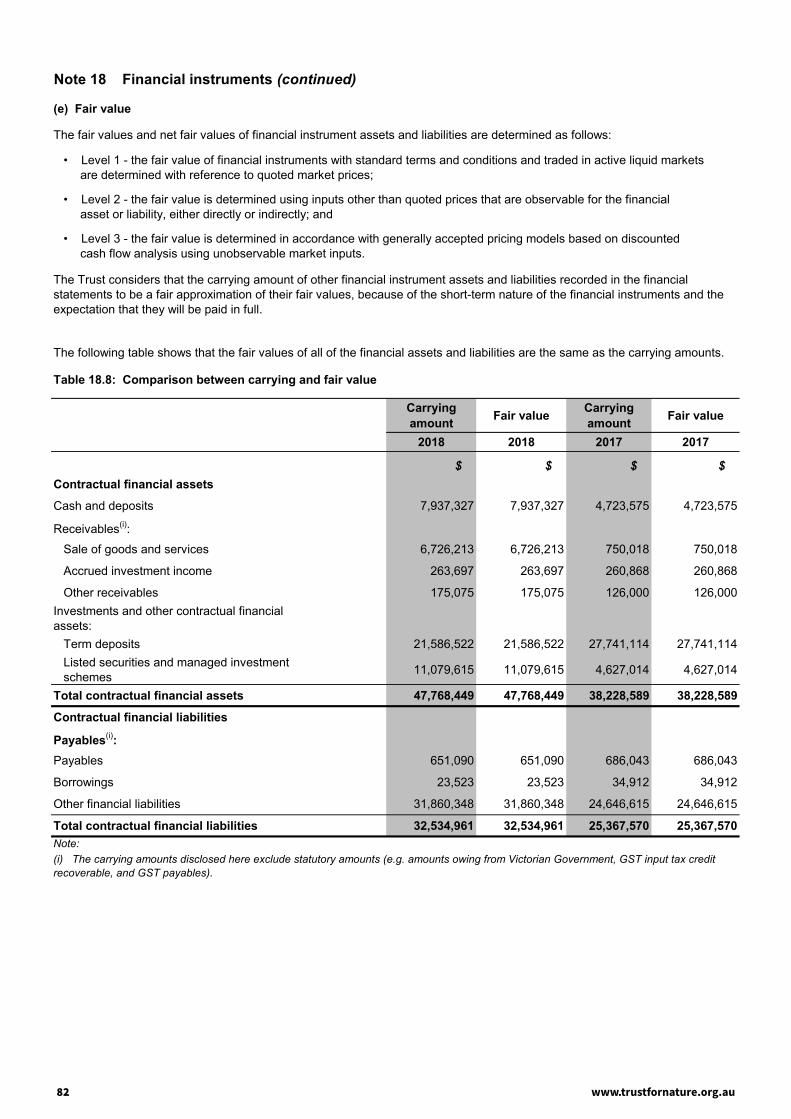
Note 18 Financial instruments (continued)
(e) Fair value
Table 18.8: Comparison between carrying and fair value
Carryingamount Fair value Carrying
amount Fair value
2018 2018 2017 2017
$ $ $ $Contractual financial assets
Cash and deposits 7,937,327 7,937,327 4,723,575 4,723,575
Receivables(i):
Sale of goods and services 6,726,213 6,726,213 750,018 750,018
Accrued investment income 263,697 263,697 260,868 260,868
Other receivables 175,075 175,075 126,000 126,000Investments and other contractual financialassets:
Term deposits 21,586,522 21,586,522 27,741,114 27,741,114Listed securities and managed investmentschemes 11,079,615 11,079,615 4,627,014 4,627,014
Total contractual financial assets 47,768,449 47,768,449 38,228,589 38,228,589
Contractual financial liabilities
Payables(i):Payables 651,090 651,090 686,043 686,043
Borrowings 23,523 23,523 34,912 34,912
Other financial liabilities 31,860,348 31,860,348 24,646,615 24,646,615
Total contractual financial liabilities 32,534,961 32,534,961 25,367,570 25,367,570Note:
The fair values and net fair values of financial instrument assets and liabilities are determined as follows:
• Level 1 - the fair value of financial instruments with standard terms and conditions and traded in active liquid markets are determined with reference to quoted market prices;
(i) The carrying amounts disclosed here exclude statutory amounts (e.g. amounts owing from Victorian Government, GST input tax creditrecoverable, and GST payables).
The Trust considers that the carrying amount of other financial instrument assets and liabilities recorded in the financialstatements to be a fair approximation of their fair values, because of the short-term nature of the financial instruments and theexpectation that they will be paid in full.
• Level 3 - the fair value is determined in accordance with generally accepted pricing models based on discounted cash flow analysis using unobservable market inputs.
The following table shows that the fair values of all of the financial assets and liabilities are the same as the carrying amounts.
• Level 2 - the fair value is determined using inputs other than quoted prices that are observable for the financial asset or liability, either directly or indirectly; and
Page 48www.trustfornature.org.au82
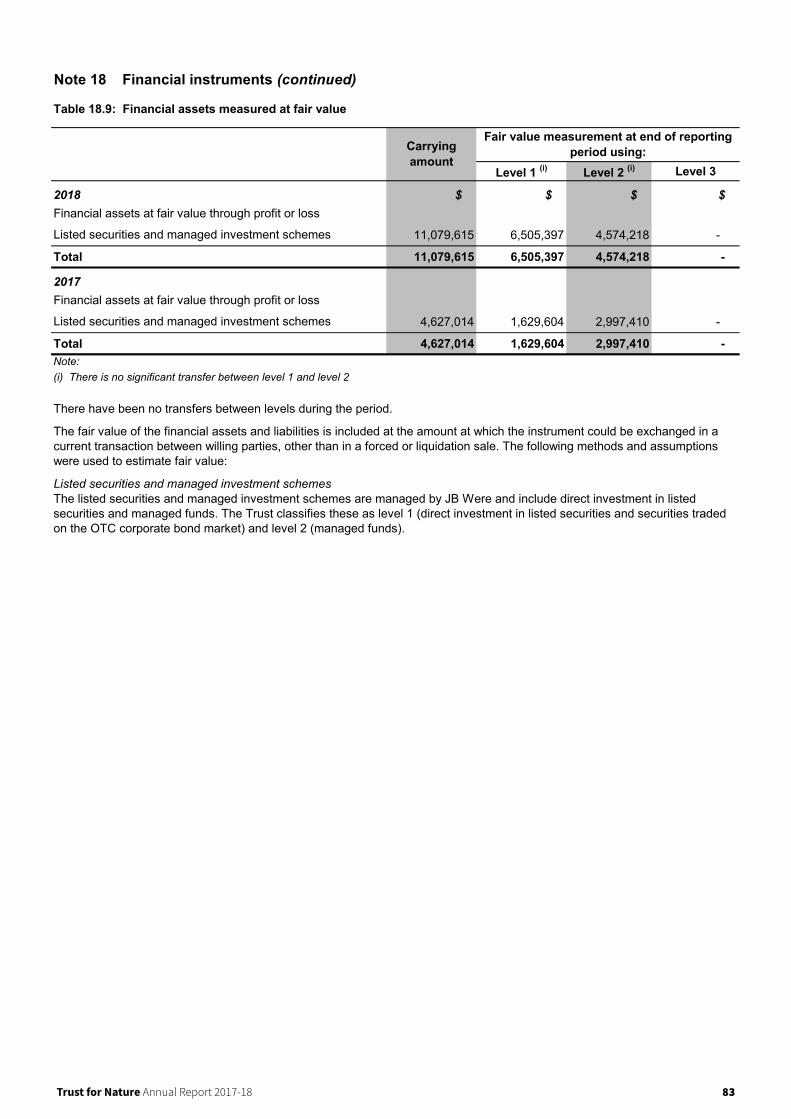
Note 18 Financial instruments (continued)
(e) Fair value
Table 18.8: Comparison between carrying and fair value
Carryingamount Fair value Carrying
amount Fair value
2018 2018 2017 2017
$ $ $ $Contractual financial assets
Cash and deposits 7,937,327 7,937,327 4,723,575 4,723,575
Receivables(i):
Sale of goods and services 6,726,213 6,726,213 750,018 750,018
Accrued investment income 263,697 263,697 260,868 260,868
Other receivables 175,075 175,075 126,000 126,000Investments and other contractual financialassets:
Term deposits 21,586,522 21,586,522 27,741,114 27,741,114Listed securities and managed investmentschemes 11,079,615 11,079,615 4,627,014 4,627,014
Total contractual financial assets 47,768,449 47,768,449 38,228,589 38,228,589
Contractual financial liabilities
Payables(i):Payables 651,090 651,090 686,043 686,043
Borrowings 23,523 23,523 34,912 34,912
Other financial liabilities 31,860,348 31,860,348 24,646,615 24,646,615
Total contractual financial liabilities 32,534,961 32,534,961 25,367,570 25,367,570Note:
The fair values and net fair values of financial instrument assets and liabilities are determined as follows:
• Level 1 - the fair value of financial instruments with standard terms and conditions and traded in active liquid markets are determined with reference to quoted market prices;
(i) The carrying amounts disclosed here exclude statutory amounts (e.g. amounts owing from Victorian Government, GST input tax creditrecoverable, and GST payables).
The Trust considers that the carrying amount of other financial instrument assets and liabilities recorded in the financialstatements to be a fair approximation of their fair values, because of the short-term nature of the financial instruments and theexpectation that they will be paid in full.
• Level 3 - the fair value is determined in accordance with generally accepted pricing models based on discounted cash flow analysis using unobservable market inputs.
The following table shows that the fair values of all of the financial assets and liabilities are the same as the carrying amounts.
• Level 2 - the fair value is determined using inputs other than quoted prices that are observable for the financial asset or liability, either directly or indirectly; and
Page 48
Note 18 Financial instruments (continued)
Table 18.9: Financial assets measured at fair value
Level 1 (i) Level 2 (i) Level 3
2018 $ $ $ $Financial assets at fair value through profit or loss
11,079,615 6,505,397 4,574,218 -
Total 11,079,615 6,505,397 4,574,218 -
2017Financial assets at fair value through profit or loss
4,627,014 1,629,604 2,997,410 -
Total 4,627,014 1,629,604 2,997,410 -Note:
Listed securities and managed investment schemes
Carryingamount
Fair value measurement at end of reportingperiod using:
(i) There is no significant transfer between level 1 and level 2
There have been no transfers between levels during the period.
The fair value of the financial assets and liabilities is included at the amount at which the instrument could be exchanged in acurrent transaction between willing parties, other than in a forced or liquidation sale. The following methods and assumptionswere used to estimate fair value:
The listed securities and managed investment schemes are managed by JB Were and include direct investment in listedsecurities and managed funds. The Trust classifies these as level 1 (direct investment in listed securities and securities tradedon the OTC corporate bond market) and level 2 (managed funds).
Listed securities and managed investment schemes
Listed securities and managed investment schemes
Page 49Trust for Nature Annual Report 2017-18 83

Note 19 Cash flow information
(a) Reconciliation of cash and cash equivalents
2018 2017$ $
Cash on hand 2,100 2,100
Cash at bank 47,207 219,132
Cash on deposit at call 1,688,020 3,391,621
Australian dollar term deposits < 3 months 6,200,000 1,110,722
Balance as per cash flow statement 7,937,327 4,723,575
(b) Reconciliation of net result for the period to net cash flows from operating activities
2018 2017$ $
Net result for the period 376,683 (470,183)
Non-cash movements:
(Gain)/loss on sale of non-current assets (554,093) (9,608)
(Gain)/loss on other financial assets held at fair value (191,937) (264,826)
Depreciation and amortisation of non-current assets 302,539 280,424
Movements in assets and liabilities:
(Increase)/decrease in receivables – Sale of goods and services (730,606) 624,143
(Increase)/decrease in interest receivable (2,829) 89,202
(Increase)/decrease in other assets (221,340) (213,768)
Increase/(decrease) in payables (47,905) (213,076)
Increase (decrease) in provisions 302,812 261,562
Increase/(decrease) in other liabilities 1,878,230 536,277
Net cash flows from/(used in) operating activities 1,111,554 620,147
Page 50www.trustfornature.org.au84

Note 20 Reserves
2018 2017$ $
Physical asset revaluation surplus (i)
Balance at the beginning of the financial year 14,802,806 15,569,706
Revaluation increments/(decrements) - (766,900)
Balance at the end of the financial year 14,802,806 14,802,806Donations surplus (ii)
Balance at the beginning of the financial year 3,084,230 3,421,388
Transfers to/(from) accumulated surplus:
Investment income earned on funds held less administration fee (401) 20,096
Donations for reserve and sale of properties 1,627,869 303,818
Funds appropriated and properties acquired (433,186) (661,072)
Balance at the end of the financial year 4,278,512 3,084,230Covenant stewardship surplus (iii)
Balance at the beginning of the financial year 1,577,326 1,580,731
Transfers to/(from) accumulated surplus:
Investment income earned on funds held less administration fee 77,500 55,653
Surpluses transferred for future covenant monitoring 18,600 42,164
Funds appropriated on covenant monitoring program (99,610) (101,222)
Balance at the end of the financial year 1,573,816 1,577,326Properties surplus (iv)
Balance at the beginning of the financial year 406,248 406,248
Balance at the end of the financial year 406,248 406,248Bequest surplus (v)
Balance at the beginning of the financial year 1,238,078 1,697,023
Transfers to/(from) accumulated surplus:
Investment income earned on funds held less administration fee 35,939 31,007
Funds appropriated (56,325) (489,952)
Balance at the end of the financial year 1,217,692 1,238,078Total reserves 22,279,074 21,108,688Notes:
(v) Bequest surplus funds are held in trust for specified purposes.
(iii) The covenant stewardship surplus is for monitoring of covenanted properties and approved management expenditure. The Trust hasadopted the policy of transferring $600 for each new covenant to the covenant stewardship reserve.(iv) The properties surplus is for property purchases and management, educational and legal costs for Trust properties.
(ii) Donations surplus funds are derived from Government grants and donations from other organisations or individuals. These donations aredirected towards property purchases or are held in trust for specified purposes.
(i) The physical asset revaluation surplus records increments and decrements on the revaluation of non-current assets.
Page 51Trust for Nature Annual Report 2017-18 85

Note 21 Accumulated surplus
2018 2017$ $
Accumulated surplus at the beginning of the financial year 12,135,301 11,805,976
Transfers (to)/from reserves:
Donations reserve (1,194,282) 337,158
Covenant stewardship reserve 3,510 3,405
Bequest reserve 20,386 458,945
Net result for the reporting period 376,683 (470,183)
Accumulated surplus at the end of the financial year 11,341,598 12,135,301
Note 22 Responsible persons
NamesThe persons who held the positions of Ministers and Accountable Officers in the Trust are as follows:
Responsible Minister:Hon Lily D’Ambrosio MP, Minister for Energy, Environment and Climate Change 1 July 2017 to 30 June 2018
Governing Board of Trustees:Max Ervin (Chairman to 22 August 2017) 1 July 2017 to 22 August 2017Geoff Driver (Deputy Chairman, Chairman from 23 August 2017) 1 July 2017 to 30 June 2018Dr Gregory Moore 1 July 2017 to 22 August 2017Gayle Austen 1 July 2017 to 30 June 2018Carol Bennetto 1 July 2017 to 30 June 2018Charles Meredith 1 July 2017 to 30 June 2018Amanda Noble 1 July 2017 to 30 June 2018James Bentley 23 August 2017 to 30 June 2018Dr Sandra Brizga 23 August 2017 to 30 June 2018Katherine Cary 23 August 2017 to 30 June 2018Dr Georgia Garrard 23 August 2017 to 30 June 2018Binda Gokhale 23 August 2017 to 30 June 2018
The Trust for Nature (Victoria) Board is established under the Victorian Conservation Trust Act 1972 .
Chief Executive Officer (Accountable Officer):Victoria Marles 1 July 2017 to 30 June 2018
Amounts relating to Ministers are disclosed in the financial report of the Department of Parliamentary Services.
Remuneration
2018No.
2017No.
Income bandless than $9,999 12 10
Remuneration received or receivable by the Accountable Officer during the reporting period was in the range:2018
No.2017
No.Income band$200,000 - $209,999 1 1
In accordance with the Ministerial Directions issued by the Minister of Finance under the Financial Management Act 1994 , thefollowing disclosures are made regarding responsible persons for the reporting period.
Remuneration received or receivable by the Trustees is in the range $357 - $432 per sitting (2016-17: $414 - $500). Trusteesmay elect to receive sitting fees. Total sitting fees paid in 2017-18 were $28,085 ( 2016-17: $29,270). The remuneration of theTrustees fell within the band:
Page 52www.trustfornature.org.au86

Note 21 Accumulated surplus
2018 2017$ $
Accumulated surplus at the beginning of the financial year 12,135,301 11,805,976
Transfers (to)/from reserves:
Donations reserve (1,194,282) 337,158
Covenant stewardship reserve 3,510 3,405
Bequest reserve 20,386 458,945
Net result for the reporting period 376,683 (470,183)
Accumulated surplus at the end of the financial year 11,341,598 12,135,301
Note 22 Responsible persons
NamesThe persons who held the positions of Ministers and Accountable Officers in the Trust are as follows:
Responsible Minister:Hon Lily D’Ambrosio MP, Minister for Energy, Environment and Climate Change 1 July 2017 to 30 June 2018
Governing Board of Trustees:Max Ervin (Chairman to 22 August 2017) 1 July 2017 to 22 August 2017Geoff Driver (Deputy Chairman, Chairman from 23 August 2017) 1 July 2017 to 30 June 2018Dr Gregory Moore 1 July 2017 to 22 August 2017Gayle Austen 1 July 2017 to 30 June 2018Carol Bennetto 1 July 2017 to 30 June 2018Charles Meredith 1 July 2017 to 30 June 2018Amanda Noble 1 July 2017 to 30 June 2018James Bentley 23 August 2017 to 30 June 2018Dr Sandra Brizga 23 August 2017 to 30 June 2018Katherine Cary 23 August 2017 to 30 June 2018Dr Georgia Garrard 23 August 2017 to 30 June 2018Binda Gokhale 23 August 2017 to 30 June 2018
The Trust for Nature (Victoria) Board is established under the Victorian Conservation Trust Act 1972 .
Chief Executive Officer (Accountable Officer):Victoria Marles 1 July 2017 to 30 June 2018
Amounts relating to Ministers are disclosed in the financial report of the Department of Parliamentary Services.
Remuneration
2018No.
2017No.
Income bandless than $9,999 12 10
Remuneration received or receivable by the Accountable Officer during the reporting period was in the range:2018
No.2017
No.Income band$200,000 - $209,999 1 1
In accordance with the Ministerial Directions issued by the Minister of Finance under the Financial Management Act 1994 , thefollowing disclosures are made regarding responsible persons for the reporting period.
Remuneration received or receivable by the Trustees is in the range $357 - $432 per sitting (2016-17: $414 - $500). Trusteesmay elect to receive sitting fees. Total sitting fees paid in 2017-18 were $28,085 ( 2016-17: $29,270). The remuneration of theTrustees fell within the band:
Page 52
Note 23 Remuneration of executives
Other long-term benefits include long service leave, other long service benefits or deferred compensation.Termination benefits include termination of employment payments, such as severance packages.
2018 2017
$ $Short-term employee benefits 140,078 135,241Post-employment benefits 12,517 12,466Other long-term benefits 4,232 4,014Total remuneration (a) 156,827 151,721Total number of executives 1 1Total annualised employee equivalents (b) 1 1Notes:
Note 24 Related parties
The Trust is a wholly owned and controlled entity of the State of Victoria.
Related parties of the Trust include:
All related party transactions have been entered into on an arm’s length basis.
Significant transactions with government-related entities
The Trust received funding from government-related entities of $3,776,691 (2017: $3,544,451).
During the year, the Trust had the following government-related entity transactions: - Department of Environment, Land, Water and Planning - Operating grant recurrent $417,000 (2017: $435,000); - Department of Environment, Land, Water and Planning - Operating grant non-recurrent $1,050,000 (2017: $1,050,000); - State Government grants $2,309,774 (2017: $1,909,451); and - State Government grants used to acquire properties $nil (2017: $150,000).
The number of executive officers, other than ministers and accountable officers, and their total remuneration during thereporting period are shown in the table below. Total annualised employee equivalents provides a measure of full time equivalentexecutive officers over the reporting period.Remuneration comprises employee benefits in all forms of consideration paid, payable or provided by the entity, or on behalf ofthe entity, in exchange for services rendered, and is disclosed in the following categories.Short-term employee benefits include amounts such as wages, salaries, annual leave or sick leave that are usually paid orpayable on a regular basis, as well as non-monetary benefits such as allowances and free or subsidised goods or services.Post-employment benefits include pensions and other retirement benefits paid or payable on a discrete basis whenemployment has ceased.
Remuneration of executive officers(including Key Management Personnel disclosed in Note 24)
(a) The total number of executive officers includes persons who meet the definition of Key Management Personnel (KMP) of the entity underAASB 124 Related Party Disclosures and are also reported within the related parties note disclosure (Note 24).(b) Annualised employee equivalent is based on the time fraction worked over the reporting period.
- all key management personnel and their close family members and personal business interests (controlled entities, jointventures and entities they have significant influence over); - all cabinet members and their close family members; and - all departments and public sector entities that are controlled and consolidated into the whole of state consolidated financialstatements.
Page 53Trust for Nature Annual Report 2017-18 87

Note 24 Related parties (continued)
2018 2017$ $
Short-term employee benefits 354,806 375,926Post-employment benefits 31,279 31,686Other long-term benefits 12,698 12,070Total (a) 398,783 419,682Notes:
Transactions and balances with key management personnel and other related parties
Note 25 Ex-gratia expenses
2018 2017$ $
Ex-gratia expenses - -Total ex-gratia expenses - -Notes:
Note 26 Remuneration of auditors
2018 2017$ $
Victorian Auditor-General’s Office:
Audit or review of the financial statements 17,300 16,900
Total amount 17,300 16,900
No other services were performed during the reporting period.
Note 27 Subsequent events
There are no events or transactions subsequent to the reporting date which would render any particulars included in thefinancial statements to be misleading or inaccurate.
(i) Includes ex-gratia expenses greater than or equal to $5,000 or those considered material in nature. There were no such ex-gratia expenses in 2017-18 (2016-17: nil).
Compensation of KMPs
(a) Note that KMPs are also reported in the disclosure of remuneration of executive officers (Note 23).
There were no related party transactions that involved key management personnel, their close family members and theirpersonal business interests.
Key management personnel of the Trust includes the Portfolio Minister, Hon Lily D’Ambrosio MP, Minister for Energy,Environment and Climate Change, the governing Board of Trustees, the Chief Executive Officer, Victoria Marles, and the ChiefFinance Officer, Greg Bowers.
The compensation detailed below excludes the salaries and benefits the Portfolio Minister receives. The Minister’s remunerationand allowances is set by the Parliamentary Salaries and Superannuation Act 1968 and is reported within the Department ofParliamentary Services’ Financial Report.
Page 54
Page 55
Note 28 Glossary of terms
Amortisation
Amortisation is the expense which results from the consumption, extraction or use over time of a non-produced physical or intangibleasset. This expense is classified as an other economic flow.
Commitments
Commitments include those operating, capital and other outsourcing commitments arising from non cancellable contractual orstatutory sources.
Comprehensive result
The net result of all items of income and expense recognised for the period. It is the aggregate of operating result and other non-owner movements in equity.
Depreciation
Depreciation is an expense that arises from the consumption through wear or time of a produced physical or intangible asset. Thisexpense is classified as a ‘transaction’ and so reduces the ‘net result from transaction’.
Effective interest method
The effective interest method is used to calculate the amortised cost of a financial asset or liability and of allocating interest incomeover the relevant period. The effective interest rate is the rate that exactly discounts estimated future cash receipts through theexpected life of the financial instrument, or, where appropriate, a shorter period.
Employee benefits expenses
Employee benefits expenses include all costs related to employment including wages and salaries, fringe benefits tax, leaveentitlements, redundancy payments, defined benefits superannuation plans, and defined contribution superannuation plans.
Ex-gratia expenses
Ex-gratia expenses mean the voluntary payment of money or other non-monetary benefit (e.g. a write off) that is not made either toacquire goods, services or other benefits for the entity or to meet a legal liability, or to settle or resolve a possible legal liability orclaim against the entity.
Financial asset
A financial asset is any asset that is:(a) cash;(b) an equity instrument of another entity;(c) a contractual or statutory right:
(i) to receive cash or another financial asset from another entity; or(ii) to exchange financial assets or financial liabilities with another entity under conditions that are potentially favourable to
the entity; or(d) a contract that will or may be settled in the entity’s own equity instruments and is:
(i) a non-derivative for which the entity is or may be obliged to receive a variable number of the entity’s own equityinstruments; or
(ii) a derivative that will or may be settled other than by the exchange of a fixed amount of cash or another financial asset fora fixed number of the entity’s own equity instruments.
Financial instrument
A financial instrument is any contract that gives rise to a financial asset of one entity and a financial liability or equity instrument ofanother entity. Financial assets or liabilities that are not contractual (such as statutory receivables or payables that arise as a resultof statutory requirements imposed by governments) are not financial instruments.
www.trustfornature.org.au88
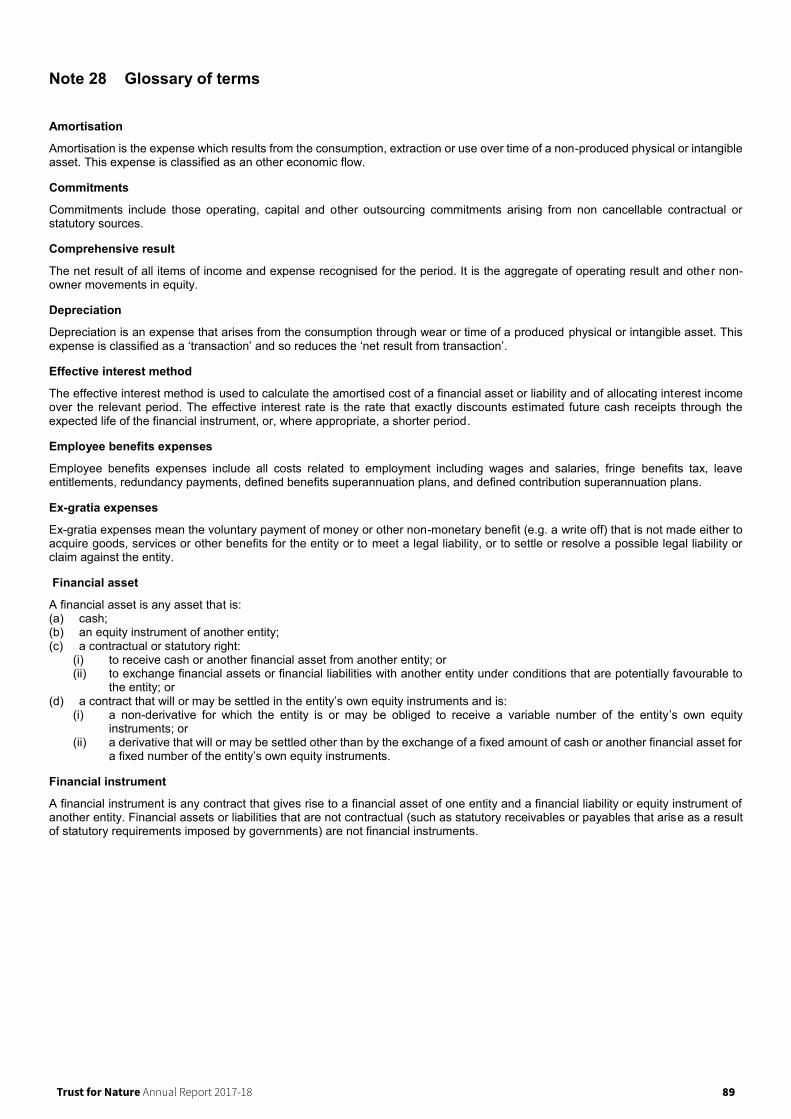
Page 55
Note 28 Glossary of terms
Amortisation
Amortisation is the expense which results from the consumption, extraction or use over time of a non-produced physical or intangibleasset. This expense is classified as an other economic flow.
Commitments
Commitments include those operating, capital and other outsourcing commitments arising from non cancellable contractual orstatutory sources.
Comprehensive result
The net result of all items of income and expense recognised for the period. It is the aggregate of operating result and other non-owner movements in equity.
Depreciation
Depreciation is an expense that arises from the consumption through wear or time of a produced physical or intangible asset. Thisexpense is classified as a ‘transaction’ and so reduces the ‘net result from transaction’.
Effective interest method
The effective interest method is used to calculate the amortised cost of a financial asset or liability and of allocating interest incomeover the relevant period. The effective interest rate is the rate that exactly discounts estimated future cash receipts through theexpected life of the financial instrument, or, where appropriate, a shorter period.
Employee benefits expenses
Employee benefits expenses include all costs related to employment including wages and salaries, fringe benefits tax, leaveentitlements, redundancy payments, defined benefits superannuation plans, and defined contribution superannuation plans.
Ex-gratia expenses
Ex-gratia expenses mean the voluntary payment of money or other non-monetary benefit (e.g. a write off) that is not made either toacquire goods, services or other benefits for the entity or to meet a legal liability, or to settle or resolve a possible legal liability orclaim against the entity.
Financial asset
A financial asset is any asset that is:(a) cash;(b) an equity instrument of another entity;(c) a contractual or statutory right:
(i) to receive cash or another financial asset from another entity; or(ii) to exchange financial assets or financial liabilities with another entity under conditions that are potentially favourable to
the entity; or(d) a contract that will or may be settled in the entity’s own equity instruments and is:
(i) a non-derivative for which the entity is or may be obliged to receive a variable number of the entity’s own equityinstruments; or
(ii) a derivative that will or may be settled other than by the exchange of a fixed amount of cash or another financial asset fora fixed number of the entity’s own equity instruments.
Financial instrument
A financial instrument is any contract that gives rise to a financial asset of one entity and a financial liability or equity instrument ofanother entity. Financial assets or liabilities that are not contractual (such as statutory receivables or payables that arise as a resultof statutory requirements imposed by governments) are not financial instruments.
Trust for Nature Annual Report 2017-18 89

Page 56
Note 28 Glossary of terms (continued)
Financial liability
A financial liability is any liability that is:(a) a contractual obligation:
(i) to deliver cash or another financial asset to another entity; or(ii) to exchange financial assets or financial liabilities with another entity under conditions that are potentially unfavourable
to the entity; or(b) a contract that will or may be settled in the entity’s own equity instruments and is:
(i) a non-derivative for which the entity is or may be obliged to deliver a variable number of the entity’s own equityinstruments; or
(ii) a derivative that will or may be settled other than by the exchange of a fixed amount of cash or another financial asset fora fixed number of the entity’s own equity instruments. For this purpose the entity’s own equity instruments do not includeinstruments that are themselves contracts for the future receipt or delivery of the entity’s own equity instruments.
Financial statements
Depending on the context of the sentence where the term ‘financial statements’ is used, it may include only the main financialstatements (i.e. comprehensive operating statement, balance sheet, cash flow statements, and statement of changes in equity); orit may also be used to replace the old term ‘financial report’ under the revised AASB 101 (September 2007), which means it mayinclude the main financial statements and the notes.
Grants and other transfers
Transactions in which one unit provides goods, services, assets (or extinguishes a liability) or labour to another unit without receivingapproximately equal value in return. Grants can either be operating or capital in nature.
While grants to governments may result in the provision of some goods or services to the transferor, they do not give the transferora claim to receive directly benefits of approximately equal value. For this reason, grants are referred to by the AASB as involuntarytransfers and are termed non-reciprocal transfers. Receipt and sacrifice of approximately equal value may occur, but only bycoincidence. For example, governments are not obliged to provide commensurate benefits, in the form of goods or services, toparticular taxpayers in return for their taxes.
Grants can be paid as general purpose grants which refer to grants that are not subject to conditions regarding their use. Alternatively,they may be paid as specific purpose grants which are paid for a particular purpose and/or have conditions attached.
Interest expense
Costs incurred in connection with the borrowing of funds. Interest expenses include interest on bank overdrafts and short-term andlong-term borrowings, amortisation of discounts or premiums relating to borrowings, the interest component of finance leasesrepayments, and the increase in financial liabilities and non-employee provisions due to the unwinding of discounts to reflect thepassage of time.
Interest income
Interest income includes unwinding over time of discounts on financial assets and interest received on bank term deposits and otherinvestments.
Net result
Net result is a measure of financial performance of the operations for the period. It is the net result of items of income, gains andexpenses (including losses) recognised for the period, excluding those that are classified as other non-owner changes in equity.
Net result from transactions/net operating balance
Net result from transactions or net operating balance is a key fiscal aggregate and is income from transactions minus expenses fromtransactions. It is a summary measure of the ongoing sustainability of operations. It excludes gains and losses resulting from changesin price levels and other changes in asset volumes. It is the component of the change in net worth that is due to transactions andcan be attributed directly to policies.
Non-financial assets
Non-financial assets are all assets that are not ‘financial assets’.
www.trustfornature.org.au90

Page 57
Note 28 Glossary of terms (continued)
Other economic flows
Other economic flows are changes in the volume or value of an asset or liability that do not result from transactions. It includes gainsand losses from disposals, revaluations and impairments of non-current physical and intangible assets; actuarial gains and lossesarising from defined benefit superannuation plans; fair value changes of financial instruments; and depletion of natural assets(non-produced) from their use or removal. In simple terms, other economic flows are changes arising from market re-measurements.
Payables
Includes short and long term trade debt and accounts payable, grants, taxes and interest payable.
Produced assets
Produced assets include buildings, plant and equipment, inventories, cultivated assets and certain intangible assets. Intangibleproduced assets may include computer software, motion picture films, and research and development costs (which does not includethe start up costs associated with capital projects).
Receivables
Includes trade credit and accounts receivable, accrued investment income, grants and interest receivable.
Sales of goods and services
Refers to income from the direct provision of goods and services and includes fees and charges for services rendered, sales ofgoods and services, fees from regulatory services and work done as an agent for private enterprises. It also includes rental incomeunder operating leases and on produced assets such as buildings and entertainment, but excludes rent income from the use ofnon-produced assets such as land. User charges includes sale of goods and services income.
Supplies and services
Supplies and services generally represent cost of goods sold and the day-to-day running costs, including maintenance costs, incurredin the normal operations of the Trust.
Transactions
Transactions are those economic flows that are considered to arise as a result of policy decisions, usually an interaction betweentwo entities by mutual agreement. They also include flows within an entity such as depreciation where the owner is simultaneouslyacting as the owner of the depreciating asset and as the consumer of the service provided by the asset. Transactions can be in kind(e.g. assets provided/given free of charge or for nominal consideration) or where the final consideration is cash. In simple terms,transactions arise from the policy decisions of the government.
Page 56
Note 28 Glossary of terms (continued)
Financial liability
A financial liability is any liability that is:(a) a contractual obligation:
(i) to deliver cash or another financial asset to another entity; or(ii) to exchange financial assets or financial liabilities with another entity under conditions that are potentially unfavourable
to the entity; or(b) a contract that will or may be settled in the entity’s own equity instruments and is:
(i) a non-derivative for which the entity is or may be obliged to deliver a variable number of the entity’s own equityinstruments; or
(ii) a derivative that will or may be settled other than by the exchange of a fixed amount of cash or another financial asset fora fixed number of the entity’s own equity instruments. For this purpose the entity’s own equity instruments do not includeinstruments that are themselves contracts for the future receipt or delivery of the entity’s own equity instruments.
Financial statements
Depending on the context of the sentence where the term ‘financial statements’ is used, it may include only the main financialstatements (i.e. comprehensive operating statement, balance sheet, cash flow statements, and statement of changes in equity); orit may also be used to replace the old term ‘financial report’ under the revised AASB 101 (September 2007), which means it mayinclude the main financial statements and the notes.
Grants and other transfers
Transactions in which one unit provides goods, services, assets (or extinguishes a liability) or labour to another unit without receivingapproximately equal value in return. Grants can either be operating or capital in nature.
While grants to governments may result in the provision of some goods or services to the transferor, they do not give the transferora claim to receive directly benefits of approximately equal value. For this reason, grants are referred to by the AASB as involuntarytransfers and are termed non-reciprocal transfers. Receipt and sacrifice of approximately equal value may occur, but only bycoincidence. For example, governments are not obliged to provide commensurate benefits, in the form of goods or services, toparticular taxpayers in return for their taxes.
Grants can be paid as general purpose grants which refer to grants that are not subject to conditions regarding their use. Alternatively,they may be paid as specific purpose grants which are paid for a particular purpose and/or have conditions attached.
Interest expense
Costs incurred in connection with the borrowing of funds. Interest expenses include interest on bank overdrafts and short-term andlong-term borrowings, amortisation of discounts or premiums relating to borrowings, the interest component of finance leasesrepayments, and the increase in financial liabilities and non-employee provisions due to the unwinding of discounts to reflect thepassage of time.
Interest income
Interest income includes unwinding over time of discounts on financial assets and interest received on bank term deposits and otherinvestments.
Net result
Net result is a measure of financial performance of the operations for the period. It is the net result of items of income, gains andexpenses (including losses) recognised for the period, excluding those that are classified as other non-owner changes in equity.
Net result from transactions/net operating balance
Net result from transactions or net operating balance is a key fiscal aggregate and is income from transactions minus expenses fromtransactions. It is a summary measure of the ongoing sustainability of operations. It excludes gains and losses resulting from changesin price levels and other changes in asset volumes. It is the component of the change in net worth that is due to transactions andcan be attributed directly to policies.
Non-financial assets
Non-financial assets are all assets that are not ‘financial assets’.
Trust for Nature Annual Report 2017-18 91


Trust for Nature5/379 Collins StreetMelbourne, Victoria 3000 AustraliaPhone: +61 3 8631 5888Fax: +61 3 9614 6999Freecall: 1800 99 99 33 (Australia only)Email: [email protected] 60 292 993 543
This report is printed on paper manufactured using 100% post-consumer waste recycled paper. An electronic copy of this document is available online at www.trustfornature.org.au
Image: Covenantors Glenn Cottier and Elke Seeck, Macedon Ranges
fsc logo to be placed here

Trust for Nature Annual Report 2017-18
www.trustfornature.org.au