true or false? 1 running head: interrater...
TRANSCRIPT

True or False? 1
Running Head: INTERRATER RELIABILITY AND AGREEMENT
True or False?: Different Sources of Performance Ratings Don’t Agree
James M. LeBreton, Jennifer R.D. Burgess, E. Kate Atchley
The University of Tennessee
Robert B. Kaiser
Kaplan DeVries, Inc.
Lawrence R. James
The University of Tennessee

True or False? 2
True or False?: Different Sources of Per formance Ratings Don’t Agree
The use of 360-degree feedback has become widespread in management development
activities (Church & Bracken, 1997). The basic idea is that performance ratings are collected
from different rating sources such as superior, peer, direct report, and self. The ratings furnished
by these sources are then examined to understand what (if any) are the distinct views these
sources have regarding the target manager’s performance. Indeed, most prescriptions for the use
of 360-degree data provide for a heavy focus on rating source discrepancies (Dalessio, 1998).
However, 360-degree measures are designed to measure traits believed to underlie
managerial behavior. A trait may be defined as “a disposition or tendency to behave in a
relatively consistent manner over time and across diverse situations” (James & Mazerolle, in
press). Application of this definition to 360-degree appraisal engenders an interesting paradox. If
360-degree appraisals measure cross-situationally consistent traits, then by definition, there
should be fairly strong agreement among observers (i.e., across space and time parameters).
Unfortunately, observed correlations among raters tend to be modest at best (cf. Conway &
Huffcutt, 1997; Harris & Schaubroeck, 1988) suggesting a lack of consistency of behavior. Two
theoretical models may be offered to explain this apparent inconsistency.
The first model will be referred to as the "discrepancy model." This model assumes either
that raters have differential access to behaviors exhibited by the target manager or that the target
manager behaves differently in the presence of different raters. Though semantically similar,
these two assumptions are qualitatively different. In the first instance, the manager engages in
stable trait behavior but only certain raters are privy to these behaviors. For example, the
manager may routinely confront problems with coworkers. However, the majority problems to
be confronted deal with direct reports rather than peers or supervisors. Additionally, when

True or False? 3
addresses problems the target elects to do so in private, rather than public. In this instance,
ratings on the "confrontation" dimensions of managerial effectiveness would like appear as very
discrepant among rating sources (i.e., direct reports vs. peers) and even potentially within rating
sources (e.g., direct reports).
The alternative assumption underlying the discrepancy model is that managers selectively
engage in various behaviors, contingent on with whom they are interacting. For example, a
manager may be compassionate and sensitive when dealing with an upset direct report, but may
be harsh and insensitive when dealing with peers. In this instance, ratings on the "sensitivity"
dimension of managerial effectiveness would again be discrepant, but for a different reason. In
either event, much of the extant empirical research appears, at first glance, to support the notion
of rating source discrepancies.
A meta-analysis by Harris and Schaubroeck (1988) revealed low to moderate correlations
among rating sources. Specifically, correlations between self, peer, and supervisor ratings
(corrected for only sampling error) ranged from .22 to .48. A similar unpublished manuscript by
Kraiger (1986) revealed low convergent correlations among rating sources by various
performance dimensions (e.g., interpersonal skills, job aptitude; mean r's ranged from .07 to .52).
Similar values were reported for convergent intraclass correlations (ICCs) among rating sources
(mean ICCs ranged from .18 to .35). The interested reader is directed to Murphy and Cleveland
(1995) and Cardy and Dobbins (1994) for additional references regarding rating source
discrepancies.
To summarize, the discrepancy model suggests that different rating sources provide useful
and substantially unique information regarding how a target manager is perceived. Additionally,
within the context of 360-degree feedback, target managers may actualize greater improvement

True or False? 4
in performance by identifying and improving upon 1) areas rated uniformly low across sources,
and/or 2) areas rated low within only a specific rating source.
Though the discrepancy model provides a provocative account for observed rating
discrepancies, the purpose of this paper is to introduce an alternative explanation for these
discrepancies. This alternative model is labeled the "restriction of variance model." The
restriction of variance model contains several constraining assumptions. First, it assumes that
target managers engage in (fairly) consistent "trait like' behaviors across space, time, and person
parameters. Second, this model assumes that extant HR, OB, and I/O interventions have been at
least minimally effective; and, due to these interventions the variance in performance ratings is
necessarily attenuated or restricted. The following sample is used to elucidate this second
assumption.
Sample Scenario
Take for instance an individual is admitted to a 4-year university largely based upon her
performance on the Scholastic Aptitude Test. After her first semester, she goes to the counseling
center and completes a series of vocational interest inventories. These inventories suggest the
student has an aptitude for, and interest in, accounting. She agrees and enrolls in the B.S.
program in accounting. Three years latter she completes her degree and the Certified Public
Accounting Exam. After meeting with a campus recruiter she is invited to interview with a Big 6
accounting firm. After she satisfactorily passes a personality test measuring employee reliability,
she goes through several structured panel interviews and is offered employment with the firm.
She accepts the offer. Four years later, and still with the firm, she is accepted into an Executive
MBA program. As part of this program she goes through a developmental assessment designed
at targeting her strengths and weaknesses. For the next 18 months she meets with an executive
True or False? 5
coach to outline and implement a plan designed at leveraging her strengths and improving upon
her weaknesses. At the close of the program, two sets of data are collected from, one contains
two supervisors' ratings and the other contains two peers' ratings of her managerial performance.
If these data were combined with data from other EMBAs with similar backgrounds, what would
we expect the correlation to be between the two sets of ratings? Within each set of ratings?
If even one-half of the I/O related activities and interventions described above were
marginally effective, then we would expect a modest correlation at best. This weak correlation
may not be due to lack of consensus or inconsistency among raters, but rather because the
performance levels of the targets are highly constrained (i.e., after all this training, education,
and development all targets are fairly effective). If this is the case, then indices of rating
similarity assessed via correlational analysis may be inappropriate and alternative indices may
provide a more realistic assessment of rating similarity.
Rating similarity indexed via correlational analyses presupposes that variance exists
between targets. That is, for correlations to be high among multiple raters, the targets of these
ratings must vary (substantially) in terms of their manifest performance. This is easily illustrated
with data in Table 1. When one-way random effects intraclass correlation coefficients (cf.
Bartko, 1976; Shrout & Fleiss, 1979) are computed separately on the first 10 targets (good
performers) and the last 10 targets (poor performers) each ICC (1,1) = .22. When the data are
combined and a single analysis is conducted, the ICC (1,1) = .92. These data are contrived to
illustrate a simple point -- without between-target variance, correlational-based analyses are
ineffectual indicators of rating similarity.
The purpose of this paper is to demonstrate that the restriction of variance model posited
earlier represents a viable alternative to the discrepancy model traditionally embraced by

True or False? 6
researchers and practitioners working in the area of performance evaluation and leadership
development. Below we offer several general predictions based upon these two competing
models, and then derive specific hypotheses for the restriction of variance model based upon
these predictions.
Predictions Derived from the Discrepancy Model
The discrepancy model posits that raters have differential access to behaviors exhibited by
the target manager or that the target manager behaves differently in the presence of different
raters. In either event, this model predicts that raters within-source will provide similar ratings
but raters in different sources will provide dissimilar ratings. Thus, indexing rating similarity
within-sources via intraclass or interclass correlations should result in moderate levels of rating
similarity. However, the application of these statistics to between-source rating similarity should
result in substantially lower values. Likewise, indexing similarity via agreement indices such as
rWG (James, Demaree, & Wolf, 1984; 1993) should result in fairly high within-source rating
similarity. However, the application of this same statistic to assess between-source similarity
should result in substantially lower values.
Predictions Derived from the Restriction of Variance Model
The restriction of variance model posits that target managers engage in stable trait
behaviors and that extant I/O practices and interventions have been somewhat effective. Due to
the effectiveness of these interventions between-target variance in performance is restricted or
attenuated. Thus, this model predicts that ratings within-source will be similar and ratings
between-sources will also be similar. However, due to the restriction in between-target
variability, indexing similarity within- and between-sources via intraclass or interclass
correlations will likely result in low levels of rating similarity. Indexing similarity via agreement

True or False? 7
indices such as rWG (James, Demaree, & Wolf, 1984; 1993) should result in fairly high within-
source and between-source rating similarity. This high agreement is a direct function of the fact
that rWG is not a function of rank ordering among targets and does not require substantial
between-target variance. Rather, rWG examines the extent to which multiple ratings on a single
target deviate (proportionally) from some null distribution. Based on the aforementioned
discussion, we offer the following research hypotheses to test the restriction of variance model:
Hypothesis 1: 360-degree scales will have a restricted range as observed by negatively
skewed and kurtotic scale scores.
Hypothesis 2: Intraclass and interclass correlations will be low (< .70) for all dyadic
between-source comparisons (e.g., peer-boss).
Hypothesis 3: rWG values will be high (>.70) for all dyadic between-source comparisons
(e.g., direct report - peer).
Method
Sample
The data for this study were collected from managers who participated in various leadership
development courses offered at a non-profit training institute between 1992 and 1997. Target
managers were asked to fill out a self-rating form of a 360-degree feedback questionnaire as well
as to request several coworkers to complete an observer form prior to the course. The target
managers represented firms in the manufacturing, financial services, insurance, wholesale trade,
transportation, communications, and utility industries. Data were collected from a total of 8,434
target managers attending a leadership development program between 1992 and 1996.
Performance ratings to be used for developmental feedback were made available from a total of
7,606 supervisors, 34,511 peers, and 31,731 subordinates relative to the target managers.

True or False? 8
Measure
Multi-rater feedback data was collected with Benchmarks (Lombardo & McCauley, 1994),
a 360-degree feedback instrument developed from a series of studies conducted to further the
understanding of executive development. By focusing on the experiential growth aspects of top-
level management careers, it is designed to measure those characteristics critical to managerial
success that are learned over time. The research leading up to the development of Benchmarks is
summarized by McCall, Lombardo, and Morrison, (1988) and Lindsey, Homes, and McCall
(1987). An overview of the content considerations and construction of the instrument can be
found in McCauley and Lombardo (1990).
Benchmarks contains two general sections containing a total of 164 items. For the purposes
of the present study, only the scales in the first section were used (c.f. Brutus et al., 1996;
Fleenor et al., 1996). This section is the more reliable of the two sections (Zedeck, 1995; also
corroborated with local data) and spans 16 conceptually and empirically derived subscales made
up of a total of 106 items concerning the learned skills thought to contribute to success as an
executive. The 16 scales are labeled Resourcefulness, Doing whatever it takes, A quick study;
Building and mending relationships, Leading subordinates, Compassion and sensitivity; Straight-
forwardness and composure, Setting a developmental climate, Confronting problem
subordinates, Team orientation, Balance between personal life and work, Decisiveness, Self-
awareness, Hiring talented staff, Putting people at ease, and Acting with flexibility.
Benchmarks items consist of a stem containing a behavioral description of a specific skill,
competency, or capacity, and the focal manager is rated on a five-point scale (low to high) for
the degree to which the item is characteristic of him or her. This instrument has been subjected to
multiple validation efforts (for a review, see McCauley & Lombardo, 1990) and has received

True or False? 9
favorable overall evaluations as a reliable and valid measure of important aspects of leadership
related to executive development (e.g., Zedeck, 1995). Internal consistency reliability
coefficients for the 16 scales, estimated at the individual rater level of analysis are presented in
Table 2. As this table shows the present sample, generally exceeded recommended standards for
internal consistency (cf. Nunnally, 1978).
Procedures
Both inter-rater agreement and reliability for Benchmarks ratings were assessed to justify
aggregating coworker ratings at the scale level within each source (as recommended by Fleenor,
Fleenor, & Grossnickle, 1996; and Tinsley & Weiss, 1975). For these purposes, three separate
databases—one for superior ratings, one for peer ratings, and one for subordinate ratings—were
independently constructed (all with N = 500). Each database contained a random sampling of
coworkers representing the respective perspective where exactly two superiors, four peers, or
four subordinates provided ratings.
James’ rWG index was used to determine the level of rater agreement (James, Demaree, &
Wolf, 1984; 1993). This statistic is appropriate when a group of raters rate a single target on
several variables thought to be indicators of the same construct and the researcher wants to know
the extent to which the overall level of ratings is similar across the raters. Similar to indices of
reliability, values closer to 1 indicate higher convergence. Separate rWG values were computed
for each individual rating target on each of the 16 Benchmarks scales within each rating source.
Next, the mean rWG across targets for each scale was computed within the three rating
perspectives. The mean level of agreement across the three sources for all scales was high
according to James’ criteria (James et al., 1993): for superior ratings the median scale mean rWG
value was .91 (range .84 to .98), for peer ratings it was .89 (range = .86 to .98), and for

True or False? 10
subordinate ratings it was .86 (range = .81 to .97).
Benchmarks scale ratings were assessed for inter-rater reliability with intraclass correlations
(ICC; Shrout & Fleiss, 1979). Whereas rWG is an index of level of agreement, ICCs provide an
assessment of agreement in terms of rank-ordering (Fleenor et al., 1996). ICCs were computed
separately for the three rating sources. For each of the 16 scales, the reliability of the mean of the
two superiors’ ratings and the reliabilities of the means of the four raters within the peer and
subordinate groups were calculated (ICC [1,2] for superiors and ICC[1,4] for peer and
subordinates; Shrout & Fleiss, 1979). For superiors, these coefficients ranged from .48 to .73 (M
= .64); for peers they ranged from .46 to .72 (M = .61); and they ranged from .48 to .75 (M = .62)
for subordinates. Taken together, the inter-rater agreement and reliability estimates were deemed
high enough to justify aggregating scale scores across raters within each source. Additionally,
given our interest in identifying between-source rating similarity or differences, the extent that
within-source variance may be reduced or obviated enhances the likelihood of identifying these
between-source trends.
Results
Hypothesis 1 - Supported
Table 3 reports the pattern of skewness and kurtosis for supervisor ratings (the other groups
had a nearly identical pattern). The scale distributions are negatively skewed and kurtotic. These
distributions represent prima facie evidence of leniency effects (or biases) among rating sources
(cf. Cardy & Dobbins, 1994; Murphy & Cleveland, 1995). That is, raters (or aggregated raters)
within sources assigned "inflated" scores to the target manager. An alternative explanation (and
one not necessarily implying biased ratings) is that these executives and managers tended to
legitimately score at the top end of the performance distributions. The veridicality of each

True or False? 11
interpretation is subject to debate. For the current study, the key finding, and consistent with
Hypothesis 1, is that observed ratings tended to cluster at the high end of the performance
distributions.
Hypotheses 2 - Supported
To test Hypothesis 2, scores on the 16 Benchmark scales were analyzed for each of six
between-source dyadic comparisons (i.e., self-boss, self-peer, self-direct report, boss-peer, boss-
direct report, and peer-direct report). It is important to reemphasize that scores on the 16 scales
were aggregated within the peer and direct report rating sources prior to comparisons. Thus, in
some instances individual-level ratings are being compared to individual-level ratings (i.e., self-
boss), individual-level ratings are being compared to mean-level ratings (i.e., self-peer, self-
direct report), and mean-level ratings are being compared to mean-level ratings (i.e., peer-direct
report). By aggregating data within source we hoped to minimize the amount of within-source
variance, thus providing us with a better opportunity to identify between group-source
differences or lack thereof.
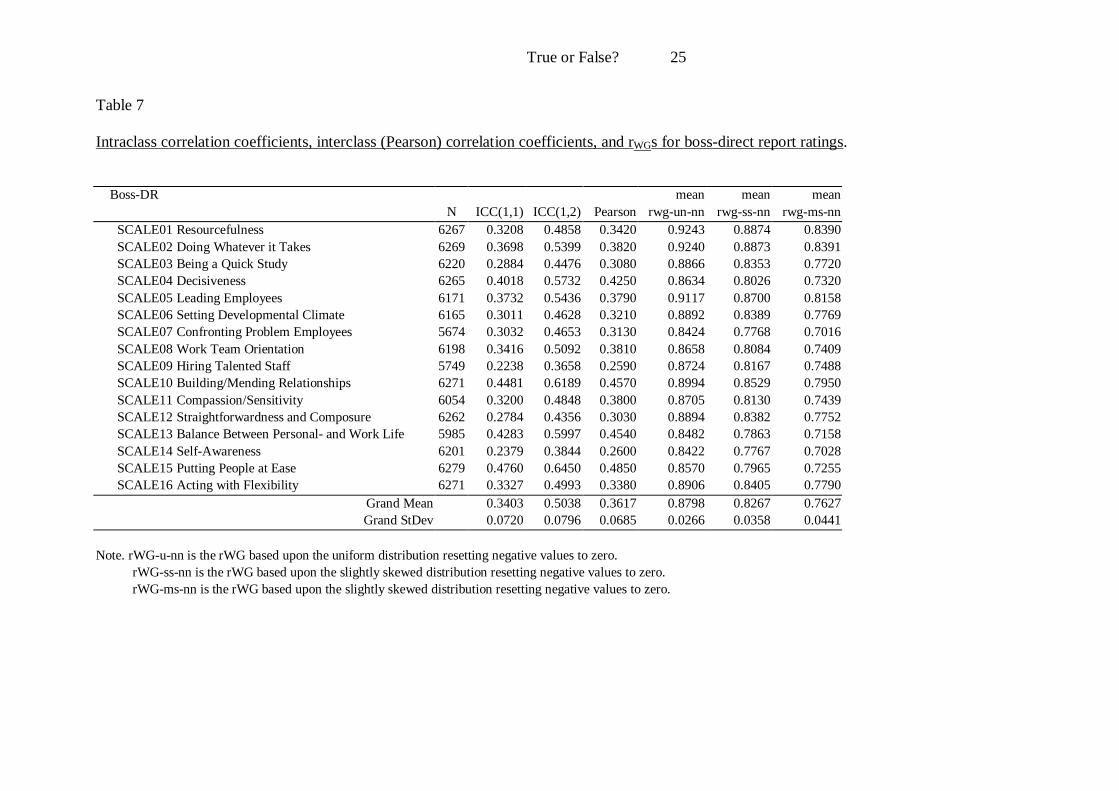
Results are presented in Tables 4-9. To formally evaluate Hypothesis 2 we computed both
one-way random effects intraclass correlation coefficients (Bartko, 1976; Shrout & Fleiss, 1979)
and Pearson r interclass correlation coefficients. These are the statistics typically reported in
literature examining between-source differences in performance ratings (cf. Harris &
Schraubroeck, 1988; Kraiger, 1986). The pattern of results is consistent across each dyadic
comparison. In general, the between-source ICCs and Pearson r's for each scale were low. In
none of cases did the ICC (1,1), and in only 5 of 96 instances did the ICC (1,2) exceed the
minimum accepted reliability threshold of .70. Similarly, nearly all of the between-source
interclass correlations were low.

True or False? 12
These results suggest that rating similarity, as indexed via correlational analyses was low
across all six between-source comparisons. One possible explanation for these low values was
the restricted variance observed for all 16 scales. In this instance, one might argue that the
observed values are "artificially" deflated due to restriction of variance. Alternatively, these low
values may be a function of true differential response patterns by the different rating sources. In
this instance, one might argue that the observed values accurately reflect the lack of rating
similarity across sources. Hypothesis 3 sought to more fully explore these alternative
explanations.
Hypothesis 3 - Supported
To test Hypothesis 3, scores on the 16 Benchmark scales were again analyzed for each of
six between-source dyadic comparisons. It is important to again note that in several instances
individual level data were compared to aggregated data. First we computed rWG statistics using
the computational formula offered by James, et al. (1984). The basic idea underlying rWG is that
the observed variance among multiple judges is compared to the variance one would obtain from
one or more "null" distributions. Though the uniform or rectangular distribution is the most
common, James et al. provide information about how to model distributions with various
response biases (e.g., leniency bias) and encourage researchers to use such distributions
whenever they suspect their data might be impacted by such effects. Thus, in the interest of
trying to provide an accurate (i.e., uninflated) estimated of between-source rating agreement, we
elected to compute rWGs based upon null distributions containing both a slight skew (σ2 = 1.33
for a 5-point scale) and a moderate skew (σ2 = 0.90). Finally, for comparison purposes we
computed rWGs using the rectangular or uniform distribution (σ2 = 2.0).

True or False? 13
rWGs were computed for each dyadic comparison for each target manager. In the rare
instances when rWGs were negative these values were reset to zero in accordance with
recommendations offered by James et al. (1984). Next we computed mean rWGs across all targets
for each of the 16 Benchmarks scales. These are the values reported in Tables 4 -9. To elucidate
the process further, let us provide a more concrete example. For the comparison between peer
and boss ratings we first aggregated peer ratings for each target manager. Next we computed rWG
values based upon the observed variance between average peer ratings and boss ratings for each
of roughly 6,500 target managers on the 16 scales. Finally, we computed mean rWGs for the 16
scales collapsing across the approximately 6,500 targets.
The results based on the uniform or rectangular null response distribution suggested strong
between-source rating similarity. As expected, the values of the obtained rWGs were lower for the
slightly skewed and moderately skewed null distributions. However, even basing rWGs on a
moderately skewed distribution, the obtained mean rWGs were of sufficient magnitude to suggest
strong between-source agreement for all six dyadic comparisons. These results taken as a whole
suggest that rating similarity as indexed via rWG analyses was high across all between-source
comparisons. These results coupled with the low ICCs obtained in Hypothesis 2 provide initial
support for the restriction of variance model.
Discussion
Summary
The purpose of this paper was to offer an alternative explanation for the discrepancies often
reported between different sources of performance ratings. This explanation labeled the
"restriction of variance hypothesis" suggests that the low intraclass correlations and Pearson
correlations are largely a function of restricted variance in the performance ratings, possibly

True or False? 14
engendered by I/O interventions such as vocational counseling, selection, training, performance
evaluation, culture and climate interventions, and/or other person-environment fit issues (cf.
Kristof, 1996; Schneider, Goldstein, & Smith, 1995).
Results supporting Hypothesis 1 replicated earlier work on performance ratings
demonstrating the 16 Benchmarks scales tended to be kurtotic and negatively skewed. Results
supporting Hypothesis 2 indicated that between-source (e.g., self-boss) intraclass correlation
coefficients tended to be low, suggesting lack of rating similarity across sources. However,
supporting the restriction of variance hypothesis, results for Hypothesis 3 demonstrated high
levels of between-source rating similarity when similarity was indexed via James, et al.'s (1984)
rWG statistic.
These contrasting conclusions may be best explained by distinguishing interrater reliability
from interrater agreement. The former is concerned with the consistency in target rank-orders as
assigned by different raters, while the latter is concerned with consensus in the scores assigned
by different raters. Thus, under conditions where the range of targets has been attenuated or
restricted, interrater reliability coefficients such as ICCs will necessarily be low, irrespective of
whether in the unrestricted population ICCs are high. Restricted samples, however, do not
negatively impact the interrater agreement values obtained via rWG. Additional analyses are
underway using a Monte Carlo methodology varying the levels of selection ratios and empirical
validities and examining these effects on interrater reliability (ICC) and interrater agreement
(rWG) indices. Initial results from these analyses further support the restriction of variance
hypothesis.
Intraclass Correlations, Interclass Correlations, and Criterion Reliability

True or False? 15
We believe that I/O psychologists have potentially placed too much stock in rank-order
based indices of rating similarity such as the intraclass correlation and Pearson’s interclass
correlation. This is especially true for researchers working in the areas of validity generalization
(VG) and meta-analysis. For instance, in a recent review by Ones, Viswesvaran, and Schmidt
(1993) the authors concluded that the average reliability of supervisory ratings is a .52. Stated
alternatively, roughly 50% of the variance in supervisory performance ratings is random error
variance! We sincerely doubt this to be the case. On the contrary we believe the .52 estimate
represents a lower bound estimate that has been grossly attenuated due to restriction of variance
in performance.
Indeed, if researchers insist upon using intraclass and interclass correlations as indices of
rating similarity and reliability and inputting these values into correction formulae, they should at
least correct these values for attenuation due to restriction of range. Such correction formulae
have been available to psychologists for years and have been recognized by the leading VG
researchers. Indeed, Schmidt, Hunter, and Urry (1976) note, "In the typical validation study, the
criterion reliability, as well as the test validity, is available only on the restricted group. Both
coefficients should be corrected first for restriction of range" (p. 475). We agree with Schmidt et
al. and in the future we would like to see such corrections for range restriction routinely included
in validation and meta-analytic studies.
360-Degree Feedback and Rating Source Discrepancies
The results of the current study suggest that individuals working in the area of 360-degree
feedback and leadership development may do well to temper their enthusiasm for “discrepancy”
type models of leader behavior. The current study suggests that different sources of ratings, that
were at times aggregated within-source, tended to agree with other sources of ratings. The levels

True or False? 16
of between-source rating agreement were similar to previous studies on this data examining
within-source rating agreement (cf. Kaiser, 1998). Stated alternatively, it appears that the
between-source ratings are no more "discrepant" than ratings obtained within-source. An
important caveat to note is that neither within-source nor between-source rating agreement every
legitimately approached 1.0. Perhaps, true with- and between-source rating discrepancies still
exist, however based upon the results of the current study we believe these effects to be small.
Conclusion
Ratings between sources showed substantial consensus or agreement on the level (rWG) of
target managers’ performance. Observed correlations between sources showed much less
consistency in the rank-ordering (ICC) of performance. This suggests that different sources of
ratings show much greater similarity than previous research has indicated. The logic behind 360-
degree feedback rests upon the idea that different rating groups provide unique performance
information (Dalessio, 1998). This argument has been supported with research showing the
moderate-at-best correlations between rating sources. The present results question the extent and
magnitude of discrepancies in ratings among different sources (see also, Mount et al., 1998). To
be sure, there is a degree of distinctiveness between sources—their correlations and rWGs are not
unity. But the degree of uniqueness appears to be less extreme than the pundits of 360-degree
feedback have claimed.

True or False? 17
References
Conway, J., & Huffcutt, A. (1997). Psychometric properties of multi-source performance
ratings: A meta-analysis of subordinate, supervisor, peer, and self-ratings. Human Performance,
10, 331-360.
Dalessio, A. T. (1998). Using multi-source feedback for employee development and
personnel decisions. In J. W. Smither (Ed.), Performance Appraisal. San Francisco: Jossey Bass.
Fleenor, J. W., Fleenor, J. B., & Grossnickle, W. F. (1996). Interrater reliability and
agreement of performance ratings: A methodological comparison. Journal of Business and
Psychology, 10, 367-380.
Fleenor, J.W., McCauley, C.D., & Brutus, S. (1996). Self-other rating agreement and leader
effectiveness. Leadership Quarterly, 7, 487-506.
Harris, M. M., & Schaubroeck, J. (1988). A meta-analysis of self-supervisor, self-peer, and
peer-supervisor ratings. Personnel Psychology, 41, 43-62.
James, L. R., Demaree, R., G. & Wolf, G. (1984). Estimating within-group interrater
reliability with and without response bias. Journal of Applied Psychology, 69, 85-98.
James, L. J., Demaree, R. G., & Wolf, G. (1993). rWG: An Assessment of within-group
interrater agreement. Journal of Applied Psychology, 78, 306-309.
James, L. R., & Mazerolle, M. (in press). Personality in work organizations: An integrative
approach. Sage Publications.
Kaiser, R.B. (1998). Can the MBTI be used to understand self-other rating agreement in
360o feedback? Unpublished master's thesis, I llinois State University, Normal, IL.
Kristof, A. L. (1996). Person-organization fit: An integrative review of its
conceptualizations, measurement, and implications. Personnel Psychology, 49, 1-49.

True or False? 18
Lombardo, M. & McCauley, C.D. (1994). Benchmarks: A manual and trainer’s guide.
Greensboro, NC: Center for Creative Leadership.
McCauley, C. D. & Lombardo, M. (1990). Benchmarks: An instrument for diagnosing
managerial strengths and weaknesses. In K. E. Clark & M. B. Clark (Eds.), Measures of
Leadership. West Orange, NJ: Leadership Library of America.
Mount, M. K., Judge, T. A., Scullen, S. E., Sytsma, M. R., & Hezlett, S. A. (1998). Trait,
rater and level effects in 360-degree performance ratings. Personnel Psychology, 51, 557-576.
Ones, D. S., Viswesvaran, C., & Schmidt, F. L. (1993). Comprehensive meta-analysis of
integrity test validities: Findings and implications for personnel selection and theories of job
performance. Journal of Applied Psychology, 78, 679-703.
Shrout, P. E. & Fleiss, J. L. (1979). Intraclass correlations: Uses in assessing rater
reliability. Psychological Bulletin, 86, 420-428.
Schneider, B., Goldstein, H. W., & Smith, D. B. (1995). The ASA framework: An update.
Personnel Psychology, 48, 747-773.
Schmidt, F. L., Hunter, J. E., & Urry, V. W. (1976). Statistical power in criterion-related
validation studies. Journal of Applied Psychology, 61, 473-485.
Zedeck, S. (1995). [Review of Benchmarks]. In J. Conoley & J. Impara (Eds.), The twelfth
mental measurements yearbook (Vol. 1, pp 128-129). Lincoln, NE: Buros Institute of Mental
Measurements.

True or False? 19
Table 1
I llustration of restriction of variance upon the computation of intraclass correlations.
Target Rating 1 Rating 2 1 5 5 2 4 4 3 5 4 4 4 5 5 4 4 6 5 5 7 4 4 8 5 4 9 4 5 10 4 4 11 2 2 12 1 1 13 2 1 14 1 2 15 1 1 16 2 2 17 1 1 18 2 1 19 1 2 20 1 1
ICC(1,1) = 0.22 based upon first 10 targets
ICC(1,1) = 0.22 based upon second 10 targets
ICC(1,1) = 0.92 based upon all 20 targets
Mean rWG(1) =.85 across all 20 targets

True or False? 20
Table 2
Internal consistency (Coefficient Alpha) estimates for 16 Benchmarks scales.
Scale Title Overall Boss Peer DR Self
1 Resourcefulness 0.92 0.91 0.93 0.93 0.85
2 Doing Whatever it Takes 0.90 0.89 0.90 0.91 0.82
3 Being a Quick Study 0.86 0.86 0.86 0.86 0.81
4 Decisiveness 0.79 0.82 0.80 0.77 0.76
5 Leading Employees 0.91 0.90 0.91 0.91 0.91
6 Setting Developmental Climate 0.83 0.79 0.83 0.85 0.71
7 Confronting Problem Employees 0.81 0.82 0.81 0.81 0.77
8 Work Team Orientation 0.76 0.79 0.77 0.75 0.70
9 Hiring Talented Staff 0.80 0.82 0.82 0.78 0.76
10 Building/Mending Relationships 0.92 0.91 0.93 0.93 0.83
11 Compassion/Sensitivity 0.81 0.78 0.82 0.81 0.65
12 Straightforwardness and Composure 0.74 0.73 0.76 0.75 0.63
13 Balance Between Personal- and Work
Life
0.82 0.78 0.81 0.83 0.84
14 Self-Awareness 0.83 0.82 0.83 0.84 0.65
15 Putting People at Ease 0.89 0.88 0.89 0.89 0.82
16 Acting with Flexibility 0.83 0.79 0.83 0.84 0.68
Mean 0.84 0.83 0.84 0.84 0.76
Median 0.83 0.82 0.83 0.84 0.77

True or False? 21
Table 3
Skewness and kurtosis of supervisor ratings of target managers for the 16 Benchmarks scales.
Skew Skew Kurtosis Kurtosis N Mean StDev Statistic Std. Error t-value Statistic Std. Error t-value
Resourcefulness 7510 3.6449 .5350 -.412 .028 -14.71 .347 .057 6.09
Doing Whatever it Takes 7512 3.7956 .5539 -.491 .028 -17.54 .447 .057 7.84
Being a Quick Study 7465 4.0114 .6342 -.549 .028 -19.61 .433 .057 7.60
Decisiveness 7499 3.5987 .7843 -.406 .028 -14.50 -.280 .057 -4.91
Leading Employees 7283 3.5623 .5725 -.370 .029 -12.76 .162 .057 2.84
Setting Developmental Climate 7260 3.7406 .5901 -.498 .029 -17.17 .556 .057 9.75
Confronting Problem Employees 6677 3.3353 .7582 -.292 .030 -9.73 -.257 .060 -4.28
Work Team Orientation 7383 3.5443 .7350 -.409 .029 -14.10 -.135 .057 -2.37
Hiring Talented Staff 6747 3.666 .676 -.375 .030 -12.50 .202 .060 3.37
Building/Mending Relationships 7510 3.5949 .6676 -.470 .028 -16.79 -.009 .057 -0.16
Compassion/Sensitivity 7216 3.6846 .6361 -.470 .029 -16.21 .468 .058 8.07
Straightforwardness and Composure
7498 4.1072 .6279 -.891 .028 -31.823 .811 .057 14.23
Balance Between Personal- and Work Life
7185 3.8116 .7454 -.749 .029 -25.83 .368 .058 6.35
Self-Awareness 7443 3.5421 .7207 -.565 .028 -20.18 .239 .057 4.19
Putting People at Ease 7514 3.8288 .7872 -.478 .028 -17.07 -.152 .056 -2.71
Acting with Flexibility 7506 3.6032 .6249 -.434 .028 -15.50 .246 .057 4.32

True or False? 22
Table 4
Intraclass correlation coefficients, interclass (Pearson) correlation coefficients, and rWGs for self-boss ratings.
Self-Boss mean mean mean
N ICC(1,1) ICC(1,2) Pearson rwg-un-nn rwg-ss-nn rwg-ms-nn SCALE01 Resourcefulness 6826 0.1927 0.3231 0.2110 0.9120 0.8703 0.8174 SCALE02 Doing Whatever it Takes 6825 0.2775 0.4344 0.2900 0.9099 0.8676 0.8137 SCALE03 Being a Quick Study 6776 0.1905 0.3200 0.2150 0.8545 0.7921 0.7194 SCALE04 Decisiveness 6815 0.3563 0.5254 0.3720 0.8408 0.7757 0.7018 SCALE05 Leading Employees 6604 0.1463 0.2553 0.1880 0.8931 0.8441 0.7845 SCALE06 Setting Developmental Climate 6594 0.1437 0.2513 0.1620 0.8817 0.8307 0.7698 SCALE07 Confronting Problem Employees 6007 0.2573 0.4093 0.2600 0.8222 0.7515 0.6724 SCALE08 Work Team Orientation 6712 0.2616 0.4148 0.3290 0.8338 0.7675 0.6930 SCALE09 Hiring Talented Staff 6058 0.1987 0.3316 0.2420 0.8441 0.7800 0.7055 SCALE10 Building/Mending Relationships 6825 0.2811 0.4388 0.3150 0.8855 0.8336 0.7709 SCALE11 Compassion/Sensitivity 6567 0.2385 0.3851 0.2440 0.8731 0.8171 0.7500 SCALE12 Straightforwardness and Composure 6816 0.1265 0.2246 0.1430 0.8679 0.8102 0.7397 SCALE13 Balance Between Personal- and Work Life 6542 0.3273 0.4932 0.3880 0.8040 0.7320 0.6535 SCALE14 Self-Awareness 6764 0.0806 0.1492 0.1110 0.8327 0.7687 0.6980 SCALE15 Putting People at Ease 6828 0.3977 0.5690 0.4060 0.8440 0.7793 0.7044 SCALE16 Acting with Flexibility 6820 0.1131 0.2032 0.1440 0.8695 0.8133 0.7475
Grand Mean 0.2243 0.3580 0.2513 0.8605 0.8021 0.7338 Grand StDev 0.0912 0.1212 0.0920 0.0312 0.0404 0.0484
Note. rWG-u-nn is the rWG based upon the uniform distribution resetting negative values to zero. rWG-ss-nn is the rWG based upon the slightly skewed distribution resetting negative values to zero. rWG-ms-nn is the rWG based upon the slightly skewed distribution resetting negative values to zero.

True or False? 23
Table 5
Intraclass correlation coefficients, interclass (Pearson) correlation coefficients, and rWGs for self-direct report ratings.
Self-DR mean mean mean
N ICC(1,1) ICC(1,2) Pearson rwg-un-nn rwg-ss-nn rwg-ms-nn SCALE01 Resourcefulness 7022 0.2016 0.3356 0.2020 0.9354 0.9041 0.8619 SCALE02 Doing Whatever it Takes 7024 0.3041 0.4664 0.3060 0.9322 0.8997 0.8566 SCALE03 Being a Quick Study 7008 0.2521 0.4026 0.2600 0.8932 0.8441 0.7835 SCALE04 Decisiveness 7025 0.3842 0.5551 0.4140 0.8859 0.8347 0.7716 SCALE05 Leading Employees 7022 0.1911 0.3209 0.2570 0.9124 0.8712 0.8184 SCALE06 Setting Developmental Climate 7023 0.1650 0.2832 0.2420 0.8878 0.8371 0.7762 SCALE07 Confronting Problem Employees 6833 0.3049 0.4673 0.3060 0.8650 0.8064 0.7380 SCALE08 Work Team Orientation 7015 0.3342 0.5010 0.3510 0.8917 0.8412 0.7784 SCALE09 Hiring Talented Staff 6861 0.2518 0.4023 0.2670 0.8984 0.8520 0.7936 SCALE10 Building/Mending Relationships 7025 0.2807 0.4384 0.3050 0.9101 0.8685 0.8165 SCALE11 Compassion/Sensitivity 7019 0.2316 0.3761 0.3240 0.8724 0.8166 0.7502 SCALE12 Straightforwardness and Composure 7024 0.1591 0.2745 0.1590 0.9038 0.8589 0.8021 SCALE13 Balance Between Personal- and Work Life 6986 0.4811 0.6497 0.4920 0.8534 0.7919 0.7207 SCALE14 Self-Awareness 7010 0.0220 0.0431 0.1150 0.8477 0.7855 0.7153 SCALE15 Putting People at Ease 7030 0.4609 0.6310 0.4620 0.8754 0.8205 0.7547 SCALE16 Acting with Flexibility 7028 0.1351 0.2381 0.1820 0.8914 0.8433 0.7836
Grand Mean 0.2600 0.3991 0.2903 0.8910 0.8422 0.7826 Grand StDev 0.1198 0.1537 0.1044 0.0249 0.0339 0.0425
Note. rWG-u-nn is the rWG based upon the uniform distribution resetting negative values to zero. rWG-ss-nn is the rWG based upon the slightly skewed distribution resetting negative values to zero. rWG-ms-nn is the rWG based upon the slightly skewed distribution resetting negative values to zero.

True or False? 24
Table 6
Intraclass correlation coefficients, interclass (Pearson) correlation coefficients, and rWGs for self-peer ratings.
Self-Peer mean mean mean
N ICC(1,1) ICC(1,2) Pearson rwg-un-nn rwg-ss-nn rwg-ms-nn SCALE01 Resourcefulness 7404 0.2035 0.3381 0.2100 0.9372 0.9063 0.8651 SCALE02 Doing Whatever it Takes 7405 0.3035 0.4657 0.3160 0.9350 0.9033 0.8605 SCALE03 Being a Quick Study 7396 0.2429 0.3908 0.2560 0.8968 0.8488 0.7879 SCALE04 Decisiveness 7406 0.3902 0.5614 0.4150 0.8902 0.8399 0.7780 SCALE05 Leading Employees 7348 0.1434 0.2508 0.2130 0.9138 0.8729 0.8203 SCALE06 Setting Developmental Climate 7353 0.1204 0.2150 0.1930 0.8993 0.8529 0.7950 SCALE07 Confronting Problem Employees 7136 0.2904 0.4501 0.2940 0.8711 0.8146 0.7478 SCALE08 Work Team Orientation 7387 0.2945 0.4549 0.3510 0.8861 0.8327 0.7662 SCALE09 Hiring Talented Staff 7159 0.1721 0.2937 0.2510 0.8770 0.8221 0.7554 SCALE10 Building/Mending Relationships 7407 0.3363 0.5033 0.3690 0.9186 0.8804 0.8310 SCALE11 Compassion/Sensitivity 7386 0.2517 0.4022 0.3070 0.8881 0.8375 0.7753 SCALE12 Straightforwardness and Composure 7405 0.1643 0.2822 0.1740 0.9060 0.8620 0.8057 SCALE13 Balance Between Personal- and Work Life 7384 0.4283 0.5997 0.4840 0.8572 0.7964 0.7244 SCALE14 Self-Awareness 7394 0.0707 0.1321 0.1430 0.8700 0.8139 0.7470 SCALE15 Putting People at Ease 7409 0.4815 0.6500 0.4830 0.8893 0.8383 0.7755 SCALE16 Acting with Flexibility 7405 0.1408 0.2468 0.1890 0.9013 0.8563 0.8000
Grand Mean 0.2522 0.3898 0.2905 0.8961 0.8486 0.7897 Grand StDev 0.1174 0.1479 0.1068 0.0225 0.0311 0.0399
Note. rWG-u-nn is the rWG based upon the uniform distribution resetting negative values to zero. rWG-ss-nn is the rWG based upon the slightly skewed distribution resetting negative values to zero. rWG-ms-nn is the rWG based upon the slightly skewed distribution resetting negative values to zero.
True or False? 25
Table 7
Intraclass correlation coefficients, interclass (Pearson) correlation coefficients, and rWGs for boss-direct report ratings.
Boss-DR mean mean mean
N ICC(1,1) ICC(1,2) Pearson rwg-un-nn rwg-ss-nn rwg-ms-nn SCALE01 Resourcefulness 6267 0.3208 0.4858 0.3420 0.9243 0.8874 0.8390 SCALE02 Doing Whatever it Takes 6269 0.3698 0.5399 0.3820 0.9240 0.8873 0.8391 SCALE03 Being a Quick Study 6220 0.2884 0.4476 0.3080 0.8866 0.8353 0.7720 SCALE04 Decisiveness 6265 0.4018 0.5732 0.4250 0.8634 0.8026 0.7320 SCALE05 Leading Employees 6171 0.3732 0.5436 0.3790 0.9117 0.8700 0.8158 SCALE06 Setting Developmental Climate 6165 0.3011 0.4628 0.3210 0.8892 0.8389 0.7769 SCALE07 Confronting Problem Employees 5674 0.3032 0.4653 0.3130 0.8424 0.7768 0.7016 SCALE08 Work Team Orientation 6198 0.3416 0.5092 0.3810 0.8658 0.8084 0.7409 SCALE09 Hiring Talented Staff 5749 0.2238 0.3658 0.2590 0.8724 0.8167 0.7488 SCALE10 Building/Mending Relationships 6271 0.4481 0.6189 0.4570 0.8994 0.8529 0.7950 SCALE11 Compassion/Sensitivity 6054 0.3200 0.4848 0.3800 0.8705 0.8130 0.7439 SCALE12 Straightforwardness and Composure 6262 0.2784 0.4356 0.3030 0.8894 0.8382 0.7752 SCALE13 Balance Between Personal- and Work Life 5985 0.4283 0.5997 0.4540 0.8482 0.7863 0.7158 SCALE14 Self-Awareness 6201 0.2379 0.3844 0.2600 0.8422 0.7767 0.7028 SCALE15 Putting People at Ease 6279 0.4760 0.6450 0.4850 0.8570 0.7965 0.7255 SCALE16 Acting with Flexibility 6271 0.3327 0.4993 0.3380 0.8906 0.8405 0.7790
Grand Mean 0.3403 0.5038 0.3617 0.8798 0.8267 0.7627 Grand StDev 0.0720 0.0796 0.0685 0.0266 0.0358 0.0441
Note. rWG-u-nn is the rWG based upon the uniform distribution resetting negative values to zero. rWG-ss-nn is the rWG based upon the slightly skewed distribution resetting negative values to zero. rWG-ms-nn is the rWG based upon the slightly skewed distribution resetting negative values to zero.

True or False? 26
Table 8
Intraclass correlation coefficients, interclass (Pearson) correlation coefficients, and rWGs for boss-peer ratings.
Boss-Peer mean mean mean
N ICC(1,1) ICC(1,2) Pearson rwg-un-nn rwg-ss-nn rwg-ms-nn SCALE01 Resourcefulness 6660 0.4266 0.5981 0.4470 0.9379 0.9075 0.8666 SCALE02 Doing Whatever it Takes 6663 0.4543 0.6247 0.4740 0.9366 0.9055 0.8635 SCALE03 Being a Quick Study 6618 0.3605 0.5299 0.3870 0.9034 0.8586 0.8009 SCALE04 Decisiveness 6654 0.4787 0.6474 0.5100 0.8818 0.8270 0.7599 SCALE05 Leading Employees 6460 0.4526 0.6232 0.4680 0.9270 0.8918 0.8449 SCALE06 Setting Developmental Climate 6440 0.3538 0.5227 0.3830 0.9098 0.8671 0.8116 SCALE07 Confronting Problem Employees 5860 0.3862 0.5572 0.4030 0.8671 0.8084 0.7385 SCALE08 Work Team Orientation 6546 0.4174 0.5890 0.4460 0.8853 0.8334 0.7697 SCALE09 Hiring Talented Staff 5951 0.3268 0.4926 0.3500 0.8868 0.8355 0.7728 SCALE10 Building/Mending Relationships 6664 0.5490 0.7088 0.5650 0.9189 0.8800 0.8289 SCALE11 Compassion/Sensitivity 6406 0.4070 0.5785 0.4490 0.8954 0.8470 0.7866 SCALE12 Straightforwardness and Composure 6655 0.3152 0.4793 0.3740 0.8946 0.8457 0.7834 SCALE13 Balance Between Personal- and Work Life 6375 0.4911 0.6587 0.5050 0.8836 0.8315 0.7683 SCALE14 Self-Awareness 6593 0.3465 0.5147 0.3710 0.8736 0.8175 0.7501 SCALE15 Putting People at Ease 6668 0.5498 0.7095 0.5620 0.8851 0.8330 0.7699 SCALE16 Acting with Flexibility 6658 0.4202 0.5918 0.4350 0.9116 0.8702 0.8171
Grand Mean 0.4210 0.5891 0.4456 0.8999 0.8537 0.7958 Grand StDev 0.0724 0.0710 0.0663 0.0218 0.0306 0.0395
Note. rWG-u-nn is the rWG based upon the uniform distribution resetting negative values to zero. rWG-ss-nn is the rWG based upon the slightly skewed distribution resetting negative values to zero. rWG-ms-nn is the rWG based upon the slightly skewed distribution resetting negative values to zero.

True or False? 27
Table 9
Intraclass correlation coefficients, interclass (Pearson) correlation coefficients, and rWGs for peer-direct report ratings.
Peer-DR mean mean mean
N ICC(1,1) ICC(1,2) Pearson rwg-un-nn rwg-ss-nn rwg-ms-nn SCALE01 Resourcefulness 6805 0.4258 0.5973 0.4340 0.9524 0.9289 0.8966 SCALE02 Doing Whatever it Takes 6806 0.4828 0.6512 0.4890 0.9526 0.9295 0.8976 SCALE03 Being a Quick Study 6793 0.4209 0.5924 0.4220 0.9323 0.8998 0.8566 SCALE04 Decisiveness 6808 0.5216 0.6856 0.5220 0.9248 0.8887 0.8409 SCALE05 Leading Employees 6799 0.4471 0.6179 0.4490 0.9361 0.9047 0.8631 SCALE06 Setting Developmental Climate 6795 0.3977 0.5691 0.4030 0.9222 0.8853 0.8365 SCALE07 Confronting Problem Employees 6588 0.3892 0.5603 0.3910 0.8979 0.8515 0.7943 SCALE08 Work Team Orientation 6785 0.4342 0.6055 0.4510 0.9193 0.8807 0.8305 SCALE09 Hiring Talented Staff 6676 0.2719 0.4276 0.3260 0.9154 0.8759 0.8249 SCALE10 Building/Mending Relationships 6810 0.5473 0.7074 0.5480 0.9334 0.9013 0.8595 SCALE11 Compassion/Sensitivity 6790 0.4603 0.6304 0.4670 0.9117 0.8703 0.8178 SCALE12 Straightforwardness and Composure 6806 0.3650 0.5348 0.3760 0.9271 0.8925 0.8464 SCALE13 Balance Between Personal- and Work Life 6748 0.5729 0.7285 0.5920 0.9019 0.8568 0.8006 SCALE14 Self-Awareness 6786 0.3862 0.5572 0.3910 0.9048 0.8603 0.8045 SCALE15 Putting People at Ease 6815 0.5849 0.7381 0.5900 0.9045 0.8607 0.8063 SCALE16 Acting with Flexibility 6811 0.4222 0.5937 0.4240 0.9247 0.8886 0.8420
Grand Mean 0.4456 0.6123 0.4547 0.9226 0.8860 0.8386 Grand StDev 0.0819 0.0793 0.0765 0.0165 0.0235 0.0312
Note. rWG-u-nn is the rWG based upon the uniform distribution resetting negative values to zero. rWG-ss-nn is the rWG based upon the slightly skewed distribution resetting negative values to zero. rWG-ms-nn is the rWG based upon the slightly skewed distribution resetting negative values to zero.