;tructural#nalysis - defense technical information … · the avco bi-directional flywheel design...
TRANSCRIPT

, .47LSAA4 AD
AMMRjR 7 -24
4 ;TRUCTURAL#NALYSIS AND3ESTING FOR )
COMPOSITE LYWHEEL REVELOPMENT )ISE PU 7 7(?- PO,,LD ./10,,s0,) ...-.-
LVCO SY TEMS IVM201 LOWELL ST., WILMINGTON, MA01887
Final #e ontract NumberAAG46-77-C- 17J
Ys cvc. - .3 '77Approved for public release; distribution unlimited.
itprepared for o" D D Cc' RMY MATERIALS AND MECHANICS RESEARCH CENTER r, atertown, Massachusetts 02172 U JAN 4 1978
( / / , 6U- [S U/~ LIU 1
The findings in this report are not to be construed as an officialDepartment of the Army position, unless so designated by otherauthorized documents.
Mention of any trade names or mar.nufacturers in this reportshall not be construed as advertising nor as an officialindorsement or approval of such products or companies bythe United States Government.
DISPOSITION INSTRUCTIONS
Destroy this report when it is no longer needed.Do not return it to the originator.
UNCLASSIFIEDSECURITY CLASSIFICATION OF THIS PAGE (*?ton Date Entered)
REPOT DCUMNTATON AGEREAD INSTRUCTIONSREPOT DCUMNTATON AGEBEFORE COMPLETING FORMI REPORT NUMaER 2GOVT ACCESSION No. 3 RECIPIENT'S CATALOG NUMBER
4 TILE (nd Sbtite) TYPE OF REPORT & PERIOD COVERED
V STRUCTURAL ANALYSIS AND TESTING FOR FNLRPRCOMPOSITE FLYWHEEL DEVELOPMENT 12/7-937
6 PERFORMING ORG. REPORT NUMBER
7 AUTHOR(a) 8 CONTRACT OR GRANT NUMBER(s)
Donald E. Johnson DAAG46-77--C-0017
9 PERFORMING ORGANIZATION NAME AND ADDRESS 10 PROGRAM ELEMENT. PROJECT, TASKAREA & WORK UNIT NUMBERS
Avco Systems Division )/A Project:201 Lowell Street MCMS Code:Wilmington, Massachusetts 01887 kyency Accession:
I I. CONTROLLING OFFICE NAME AND AODDEL.S 12 REPORT DATE
Army Materials and Mechanics Research Center Spebr17Watertown, Massachusetts 02172 3NMEOPAS
t4 MONITORING AGENCY NAME A ADDRESS(11 different fromt Controlling Office) 15 SECURITY CLASS (of this report)
Unclassified
IaDECLASSIFICATION'0OWNGRAOINGSCHEDULE
IS. OISTRIOUTION STATEMENT (of this Report)DC
Approved for public release; distribution unlimited. an'~ ?fhIl
17. DISTRIBUTION STATEMENT (of the abstract entered in Bloch 20, it diff erent troam Report)
IS SUPPLEMENTARY NOTES
19 KEY WORDS (Continue an reverse side it nercessary and identify by block number)
Flywheels FractureComposite materials Stress analysis
20 ABSTRACT (Continue an reverse side ii neceeery and Identify by block number)
(SEE REVERSE SIDE)
DD JA 7 1473 EDITION OF I NOV £15 OBSOLETE UCASFEr SECURITY CLASSIFICATION OF THIS PAGE (When Date Ente,vd)

UNCLASSIFIEDSECURITY CLASSIFICATION OF THIS PAGE(nema Does Ernlee,)
Block No. 20
ABSTRACT
Several effects that can limit the performance of bi-directionallyreinforced composite flywheels are investigated. These effects includepotential shear failures, degraded properties and variations caused bymanufacturing. Finite element analyses are used to determine both thein-plane and interlaminar shear stresses that arise from the discretenessof the individual radial reinforcements. The degradation of materialproperties due to high biaxial stress levels, especially a drop in shearmodulus, is also investigated. Degraded properties are obtained experi-mentally and used in the evaluation of flywheel performance. Alsoincluded is an analysis to determine the feasibility of a staticsimulation test. In addition, the effect of asymmetric material propertyvariation on flywheel imbalance was investigated.
I/
AMMION for
NTIS White SectionDOC Buff Section oUNANNOUNCED
UI.FICA.ION ....
ByK 1tS ---IAM IA !ist. AVAIL and/or SPECI
UNCLASSIFIEDSECURITY CLASSIFICATION OF THIS PAGE(?Wlh Dal* Fittteed)

CONTENTS
Section Page
1. INTRODUCTION .................................................. 9
1.1 Summary ................................................... 91.2 Background and Preliminary Development .................... 9
2. ANALYTTCAL ASSESSMENT OF DEGRADED PROPERTIES ................... 27
2.1 Introduction ............................................ . 272.2 Preliminary Investigation: Undegraded versus
Degraded ................................................. 272.3 Effect of Degraded Shear Modulus .......................... 272.4 Correlation of Predictions with Measured Degradation ...... 34
3. SENSITIVITY STUDIES ............................................ 35
3.1 Introduction ................ . ....... . . . . . . . 353.2 Variations in Fiber Volume ................................ 353.3 Variations in Hoop and Radial Geometries .................. 37
3.4 Evaluation of Asymmetric Property Variations .............. 49
4. ANALYSIS OF STATIC SIMULATION TEST ............................. 51
4.1 Introduction .............................................. 514.2 Geometric Parameters ...................................... 514.3 Simulation of al/ 1 .................................. 534.4 Simulation of arz/% .00777 ............................. 584.5 Simulation of o/a -. 01903 ............................ 614.6 Selection of a Typical Simulated Flywheel Configuration 61
5. TESTING FOR DEGRADED PROPERTY EFFECTS .......................... 63
5.1 Mechanical Evaluation ..................................... 635.2 Composite Lay-Up ......................................... 665.3 Reduction of Data ......................................... 66
6. CONCLUSIONS ................................................... 69
3/4

- i
ILLUSTRATIONS
Figure Page
1-1 Schematic of typical bi-directionally reinforced flywheel ..... 11
1-2 Non-dimensional stresses from equivalent axisymmetricmodel -- reference desJign ....................... ........... 13
1-3 One dimensional finite element grid used for axisymmetricianalyses ................... o........ ........... o................ 15
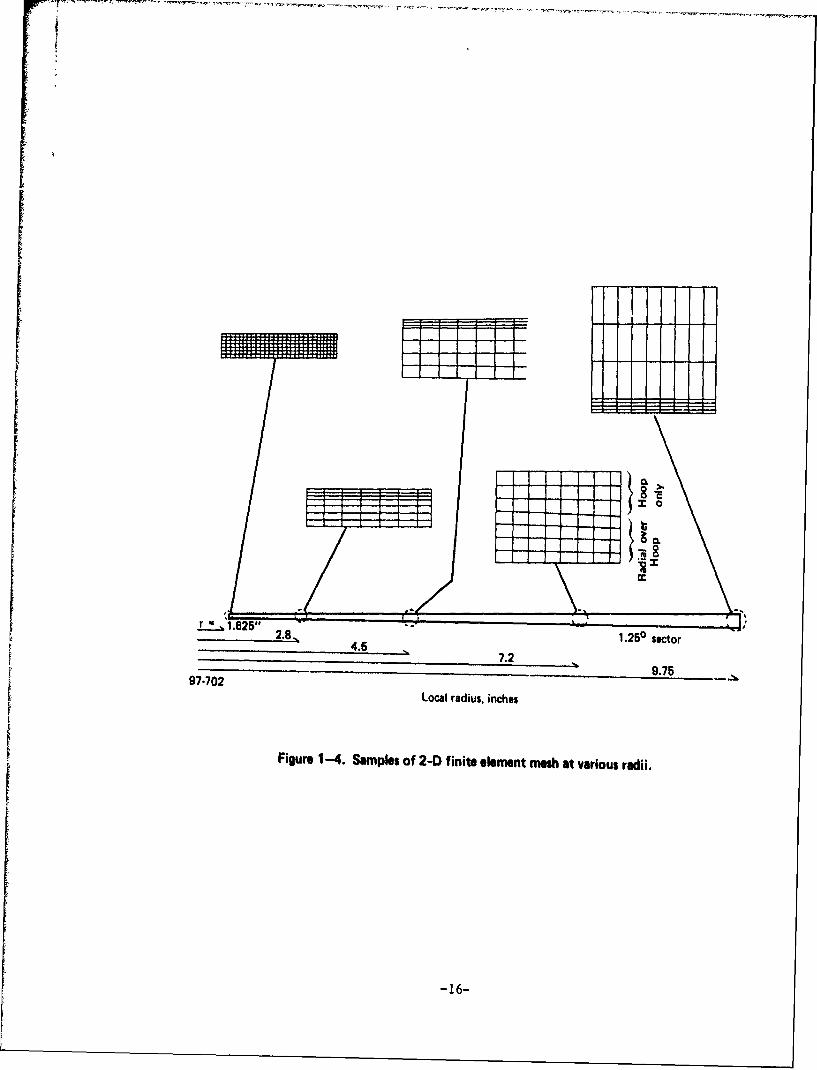
1-4 Samples of 2-D finite element mesh at various radii ..... .. 16
1-5 Finite element grid used for asymmetric property variations ... 17
1-6 Original flywheel with degraded properties, comparison ofhoop stresses in fiber direction o8o in the hoop layer ........ 19
1-7 Original flywheel with degraded properties, comparison ofradial stresses in the fiber direction arr along thecenterline of radial reinforcement ........................... 20
1-8 Original flywheel with undegraded properties, comparison ofhoop stresses in the fiber direction 000 in the hoop layer .... 21
1-9 Original flywheel with undegraded properties, comparison ofradial stresses in fber direction o along centerlineof radial reinforcement ....................... 2.2. .. .... 22
1-10 Original flywheel with degraded nropertiea, comparison ofshear stresses aO ................... ...... *0.... ...... 23
1-11 Original flywheel with degraded properties, comparison ofshear stresses arz .......................... .s.... ... 24
2-1 Degraded versus undegraded, comparison of radial stresses infiber direction arr along centerline of radial reinforcement *. 28
2-2 Degraded versus undegraded, comparison of hoop stresses infiber direction a8o in the hoop layer .......... ............... 29
2-3 Comparison of radial stress distribution for undegraded anddegraded shear moduli ........................... ... #. . ....... 31
2-4 Comparison of hoop stress distribution for undegraded anddegraded shear moduli ......................... .............. 32
2-5 Effect of reduction in shear moduli on shear stresses orzand or 0 ..-................................. ............... 33
-5-
ILLUSTRATIONS (Concl'd)
Figure Page
3-1 Variation of modulus and shape factor Ks with volumefraction Vf ................................................... 36
3-2 Stress distributions versus hoop fiber volume ratio ........... 38
3-3 Variations of arz and a.0 with fiber volume ratioVf, for Vf = .59 for radials, Vf varies for hoop .............. 39
3-4 Radial stress distribution for local variation of Vf inhoop layer .................................................... 40
3-5 Hoop stress distribution for local variation of Vf inhoop layer .................................................... 41
3-6 Sensitivity of stresses to hoop layer thickness ............... 43
3-7 Sensitivity of shape factor to hoop layer thickness ........... 44
3-8 Sensitivity of shear stresses to hoop layer thickness ......... 45
3-9 Stress distributions versus radial width variations for+.010 and -.010 inch changes in radial width .................. 46
3-10 Sensitivity of shape factor to radial width ................... 47
3-11 Sensitivity of shear stress arz to radial width ............... 48
3-12 2-D Models used to evaluate asymmetric property variations ..... 50
4-1 Ideal variation of equivalent radial thickness hr for
static simulation test ........................................ 52
4-2 Schematic of static simulation test ........................... 55
4-3 Ratios of hr/ho for which armax - uOmax (for constant hr) ..... 57
4-4 Percent change in hoop stress caused by local bending ........ 59
4-5 Schematic of derivation of arz and arO stresses ............... 60
5-1 Biaxial beam schematic ................... .................... 64
5-2 Coupon sample layout for subsequent tensile and short beamshear tests .................................................. 65
5-3 Butt joints and overlap scheme for 9-inch long strips ......... 67
-6-
A
FOREWORD
This research has been conducted by Avco Systems Division, Wilmington,Massachusetts under Contract No. DAAG46-77-C-0017 from the Army Materials andMechanics Research Center, Watertown, Massachusetts. Mr. Donald W. Oplingerof AMMRC served as the Contracting Officer's representative. His advice andguidance during the course of this work are very much appreciated.
7/8

SECTION 1
INTRODUCTION
1.1 SUM4ARY
This report summarizes the results of an investigation of bi-directionallyreinforced -omposite flywheels. The investigation focuses on the hoop-radialtype of bi-directional configuration developed by Avco and includes bothanalytical And experimental work. This work is divided into four majorportions:
* Analytical Assessment of the Effect of Degraded Material Properties(Section 2)
* Sensitivity Studies (Section 3)
0 Analysis of Static Simulation Test (Section 4)I Testing for Degraded Property Effects (Section 5)
Some conclusions from this work are: (1) decreases of in-plane shearmodulus of up to 90 percent have small effect on the maximum stresses,(2) changes in hoop thickness or fiber volume ratio can cause changes ofsimilar magnitude in theoretical flywheel efficiency, (3) static simulationtests are feasible but must include substantial numbers of radials to preventpremature shear failures, and (4) degraded property effects can be measuredexperimentally and substantial reductions in moduli and shear stress allow-ables are found. These and other results are discussed in greater detail inSection 6.
1.2 BACKGROUND AND PRELIMINARY DEVELOPMENT
Bi-directionally reinforced flywheels offer potential advantages overthe more conventional composite ring designs, such as greater energy per unitvolume and a larger number of geometric parameters to apply to the design ofhub connections. In addition, theoretical analyses show that the storedkinetic energy per unit weight of a bi-directionally reinforced wheel can bewithin a few percent of that obtained through ring designs.
The kinetic energy per unit weight of a composite flywheel composed ofone material can be written in the following form.
Kinetic Energy K
Weight P9
-9-
where
Ks w shape factor
o - allowable tensile stress of a I-D ply in the 00 direction
pg w weight/unit volume of the wheel.
For a given material a and pg are known and the primary problem is toconfigure the wheel to achieve the highest possible value of Ks. Analyses*based on the neglecting of the very low 900 tensile strengths indicatethat the maximum K. obtainable for a composite is .5. (For a simplering Ks - .5.) Design experience at Avco indicates that some deviation fromthe optimum is necessary to prevent excessive hoop-radial interlaminar shearstresses. As a result the shape factor K. must be slightly reduced from .5to .474. It should be noted that since the formula for kinetic energy perunit weight involves only the strength in the 00 direction, the formula ap-plies to a flywheel which has been designed to avoid premature failures as-sociated with other stress components.
The Avco bi-directional flywheel design consists of a stacked sequence
of hoop and radial layers. The hoop layers are approximately .017-inch thickand essentially axisymmetric. The radial layers each contain 144 radialmembers .008-inch thick and of tapered width to provide optimum efficiency.The material is Kevlar 49. A simplified schematic drawing of the Avco designis shown in Figure 1-1. This schematic drawing shows only 16 of the 144radial members present in the actual design. This design** is used as areference point for the investigations carried out for this report. Conse-quently, it is appropriate to outline and define the basic parameters thatcontrolled the reference design.
At the onset we introduce appropriate nondimensional stress nomenclatureas follows:
a
p a2 R2
where
a - stress
I a nondimensional stress
p - mass density of a ply
*Johnson, D. E., Maximum Shape Factor for Cor,.posite Flywheel Avco Technical Releam K40&T-322-A. August 27, 1975.
"Sapowith, A., Phase I Interim Technical Report, Avco AVSD-0189-76-CR, June 18, 1976.
-10-

85-1569
Figure 1-1. Schematic of typical bi-directionally reinforced flywheel.

S= angular velocity in radians/sec.
R = outside radius of the flywheel
The nondimensionalization symbol ^ is applied to various stress components.The nondimensional aspect of this problem implies that the results from theseanalyses can be applied to a whole family of wheels of varying outsideradius -- provided the thicknesses of the individual plys are scaled propor-tionately with the outside radius.
The dominant feature of an efficient bi-directional flywheel is a biaxialstate of stress with approximately equal stresses in the hoop and radialdirections. For Kevlar the 00 and 900 failure strains, (0 and (90 form thefollowing ratio
(90 0.22%- = - = .138(0 1.6%
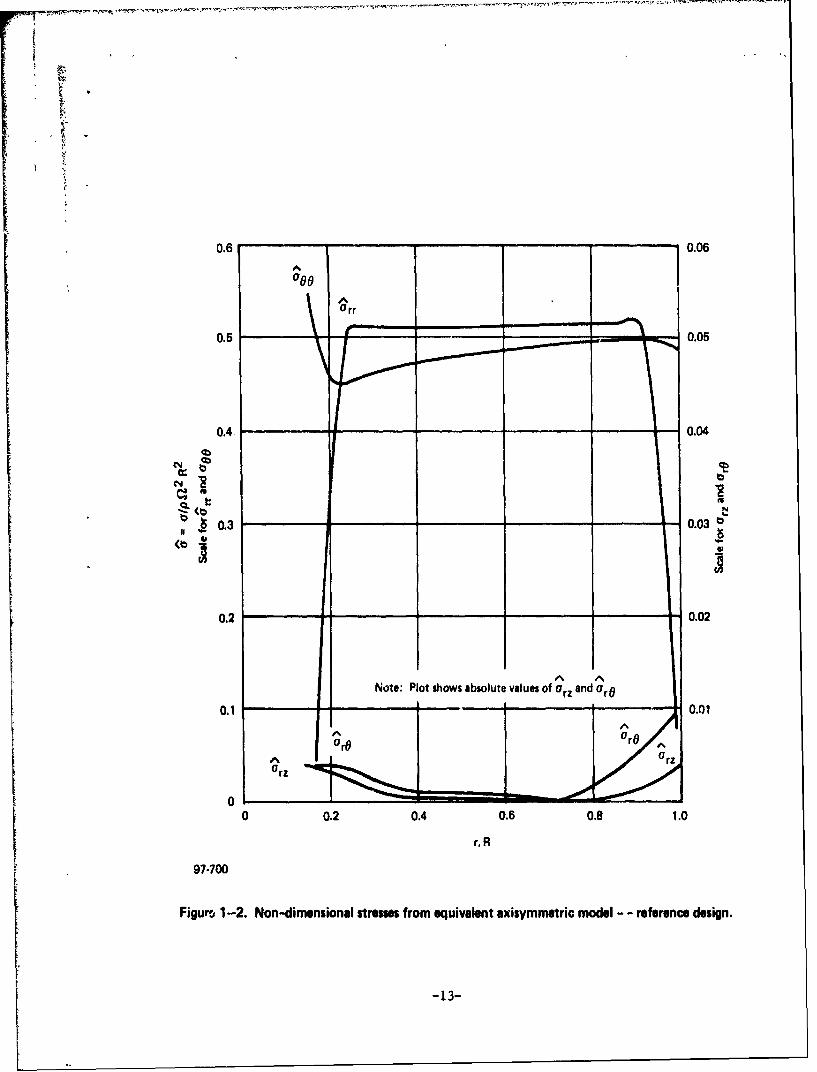
This implies that the transverse (900) properties of the Kevlar will be de-graded, and crazing will occur well before the 00 failure strains are reached.Because of this reason the radial configuration for the reference Kevlar fly-wheel was designed on the basis of E90 - 0 in each hoop and radial ply. Toimplement the iterations required during the design process a "smeared out"axisymmetric finite element model was used to obtain the optimally shapedradial reinforcements that yielded the highest shape factor Ks . The non-dimensional stresses derived from the axisymmetric model are shown inFigure 1-2. This figure clearly shows the dominant features of the problem:nearly biaxial (a. - a0 ) stresses over the interior of the wheel and verymuch smaller shear stresses a, and ato (see separate scale on right side ofthe figure). Unfortunately the shear allowables are correspondingly smaller,as may be seen from Table 1-1 which summarizes the maxima of the stressesshown in Figure 1-2 together with the corresponding stresses from a morecomplex two-dimensional finite element model of the same problem. The 2-Dmodel is thus used as a check on the simpler equivalent axisymmetric modelwhich is so well suited for the parametric variations of radial geometry re-quired during design.
TABLE 1-1. STRESSES IN REFERENCE FLYWHEEL DESIGNFOR Eg0 = 0(DEGRADED)
Equivalent axisymietricType of analysis 2-D Finite elementStress Allowables*
Atf - 5685 At Q - 5630Nondimensional radians/sec Nondimensional radians/sec
.516 200 ksi .514 200 ksi 188-211 ksio .516 200 ksi .530 200 ksi 188-211 ksiUtz .00401 1.55 ksi .00355 1.34 ksi 1.45-7.9 ksiO .00982 3.81 ksi .01032 3.90 ksi 7.9 ksi
*Based on Avco tests and duPont report "Characteristics and Uses of Kevlar 49
High Modulus Organic Fiber," by R. L. Hunter, revised 9/18/73.
-12-
0.6 0.06
0.5 0.05
0.4, 0.04
CqI C4
, 0.3 0.0300
0.2 0.02
Note: Plot shows absolute values of arz and O0.0.1 '0.01
Grz
0 Lr0j0 0.2 0.4 0.6 0.8 1.0
r, R
97-700
Figuro 1-2. Non-dimensional stresses from equivalent axisymmetric model - - reference design.
-13-

Material Properties
Unless otherwise specified, the following Kevlar 49 mechanical propertiesare used in this report:
Values usedEquivalent
Property nomenclature Undegraded Degraded
El E0 - E 12 x 106 psi 12 x 10 6 psi
E2 E3 E90 0.8 x 10⁶ 0
V1 2 v" 13 .34 0
"21 v"31 .0227 0
v32 .48 0
G12 G 0.3 x 10⁶ psi .3 x 106 psior reduced*
These properties are derived from the properties given by dupont.** Aspointed out in the previous section the degraded properties were used in theflywheel design because of the very low transverse (900) strain capability ofKevlar. It should also be noted that the linear elastic nature of the prob-
lem is such that the resulting stresses are unchanged if the moduli El, E2 ,E3 and G are multiplied by the same scalar constant.
Comparison of Finite Element Models
Three different types of finite element models were used in this report:
1. 1-D Axisymmetric Model
2. 2-D Model including Discrete Radials
3. 2-D Model using "Smeared Out" Properties
Each of these three models assumes plane stress. Solutions from the 1-Daxisymmetric model are functions of the radial coordinate, r, only. Solu-tions of the 2-D models are functions of both r and 0.
Examples of the finite element grids used in these three models are shown
in Figures 1-3 through 1-5. In the 2-D model with discrete radials shown inFigure 1-4, the nodes in the hoop-radial overlap region each have one set ofplanar displacements, i.e., in spite of the overlapping the model remains
*A, investigation in which G12 is reduced below this value is presented in Section 2 of this report."Hunter. R. L . "Characteristics and Uses of Kevlar 49 High Modulus Organic Fiber,' duPont Report, revised 9/18/73.
-14-

- -
97-701
Figure 1-3. One dimensional finite element grid used for axisymmetric analyses.
-15-
...........-....
I
f I
2.8,5 1.250 sector
r:
M
97.70297-702
"
Local radius. inches
9.75
Figure 1-4. Samples of 2-D finite element mesh at various radii.
-16-

II
97-703
Figure 1-5. Finite element grid used for asymmetric property variations.
-17-

planar. This model uses 2488 nodes and 3410 elements to represent the veryslender angular section shown in Figure 1-4.
Most of the work was done using the first two models, the last beingmainly used to determine the effects of gross asymmetries and imbalance.
Each of the three finite element models produces the Or stresses in theradials and the aoo stresses in the hoops directly. In the 2-D models thein-plane shear stresses aro are also produced directly. Because of the axi-symmetry of the 1-D finite element model, it gives aro , Or - 0. Neverthe-less, it is possible to start with the a from the 1-D modal and compute,via static equilibrium, the Oro stresses that would occur if one had a setof discrete radial reinforcements as shown in Figure 1-1. The essence ofthis calculation is shown in Figure 4-5 and is based on the previously citeddamaged properties. None of the three finite element models used in thiswork gives the interlaminar stress arz directly. Consequently, the arzstresses were obtained from the other stresses by using static equilibrium.The method applied to the 1-D model is very similar to that used for obtaininga and is outlined in Figure 4-5. The stresses arz for the 2-D model werealso derived using static equilibrium: In this case the net force on a smallelement of each layer (hoop and radial) were computed and used to determinethe force transferred between the layers by the interlaminar shear stress.
Because the state of stress in the bi-directionally reinforced wheel isalmost axisymmetric, the stress distributions presented in this report aregenerally plotted as functions of the radial coordinate r. The relativelysmall deviations from axisymmetry, when they appear, are indicated by showingthe maximum and minimum values with respect to changes in the 0 (circumfer-ential) coordinate. In figures such as 1-8 or 2-3, the deviation from axi-symmetry is sufficiently great so that two separate dashed curves are usedto show the maximum and minimum values.
Because these several different models were used to carry out the workpresented in this report, it is appropriate to pause and obtain a check ofthe accuracy by comparing results obtained by the different models for theoriginal flywheel design. This was carried out for two different cases, oneusing the undegraded properties shown in the table and one using the degradedproperties (with G - .3 x 106).
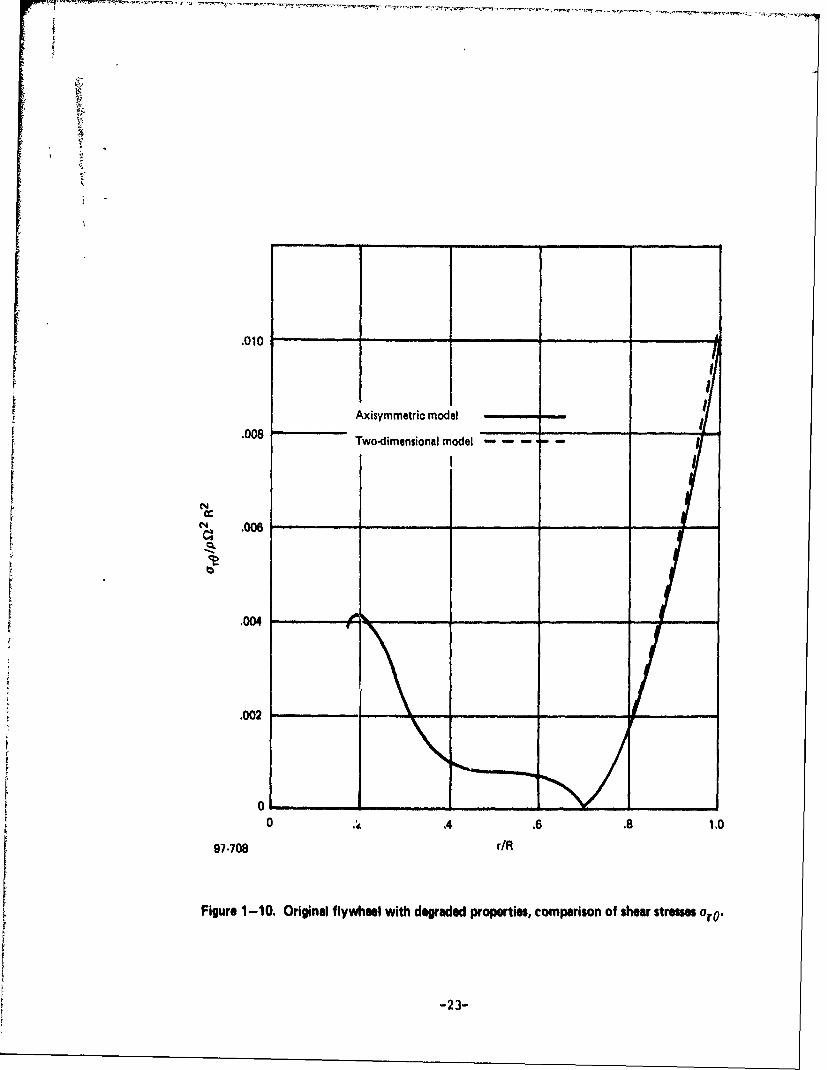
Figures 1-6 through 1-9 show that for the hoop and radial stresses thetwo models give almost the same results for each cas=. the difference betweenthem being of the same order as the circumferential variation (see a0) withinthe 2-D model itself. Similar agreement is seen in Figure 1-10 for the aoshear stresses. The arz stresses shown in Figure 1-11, however, show a con-siderable difference between the average arz values derived from the axi-symmetric model and those from the 2-D model. This latter difference is notaccountable from the circumferential variations in the 2-D model but appearsto be caused by a fundamental difference between the two models. Because ofthe planar nature of the 2-D model it gives a ar that does not approach zeroat the edge of a radial. This can violate the shear-free condition actually
-18-

f - X
xC.5-
'N
(N
S.4
Axismmetric moCel
Max - XTwo dimensional model.3 IMin-)
Coarse grid two-dimensional model - -
Shown in Figure 1-5
0 .2 .4 .6 .8 1.0
r/R97-704
Figure 1-6. Original flywheel with degraded properties, comparison of hoop stresses infiber direction u00 in the hoop layer.
-19-

I
.6
-- %.5 ~
.4
n, .3
.2
Axisymmetric model
Iwo dimensional model Max- XMin- 0
Coarse grid two-dimensional i
Model shown in Figure 1-5
0 .2 .4 .6 .8 1.0r/R
97.705
Figure 1-7. Original flywheel with degraded properties, comparison of radial stresses in thefiber direction Orr along the centerline of radial reinforcement.
-20-

.6
Maximum
cc
~~~Minimum .. ..
.4 Axisymmetric model
Two-dimensional model
0 .2 .4 .6 .8 1.0
97-706 r/R
Figure 1-8. Original flywheel with undegraded properties, comparison of hoop stresses in th,fiber direction u00 in the hoop layer.
-21-

.3 oTant2D wiithieent rdial
.3 indicates O~rr approximately
N respect to 0.
*Center with respect to 0 direction.
.2
_________ _________ Axisymmetric model
Two dimensional model ----
I ____________________ ____________________ _________________0__
0 .2 .4 .6 .8 1.0
97.707 r/R
Figure 1 -9. Original flywheel with undegraded properties, comparison of radial stresses infiber direction '7rr along centerline of radial reinforcement.*
-22-
.010
Axisymmetric model ,_,
.008 Two-dimensional model
C;0
.004__ _ _ _ _ _
.002
oL0 .4 .6 .8 1,0
97-708 r/R
Figure 1-10. Original flywheel with degraded properties, comparison of shear stresses 0 rO.
-23-

i
.004
Axisymmetric model
S- ,-,, Two-dimensional model
I
IN
ID
.002 i
.001
.oo I
I I
0 .2 .4 .6 .8 1.0
97-709 r/R
Figure 1-11. Original flywheel with degraded properties, comparison of shear stresses Orz.
-24-
r
present at the lateral free edge of a radial. It is believed that the dif-ferences shown in Figure 1-11 can only be resolved by a local 3-D finiteelement analysis in the region of the edge of the radial. Nevertheless, themaximum az stresses shown in Figure 1-11 differ only by 13 percent. Conse-quently, the differences between the models does not present a seriousobstacle even for these a., hoop-radial interlaminar shear stresses.
25/26

SECTION 2
ANALYTICAL ASSESSMENT OF EFFECT OF DEGRADED PROPERTIES
2.1 INTRODUCTION
In this section we investigate the effect of degraded material propertiescaused by the high biaxial stresses in the flywheel. The analytical resultsare obtained by using the two-dimensional finite element grid shown in Figure1-4 and described in Section 1.
2.2 PRELIMINARY INVESTIGATION: UNDEGRADED VERSUS DEGRADED
As previously mentioned, the flywheel is designed using the E90 - 0,V- 0 degraded properties because of the low transverse (900) strain allowableof Kevlar. The resulting flywheel has thus been optimized on the basis of thedegraded properties. If the same configuration is analyzed using undegradedproperties, the stress distributions are as shown in Figures 2-1 and 2-2. Itis immediately apparent that the design was optimized for the degraded con-dition because the maximum stresses are substantially larger in the undegradeddesign, as summarized in the following table:
RESULTS FOR 2-D FINITE ELEMENT ANALYSIS
Undegraded Degraded
"tmax
- .514 .605p2 R2
6max 530 .470
P n2 R2
Ks (2-D Analysis) .461 .404
This table also shows the shape factor K computed for these two cases andsindicates a 12 percent lower K. (and hence lower energy density) for the un-degraded condition than for the degraded condition used to optimize thedesign.
2.3 EFFECT OF DEGRADED SHEAR MODULUS
A series of two-dimensional finite element runs were made to determinethe effect of reducing the shear modulus G for the degraded properties shownin Section 1. The results shown in Table 2-1, are somewhat startling. They
-27-
.6
From 2-D finite element model
Degraded
) Undegraded
.3
.4
.2 -
0 .2 .4 .6 .8 1.0
rR97-710
Figure 2-1. Degraded versus undegraded, comparison of radial stresses in fiber direction arralong canterline of radial reinforcement.
-28-
From 2-D finite element analysis
x
IMa
w Degraded
.4 J
.2 .4 ,8 .8 1.097-711
r/R
Figure 2-2. Degraded versus undegraded, comparison of hoop stresses in fiber direction oOin the hoop layer.
-29-

indicate that the maximum stresses and shape factor K. are almost unaffectedby reductions in the shear modulus down to one-tenth of the orginal. Thedistributions of the stresses shown in Table 2-1 are given in Figures 2-3through 2-5 for the two cases G/Gori - 1 and G/Gorig - .1. Although thefi;ures show very little change in the maximum stresses with the reduction ofG/Gorig to .1, they do indicate the beginnings of changes in the stress pat-tern. Figure 2-3 shows that as the shear modulus is lowered, the distributionof ar stresses in the circumferential direction across a radial becomes in-creasingly nonuniform. At G/Gorig - .1, as shown in Table 2-1, the nonuni-formity is already sufficiently great for the radial stresses to become themaximum stresses in the wheel. Figure 2-4 shows a similar circumferentialnonuniformity in the hoop stresses near the outside of the wheel as the shearmodulus is reduced. These trends would indicate that the ar and ao stresseswill increase as G is reduced below .1.
TABLE 2-1., EFFECT OF DEGRADED SHEAR MODULUS(FROM 2-D FINITE ELEMENT ANALYSIS)
G/Goriginal 1.0 .5 .1
armax
.514 .517 .526
p 12 R2
aomax.530 .529 .523
p122 R2
arz.00355 .00356 .00354
pn22 R2
UtO .01032 .00958 .00947
P o2 R2
Ks .461 .462 .465
Implications of this result are as follows. First, within the range ofG degradations considered it indicates that the dominant effect on flywheel
efficiency will come from reduced shear stress allowables rather than fromthe reduced modulus. The differing effects of shear modulus and shear allowa-bles are illustrated, by example, in Section 2.4. Second, the results indicatethat G/Gorig must be reduced bel6w .1 to alter the stresses a and ao suffi-
ciently to effect the overall flywheel shape factor Ks. Further evaluation ofextremely degraded G cases is being continued at the present time.
-30-
.6-
.5
.4
N
N
.2G
G max- X
.1 G 0 Min- 0
0 .2 .4 .6 .8 1.0
r/R
Figure 2-3. Comparison of radial stross distribution for undegraded anddegraded shear moduli.
r4
p1
0 .2 .4 .6 .8 1.0
97-713 r/R
Figure 2-4. Comparison of hoop stress distribution for undlegraded anddegraded shear moduli.
-32-
.01
.009 - _ _ _
I
.008I
.007 G/Goi .- 1, .1
N .006 rz N
0 5O r o.004 - /
.003 ____
.002 -6__ _ G /G orig - 1 1 I
.001-
/rz0-
.2 .4 . . 1.0r/R
97-714
Figure 2-5. Effect of reduction in heer moduli on dhear stresms arz and aO0.
-33-
2.4 CORRELATION OF PREDICTIONS WITH MEASURED DEGRADATION
We now correlate the analytical predictions with the property degradationmeasured experimentally and reported in Section 5. The experimentally deter-mined shear modulus ratio G/Goriginal is .825 and falls within the rangecovered by Table 2-1. This indicates that the wheel stresses are essentiallyunaffected. The reduction in shear strength to .728 of the undegraded strength,however, indicates lower margins of safety with respect to shear failure forthe degraded case. For the undegraded case the margin of safety on the arostress, computed from the values shown in Table 1-i, is (7.9/3.9)-l = 1.02.For the experimentally measured degraded shear strength it is (5.75/3.9)-i.47, so that the margin is reduced roughly by half but nevertheless remainspositive.
The greater sensitivity of the margins to shear strength rather thanshear modulus can be further illustrated by considering two hypothetical casesand the resulting margins of safety as follows:
Percent of undegraded values
Case For G For a12 Margin ofallowable safety
Case 1 100% 40% -.19
Case 2 40% 100% +1.0
Undegraded Case 100% 100% +1.0
The table indicates greater sensitivity of margins to the a12 shearallowable. However, it should be pointed out that this computation of mar-gins based on aro and the shear allowable may be conservative because evenif the a1Z shear strength is lost, the performance of the wheel may not bedegraded due to catenary-like action of the degraded hoop reinforcements.
Because the experimental results apply to the case of 52 percent of theultimate 00 stress, it is possible that the degradation of in-plane shearstrength may limit the flywheel performance at higher percentages of theultimate load. Such a problem, if it occurs, could be ameliorated by in-creasing the number of radials and thereby reducing the Oro stresses.
-34-
SECTION 3
SENSITIVITY STUDIES
3.1 INTRODUCTION
Sensitivity studies were carried out to evaluate the effect of propertyvariations and geometric variations associated with manufacturing and fabrica-tion. The studies included in Subsections 3.2 and 3.3 involve axisymmetricvariations and use the axisymmetric finite element code. In Section 3.4asymmetric effects are investigated by use of the two-dimensional finiteelement model shown in Figure 1-5. In this latter investigation the effectof asymmetric variations on the imbalance of the flywheel are considered.
3.2 VARIATIONS IN FIBER VOLUME
Here we consider the effect on the flywheel stresses and efficiency ofaxisymmetric variations in the fiber volume ratio Vf. Two specific cases areconsidered: (1) the case of one constant value of Vf for the radial layersand another constant value for the hoop layers, and (2) a case of a localvariation of Vf within the hoop layer alone.
For both of these cases we assume the following properties for theKevlar 49 fiber and epoxy matrix:
Modulus of fiber a Ef = 20 x 106 psiModulus of matrix a Em a .5 x 106 psiFiber weight/volume - pfg - .053 lb/in 3
Matrix weight/volume - pmg - .0426 lb/in3
The Kevlar 49 properties are those given by duPont.* Typical matrix proper-ties are used.**
The mechanical properties for a composite are formulated by using therule of mixtures, namely:
E I Ef Vf + Em (-Vf)
pg - pfg Vf +ping (1-Vf)
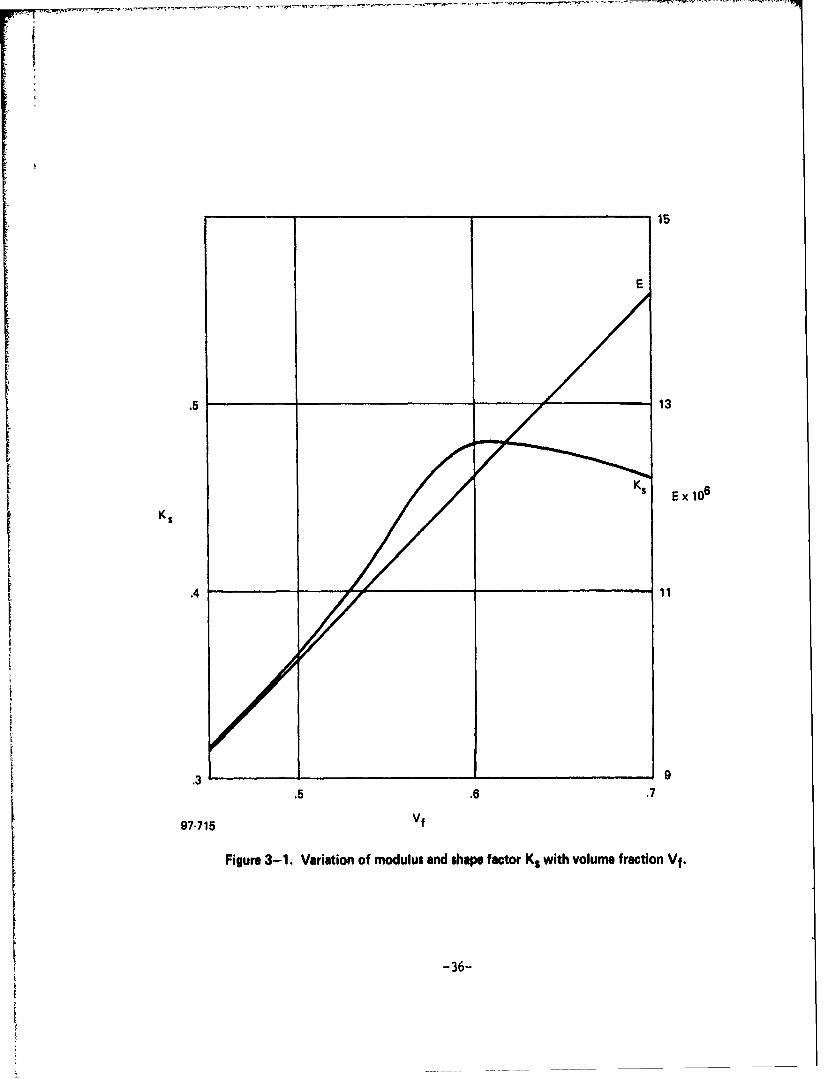
The resulting values of E as a function of Vf are given in Figure 3-1. Itshould be pointed out that for Vf - .59 one has the reference propertiesEl - 12 x 106 psi and pg - .0487. These correspond to the properties citedin Section 1.
Case 1: Different Vf's for Hoops and Radials
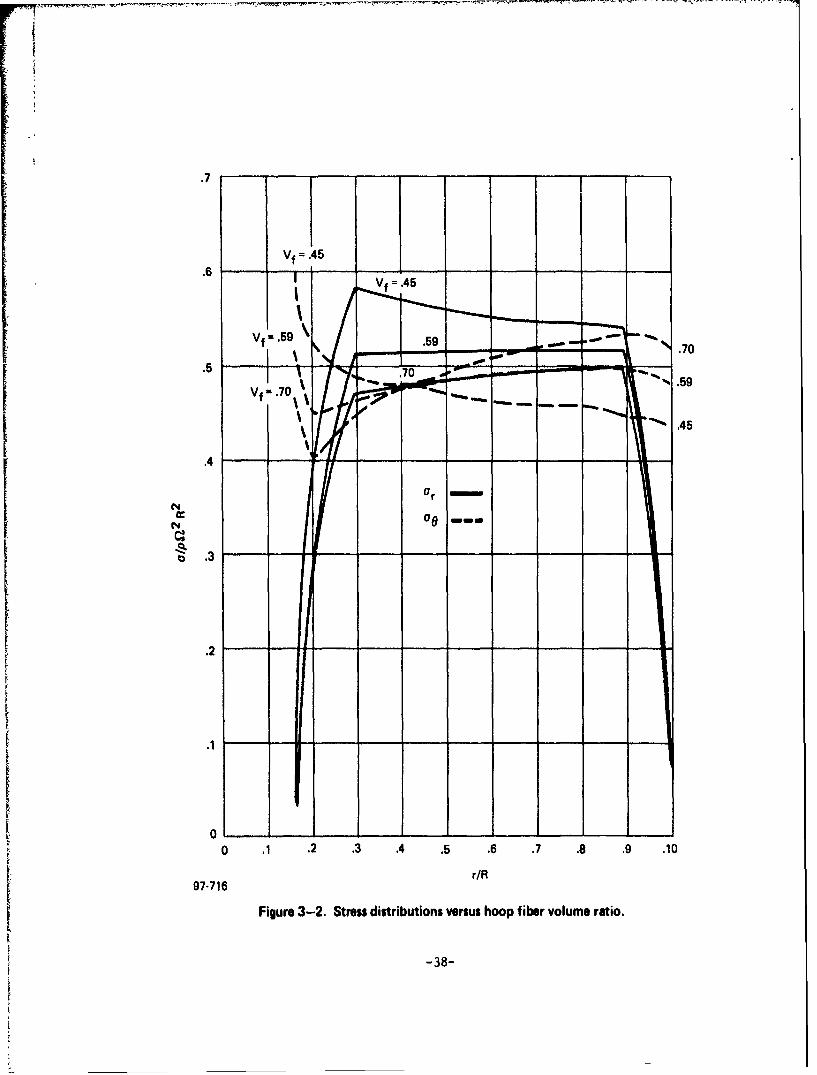
In this case we fix Vf - .59 for the radial reinforcements and vary Vffor the hoop reinforcements over the range Vf - .45 to Vf - .70. Thus we
'Hunter, R. L., "Characteristics and Uses of Kevlar 49 High Modulus Organic Fiber," duPont Report, revised 9/18/73.*Ashton. J. E., Halpin, J. C., and Petit, P. H., "Primer on Composite Materials: Analysis" Technomic Publishers, 1969.
-35-
15
E
.5 13
S E x10 6
Ks
K
.4 11
.3 9.5 .6 .7
97-715 Vf
Figure 3-1. Variation of modulus and shape factor Ks with volume fraction Vf.
-36-

are assigning the radials the reference properties and we are varying theproperties of the hoops. Results were obtained by parametrically runningthe axisymmetric finite element wheel code. Stress distributions obtained inthis case are shown in Figure 3-2.
In order to determine the effect of Vf on the wheel efficiency it isnecessary to postulate the dependence of the strength on Vf. This was de-termined on the basis of an allowable strain criterion. Consequently the0° strength is assumed to be proportional to the modulus, which is shownin Figure 3-1.
In order to express these parametric results in terms of energy densityor a shape factor Ks a problem in definitions arises. If we solve theequation in Section 1.2 for Ks we get:
Kinetic Energy pgK m 0 e
Weight a
The problem is to decide what values of pg and a to use for Case 1 in whichtwo different sets of properties occur. The choice used in this work is totake pg and a as the reference values, i.e., those for Vf - .59. Having donethis, all variations of kinetic energy per unit weight with Vf are reflectedin corresponding variations of Ks . The results calculated on this basis areshown in Figure 3-1 which shows Ks decreasing as one moves away from Vf - .59,the volume fraction for which the wheel design is optimized. As might be ex-pected, the figure shows that Ks drops more rapidly as Vf is decreased. Theresults shon in Figure 3-3 for ar and Orz as functions of Vf do not indicatevery great variations within the range Vf - .45 to .70, and are not expectedto significantly limit the design.
Case 2: Local Variations of Vf in Hoops
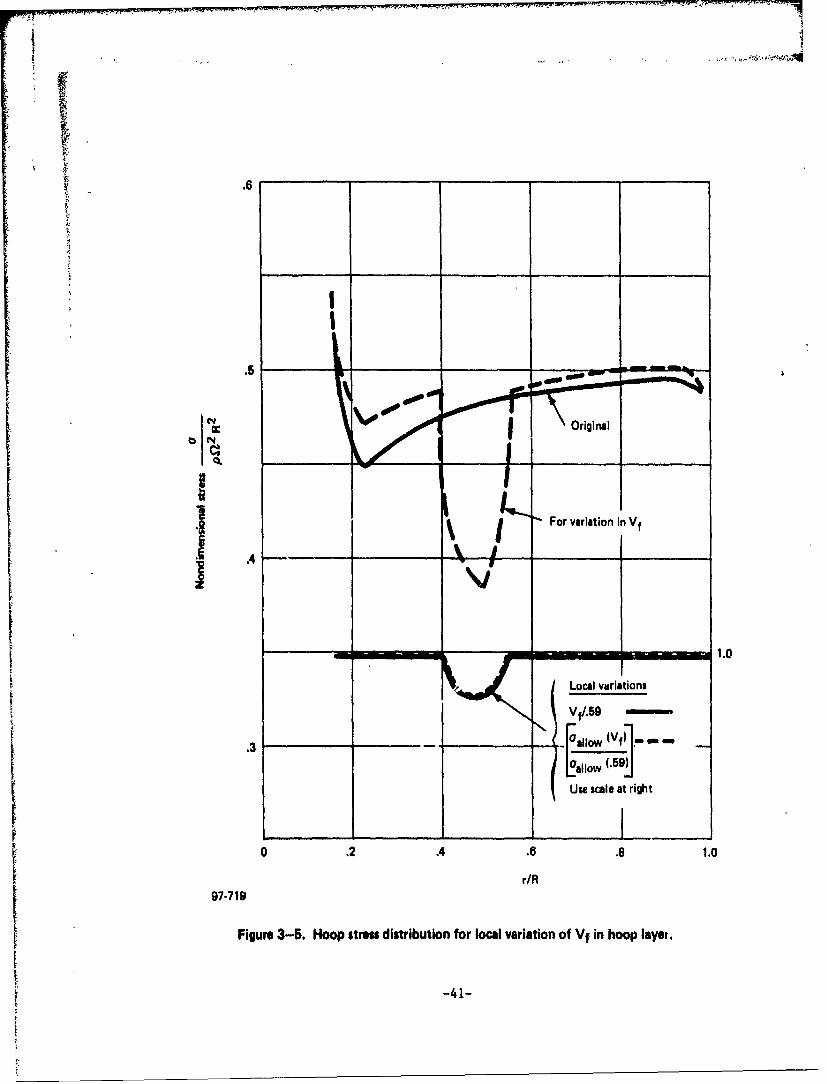
In this case we consider the effect of a local axisymmetric variation inthe hoop layer. The postulated variation of Vf is shown in Figures 3-4 and3-5 together with the stress from the axisymmetric analysis. Also shown inthese plots are the relative changes in strength postulated on the basis ofstrain to failure. The resulting shape factor Ks is .447, 9 percent downfrom .474 of the original design.
3.3 VARIATIONS IN HOOP AND RADIAL GEOMETRIES
Three different types of variations in the geometry of the hoop andradial reinforcements were studied:
1. Variations of hoop thicknesses,
2. A .010 inch change in radial width,
3. A +.010 inch, -.010 inch combination change in radial width.
-37-
.7
Vf= .45
.70.7 59
\ 0 .45
.4 -
ccCItN
.2
II
0 .1 .2 .3 .4 .5 .6 .7 .8 .9 .10
r/R97-716
Figure 3-2. Stress distributions versus hoop fiber volume ratio.
-38-

.012
.010ar
.006-
I .. 0. __ .__7 _ .
Vto
a rz
.002
.4 .5 .6 .7 .8
97-717
Figure 3-3. Variations of arz and aro with fiber volume ratio Vf, for Vf- .59 for radials,Vf varies for hoop.
-39-

.6
Original
5 Sx - XX-
x For Ioci..
variatirin x
.4 -4-
II I
.2 -. 0
Local variations
F . -- x Vt/.59X
0 allow (Vf)
0 " Oallo w (.591
oUse scale at right
.2 .4 .6 .8 1.0
97-718 r/R
Figur- 3-4. Radial stress distribution for local variation of Vf in hoop layor.
-40-
. , . •. o- , . .' , ,.R
.6
bN
i " ____
v j For variation in Vf
Local variationsVf/.59
.3 _allo w (Vf)l.
Uallo w (.59)Use scale at right
0 .2 .4 .6 .8 1.0
r/R97-719
Figure 3-5. Hoop stress distribution for local variation of Vf in hoop laye,.
-41-

Variations of Hoop Thickness
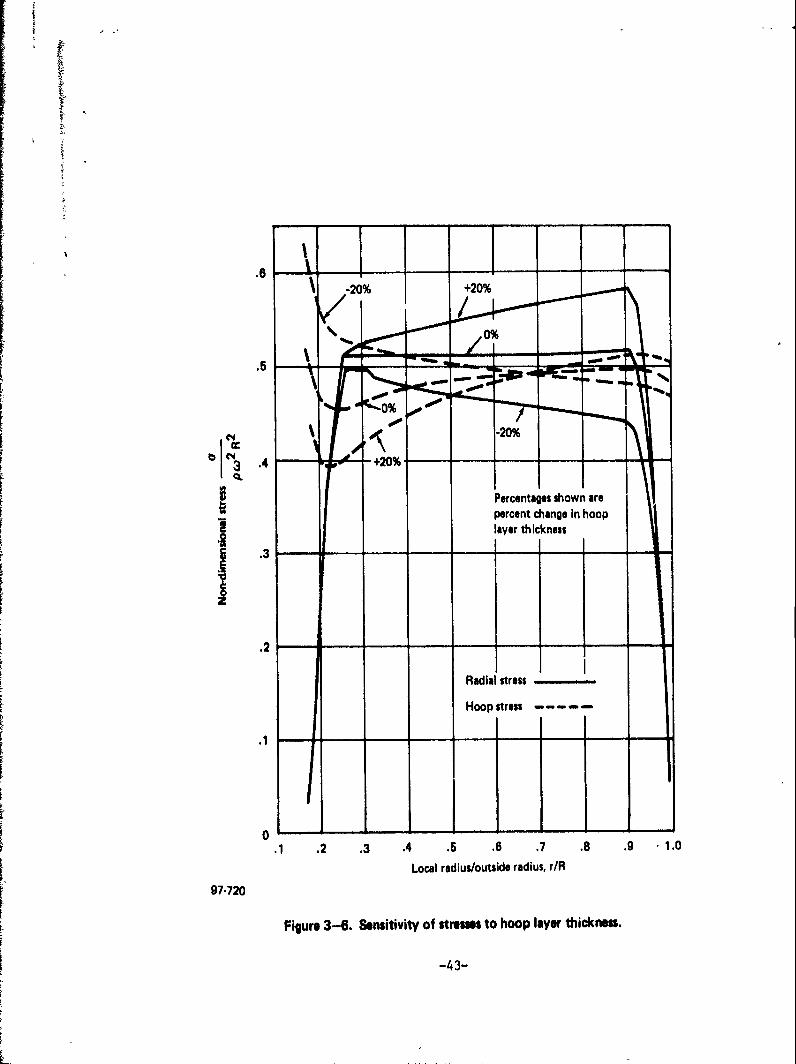
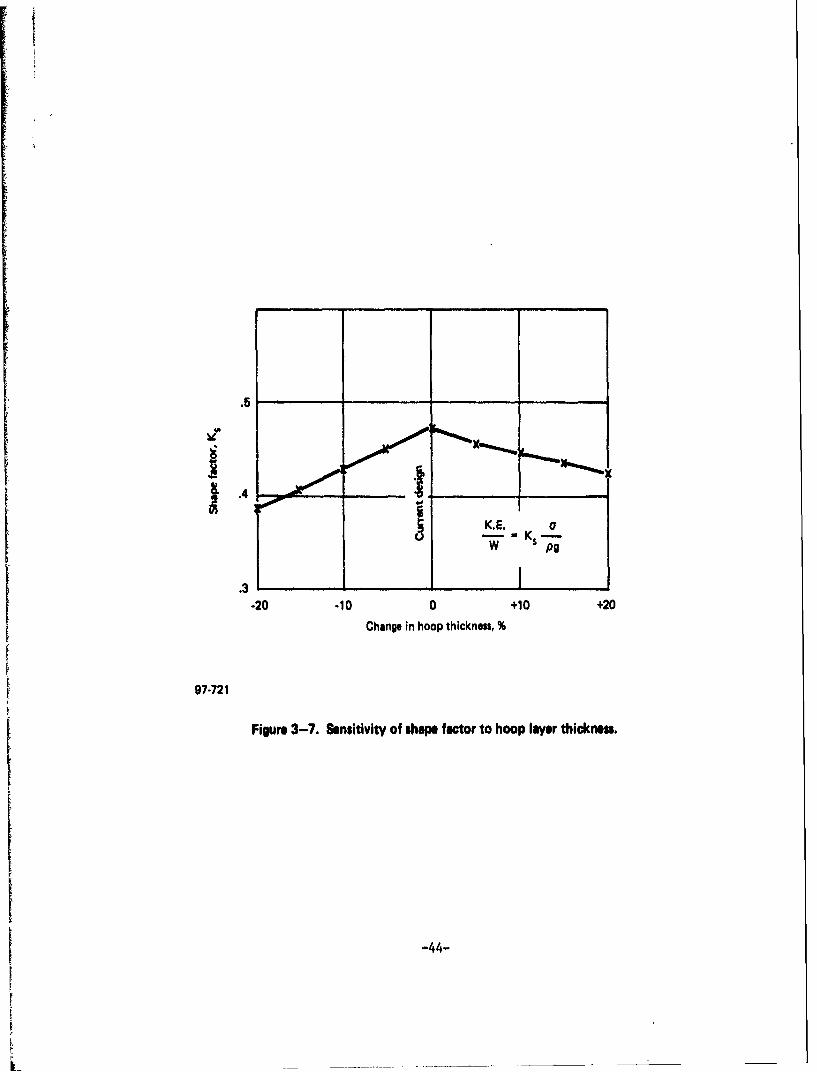
Results obtained by varying the hoop thickness are shown in Figures 3-6through 3-8. Figure 3-6 shows the changes in stress distribution that occuras the hoop thicknesses are perturbated away from the design configuration.The figure indicates that as the hoops are thickened (+20%) the radials becomeoverstressed and the hoops understressed. When the hoop thickness is reduced(-20%) the reverse occurs: the hoops are overstressed and the radials becomeunderstressed. These results clearly show the optimal feature of the un-perturbed (0%) original design thickness combination. The correspondingchanges in shape factor Ks are shown in Figure 3-7. A 20 percent reductionin hoop thickness results in a 19 percent decrease in Ks; a 20 percent in-crease in hoop thickness lowers Ks by only 10 percent. The wheel appears tobe more sensitive to decreases in hoop thickness because of the tendency fortigh hoop stresses to occur at the inside edge of the wheel.
It should be pointed out that these calculations apply equally well tochanges in radial thickness, that is, the results are dependent on the ratioof hoop to radial thickness.
In FIgure 3-8, the corresponding arz hoop to radial interlaminar shearstresses are plotted. The special nondimensional form of stress shown in thefigure relates the shear stress to the maximum stress so that the significanceof the shear stress changes can be evaluated. We presume that the wheel willbe spun up to a speed 0 for which the maximum Or or ao stresses reach thematerial allowable -- consequently the ratio Orz/Omax is a key parameter andis used in representing the rcsults in Figures 3-8 and 3-11. The ordinatesof these figures are expressed in terms of a shear stress parameter (arz.R)/Omax "hr). Figure 3-8 shows that the effect of changing hoop thicknesses of±20% does not substantially influence the arz shear stress parameter.
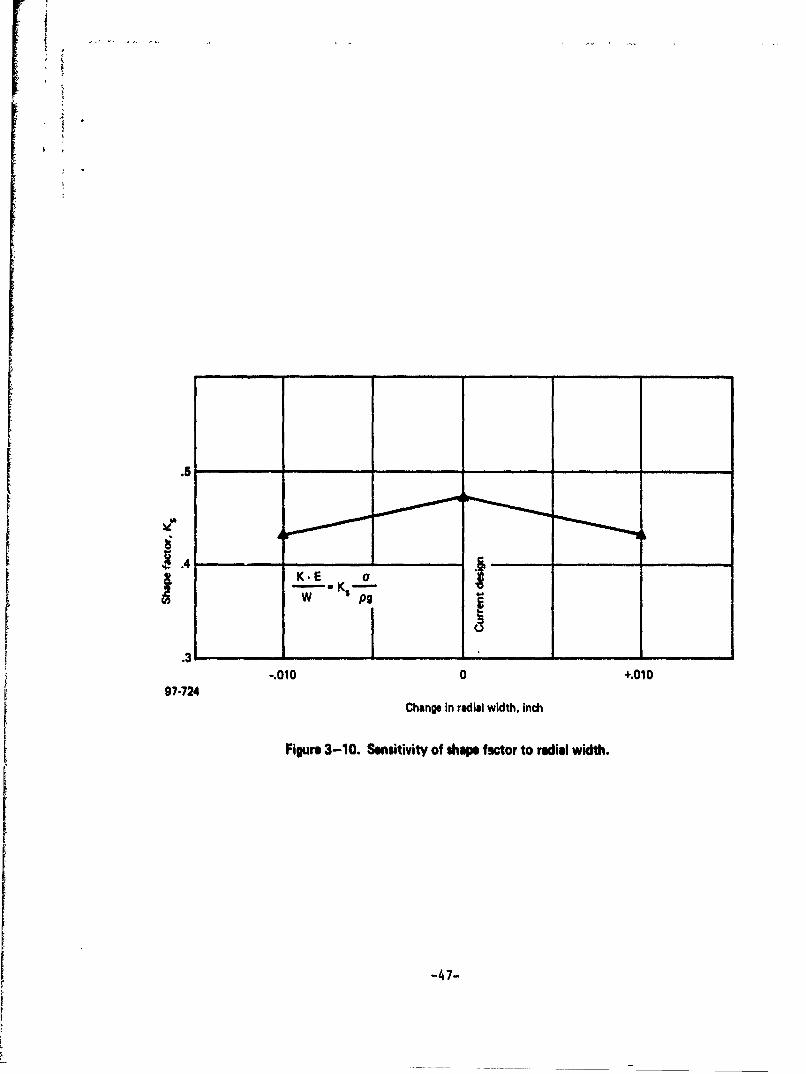
.010-inch Change in Radial Width
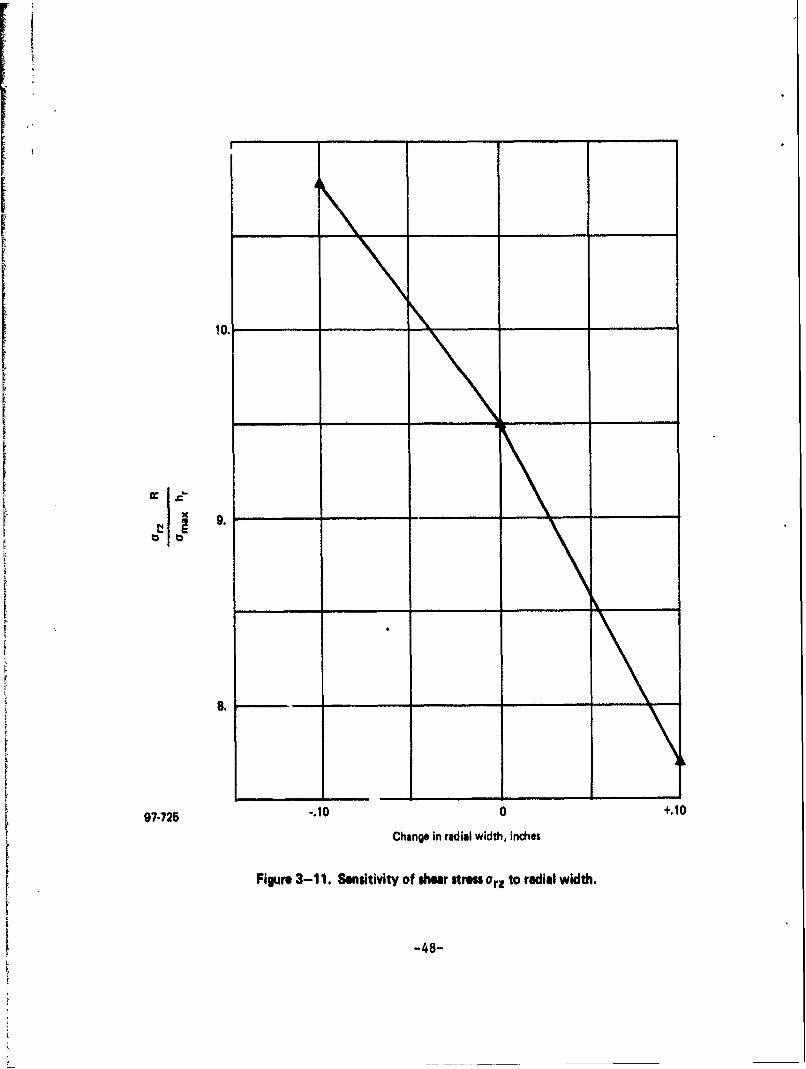
In the reference design the radial reinforcements are .048 inch wide onthe inside (r - 1.625"), .W91 inch wide at r - 4.85 inch e .a .045 inch wideat the outside r - R - 9.75 ituch. We now consider two . one with .010inch added to the radial width, and one with .010 inch ;b't 'cted from theradial width. The resulting stress distributions and L-n .ting change inshape factors are shown in Figures 3-9 and 3-10. The distributions are verysimilar and there is a small change in Ks of approximately 8 percent for the+.010 and -.010 changes in radial width. The dominant effect, however, is achange in maximum arz interlaminar shear stresses because from a percentagepoint of view the .010 inch change has the greatest effect near the insideand outside edges of the wheel where the shear stresses are greatest. Thechanges in shear stress parameters are shown in Figure 3-11, which shows anincrease of 14 percent for the radial which is .010 inch narrower.
+.010 inch. +.010 inch Combined Change in Radial Width
A combined case was run in which the width of the outer half (larger r)of the radial was reduced by .010 inch and correspondingly increased on the
-42-
.6
II.5HoopItress
0-0
97*20%
Figre -6.Senitiityof tresesto oplayer thickness .
-43
.5
.4 f
K.E. - SW Ag
-20 -10 0 +10 +20Change in hoop thickness, %
97-721
Figure 3-7. Sensitivity of shape factor to hoop layer thickness.
-4_-

10
Ir C
-20 -10 0 +10 +20Change in hoop thickness, %
97-722
Figure 3-8. Sensitivity of shear stresses to hoop layer thickness.
-45-

.6
+.01
S.-
.2_____ Or
A
.2 .4 .6 .8 1.0
97-723 rIR
Figure 3-9. Stress distributions versus radial width variations for +.010 and -.010 inch changesin radial width.
-46-
1 ~~~ ~ ~~~~.5 ______ ____________
-.010 0 +.01097-724
Change in radial width, inch
Figure 3-10. Sensitivity of shape factor to radial width.
-47-
10.
8.
97-725 -. 10 0 +.O
Change in radial width, inches
Figure 3-11. Sensitivity of shear stress Orz to radial width.
-48-
inside half (smaller r). The result was K. = .429, a 9 percent reduction
from the design case. The shear stress parameter (arz.R)/(amax-hr) is 14 per-
cent higher in this case.
It should be pointed out that, for the +.010 inch, -.010 inch and com-bined ±.010 inch cases, that the maximum aro shears are not greatly affected.
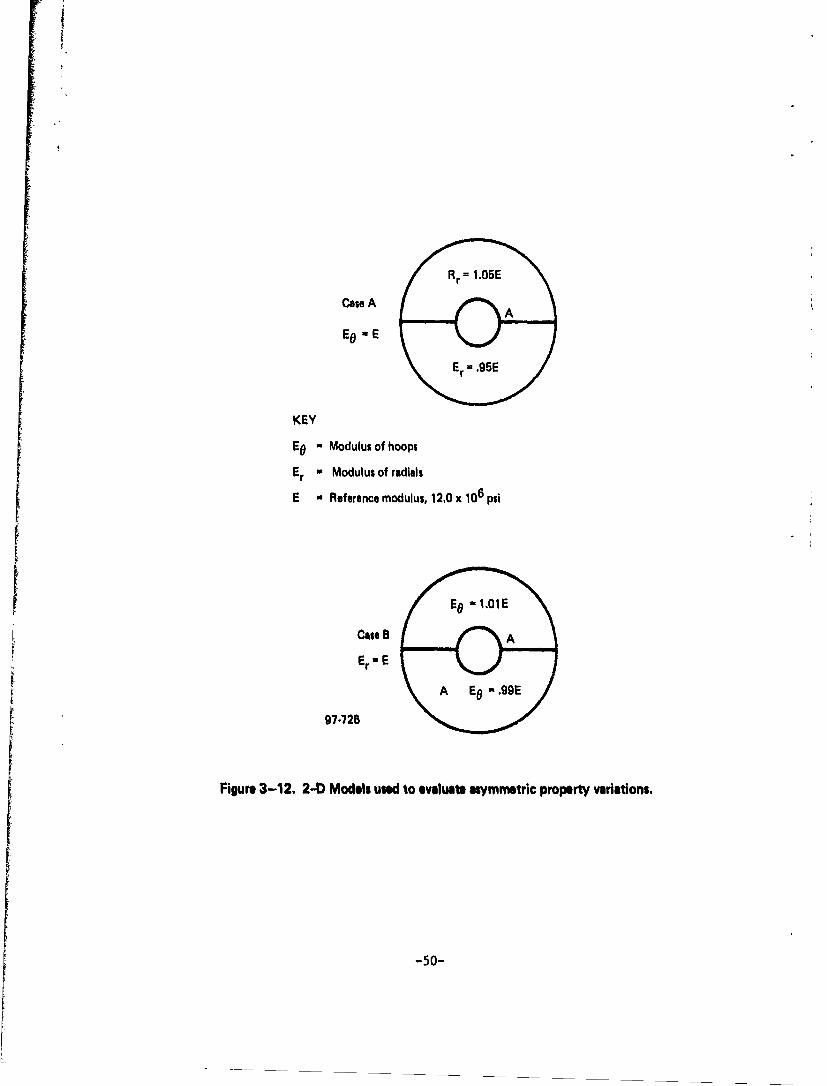
3.4 EVALUATION OF ASYMMETRIC PROPERTY VARIATIONS
Asymmetric property variations were evaluated using the finite elementgrid shown in Figure 1-5. The model "smears out" the radials in the circum-ferential direction. Two cases of asymmetric variations of the modulus, as
shown in Figure 3-12, were analyzed. In Case A the modulus of the radials isvaried; in Case B the modulus of the hoops. The change in stresses for thesecases is as follows:
Case Change in modulus Change in maximum stress
A ±5% +3.9%
B ±1% +.1%
A major reason for carrying out these asymmetric property variationstudies is to compute the imbalance due to deformation of the wheel. To dothis we evaluate the shift in centroid of the wheel (relative to Point A ofFigure 3-.12) that would exist when amax - 200 ksi. A typical wheel weight of16.86 pounds was used in the calculations. The results presented in tabular
form appear below:
Distance of Imbalance for 16.86Case Change in modulus centroid shift pound wheel
(inch) (inch-grams)
A ±5% .00416 36.19
B ±1% .000!04 6.9
The resulting imbalances shown above are considerably in excess of the im-
balances that remain after balancing the wheel which are of the order of
1 inch-gram. It should be recognized that the ±5% and ±1% variations usedin the study are highly unlikely to occur because they represent averagesof all the deviations in modulus through the thickness as well as in the
in-plane directions. The variations used in this study are conservativeestimates of asymmetries in an individual layer. Random layer orientationduring assembly and inter-layer load sharing during operation will tend to
distribute displacement more evenly. The method of fabricating the hoops is
more likely to generate axisymmetric rather than asymmetric variations in
modulus. Similarly, the radials are stamped out of sheets of Kevlar tape
and are expected to be very regular.
-49-
Case A
EO
KEY
EO - Modulus of hoops
Er w Modulus of radials
E - Reference modulus, 12.0 x 10⁶ psi
EO 1.1Case 6
Er U E
97-726
Figure 3-12. 2-D Models used to evaluate asymmetric propert variations.
-5o-

I
SECTION 4
ANALYSIS OF STATIC SIMULATION TEST
4.1 INTRODUCTION
The purpose of this investigation is to attempt to design a static test
that will simulate the flywheel stress conditions that would be encounteredunder inertial loading in practice. Such a test would of course greatly ex-pedite the development of bi-directionally reinforced flywheels by avoidingthe problems associated with dynamic testing and by allowing test specimensto be thinner and/or smaller than a full scale flywheel and thus save onfabrication costs.
As a starting point we will seek to develop a test configuration thatwill simulate the stress components ar, ao, arz , and arO shown in Table I-1.The 2-D and equivalent axisymmetric results shown in Table 1-1 are verysimilar, and we shall pick as a starting point those given by the equivalentaxisymmetric analysis because it was used originally to design the wheel.Expressing these stresses in relative terms gives the following:
a/lao = 1.0 (4-1)
rza/G lo - .00777 (4-2)
aro/lao - .01903 (4-3)
It should be pointed out that these ratios do not occur simultanususly in theoriginal flywheel because ar and 0o do vary with the local radius r. However,as a first cut at the simulation problem it seems reasonable to seek a simula-tion as close as possible to the relative values cited above.
The strategy used to find a configuration which simulates the three stress
ratios is similar to that used to design the original flywheel. First equiva-lent "smeared out" axisymmetric analyses and other simplified analyses arecarried out to obtain geometric configurations approximately simulating thedesired stress ratios. As in the flywheel design, the Ego - 0 assumption iscarried along to simulate a crazed condition. After this, a two dimensionalfinite element analysis is carried out to verify the design.
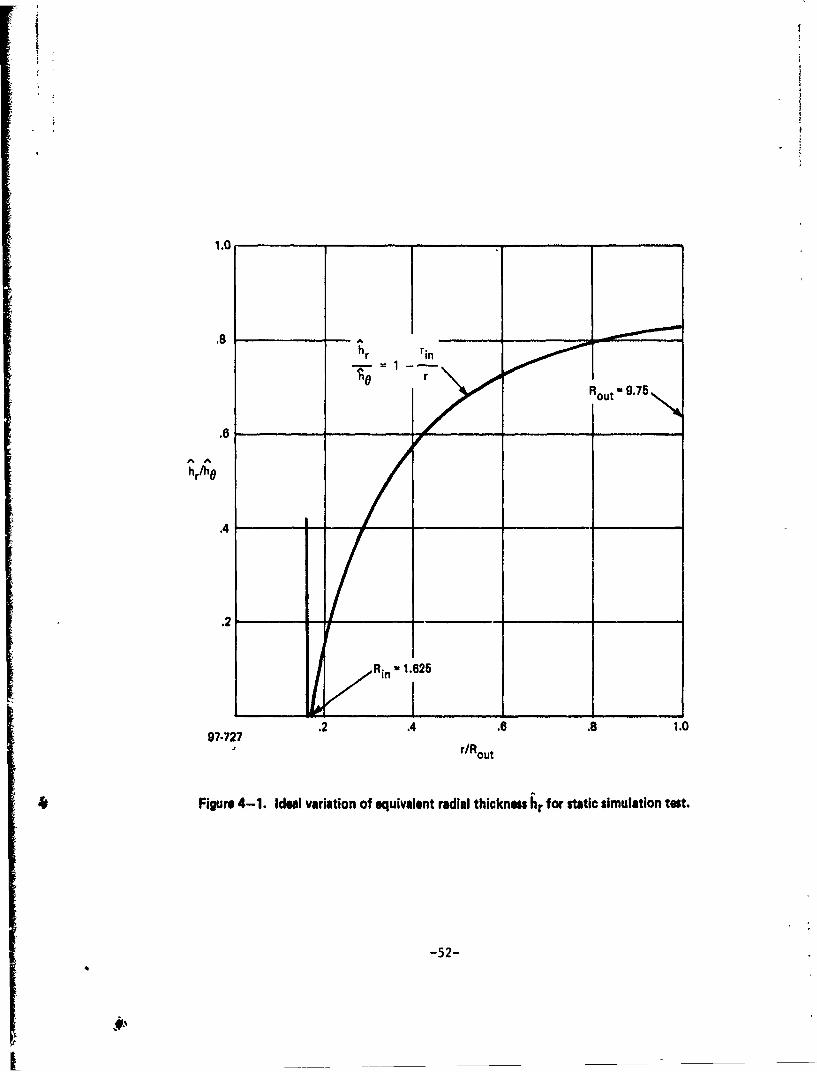
4.2 GEOMETRIC PARAMETERS
The geometric parameters available in the simulation test shown in Fig-ure 4-1 are:
N The number of radials per layerr
Rin' Rout The inside and outside radii of the hoops
-51-
.8
.6TO O
ou
hr/hO
.2. 6.8 1.097-727 rR~
* Figure 4-1. Ideal variation of equivalent radial thicknes hr for static simulation test.
-52-

4
Hr H0 The radial and hoop thicknesses (actual)
Y(r) The portion of the circumference at a given radius roccupied by radials.
The ratio of internally applied load to externally applied load is also aparameter. However, for the initial part of this investigation the internalpressure is assumed to be zero.
For analytical purposes it is convenient to introduce two more parametersas follows:
hr (r) "smeared out" radial thickness, averaged with respect tovariations with 0
h0 (r) "smeared out" hoop thickness, analogous to h (r).r
In this work, we consider only the case of uniformly thick hoop layers suchthat ho - H0 .
4.3 SIMULATION OF ar/ 0 - 1
Ideal Shape
For the equivalent "smeared out" axisymmetric model with E90 - 0, it ispossible to solve for fr(r), the equivalent radial thickness for which ar/a0 -1 throughout the region Rin < r < Rout.
Under these assumptions the equation of equilibrium for the case ar - oand n - 0 (no inertial force) is:
dhr
where 90 is the thickness of the hoop layer, which is constant with respectto r.
The solution of this equation subject to a force free inner boundarycondition of a-hr - 0 which becomes hr - 0, is the following:
-r Rin -- = - ---- (4-5)
A plot of this equation is given in Figure 4-1.
Unfortunately, this ideal shape leads to infinitely high interlaminarshear stresses, arz, between the hoops and radials at the inside edge (r -Rin). This comes about in the following way. First, from Equation (4-5) one
-53-

has hr = 0 when r = Rin. Second, from the definition of the "smearing out",the width of a radial (i.e., in 0 direction), W(r), is given by:
2vrW(r) N - .fr)
NrHr r
Consequently, at the inside edge (r - Rin), the radial width is zero. Thus,as one approaches the inside edge (r Rin) the area for load transfer betweenhoop and radial reinforcements approaches zero and infinitely high interlaminarshear stresses arise. This effect can also be deduced from Equation (4-14).
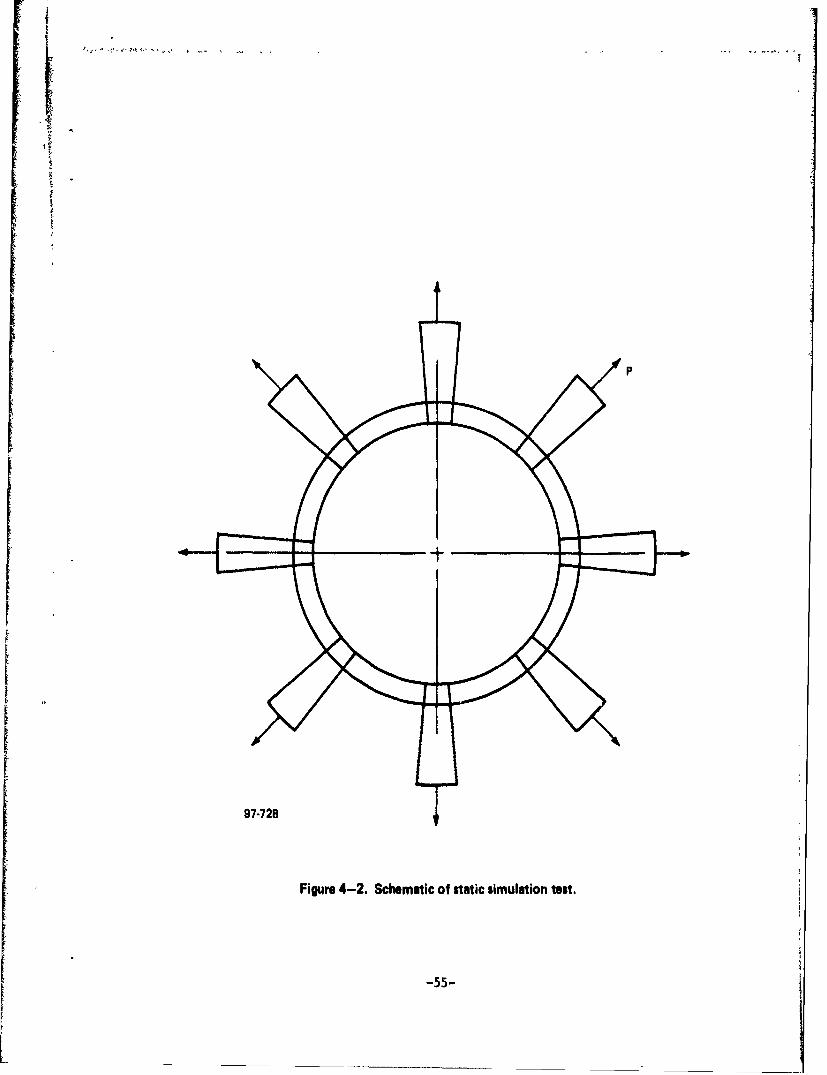
Solution for Constant hr
This problem was solved in the case of the wheel by increasing hr nearthe inside edge, i.e., by adding "tabs." In the simulation we anticipate thecase of a relatively narrow ring (Rout-Rin is small) and therefore seek aconfiguration like that shown in Figure 4-2 where the radials occupy a constantangular portion of the wheel. This analytical model can be solved by solvingthe equation
. . da r 0 (4-6)-aoh 6 + arhr+r d hr =0
where now hr is a constant and ar and ao are given by
W (4-7)r
= wg (4-8)
The solution obtained bl' substituting ao and ar into the equilibrium equationand invoking the boundary condition or.- 0 at r :Rin is as follows:
2, ' r )a - -a-1
(1)a1+ -11 '00O I Rout/ oR u t +Ro-ut) (4-9)
Routo
-54-
I f
rj 97-728
Figure 4-2. Schematic of static simulation test.
-55-

and
Rin \r 2 a r
Or LER: : , out (4-10)
where a is the value of or at the outside radius r = Rout and a is given by
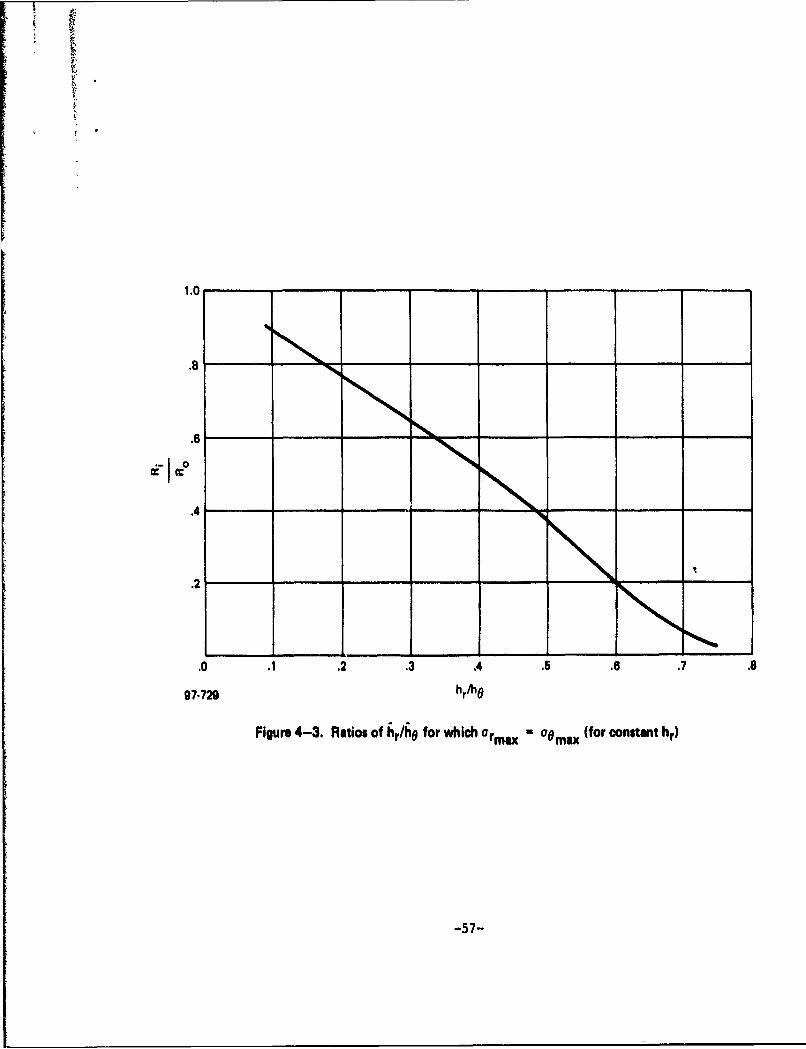
a .(4-11)
It is desired to pick a ratio hr/ho such that the maximum values of Orand ao are equal. A plot giving the desired ratios hr/ho as determined from
the above formulas is given in Figure 4-3.
Hoop Bending Effects
If the radials shown in Figure 4-2 are too far apart, then the hoop ring
will undergo bending and the val1es of or and ao will deviate from those pre-dicted from the equivalent "smeared out" axisymmetric analysis. Although thisproblem is negligible in the actual flywheel where Nr (number of radials) andRout-Rin are large it is of primary concern in a simulation test where it isdesirable to keep Nr as low as possible for practical and cost reasons.
This effect was evaluated parametrically by solving Fligge's ringequations* for the case of a simplified ring model where the radial loadsare assumed to be applied as point loads at the position of each radialcenterline. This analysis is expected to overestimate the effects causedby bending and provide a conservative method for excluding simulation testsdesigns with insufficient numbers of radials. Applying Flgge's equationsand solving for the moment Ho in the ring at the point of load applicationgives
Mo [. Qoi (Co. o + No ( ; in (4-12)
where
= polar angle between centerline of radial and middle point betweenradials.
R average radius of the hoop ring
*FlU9gge,W., Stresses in Shells, Springer-Verlag, Berlin, 1960.
-56-
.44
.2
.0. 2 .3 .4 .5 .6.7 .
97-729 hrfho
Figure 4-3. Raltios Of &r/AO for which armax - a0max (for conhtant hr)
-57-

t
Qo - shear force at centerline of radial (equals on half of total radialload)
No = hoop membrane force.
It was found that Mo is greater in absolute magnitude than the bending momentmidway between radials. Computing the bending stress due to M. and comparingit to the hoop stress associated with No leads to the design plot shown inFigure 4-4. The asymptotic formula for small 0 is
bending + 2 R 62 1"-" " ]+ (ot R-Im (4-13)
Ohoop (Rou -Rin
It can be seen from Figure 4-4 that if a typical case of Rout-Rin - 1 inch istaken, then approximately 25 radials (Nr - 25) are required to keep the bendstresses below 5 percent of the hoop stresses,
It turns out, however, that the restrictions implied by Figure 4-4 areless severe than those required to simulate the condition arO/aO - .01903.
4.4 SIMULATION OF arz/a0 - .00777
The derivation used to compute Orz and arQ for the equivalent "smearedout" axisymmetric analysis is shown schematically in Figure 4-5. Theequations are obtained by taking free body diagrams of EFCD and ABCD,respectively. The assumption Ego - 0 precludes the possibility of anyradial stresses ar on the surfaces FC or ED of the hoop layers. Thesesurfaces can contain very small amounts of shear stress, but as indicatedby the more detailed 2-D finite element analyses they act almost perpen-dicular to the radial direction used in summing forces and are negligible.The factor of 2 in the equation for arz average is caused by the fact that theload is transferred from two sides of each hoop layer. As in the design of theflywheel, this has serious implications for layers adjacent to the outsideedge (Z - Zmax) of the flywheel. In the flywheel design, an extra wideset of radials was used just inside the outermost hoop layer to maintainsimilar levels of orz stress near the outside. For the simulation itappears more appropriate to put a set of radials one half the usual thicknesson the outside so that the Orz stresses do not vary from layer to layer.
Working out the geometry indicated in the equations of Figure 4-5 leadsto the following:
a -ho 0 (4-14)arZave. 2r-
-58-

3
C
101%
10 20 30 40 50 6097-730N Number of radials/layer
Figure 4-4. Percent change in hoop stress caused by local bending.
-59-
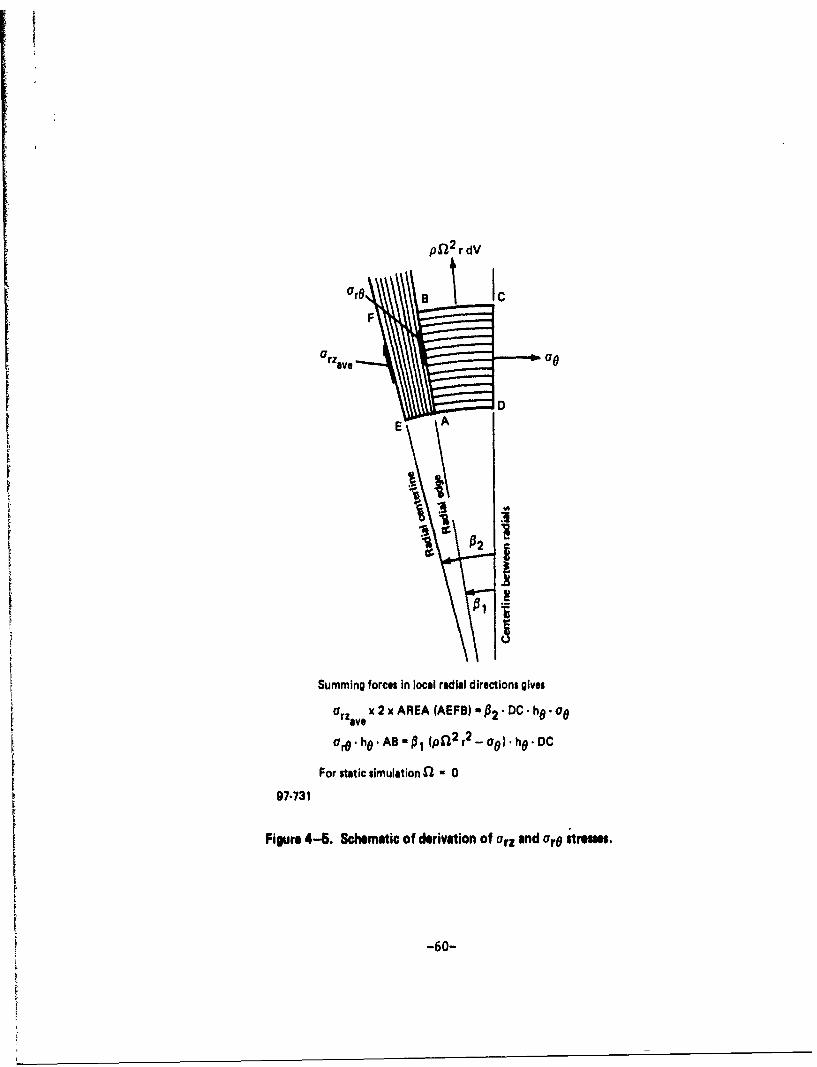
p,2 r dV
Urzave - 0
E Ait
Summing forces in local radial directions gives
arzav. x 2 x AREA (AEFB) - P2 ' DC. he -o0
Oro. he. AB -i01 (pfl2 r2 _o0) . h0 . DC
For static simulation l - 0
97-731
Figure 4-6. Schematic of derivation of 0rz and rO stresm.
-60-

where
r is the local radius
y is the local fraction of the circumference occupied by radials.
4.5 SIMULATION OF arOlao - .01903
Similar application of the equations shown in Figure 4-5 gives
Or0 = - (l-y)o (4-15)
where N is the number of radials.r
As we shall see in the subsequent section, this last equation places themost severe restraint on the minimum acceptable number of radials, Nr.
4.6 SELECTION OF A TYPICAL SIMULATED FLYWHEEL CONFIGURATIONWe next apply the relationship developed in Sections 4.1 through 4.5 to
define a simulation test.
In order to satisfy Equation (4-15) a tradeoff must be made between thedual evils of too many radials on the one hand and too large a y, the relative
area occupied by radials, on the other. Our mutual selection, satisfyingEquations (4-15) and (4-3), is:
Nr w 48
y - .7092
If we select Rin - 1.625 - same as flywheel, then the circumferential distancebetween radials centerlines is .2127. The areas between radial centerlinesare then kept roughly square by selecting Rout - Rin - .25 inch. For thiscombination Equation (4-13) indicates an acceptable deviation from pure hoopstress of 6 percent. For this combination of Rin/Rout, Figure 4-3 indicateshr/h - .125.
We next use Equations (4-14) and (4-2) to find ho - .0179. Then for hrwe have .125 x .0179 - .0022 inch. The actual radial thickness Hr - fr/ "
.00310. In summary, the resulting simulated configuration is:
Geometry Selected for Simulation Test
Nr - 49 radials/layer
y - .7092
Rin - 1.625
Rout - 1.875
-61-
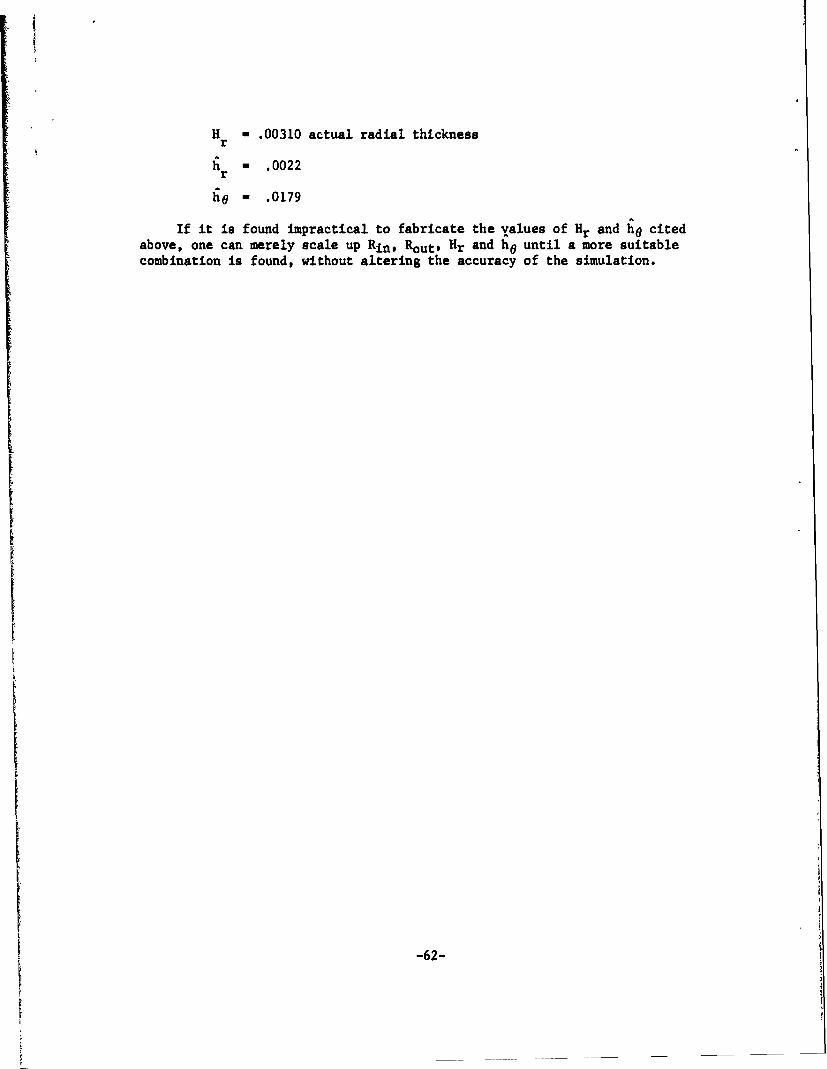
H .00310 actual radial thicknessr
h - .0022r
ho - .0179
If it is found impractical to fabricate the values of Hr and h0 citedabove, one can merely scale up Rin , Rout, Hr and h0 until a more suitablecombination is found, without altering the accuracy of the simulation.
-62-

SECTION 5
TESTING FOR DEGRADED PROPERTY EFFECTS
5.1 MECHANICAL EVALUATION
A biaxial tensile test was devised whereby the Kevlar 00 - 900 lay-upcould be stressed in both directions simultaneously. Subsequent to thisbiaxial loading the stressed composite at the junction or overlap region wasmachined into samples for evaluation of shear properties after loading.
The method of testing in this series is a sandwich beam using a honey-comb core between an aluminum skin and a composite (test piece) skin. Theloading method is essentially a double beam flexure test using four pointloading on each leg. The schematic of this test is given in Figure 5-1. Thesamples are loaded at particular stress levels to simulate various flywheelspeeds, i.e., 50, 60 and 70% of ultimate, and then off-loaded. The compositematerial is then removed from the sandwich structure and samples are fabri-cated from the areas at the 0/900 overlaps. The samples are designed toobtain shear properties after biaxial loading. The tests selected are 450tension for determining Young's modulus and Poisson's ratio (which could thenbe converted to shear modulus) and tensile and shear stress; and horizontal(short beam shear) to determine interlaminar shear stress. Figure 5-2 showsthe areas and orientations of the test samples removed.
The matrix of tests to be performed in this series is given in Table 5-1.
TABLE 5-1. 00/900 BEAM TEST (BIAXIAL TENSION)
Span Load point separation Load level Number of replicates(inch) (inch) (%)
20 4 100 2
20 4 80 2
20 4 70 2
20 4 60 2
SUBSEQUENT COUPON TESTS ON COMPOSITE OVERLAP
No. of replicatesTest (each beam) Data generated
450 tensile 1 450 , , G, E,
450 2 (interlaminar)
-63-

A
P/ PAP
P/4 pA4
6061 T6 1/8"
1/8" Cell aluminum honeycomb
20#1 Keyiarcomposite
97-731 A-A
Figure 5-1. Biaxial beam schematic.

0 I1 Fik1
97-732
Figure 5-2. Coupon sample layout for subsequent tensile and shoit beam, shear tests.
-65-

5.2 COMPOSITE LAY-UP
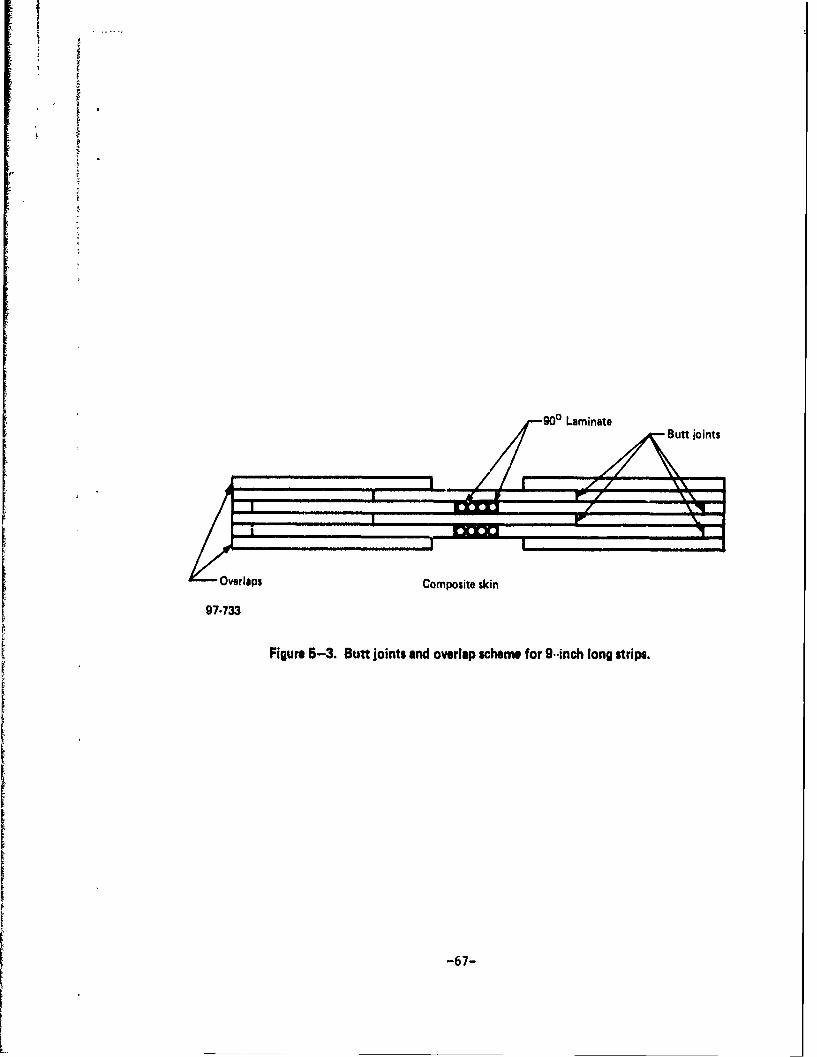
Since there was an abundance of 9 inch long uni-directional prepregKevlar epoxy on hand at the outset of this test series, and since there wasa waiting period for receipt of any roll goods which were on order, it wasdecided to go along and fabricate the first two beams with 9 inch stripslayed up with overlap and butt joints. The remaining beams in the series,however, are made with 22 inch strips of uni-directional Kevlar layed up at00 and 900 alternating angles. Also, the first two beams contain 2 plies ofcomposite in each direction for a total of 4 plies whereas the remainingsamples are constructed with 3 plies in each direction. Figure 5-3 is anattempt to depict the butt and overlap joint sequence herewith described.
5.3 REDUCTION OF DATA
At the time of this writing, one* test has been carried out at 52 per-cent of ultimate load. From these tests the following average propertieswere obtained:
6E4 5o - .99 x 10 psi
Oultimate - 5750 psi
The next step is to derive from these quantities the quantities G12 and o1 2allowable. The modulus G12 is obtained from the transformation laws and is
G!1214 2
E45 El
which gives G12- .25 x 106. The state of stress at a 450 orientation fromthe direction of loading is given by
a
al = a2 = 112
Tsai-Hill Failure criterion then gives
+ + =2X 2 +
*A second biaxial test failed and orevented measurement of the degraded modulus.
-66-
900 Laminate
Figum ~ ~ ~ ~ ~ ~ ~ ~ ~ ~ ~~Bt j-.oinjittnsoelpsceefr9*ic on tis
-67-
L __4___

which reduces to:
Since for Keviar 49 the undegraded shear strength S is much lower than the00 strength Y we have
aS = - = 5750
2
Tabulating the results gives
Quantity Undegraded Degraded Ratio of degraded/undegraded
G12 .3 x 106 psi .25 x 106 72.8%
a12 allowable 7.9 ksi 5.75 ksi 82.5%
These results are then introduced into the analysis of Section 2 to evaluatethe effects of degraded properties on flywheel performance.
-68-
SECTION 6
CONCLUSIONS
Structural analyses and experiments have been carried out to further thedevelopment of bi-directionally reinforced flywheels. A brief summary of thefindings are presented.
1. The analysis indicates that for the biaxial stress levels used inthe testing that shear modulus and strength degradations would notgive rise to negative stress margins. In addition, the analyticalresults show that reductions in in-plane shear modulus of up to 90percent have a small effect on the maximum 00 stresses.
2. The efficiency of a bi-directionally reinforced flywheel is sensitiveto variations in fiber volume, and variations in hoop and radial re-inforcement geometry. The relationship between variations in effi-ciency and variations in property and geometric inputs differ fromcase to case and are presented in detail in the report. Asymmetricvariations in material properties can also lead to substantial wheelimbalances which depend on the degree on nonuniformity present.
3. Static simulation tests appear feasible but must include a sufficientnumber of radials to prevent premature shear failures.
4. Biaxially degraded property effects have been obtained from crossbeamsandwich tests and subsequent 450 tensile tests and the resultingdata input into the analysis.
69/70
DISTRIBUTION LIST
No. of No. ofCopies To Copies To
1 Office of the Director, Defense Researct, and Engineering, Commander, Picatinny Arsenal, Dover, New Jersey 07801The Pentagon, Washington, D. C. 20301 ) ATTN:, SARPA-RT-S
1 Mr. A. Devine12 Commander, Defense Documentation Center. Cameron Station, 1 Mr. A. M. Anzalone, SARPA-FR-M-D, PLASTEC
Building 5, 5010 Duke Street. Alexandria, Virginia 22314Commander, Redstone Scientific Information Center,
1 Metals and Ceramics Information Center, Battelle Columbus U. S. Army Missile Command, Redstone Arsenal, Alabama 35809Laboratories, 505 King Avenue, Columbus, Ohio 43201 1 ATTN: DRSMI-RBLD. Document Section
Deputy Chief of Staff, Research, Development, and Commander, Watervliet Arsenal, Watervliet, New York 12189Acquisition, Headquarters Department of the Army, 1 ATTN: Dr. T. DavidsonWashington, D. C. 20310 1 Mr. D. P. Kendall
1 ATTN: DAMA-ARZ 1 Mr. J. F. Throop1 SARWV-RDR, Dr. F. I. Schmiedeshoff
Coamander, Army Research Office, P.O. 3ox 12211,Research Triangle Park, North Carolina 27709 Commander, U. S. Army Foreign Science and Technology Center,
1 ATTN: Information Processing Office 220 7th Street, N. E., Charlottesville, Vir inia 229011 ATTN: Mr. Marley, Military Technologies
Commander, U. S. Army Materiel Development and ReadinessCmmand, 5001 Eisenhower Avenue, Alexandria, Commnder, U. S. Army Aeromedical Research Unit,Virginia 22333 P. 0. Box 577, Fort Rucker, Alabama 36460
1 ATTN: DRCLDC, Mr. R. Zentner 1 ATTN: Technical Library
Commander, U. S. Army Communitions Research and Director, Eustis Directorate, U. S. Army Air MobilityDevelopment Command, Fort Mormouth, New Jersey 07703 Research and Development Laboratory. Fort Eustis,
1 ATTN: DORDCO-GG-TD Virginia 23604DROCO-GG-DM 1 ATTN: Mr. J. Robinson, DAVDL-E-MOS (AVRADCOM)
1 DRDCO-GG-E I Mr. R. Berresford1 DRDCO-GG-EA
DRDCO-GG-ES U. S. Army Aviation Training Library, Fort Rucker,DRDCO-GG-EG Alabama 36362
1 ATTN: F;dg. 5906-5907Commander, U. S. Aimy Missile Research and DevelopmenttO mIandj , !.:c-'±-. AlAhAma 35a09 Commander, U. S. Army Board for Aviation AcLident Research,
I ATTN: Technical Library %r, ...,... Alhama 36360DRSMI-RSM, Mr. E. J. Wheelahan 1 ATTN: Library, Bldg. 5505
Comandeo, U. S. Amy Natick Research and Development Commander. USACDC Air Defense Agency, Fort Bliss, Texas 79916Command. Natick, Massachusetts 01760 1 ATTN: Technical Library
1 ATTN: Technical LibraryDr. E. W. Ross Commander, U. S. Army fngineer School, Fort Belvoir,DRDNA-UE, Dr. L. A. McClane Virginia 22060
1 ATTN: LibraryCommander, U. S. Amy Sate'lite Communications Agency,Fort Momouth, New Jersey 07703 Cor.rander, U. S. Atmy Engineer Waterways Experiment Station,
I ATTK: Technical Document Center Vicesburg, Mississippi 391801 ATTN: Research Center Library
Commander, U. S. Amy Tank-Automtive Research andDeveiopment Command, War~en, Michigan 48090 Comander, Naval Air Engineering Center, Lakehurst,
1 ATTN: DRDTA-RKA New Jersey 08733DRDTA, Technical Library 1 ATTN: Technical Library, Code 115
Commander, U. S. Army Armament Research and Development Naval Air Development Center, Aero Materials Department,Command, Rock Islana, Illinois 61201 Warminster. Pennsylianla 18974
1 ATTN: Technical Library 1 ATTN: J. Viglione
Commander, White Sands Missile Range, New Mexico 88002 Cavid Taylor Naval Ship Research ar. vsevelopment Laboratory,I ATTh: STEWS-WS-vT Annapolis, Maryland 21402
1 ATTN: Dr. H. P. ChuComnander, Aberdeen Proving Ground, Maryland 21005
1 ATTN: STEAP-TL, Bldg. 305 Naval Un'orwater Systems Center, Now London, Connecticut 063201 ATtl; R. Kasper
Commander, Frankford Arsenal, Philadelohia,Pennsylvania 19137 Naval Research Laboratory. Washington, D. C. 20375
1 ATTV. Library, H1300, 81. 51-2 1. ATTN: C. D. Beacham, Head, Adv. Mat'ls Tech. Br., Code 6310Or. J. el. Krafft - Code 8430
Commander, U. S. Amy Ballistic Research Laboratory,Aberdeen Provlrg Ground, Maryl nd 21005 Chief of Naval Research, Arlington, Virginia 22217
1 ATTN: Dr, J. Frasier 1 ATTN: Code 471Dr. R. VitaliDr. G. L. Filbey Naval Weapons Laboratory, Washington, D. C. 20390
1 Dr. R. Karpp I ATTN: H. W. Romine, Mail Stop 1031 Dr. W. Gillich
Director, Structural Mechanirs Research, Office of NavalCommander, Harry Diamond Laboratories, 2000 Powder Mill Road, Research, 800 North Quincy Street, Alington, Virginia 22203Adelphi, Maryland 20783 1 ATTN: Dr. N. Perrone
I ATTN: Technical Information Office
-71-

No. of No. ofCopies To Copies To
1 Ship Structure Comittee, Maritime Transportation TIT Research Institute, Chicago, Illinois 60616Research Board, National Research Council, 1 ATTN: Dr, 1. . Daniel2101 Constitution Avenue, I. W., Washington. D. C. 20418
1 Mr. 3. 0. Kaufman, Alcoa Research Laboratories,Air Force Materials Laboratory, Wright-Patterson Air Force Now Kensington, Pennsylvania 15068Base, Ohio 45433
1 ATTN: AFM1. (NXE), E. Morrissey 1 Mr. G. M. Orner, MANLABS, 21 Erie Street, Cambridge,AFML (ILC) Massachusetts 02139
1 AFNL (LLP), D. M. Forney. Jr.AFNL (LNC), T. J. Reinhart 1 Mr. P. N. Randall, TRW Systems Group - 0-1/2210,AFFDL/FB, Dr. J. C. Halpin One Space Park, Redondo Beach, California 90278AFML (NBC), Mr. Stanley SchulmanD Dr. S. Tsai 1 Dr. E. A. Steigerwald, TRW Metals Division, P.O. Box 250,Or. N. Pagano Minerva, Ohio 44657
Air Force Flight Dynamics Laboratory, Wright-Patterson 1 Mr. W. A. Van der Sluys, Research Center, Babcock andAir Force Base Ohio 45433 Wilcox, Alliance, Ohio 44601
1 ATTN: AFFDL (FBS), C. WallaceI AFFOL (FBE), r D. Sendeckyj 1 Mr. B. M. Wundt, 2346 Shirl Lane, Schenectady, New York 12309
National Aeronautics and Space Administration, Battelle Columbus Laboratories, 505 King Avenue, Columbus,Washington, D. C. 20546 Ohio 43201
1 ATTN: Mr. B. G. Achhamer 1 ATTN: Dr. E. RybickiMr. G. C. Deutsch - Code RW
I Dr. K. R. Merckx, Battelle Northwest Institute, Richland,National Aeronautics and Space Administration, Marshall Washington 99352Space Flight Center. Huntsville, Alabama 35812
1 ATTN: R. J. Schwinghamer, EHOI, Dir., M&P Lab General Electric Company, Schenectady. New York 12010I Mr. W. A. Wilson. EH41. Bldg. 4612 1 ATTN: Mr. A. J. Brothers, Materials and Processes Laboratory
National Aeronautics and Space Administration, Langley General Electric Company, Knolls Atomic Power Laboratory,Research Center, Hampton, Virginia 23665 P. 0. Box 1072. Schenectady, New York 12301
1 ATTN: Mr. H. F. Hardrath. Mail Stop I1BM I ATIN: Mr. F, J. MehringerMr. R. Foye, Mail Stop 1884 1 Mr. L. F. Coffin, Room lC41-Ki, Corp. R&D, General ElectricNational Aeronautics and Space Administration, Lwis Company, P.O. Box 8. Schenectady, New York 12301Research Center, 21000 Brook Park Road, Cleveland,Ohio 44135 1 Dr. A. K. Shomaker, Research Laboratory, Mail Stop 78,
1 ATTN; Mr. S. S. Monson United States Steel Corp., Monroeville, Pennsylvania 151461 Dr. J. E. Srawley, Mail Stop 105-1
Mr-. .. F. wnw Jr. " ,. Flectric Company, Bettis Atomic Power Laboratory,P 0. Box 109, West ilfflin, Pennsylvania 15122
Panametrics, 221 Crescent Street, Waltnam, Massachusetts 02154 1 ATTN: Mr. M. L. Parriun1 ATTN: Mr. K. A. FowlerWestinghouse R&D Center, 1310 Beulah Road, Pittsburgh,
Wyman-Gordon Company, Worcester, Massachusetts 01601 Pennsylvania 152351 ATTN: Technical Library 1 ATTN: Mr. E. T. Wessel
1 Mr. M. J. MonjoineLockheed-Georoi.-C-,".y, cf eoutn Cobb Drive, Marietta, "4"' r,1 *j063 grcvn University,. Providence, Rhode Island 02912
I ATTN: Materials & Processes Eng. Dept. 71-11, Zone 54 1 ATTN: .'. R. 4c-.l B u of Prof. W. N. Findley, Divition of Engineering, Box DNtional Bureau of Standards. U T. a~rosnt of Coanerce,
Washington, D. C. ?234 Carnegie-Mellon University, Department of mchanical Engineering,1 ATTN: 4r. 5. A. Bennett Scheniey Park. Pittsburgh, Pennsylvania 15213
1 ATTN: Dr. J. L. SwedlowI Mechanical Properties Data Center, Blfour Stulen Inc.,
13917 W. Bay Shore Drive, Traverse City, Michigan 4114 1 Prof. J. Dvorak, Chemical Engineering Department, DukeUniversity, Durham, North Carolina 27706
I Mr. W. F. Anderson, Atomics International, Canoga Park,California 91303 George Washington University, School of Engineering and Applied
Sciences, Washington, D. C. 20052Midwest Research Institute, 425 Coker Boulevard, 1 ATTN: Or., H. LiebowitzKansas City, Missouri 64110ATTN: Mr. C. Q. Bowles Lehigh University, Bethlehem, Pennsylvania 18015
1 ATTN: Prof. G. C. SihI Dr. J. Charles Grosskreutz, Asst. Dir. for Research, I Prof. F. Erodgan
Solar Energy Research Institute, 1536 Cole Boulevard,Golden, Colorado 60401 1 Dr. George R. Irwin, Department of Mechanical Engineering,
University of Maryland, College Park, Maryland 207421 Mr. A. Hurlic0, Convair Div., General Dynamics Corp.,
Mail Zone 630-01, P.O. Box 80847, San Diego, California 92138 Massachusetts Institute of Technology, Cambridge,Massachusetts 02139
Virginia Polytechnic Institute and State University, Dept. of 1 ATTN: Prof. T. H. H. Pian, Department of Aeronautics andEng. Mechanics, 2X Norris Hill, Blackaburg, Virginia 24061 Astronautics
1 ATTN: Prof. R. N. Barker 1 Prof. F, J. McGarry1 Assoc. Prof. G. W. Swift 1 Prof. A, S. Argon, Room 1-3(A
Southwest Research Institute, 8500 Culebra Road, San Antonio, 1 Prof. R. Greif, Dept. of Mach. Eng., Tufts University,Texas 78284 Medford, Massachusetts 02155
I ATTN: Mr. G. C. Grimes
-72-
No. of No. ofCopies To Copies To
1 Dr. D. E. Johnson, AVCO Systems Division, Wilmington, I Mr. Elmer Wheeler. Airesearch Manufacturing Company,Massachusetts 01887 402 S. 36th Street, Phoenix, Arizona 85034
1 Prof. B. Pipes, Dept. of Mech. Eng.. Drexel University, 1 Mr. Charles D. Roach, U.S. Army Scientific and TechnicalPhiladelphia, Pennsylvania 19104 Information Team, 6000 Frankfurt/gain. I.G. Hochhaus. Room 750,
West Germany (APO 09710. MY)1 Dr. A. S. Tetelman, Failure Analysis Associates.11777 Mississippi Ave., Suite 4, Los Angeles I Prof. R. Jones. Dept. of Civil Eng., Ohio State University.California 90025 206 W 18th Avenue, Columbus, Ohio 43210
1 Prof. W. Goldsmith, Dept. of Mech. Eng., University of State University of Now York at Stony Brook, Stony Brook,California. Berkeley, California 94720 New York 11790
1 ATTN: Prof. Fu-Pen Chiang, Dept. of Mechanics1 Prof. A. J. McEvily, Metallurgy Dept U-136, University
of Connecticut, Storrs, Connecticut 06268 E. I. Du Pont de Numours and Company, Wilmington, Delaware 198981 ATTN: Dr. Carl Zweren, Industrial Fibers Div., Textile1 Prof. D. Drucker. Dean of School of Engineering, Fibers Department
University of Illinois, Champaign, Illinois 61820Washington University, St. Louis, Missouri 63130
University of Illinois, Urbana, Illinois 61820 1 ATTN: Prof. E. M. Wu1 ATTN: Prof. H. T. Corten, Dept. of Theoretical andApplied Mechanics, 212 Talbot Laboratory Director, Amy Materials and Mechanics Research Center,
Watertown, Massachusetts 021721 Dr. M. L. Williams, Dean of Engineering, 240 Benedum Hall, 2 ATTN: DRXMR-PLUniversity of Pittsburgh, Pittsburgh, Pennsylvania 15261 1 DRXMR-AP
I DRXMR-X1 Prof. A. Kobayashi, Dept. of Mechanical Engineering, FU-l0, 1 DRXMR-XP
University of Washington, Seattle, Washington 98195 1 ORXMR-CT
I DRXMA-TI Mr. W. A. Wood, Bailli u Laboratory, University of I IRXMR-TM, Dr. Leroe
Melbourne, Melbourie, Australia 47 DRXMR-TM, Mr uplingerI Author
73/74

r - - - - - - - - - - - -T - - - - - - --- -- 1
II 3 - II :-z
0~0
1 -' 1. -0. -
z
A --
CI n . a
0 i
vE o- ,-
II :,,.oo .=o " " "
z z8 Be-0" t I I -I
E J
Lo Ji' 'I