troubleshooting and antifoam application minimizes zlds
TRANSCRIPT
IWC 13-48
Troubleshooting and Antifoam Application Minimizes ZLDS Plant Operating Costs and
Downtime
Kevin Boudreaux Power Industry Technical Consultant
Nalco Company Naperville, Illinois
Steve Biggar
Operations Manager Quantum Auburndale Power, LP
Auburndale, Florida
Ellie Palomo Senior Account Manager
Nalco Company Naperville, Illinois
Keywords: ZLD, Foaming, Antifoam, TOC, Organics, ZLDS, Brine Concentrator, and Crystallizer
Abstract To process waste streams via thermal evaporation, Zero Liquid Discharge plants (ZLD’s) typically employ brine concentrators (BC) and crystallizers. Excessive foaming is a very common problem among these systems, with the root causes ranging from mechanical, to operational, to chemical. This paper discusses how a ZLD plant experiencing an unexplained foaming event, answered the following questions: “What has changed?” “What is creating the foam?” and “How is the problem going to be addressed long term?” It will also discuss how the foaming was managed during the troubleshooting period without a loss of plant availability.
IWC 13-48
INTRODUCTION With the increase in water discharge limitations, more and more power plants are being forced to convert to, or be constructed as, Zero Liquid Discharge systems (ZLD). This means that any waste stream created, such as cooling tower blowdown, must be handled in a way to where no amount of water is discharged from the site. Therefore, the ultimate goal when operating a ZLD is to reuse any and all water possible, while disposing of the solids contained in those waste streams in the driest form. One common method for processing waste streams in ZLD’s is Thermal Evaporation, typically consisting of brine concentrators (BC), also known as evaporators, and crystallizers.
There are many possible configurations for ZLDS’s, and it goes without saying that independent of configuration, a myriad of problems can be guaranteed. A major problem seen by many plants operating BC’s and crystallizers is foaming. Foaming can occur due to a variety of reasons with the root cause ranging from mechanical to operational to chemical in nature. Once established, foaming in a BC or crystallizer can cause issues such as tripping of the unit due to a high sump level alarm, and perhaps of greatest concern, carryover of solids in the distillate stream. When foaming cannot be controlled via mechanical or operational adjustments, it may become necessary to implement a chemical solution, cleverly called an antifoam. However, not all antifoams are the same; and with the number of antifoams available, research, testing and trialing are a must. Generally the word antifoam refers to a chemistry that prevents or minimizes foam formation. The term defoamer is also commonly encountered in the literature. A defoamer is typically a chemistry that brings a foam filled system under control very rapidly; however, it may not have the persistence seen with a antifoam. Formulations are available that have both capabilities. A good trial protocol will educate the team on the effects of different antifoam chemistries, flash points, and chemical interactions, as well as on the effects of various antifoam injection locations. This paper discusses how a ZLD plant experiencing an unexplained foaming event, answered the following questions: “What has
changed?” “What is creating the foam?” and “How is the problem going to be addressed long term?” It will also discuss how the foaming was managed during the troubleshooting period without a loss of plant availability.
PLANT CONFIGURATION AND ZLD OVERVIEW
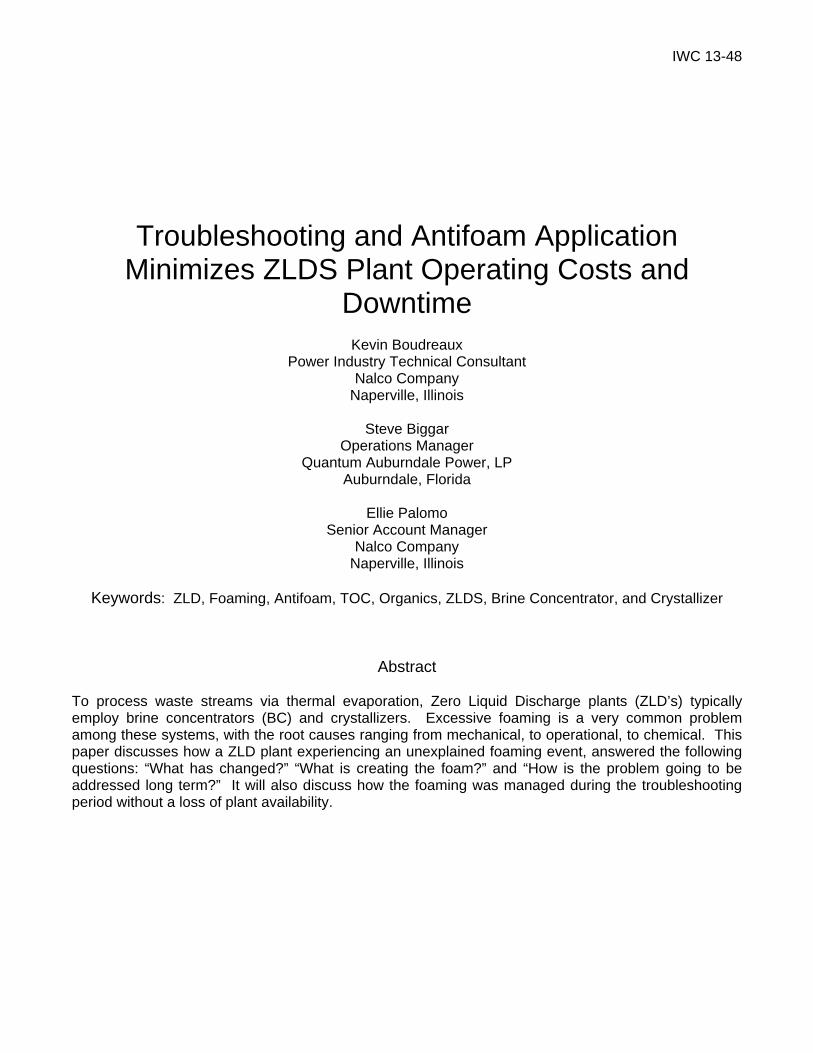
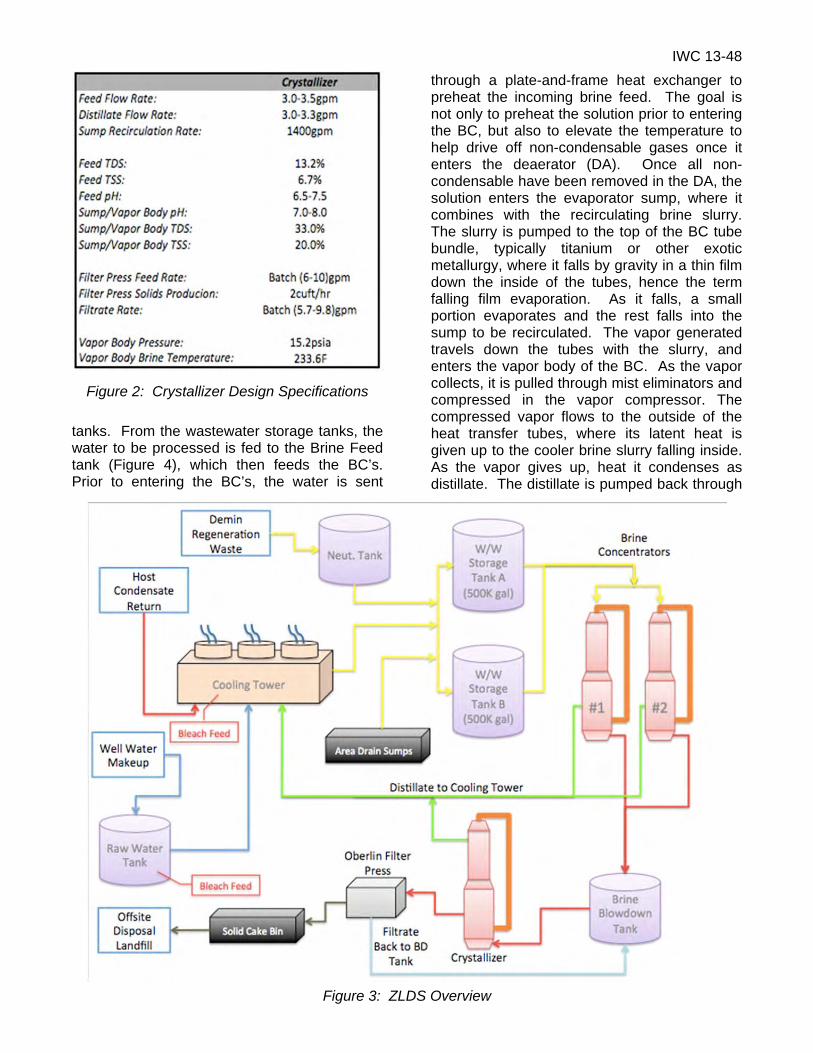
Quantum Auburndale Power, in Auburndale, Florida, is a 150MW, 1 x 1, combined cycle, cogeneration, merchant plant commissioned in 1994. In this particular ZLD operation, an RCC design, brine concentrators, a crystallizer, and an Oberlin Filter Press have been implemented. Details for this equipment can be found in Figures 1 and 2. As with most ZLDS operations, the processes upstream of the BC’s and crystallizer are very complex and impart numerous complications. Adding to that complexity, Auburndale supplies steam to the nearby juice plant and distillery, with process condensate returning to the ZLD processes by way of the cooling tower. This fact, and its effect on the troubleshooting the ZLD operation, will become more significant throughout this paper. Figure 3 illustrates the configuration of Auburndale’s ZLD system, which is a very common ZLD configuration. All waste streams; including cooling tower blowdown, drain sumps, and regeneration waste enter the ZLD plant after being collected in the wastewater storage
Figure 1: BC Design Specifications
IWC 13-48
tanks. From the wastewater storage tanks, the water to be processed is fed to the Brine Feed tank (Figure 4), which then feeds the BC’s. Prior to entering the BC’s, the water is sent
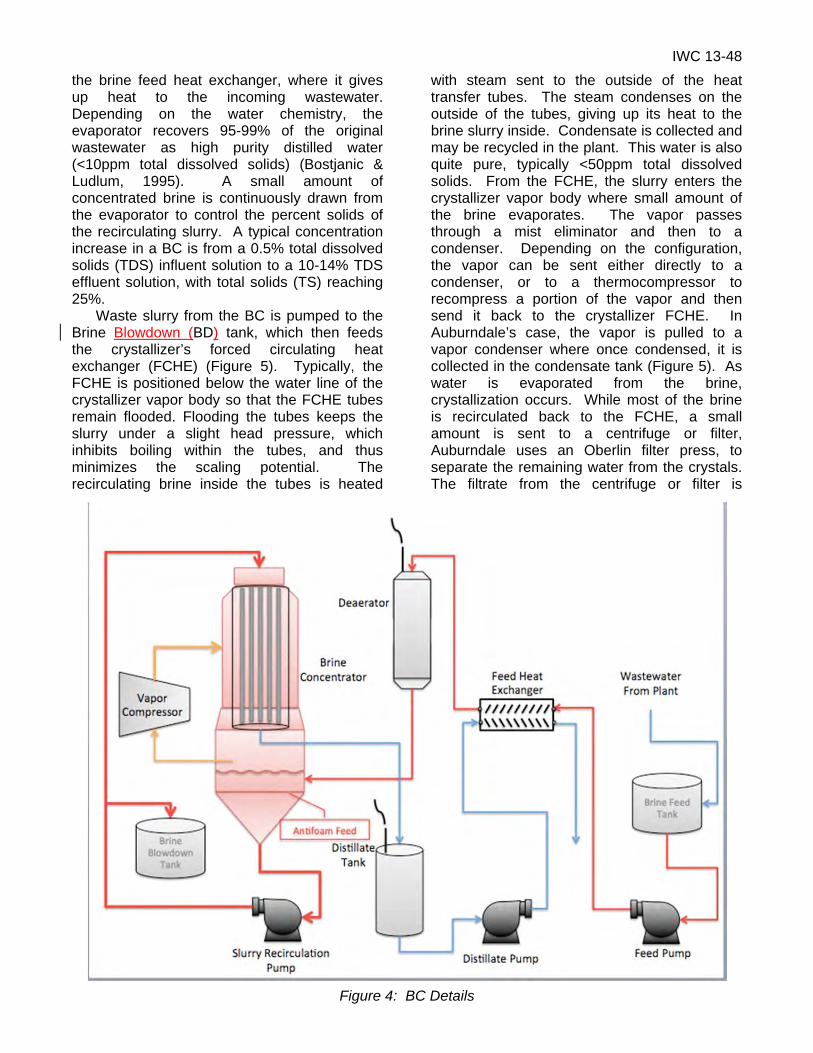
through a plate-and-frame heat exchanger to preheat the incoming brine feed. The goal is not only to preheat the solution prior to entering the BC, but also to elevate the temperature to help drive off non-condensable gases once it enters the deaerator (DA). Once all non-condensable have been removed in the DA, the solution enters the evaporator sump, where it combines with the recirculating brine slurry. The slurry is pumped to the top of the BC tube bundle, typically titanium or other exotic metallurgy, where it falls by gravity in a thin film down the inside of the tubes, hence the term falling film evaporation. As it falls, a small portion evaporates and the rest falls into the sump to be recirculated. The vapor generated travels down the tubes with the slurry, and enters the vapor body of the BC. As the vapor collects, it is pulled through mist eliminators and compressed in the vapor compressor. The compressed vapor flows to the outside of the heat transfer tubes, where its latent heat is given up to the cooler brine slurry falling inside. As the vapor gives up, heat it condenses as distillate. The distillate is pumped back through
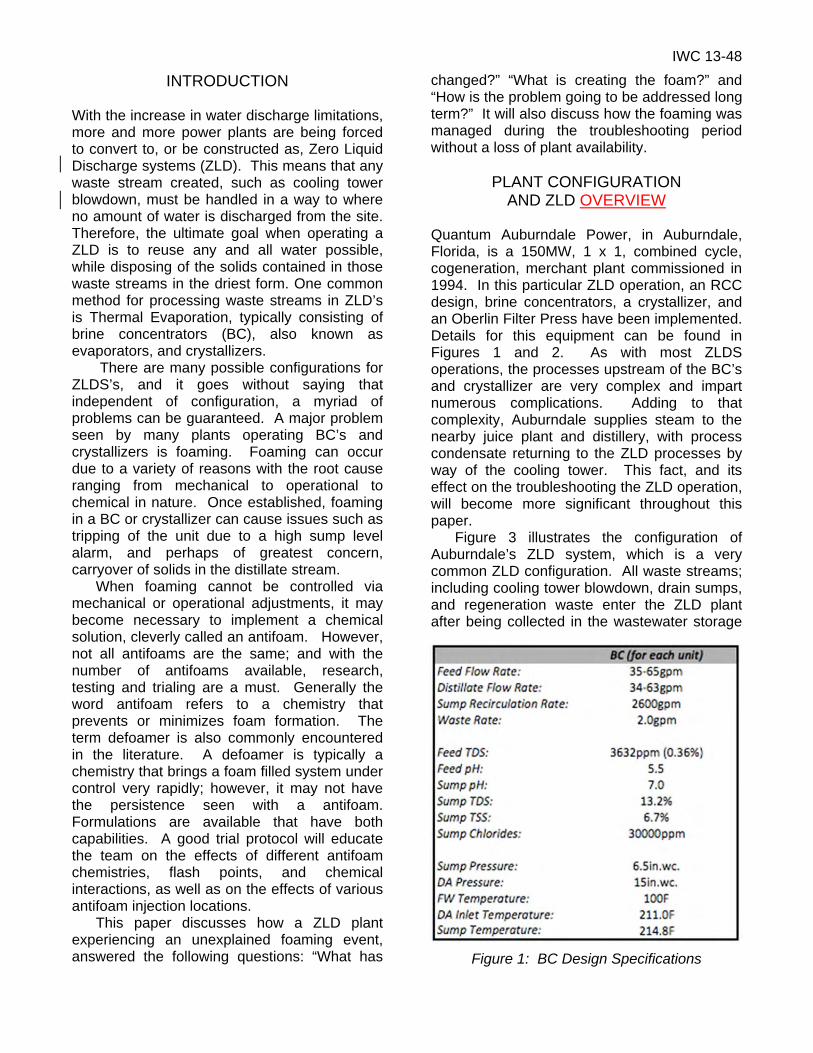
Figure 2: Crystallizer Design Specifications
Figure 3: ZLDS Overview
IWC 13-48
the brine feed heat exchanger, where it gives up heat to the incoming wastewater. Depending on the water chemistry, the evaporator recovers 95-99% of the original wastewater as high purity distilled water (<10ppm total dissolved solids) (Bostjanic & Ludlum, 1995). A small amount of concentrated brine is continuously drawn from the evaporator to control the percent solids of the recirculating slurry. A typical concentration increase in a BC is from a 0.5% total dissolved solids (TDS) influent solution to a 10-14% TDS effluent solution, with total solids (TS) reaching 25%.
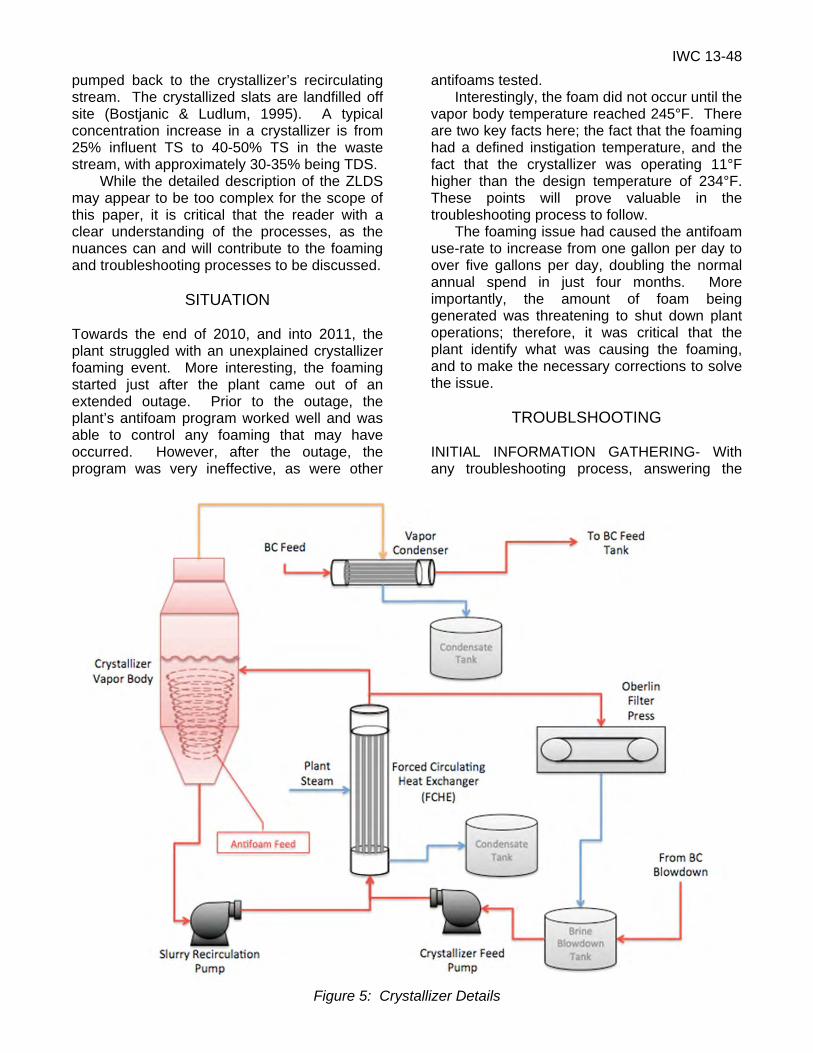
Waste slurry from the BC is pumped to the Brine Blowdown (BD) tank, which then feeds the crystallizer’s forced circulating heat exchanger (FCHE) (Figure 5). Typically, the FCHE is positioned below the water line of the crystallizer vapor body so that the FCHE tubes remain flooded. Flooding the tubes keeps the slurry under a slight head pressure, which inhibits boiling within the tubes, and thus minimizes the scaling potential. The recirculating brine inside the tubes is heated
with steam sent to the outside of the heat transfer tubes. The steam condenses on the outside of the tubes, giving up its heat to the brine slurry inside. Condensate is collected and may be recycled in the plant. This water is also quite pure, typically <50ppm total dissolved solids. From the FCHE, the slurry enters the crystallizer vapor body where small amount of the brine evaporates. The vapor passes through a mist eliminator and then to a condenser. Depending on the configuration, the vapor can be sent either directly to a condenser, or to a thermocompressor to recompress a portion of the vapor and then send it back to the crystallizer FCHE. In Auburndale’s case, the vapor is pulled to a vapor condenser where once condensed, it is collected in the condensate tank (Figure 5). As water is evaporated from the brine, crystallization occurs. While most of the brine is recirculated back to the FCHE, a small amount is sent to a centrifuge or filter, Auburndale uses an Oberlin filter press, to separate the remaining water from the crystals. The filtrate from the centrifuge or filter is
Figure 4: BC Details
IWC 13-48
pumped back to the crystallizer’s recirculating stream. The crystallized slats are landfilled off site (Bostjanic & Ludlum, 1995). A typical concentration increase in a crystallizer is from 25% influent TS to 40-50% TS in the waste stream, with approximately 30-35% being TDS.
While the detailed description of the ZLDS may appear to be too complex for the scope of this paper, it is critical that the reader with a clear understanding of the processes, as the nuances can and will contribute to the foaming and troubleshooting processes to be discussed.
SITUATION Towards the end of 2010, and into 2011, the plant struggled with an unexplained crystallizer foaming event. More interesting, the foaming started just after the plant came out of an extended outage. Prior to the outage, the plant’s antifoam program worked well and was able to control any foaming that may have occurred. However, after the outage, the program was very ineffective, as were other
antifoams tested. Interestingly, the foam did not occur until the
vapor body temperature reached 245°F. There are two key facts here; the fact that the foaming had a defined instigation temperature, and the fact that the crystallizer was operating 11°F higher than the design temperature of 234°F. These points will prove valuable in the troubleshooting process to follow.
The foaming issue had caused the antifoam use-rate to increase from one gallon per day to over five gallons per day, doubling the normal annual spend in just four months. More importantly, the amount of foam being generated was threatening to shut down plant operations; therefore, it was critical that the plant identify what was causing the foaming, and to make the necessary corrections to solve the issue.
TROUBLSHOOTING INITIAL INFORMATION GATHERING- With any troubleshooting process, answering the
Figure 5: Crystallizer Details
IWC 13-48
question, “What has changed?” is critical. Therefore, it was incumbent upon the team to survey the entire ZLDS operation with the focus being to uncover the change. Prior to a physical survey, the team sat down to discuss any unusual events that may have taken place, as well as any concerns shared by plant personnel. Perhaps most intriguing was that the foaming issue started after an extended outage. Once out of the outage, the antifoam in use, as well as others trialed, could not prevent foam generation in the crystallizer. With this information in mind, the focus became determining what took place during the outage that could cause the post outage foaming event. As can be seen in Figure 3, the main water sources to be processed by the ZLDS are the Neutralization tank, Area Drain Sumps, and cooling tower blowdown. Prior to entering the ZLDS processes, all sources are captured and stored in the Waste Water (W/W) tanks. During discussions, it was noted that the Neutralization tank had experience a “pink slime” build up on the walls, and the W/W tanks had a lot of “black muck” in the bottom, which had a rotten egg odor. While this is important, and does lend one to believe there could be a biological problem in these tanks, the plant had experienced this for a long time prior to the foaming event. Therefore, it is difficult to determine the impact this information could have had on the uncontrollable foaming experienced. It was also brought to the team’s attention that during the outage, all tanks were warm and allowed to sit full of “contaminated water”.
In March of 2012, plant personnel cleaned both W/W tanks in an effort to remove the “black muck”. After the cleaning, the W/W tanks were visually inspected and appeared to be free of any sludge or bio-growth. Following the cleaning, a biocide containing 50% glutaraldehyde was added to W/W tanks A and B, at 25 gallons and 5 gallons respectively, with Tank A being 70% full (350,000gals) and Tank B being 10% full (50,000gals) at the time of addition. In rough numbers, this is approximately 75ppm to Tank A and 110ppm to Tank B. More on this will be discussed during the Differential Microbial Analysis (DMA) review. This cleaning was performed on line, and all water and byproducts were sent directly
to the Brine Feed tank, and subsequently the BC’s, during the cleanings. While the W/W tanks were cleaned at this time, the Neutralization tank, Area Drain Sumps, and Brine BD tank were not cleaned. Recall, the foaming issue was in the crystallizer, which is fed directly from the Brine BD tank.
As the discussions progressed, it was important the team develop a good understanding as to how the crystallizer was operating. Since coming out of outage, the operating temperature had risen from 234°F to 245°F, which was an increase in boiling point elevation (BPE) of 11°F. BPE is defined as an increase in the boiling temperature of a solution, above that of pure water at the same pressure. The higher the concentration of dissolved species, the higher the BPE (Shaw & Brosdal, 2008). Pure water, at a saturation pressure of 15.2psia, which is the design point for this particular crystallizer, boils at approximately 214°F. Therefore, the BPE rose from the manufacturer’s design of 20°F to 31°F. With this increase in BPE, there was a possibility that the excessive foaming was due to an increase in dissolved salts or organics. As Solomon et al. stated, “Foaming almost always occurs in mixed salt crystallizers. It can be a result of the presence of fine crystals or other contaminants such as organics.” (Solomon, Griffin, & Schooley, 1998). Furthermore, it has also been noted that particles and polymers, of both inorganic and organic nature can cause foaming at very low concentrations (Pugh, 1996). With this information in mind, it was important to gather samples from various locations throughout the ZLD process to analyze for ionic and organic concentrations. Also, lab analysis would be used to determine the amount of biological activity present throughout the system, as this can greatly affect organic loading, and thus foaming. These results will be discussed in the sections to follow.
Based on the team’s experience, there was some initial concern that an increase in nitrate concentration could be the root cause of the foaming. Due to its solubility, nitrate has proven to be very problematic in crystallizer operations. Many parameters can affect solubility. For example, at 20°C the solubility of calcium sulfate is 0.20g anhydrous/100g H2O; while in contrast, the solubility of calcium nitrate is 129g anhydrous/100g H2O. Furthermore, as
IWC 13-48
temperature increases, so does the solubility of nitrate salts. For instance, while sodium chloride has a weak temperature dependence with regard to solubility, 35.7g to 39.7g/100g H2O over a 100°C range, potassium nitrate solubility changes from 13.4g to 247g/100g H2O over that same range (Myerson, 2002). Due to its solubility, nitrate can become the limiting factor for the crystallizer operation. That is to say, as the nitrates fail to be removed by the final concentration mechanism, such as a pressurized filter press, they accumulate in the crystallizer slurry. As they accumulate, the BPE rises to a point to where the plant does not have enough plant steam or vapor compression capacity to raise the temperature to promote the evaporation process. Without the temperature rise of the circulating slurry, flashing does not occur in the vapor body. Obviously, without flashing, the distillate production is reduced, thus reducing the capacity of the crystallizer process. More importantly, along with BPE elevation, nitrates can also contribute to foaming prior to the reduction in capacity just by the overall increase in dissolved solids. Therefore, it was important not to overlook their possible influence.
While nitrates were of concern, they are typically not an issue unless a change has occurred with the plant’s makeup water source, or something has changed with the ZLD operation. In Auburndale’s case, neither was applicable. Later analyses would confirm the nitrates were not exceedingly high, but at the time of initial troubleshooting, it was not ruled out. On the discussion of dissolved solids, it was also important to ensure the plant was not exceeding the total dissolved solids (TDS) limits for the BC’s and crystallizer. As previously stated, it is not uncommon for BC’s or crystallizers to foam due to elevated TDS concentrations. However, this normal amount of foam is usually controllable with the proper antifoam application. Auburndale’s BC’s and crystallizer are designed to operate with an upper TDS limit of 13.2% and 33% respectively. A review of the log sheets showed that plant operations was very diligent in maintaining this limit, which further lead the authors to believe that the excessive foaming experienced was not TDS related. Another key aspect to discuss is that the foaming did not become out of control until the vapor body rose to or above 245°F. And since
the BPE was such that 245°F had become the necessary operating temperature to maintain crystallizer capacity, foaming was consistently out of control. Because the temperature at which the foaming occurred was so definite, attention turned to the antifoams themselves. Many types of antifoam have a flashpoint at which they thermally degrade and become ineffective. For instance, antifoams with volatile components may lose some activity as these components evaporate in very hot systems. However, when the original antifoam failed to control the excessive foaming, Nalco 7471 was brought in to trial. This particular product has a flash point of 350°F and also failed to control the foaming taking place. This is not to say that some component of the product was not flashing off rendering it ineffective, because as will be seen in the bench testing results the 7471 did work well on the bench, but it was the decision of the group to keep troubleshooting the chemistry and mechanical operations of the ZLDS.
As discussions continued, the focus began to turn to organic contamination. With the organic matter found in the W/W tanks, along with the ZLDS components sitting throughout the outage full of untreated, warm water, it was thought that perhaps the ZLDS had become contaminated with microbiological growth. Organic contamination occurs in various processes throughout a power plant; cooling towers, reverse osmosis systems, pretreatment systems, etc. It is not only common, but happens quickly, and commonly contributes to foaming problems. The term organic contamination can refer to biologically induced contamination, as well as other naturally occurring organics such as humic substances. Organic molecules, acting as surfactants, contribute to foaming by increasing the surface tension gradients of a foam, which in turn gives the foam its stability. Surfactant concentration and surface tension gradients are just a couple of the many factors that affect the probability of foam production (Pugh, 1996). As the amount of organics in the bulk solution increase, the concentration on the bubble surface increase, thus increasing elasticity and surface tension. Couple this with the crystallizer operating with 333,000ppm TDS and at elevated temperatures, and the potential for foaming increases. Furthermore, like soluble inorganics, such as nitrates, soluble organics can be
IWC 13-48
difficult, if not impossible, to remove from the crystallizer slurry via a filter press. Because they are soluble, the organics pass through the belt filter press and return to the crystallizer slurry with the produced filtrate. This cycling effect causes an increase in dissolved organics, which in turn causes an increase in the BPE.
INITIAL THOUGHTS- At this point in the troubleshooting process, there are key points to consider:
1. Foaming problem is new, and did not
occur prior to November 2010 Outage. 2. Foaming out of control once operating
temperature exceeds 245°F. Flash point on Nalco 7471 350°F, so it does not appear that there is a breakdown in the antifoam.
3. W/W tanks cleaned in March and treated with biocide. Cleaned on line and all byproducts sent to Brine BD tank.
4. Neutralization tank, Brine BD tank, and Area Drain Sump were not cleaned.
5. TDS and TSS chemistry within the BC and crystallizer maintained in accordance with manufacturer’s guidelines.
6. BPE 11°F higher than design and pre-outage conditions.
7. Strong indications of organic contamination of ZLDS equipment.
8. Samples taken from various points throughout the ZLDS, on multiple days.
9. There is no clear change that the excess foam can be attributed to. The W/W contamination and cleaning is of importance, but it remains to be determined as to how much.
LABORATORY ANALYSES RESULTS- The samples taken were dictated by the availability of the sample at the time. Samples were to be analyzed for ionic constituents, total organic carbon, and microbial activity. The goal of this extensive investigation was to determine if there were any obvious chemistry related issues. Understanding there are a few key
players involved with foam generation, if those players can be isolated in a particular area of operation, then the troubleshooting process becomes much easier. The results to be discussed can be found in Figures 6 and 7. Please refer to Figures 3, 4, and 5 for a better understanding of the sample locations and how each interacts with one another.
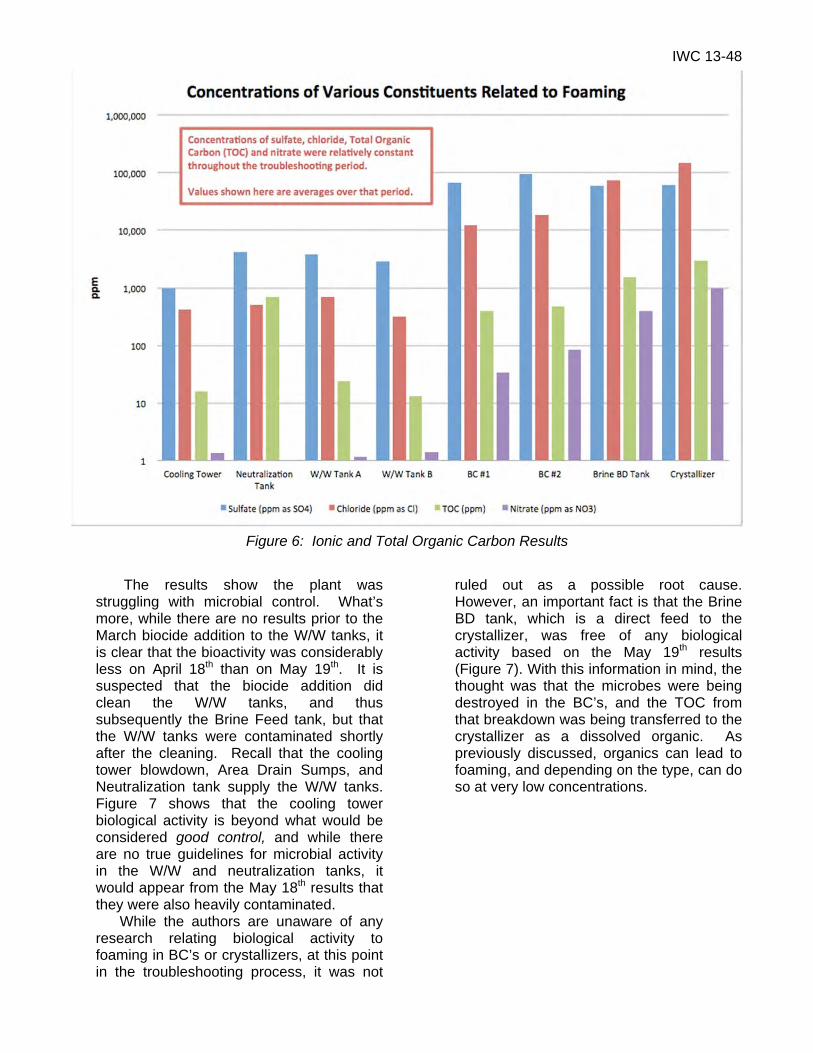
Ionic – Ionic in this particular discussion refers to chloride, sulfate, and nitrate concentrations, as these are key species pertaining to this operation (Figure 6). As expected, the chloride and sulfate levels were well within the manufacturer’s guidelines, and there were no results of concern in regards to over-cycling of TDS. Nitrate levels were slightly elevated in the crystallizer, but when compared to other ZLDS’s around the country that have known nitrate concerns, they are low. Therefore, it was not believed that the nitrate levels were contributing to the foaming issue. Notice that the Brine BD tank ionic concentrations are higher than the two BC’s from which it is fed. This is because the filtrate from the Oberlin filter press also feeds this tank. This is an important fact since any soluble constituents, such as soluble salts and organics that are not removed by the press recycle back to the Brine BD tank, which then feeds the crystallizer.
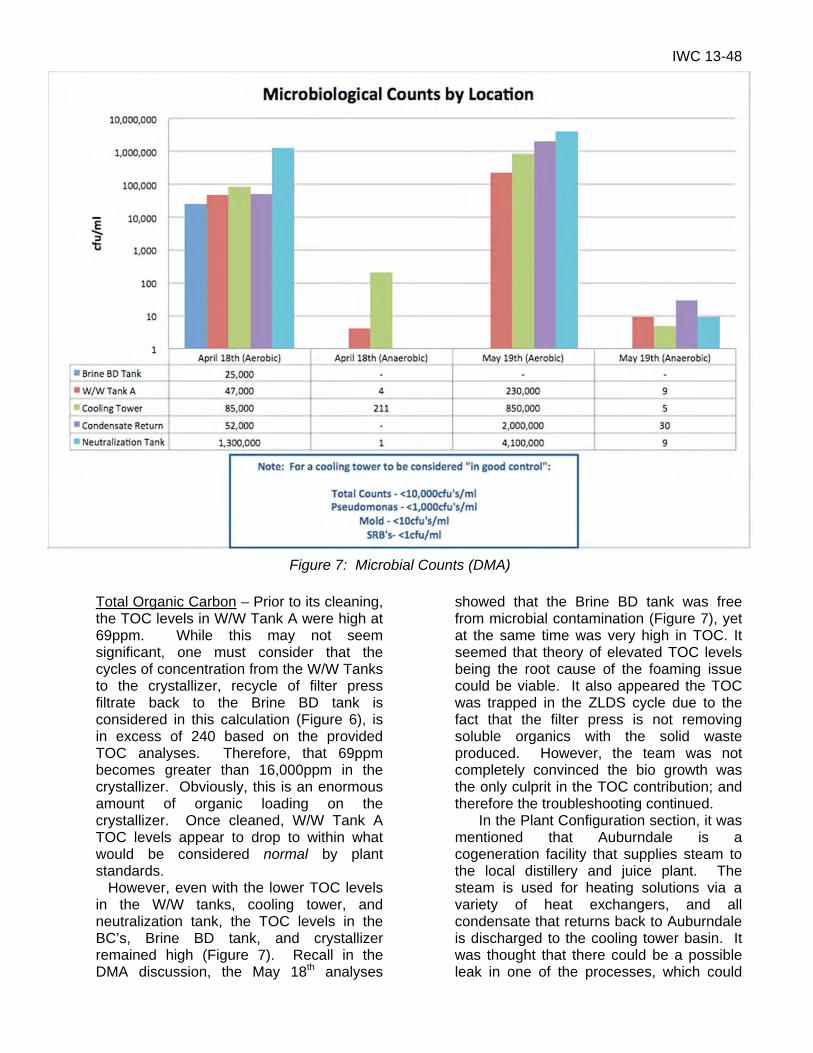
Differential Microbial Analysis (DMA) – The DMA is a widely used set of laboratory tests that provides important information about the microbiology of the system in question. It can differentiate many of the bacteria into principle classes, and other organisms, like algae, protozoa, and fungi, can be determined by microscopic observation. The results for the samples to be reviewed can be found in Figure 7. The samples were taken on April 18th and May 19th, which is pertinent since the biocide addition to W/W Tanks A and B was performed in late March, just prior to when the first DMA was performed.
IWC 13-48
The results show the plant was struggling with microbial control. What’s more, while there are no results prior to the March biocide addition to the W/W tanks, it is clear that the bioactivity was considerably less on April 18th than on May 19th. It is suspected that the biocide addition did clean the W/W tanks, and thus subsequently the Brine Feed tank, but that the W/W tanks were contaminated shortly after the cleaning. Recall that the cooling tower blowdown, Area Drain Sumps, and Neutralization tank supply the W/W tanks. Figure 7 shows that the cooling tower biological activity is beyond what would be considered good control, and while there are no true guidelines for microbial activity in the W/W and neutralization tanks, it would appear from the May 18th results that they were also heavily contaminated. While the authors are unaware of any research relating biological activity to foaming in BC’s or crystallizers, at this point in the troubleshooting process, it was not
ruled out as a possible root cause. However, an important fact is that the Brine BD tank, which is a direct feed to the crystallizer, was free of any biological activity based on the May 19th results (Figure 7). With this information in mind, the thought was that the microbes were being destroyed in the BC’s, and the TOC from that breakdown was being transferred to the crystallizer as a dissolved organic. As previously discussed, organics can lead to foaming, and depending on the type, can do so at very low concentrations.
Figure 6: Ionic and Total Organic Carbon Results
IWC 13-48
Total Organic Carbon – Prior to its cleaning, the TOC levels in W/W Tank A were high at 69ppm. While this may not seem significant, one must consider that the cycles of concentration from the W/W Tanks to the crystallizer, recycle of filter press filtrate back to the Brine BD tank is considered in this calculation (Figure 6), is in excess of 240 based on the provided TOC analyses. Therefore, that 69ppm becomes greater than 16,000ppm in the crystallizer. Obviously, this is an enormous amount of organic loading on the crystallizer. Once cleaned, W/W Tank A TOC levels appear to drop to within what would be considered normal by plant standards. However, even with the lower TOC levels in the W/W tanks, cooling tower, and neutralization tank, the TOC levels in the BC’s, Brine BD tank, and crystallizer remained high (Figure 7). Recall in the DMA discussion, the May 18th analyses
showed that the Brine BD tank was free from microbial contamination (Figure 7), yet at the same time was very high in TOC. It seemed that theory of elevated TOC levels being the root cause of the foaming issue could be viable. It also appeared the TOC was trapped in the ZLDS cycle due to the fact that the filter press is not removing soluble organics with the solid waste produced. However, the team was not completely convinced the bio growth was the only culprit in the TOC contribution; and therefore the troubleshooting continued. In the Plant Configuration section, it was mentioned that Auburndale is a cogeneration facility that supplies steam to the local distillery and juice plant. The steam is used for heating solutions via a variety of heat exchangers, and all condensate that returns back to Auburndale is discharged to the cooling tower basin. It was thought that there could be a possible leak in one of the processes, which could
Figure 7: Microbial Counts (DMA)
IWC 13-48
have contributed to the elevated TOC levels. However, based on the lab results, there was never any appreciable TOC found, all <1.0ppm, in any of the condensate return samples. Furthermore, the TOC levels in the cooling tower have remained fairly steady at an average of 15ppm (Figure 6), which is not uncommon and not alarming.
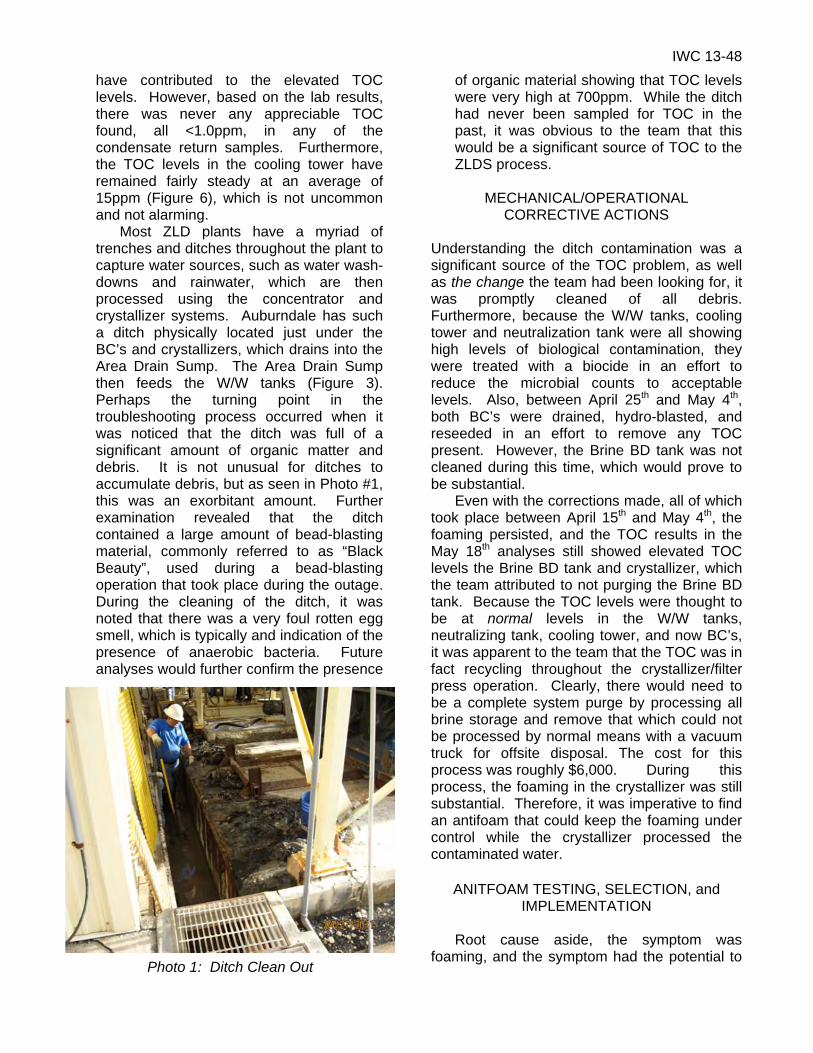
Most ZLD plants have a myriad of trenches and ditches throughout the plant to capture water sources, such as water wash-downs and rainwater, which are then processed using the concentrator and crystallizer systems. Auburndale has such a ditch physically located just under the BC’s and crystallizers, which drains into the Area Drain Sump. The Area Drain Sump then feeds the W/W tanks (Figure 3). Perhaps the turning point in the troubleshooting process occurred when it was noticed that the ditch was full of a significant amount of organic matter and debris. It is not unusual for ditches to accumulate debris, but as seen in Photo #1, this was an exorbitant amount. Further examination revealed that the ditch contained a large amount of bead-blasting material, commonly referred to as “Black Beauty”, used during a bead-blasting operation that took place during the outage. During the cleaning of the ditch, it was noted that there was a very foul rotten egg smell, which is typically and indication of the presence of anaerobic bacteria. Future analyses would further confirm the presence
of organic material showing that TOC levels were very high at 700ppm. While the ditch had never been sampled for TOC in the past, it was obvious to the team that this would be a significant source of TOC to the ZLDS process.
MECHANICAL/OPERATIONAL
CORRECTIVE ACTIONS Understanding the ditch contamination was a significant source of the TOC problem, as well as the change the team had been looking for, it was promptly cleaned of all debris. Furthermore, because the W/W tanks, cooling tower and neutralization tank were all showing high levels of biological contamination, they were treated with a biocide in an effort to reduce the microbial counts to acceptable levels. Also, between April 25th and May 4th, both BC’s were drained, hydro-blasted, and reseeded in an effort to remove any TOC present. However, the Brine BD tank was not cleaned during this time, which would prove to be substantial.
Even with the corrections made, all of which took place between April 15th and May 4th, the foaming persisted, and the TOC results in the May 18th analyses still showed elevated TOC levels the Brine BD tank and crystallizer, which the team attributed to not purging the Brine BD tank. Because the TOC levels were thought to be at normal levels in the W/W tanks, neutralizing tank, cooling tower, and now BC’s, it was apparent to the team that the TOC was in fact recycling throughout the crystallizer/filter press operation. Clearly, there would need to be a complete system purge by processing all brine storage and remove that which could not be processed by normal means with a vacuum truck for offsite disposal. The cost for this process was roughly $6,000. During this process, the foaming in the crystallizer was still substantial. Therefore, it was imperative to find an antifoam that could keep the foaming under control while the crystallizer processed the contaminated water.
ANITFOAM TESTING, SELECTION, and IMPLEMENTATION
Root cause aside, the symptom was
foaming, and the symptom had the potential to Photo 1: Ditch Clean Out
IWC 13-48
affect dollars generated. So in congruence with the troubleshooting process, the local team set out to identify an antifoam that could help control the current foaming issue. ANTIFOAM TESTING AND SELECTION- Antifoam mechanisms have been studied and argued for decades, and will continue to be discussed for decades to come. There are no hard and fast rules determining the efficacy of any antifoam in a particular application, and understanding an antifoam’s potential is best uncovered through bench testing (von Pahul & Stern).
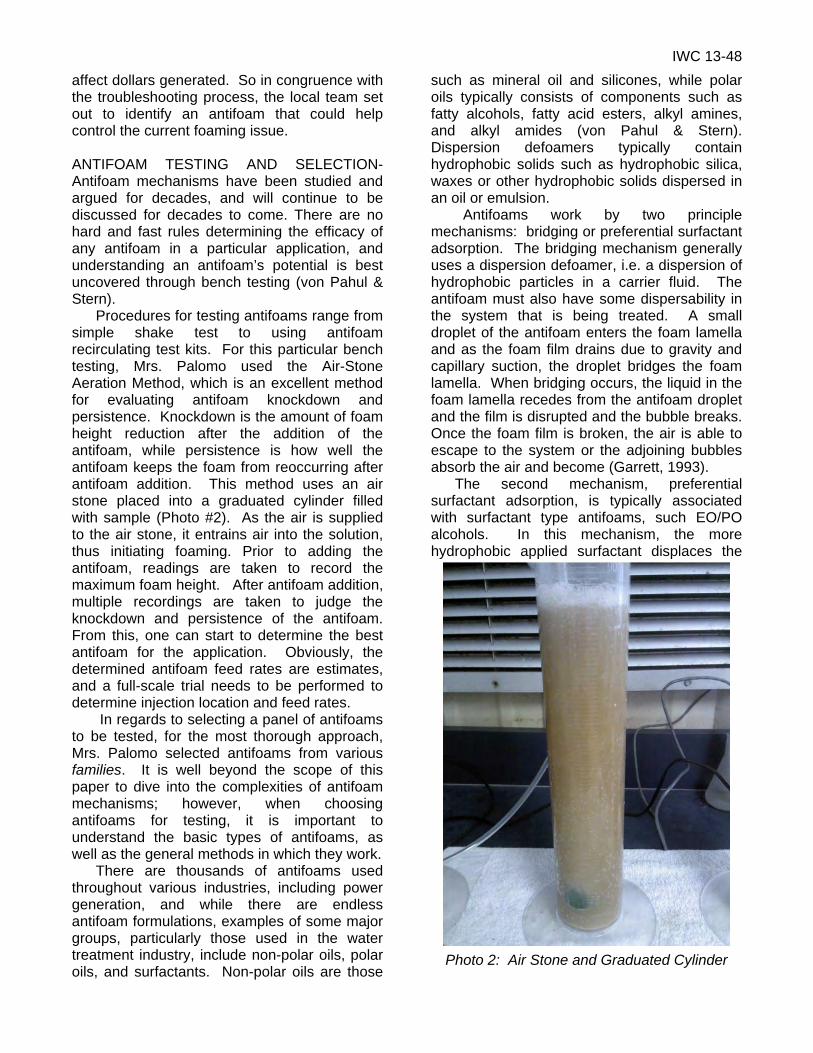
Procedures for testing antifoams range from simple shake test to using antifoam recirculating test kits. For this particular bench testing, Mrs. Palomo used the Air-Stone Aeration Method, which is an excellent method for evaluating antifoam knockdown and persistence. Knockdown is the amount of foam height reduction after the addition of the antifoam, while persistence is how well the antifoam keeps the foam from reoccurring after antifoam addition. This method uses an air stone placed into a graduated cylinder filled with sample (Photo #2). As the air is supplied to the air stone, it entrains air into the solution, thus initiating foaming. Prior to adding the antifoam, readings are taken to record the maximum foam height. After antifoam addition, multiple recordings are taken to judge the knockdown and persistence of the antifoam. From this, one can start to determine the best antifoam for the application. Obviously, the determined antifoam feed rates are estimates, and a full-scale trial needs to be performed to determine injection location and feed rates.
In regards to selecting a panel of antifoams to be tested, for the most thorough approach, Mrs. Palomo selected antifoams from various families. It is well beyond the scope of this paper to dive into the complexities of antifoam mechanisms; however, when choosing antifoams for testing, it is important to understand the basic types of antifoams, as well as the general methods in which they work.
There are thousands of antifoams used throughout various industries, including power generation, and while there are endless antifoam formulations, examples of some major groups, particularly those used in the water treatment industry, include non-polar oils, polar oils, and surfactants. Non-polar oils are those
such as mineral oil and silicones, while polar oils typically consists of components such as fatty alcohols, fatty acid esters, alkyl amines, and alkyl amides (von Pahul & Stern). Dispersion defoamers typically contain hydrophobic solids such as hydrophobic silica, waxes or other hydrophobic solids dispersed in an oil or emulsion.
Antifoams work by two principle mechanisms: bridging or preferential surfactant adsorption. The bridging mechanism generally uses a dispersion defoamer, i.e. a dispersion of hydrophobic particles in a carrier fluid. The antifoam must also have some dispersability in the system that is being treated. A small droplet of the antifoam enters the foam lamella and as the foam film drains due to gravity and capillary suction, the droplet bridges the foam lamella. When bridging occurs, the liquid in the foam lamella recedes from the antifoam droplet and the film is disrupted and the bubble breaks. Once the foam film is broken, the air is able to escape to the system or the adjoining bubbles absorb the air and become (Garrett, 1993). The second mechanism, preferential surfactant adsorption, is typically associated with surfactant type antifoams, such EO/PO alcohols. In this mechanism, the more hydrophobic applied surfactant displaces the
Photo 2: Air Stone and Graduated Cylinder
IWC 13-48
foam stabilizing surfactant from the foam film. It replaces the stabilizing surfactant with a surfactant that is incapable of forming a stable film. Hence, the more hydrophobic surfactant is preferentially adsorbed (Pugh, 1996). Both of these mechanisms are simplified for sake of brevity, and in some formulations, both mechanisms may be at work. An understanding of antifoam actives, as well as antifoam mechanisms, guided Mrs. Palomo to select the antifoams seen in Figure 8.
Prior to bench testing, two 5-gallon buckets of Brine BD tank sample were collected, and each selected antifoam was made down to a 1% solution for testing. While the antifoam would not be fed as a dilute solution, with such small volumes of sample, dilution is necessary in order to prevent overfeed during testing. It is important to note that diluting an antifoam prior to injection is not only common, but has the potential to make the product more effective. However, in most ZLD applications, such as Auburndale, the antifoams are not diluted.
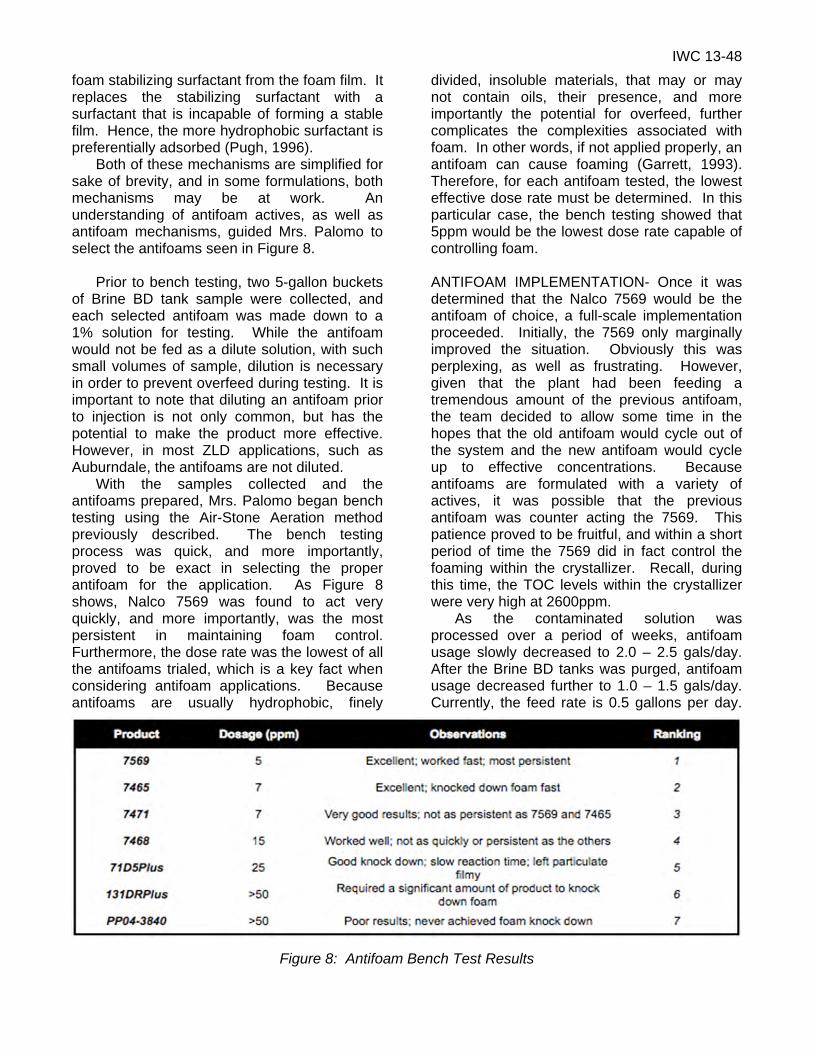
With the samples collected and the antifoams prepared, Mrs. Palomo began bench testing using the Air-Stone Aeration method previously described. The bench testing process was quick, and more importantly, proved to be exact in selecting the proper antifoam for the application. As Figure 8 shows, Nalco 7569 was found to act very quickly, and more importantly, was the most persistent in maintaining foam control. Furthermore, the dose rate was the lowest of all the antifoams trialed, which is a key fact when considering antifoam applications. Because antifoams are usually hydrophobic, finely
divided, insoluble materials, that may or may not contain oils, their presence, and more importantly the potential for overfeed, further complicates the complexities associated with foam. In other words, if not applied properly, an antifoam can cause foaming (Garrett, 1993). Therefore, for each antifoam tested, the lowest effective dose rate must be determined. In this particular case, the bench testing showed that 5ppm would be the lowest dose rate capable of controlling foam.
ANTIFOAM IMPLEMENTATION- Once it was determined that the Nalco 7569 would be the antifoam of choice, a full-scale implementation proceeded. Initially, the 7569 only marginally improved the situation. Obviously this was perplexing, as well as frustrating. However, given that the plant had been feeding a tremendous amount of the previous antifoam, the team decided to allow some time in the hopes that the old antifoam would cycle out of the system and the new antifoam would cycle up to effective concentrations. Because antifoams are formulated with a variety of actives, it was possible that the previous antifoam was counter acting the 7569. This patience proved to be fruitful, and within a short period of time the 7569 did in fact control the foaming within the crystallizer. Recall, during this time, the TOC levels within the crystallizer were very high at 2600ppm. As the contaminated solution was processed over a period of weeks, antifoam usage slowly decreased to 2.0 – 2.5 gals/day. After the Brine BD tanks was purged, antifoam usage decreased further to 1.0 – 1.5 gals/day. Currently, the feed rate is 0.5 gallons per day.
Figure 8: Antifoam Bench Test Results
IWC 13-48
Recall, antifoam feed rates prior to the November outage were 1.0 gallon per day.
RESULTS AND PATH FORWARD
With the team’s hard work and persistence, the root cause of the foaming was identified and appropriate corrective actions were taken. Antifoam bench testing and selection allowed the team breathing room during the troubleshooting process since the crystallizer foaming was controllable, even with the elevated the TOC levels. From a costs perspective, the plant was well on its way to a yearly spending of $100,000 for its previous antifoam; an antifoam that was so ineffective, plant availability was in question.
Since this event, the crystallizer operating temperature has been near design specifications at 235°F – 238°F. Understanding the BPE, and thus the operating temperature, rises with an increase in TDS, whether inorganic or organic, Mr. Biggar has implemented procedures directing operations to fine tune the filter press cycle time in an effort to control the cycling of dissolved solids within the crystallizer. By decreasing the cycle time of the filter press, the plant is able to remove more solids from the crystallizer slurry, thus maintaining a lower TSS and TDS. If the TDS should happen to rise to unacceptable levels, a purge will be initiated until the TDS drops to within design specifications.
Given that the root cause of the foaming issues was related to accumulation of organics, bio, and debris in the ditch, Mr. Biggar initiated a preventative maintenance (PM) program to clean the ditch once a week. The PM includes shoveling all waste from the ditch, which is then disposed of with the solids produced by the Oberlin filter press.
The plant will also be implementing a more consistent sample collection and analysis
program to closely monitor the chemistry throughout the ZLDS process. This will include all systems, as a ZLDS is a cyclical operation where every component affects another. As of the writing of this report, the plant is capturing samples to be used in the update report to follow. Finally, the plant made modifications to the bleach injection system. This included going from a diaphragm pump to a much heavier duty peristaltic pump. With this change, bleach feed is much more consistent, allowing the plant to maintain the proper free chlorine residual. Because the cooling tower is the main supply to the W/W tanks, maintaining a good biocide program should minimize organic loading on the ZLDS system, and possibly further reduce antifoam usage.
SUMMARY
In the beginning of this report, the following was asked: “What has changed?” “What is creating the foam?” and “How is the problem going to be addressed long term?” By realizing that such an innocuous part of the process, the ditch, was harboring a significant amount of organic matter and debris, the team was able to determine that the change was something as simple as to where bead-blasting material used during the outage had ended up. After determining what had changed, through lab analyses and an understanding of crystallizer operation and chemistry, the team was able to narrow down the root cause of the foaming, elevated TOC levels. More importantly, once the root cause was identified, the plant made the necessary corrective actions and modifications, cleaning of the ZLDS equipment, optimize crystallizer and filter press operations, and improve cooling tower biocide program, to significantly minimize the potential for a repeat occurrence.
IWC 13-48
Works Cited Bostjanic, J., & Ludlum, R. (1995). Reducing Wastewater To Dryness: Zero Liquid Discharge Case Studies at New Power Plants. Corrosion , 399/1-9. Garrett, P. (1993). Defoaming: Theory and Industrial Applications (Vol. 45). New York, New York: Marcel Dekker, Inc. Myerson, A. S. (2002). Handbook of Industrial Crystallization (Second ed.). Woburn, MA: Butterworth-Heinemann. Pugh, R. (1996). Foaming, foam films, antifoaming and defoaming. Advances in Colloid and Interface Science (64), 67-142. Shaw, W., & Brosdal, J. (2008, Oct 1). Strategies to Minimize Wastewater Discharge. Chemical Engineering , pp. 60-61,63-68. Solomon, R., Griffin, S., & Schooley, K. (1998). The Advantage of Mixed Salt Crystallizers in Zero Liquid Discharge Wastewater Treatment Systems. International Water Conference (pp. 317-324). Bellevue: Ionics RCC. von Pahul, S., & Stern, L. Antifoam: What is it? How does it work? Why do they say to limit its use? Weatherford, TX: D-Foam Inc.