tropospheric emissions: monitoring of pollution (tempo) kelly chance & the tempo team april 19,...
TRANSCRIPT
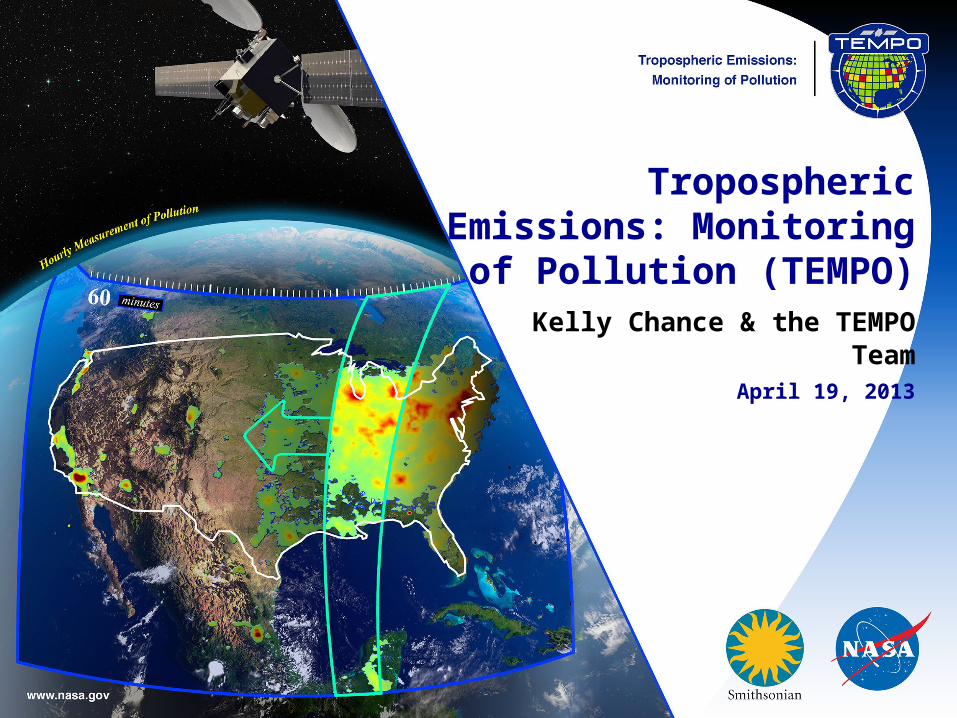
Tropospheric Emissions: Monitoring of Pollution
(TEMPO) Kelly Chance & the TEMPO Team
April 19, 2013

TEMPO Science Team
5/21/13 2
Team Member Institution Role Responsibility
K. Chance SAO PI Overall science development; Level 1b, H2CO, C2H2O2
X. Liu SAO Deputy PI Science development, data processing; O3 profile, tropospheric O3
J. Carr Carr Astronautics Co-I INR Modeling and algorithm
M. Chin GDFC Co-I UV aerosol product, AI
R. Cohen U.C. Berkeley Co-I NO2 validation, atmospheric chemistry modeling, process studies
D. Edwards NCAR Co-I VOC science, synergy with carbon monoxide measurements
J. Fishman St. Louis U. Co-I AQ impact on agriculture and the biosphere
D. Flittner LaRC Project Scientist Overall project development; STM; instrument cal./char.
J. Herman UMBC Co-I Validation (PANDORA measurements)
D. Jacob Harvard Co-I Science requirements, atmospheric modeling, process studies
S. Janz GSFC Co-I Instrument calibration and characterization
J. Joiner GSFC Co-I Cloud, total O3, TOA shortwave flux research product
N. Krotkov GSFC Co-I NO2, SO2, UVB
M. Newchurch U. Alabama Huntsville Co-I Validation (O3 sondes, O3 lidar)
R.B. Pierce NOAA/NESDIS Co-I AQ modeling, data assimilation
R. Spurr RT Solutions, Inc. Co-I Radiative transfer modeling for algorithm development
R. Suleiman SAO Co-I, Data Mgr. Managing science data processing, BrO, H2O, and L3 products
J. Szykman EPA Co-I AIRNow AQI development, validation (PANDORA measurements)
O. Torres GSFC Co-I UV aerosol product, AI
J. Wang U. Nebraska Co-I Synergy w/GOES-R ABI, aerosol research products
J. Leitch Ball Aerospace Collaborator Aircraft validation, instrument calibration and characterization
R. Martin Dalhousie U. Collaborator Atmospheric modeling, air mass factors, AQI development
D. Neil LaRC Collaborator GEO-CAPE mission design team member
J. Kim Yonsei U. Collaborators,Science Advisory Panel
Korean GEMS, CEOS constellation of GEO pollution monitoring
J. McConnell York U. Canada CSA PHEOS, CEOS constellation of GEO pollution monitoring
B. Veihelmann ESA ESA Sentinel-4, CEOS constellation of GEO pollution monitoring

3
Hourly atmospheric pollution from geostationary
Earth orbitPI: Kelly Chance, Smithsonian Astrophysical ObservatoryDeputy PI: Xiong Liu, Smithsonian Astrophysical ObservatoryInstrument Development: Ball AerospaceProject Manager: Wendy Pennington, NASA LaRCProject Scientist: Dave Flittner, LaRC; Deputy PS: Jay Al-Saadi, LaRCOther Institutions: NASA GSFC (led by Scott Janz), NOAA, EPA, NCAR, Harvard, UC Berkeley, St. Louis U, U Alabama Huntsville, U NebraskaInternational collaboration: Korea, ESA, Canada
Selected Nov. 2012 through NASA’s first Earth Venture Instrument solicitationCurrently in Phase A, System Requirements Review 9/30/2013Instrument delivery September 2017NASA will arrange hosting on commercial geostationary
communications satellite with expected ~2019 launch
Provides hourly daylight observations to capture rapidly varying emissions & chemistry important for air quality• UV/visible grating spectrometer to measure key elements in tropospheric
ozone and aerosol pollution• Exploits extensive measurement heritage from LEO missions• Distinguishes boundary layer from free tropospheric & stratospheric
ozone
Aligned with Earth Science Decadal Survey recommendations• Makes most of the GEO-CAPE atmosphere measurements • Responds to the phased implementation recommendation of GEO-
CAPE mission design team
The North American geostationary component of an international constellation for air quality monitoring5/21/13

4
Geostationary constellation coverage
5/21/13
TEMPO
Policy-relevant science and environmental services enabled by common observations• Improved emissions, at common confidence levels, over industrialized Northern Hemisphere• Improved air quality forecasts and assimilation systems• Improved assessment, e.g., observations to support the United Nations Convention on Long
Range Transboundary Air Pollution
Courtesy Jhoon Kim,Andreas Richter
GEMS
Sentinel-4

5
TEMPO footprint, ground sample distance and field of
regard
Each 2 km × 4.5 km pixel is a 2K element spectrum from 290-690 nmGEO platform selected by NASA for viewing Greater North America
5/21/13
6
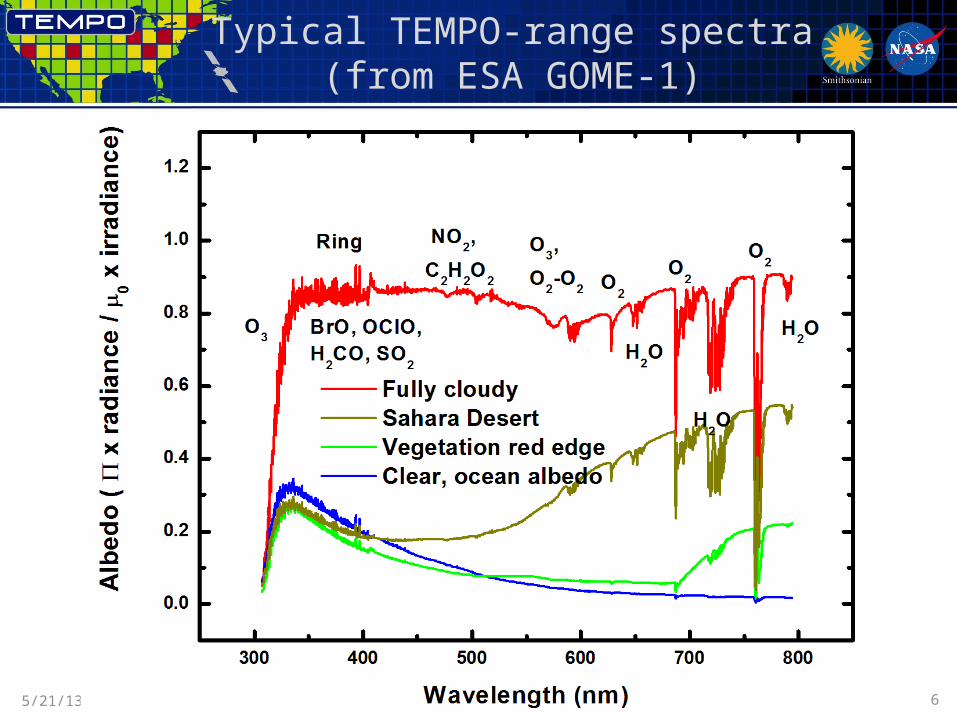
Typical TEMPO-range spectra (from ESA GOME-1)
5/21/13

7
TEMPO science questions
5/21/13
1. What are the temporal and spatial variations of emissions of gases and aerosols important for air quality and climate?
2. How do physical, chemical, and dynamical processes determine tropospheric composition and air quality over scales ranging from urban to continental, diurnally to seasonally?
3. How does air pollution drive climate forcing and how does climate change affect air quality on a continental scale?
4. How can observations from space improve air quality forecasts and assessments for societal benefit?
5. How does intercontinental transport affect air quality?6. How do episodic events, such as wild fires, dust outbreaks,
and volcanic eruptions, affect atmospheric composition and air quality?
8
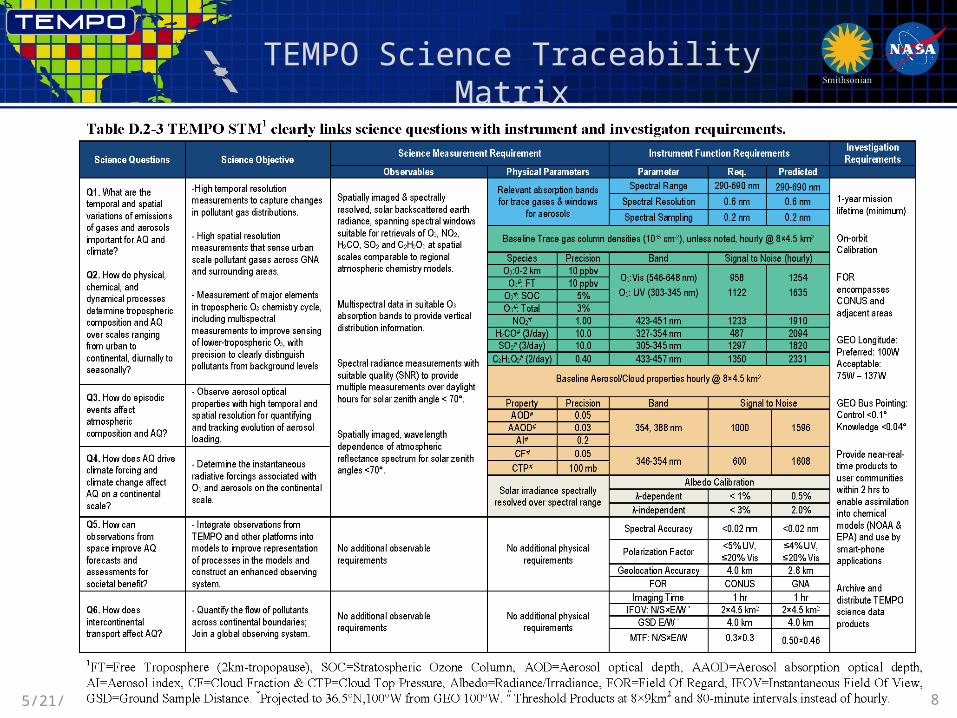
TEMPO Science Traceability Matrix
5/21/13
9
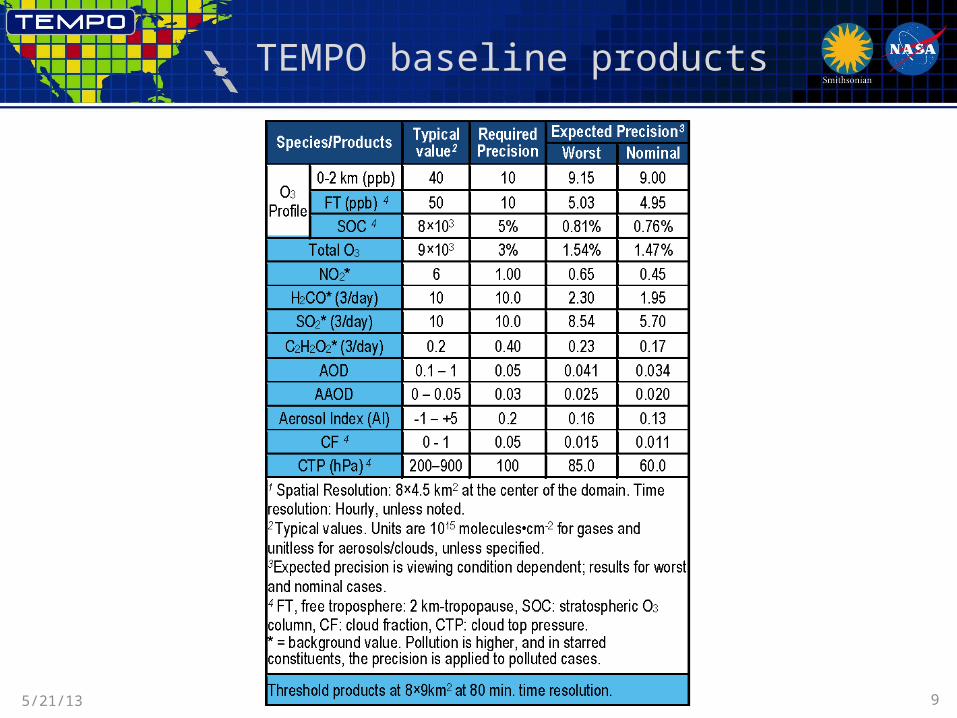
TEMPO baseline products
5/21/13
10
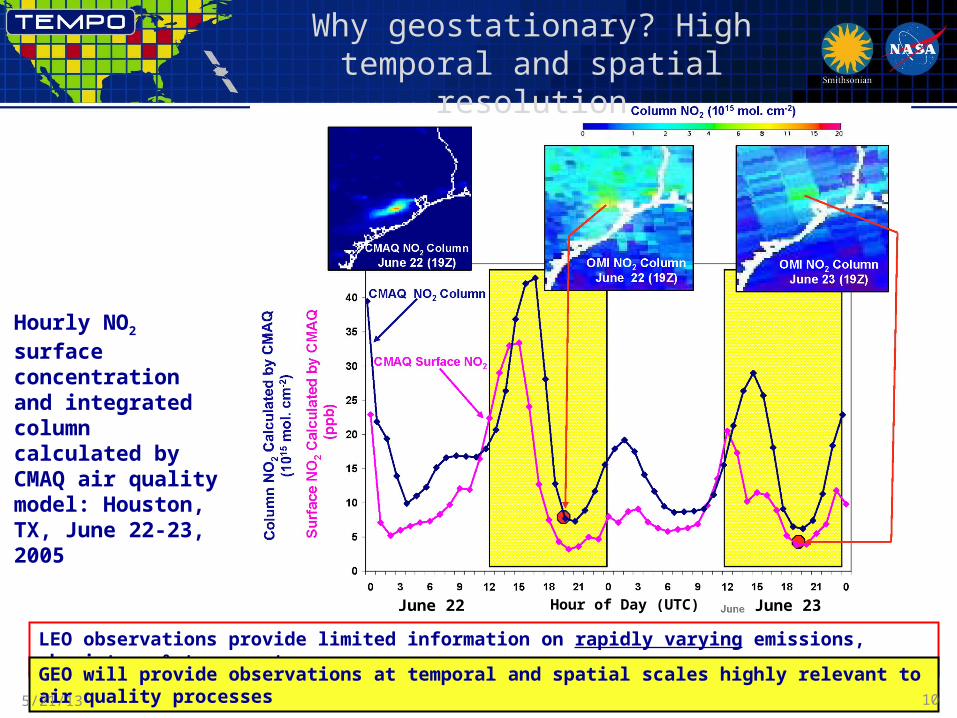
Why geostationary? High temporal and spatial resolution
Hourly NO2 surface concentration and integrated column calculated by CMAQ air quality model: Houston, TX, June 22-23, 2005
June 22 Hour of Day (UTC) June 23
LEO observations provide limited information on rapidly varying emissions, chemistry, & transport
GEO will provide observations at temporal and spatial scales highly relevant to air quality processes5/21/13

11
TEMPO instrument concept
Measurement techniqueImaging grating spectrometer measuring solar backscattered Earth radiance Spectral band & resolution: 290-690 nm @ 0.6 nm FWHM, 0.2 nm sampling2-D, 2k×2k, detector images the full spectral range for each geospatial scene
Field of Regard (FOR) and duty cycleMexico City to the Canadian tar/oil sands, Atlantic to PacificInstrument slit aligned N/S and swept across the FOR in the E/W direction, producing a radiance map of Greater North America in one hour
Spatial resolution2 km N/S × 4.5 km E/W native pixel resolution (9 km2)Co-add/cloud clear as needed for specific data products
Standard data products and sampling ratesNO2, O3, aerosol, and cloud products sampled hourly, including eXceL O3 for selected target areasH2CO, C2H2O2, SO2 sampled 3 times/day (hourly samples averaged to get S/N)Product spatial resolution ≤ 8 km N/S × 4.5 km E/W at center of domainMeasurement requirements met up to 70o SZA for NO2, 50o for other standard products
5/21/13
12
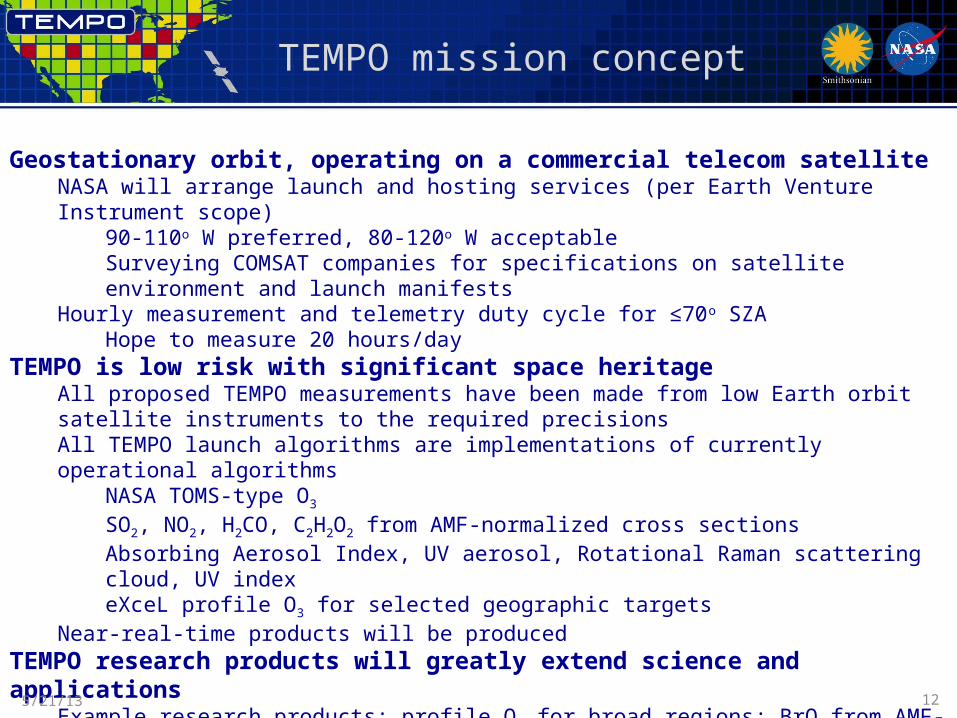
TEMPO mission concept
Geostationary orbit, operating on a commercial telecom satelliteNASA will arrange launch and hosting services (per Earth Venture Instrument scope)
90-110o W preferred, 80-120o W acceptableSurveying COMSAT companies for specifications on satellite environment and launch manifests
Hourly measurement and telemetry duty cycle for ≤70o SZAHope to measure 20 hours/day
TEMPO is low risk with significant space heritageAll proposed TEMPO measurements have been made from low Earth orbit satellite instruments to the required precisionsAll TEMPO launch algorithms are implementations of currently operational algorithms
NASA TOMS-type O3
SO2, NO2, H2CO, C2H2O2 from AMF-normalized cross sectionsAbsorbing Aerosol Index, UV aerosol, Rotational Raman scattering cloud, UV indexeXceL profile O3 for selected geographic targets
Near-real-time products will be producedTEMPO research products will greatly extend science and applications
Example research products: profile O3 for broad regions; BrO from AMF-normalized cross sections; height-resolved SO2; additional cloud/aerosol products; vegetation productsExample higher-level products: pollution/AQ indices from standard products, city light maps
5/21/13
13
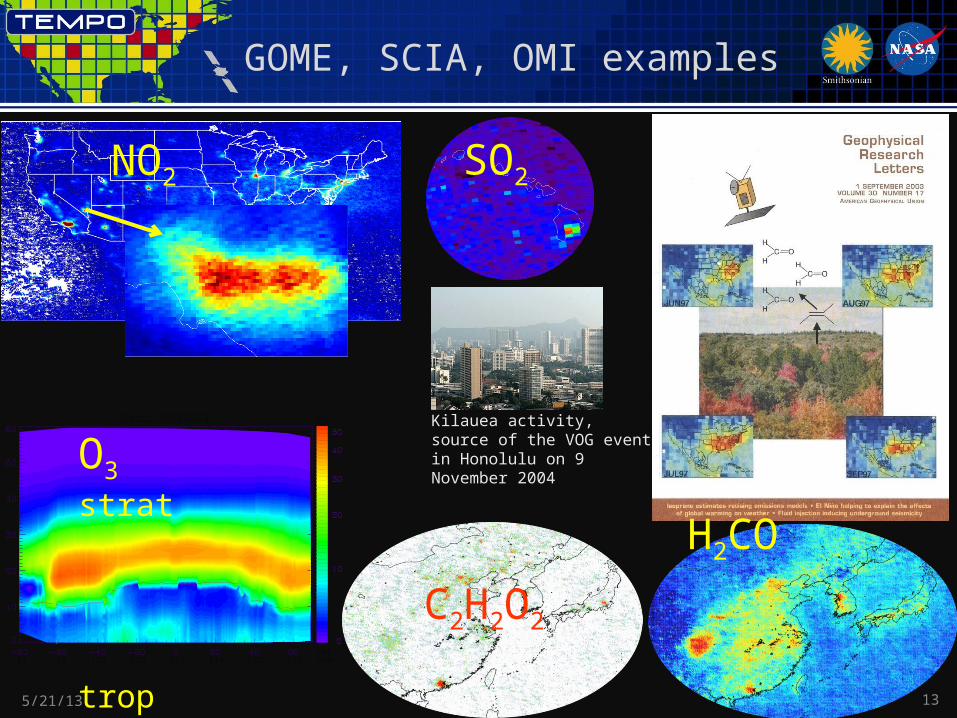
GOME, SCIA, OMI examples
5/21/13
Kilauea activity, source of the VOG event in Honolulu on 9 November 2004
NO2
O3 strat
trop
SO2
C2H2O2
H2CO

14
NO2 over Los Angeles
5/21/13

15
Washington, DC coverage
5/21/13
Hourly!

16
Mexico City coverage
5/21/13
¡Cad
a hora
!

17
TEMPO Sensor Operations
5/21/13
Measurement modes for the TEMPO sensor operation change with the solar illumination of the Earth scene. Frame co-adding at a single position boosts sensitivity to atmospheric constituents. Special measurements are made by adjusting the dwell time and the scanning start and stop longitudes.

18
The End!
5/21/13

19
TEMPO launch algorithms
NO2, SO2, H2CO, C2H2O2 vertical columnsDirect fitting to TEMPO radiances
AMF-corrected reference spectra, Ring effect, etc.DOAS option available to trade more speed for less accuracy, if necessaryResearch products could include H2O, BrO, OClO, IO
O3 profiles, tropospheric O3
eXceL optimal-estimation method developed @ SAO for GOME, OMIMay be extended to SO2, especially volcanic SO2
TOMS-type ozone retrieval included for heritage
Aerosol products from OMI heritage: AOD, AAOD, Aerosol IndexAdvanced/improved products likely developed @ GSFC, U. Nebraska
Cloud Products from OMI heritage: CF, CTPAdvanced/improved products likely developed @ GSFC
UVB research product based on OMI heritage
Nighttime research products include city lights
5/21/13
20
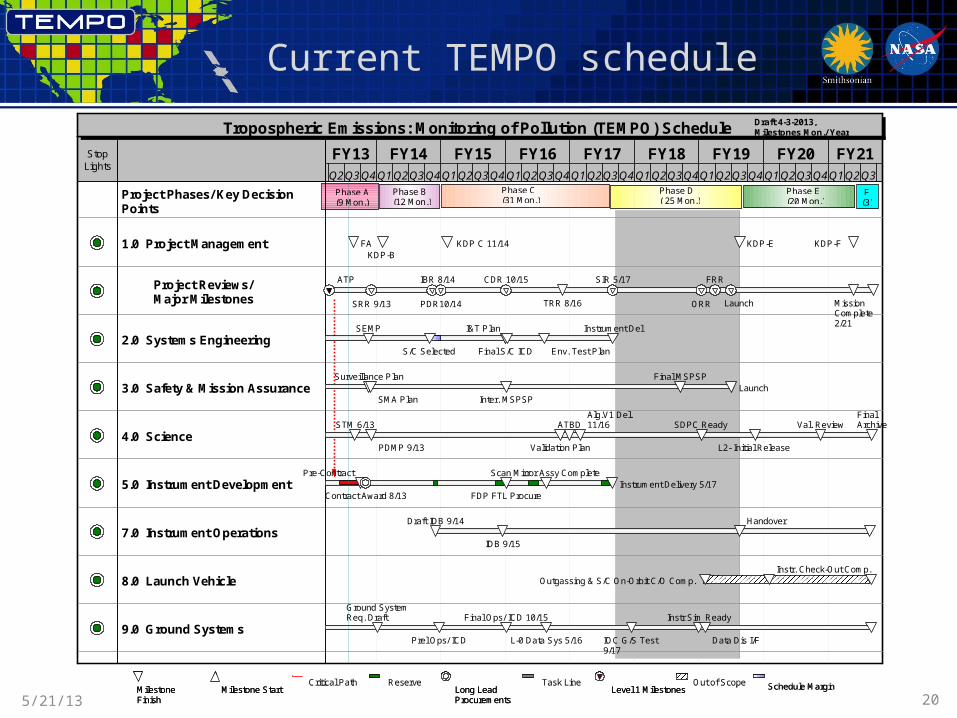
Current TEMPO schedule
5/21/13
FY13 FY14 FY15 FY16 FY17 FY18 FY19 FY20 FY21Q2Q3Q4Q1Q2Q3Q4Q1Q2Q3Q4Q1Q2Q3Q4Q1Q2Q3Q4Q1Q2Q3Q4Q1Q2Q3Q4Q1Q2Q3Q4Q1Q2Q3
Milestone Finish
Milestone Start Critical Path Reserve
Long Lead Procurements
Task Line Level 1 Milestones
Out of Scope Schedule Margin
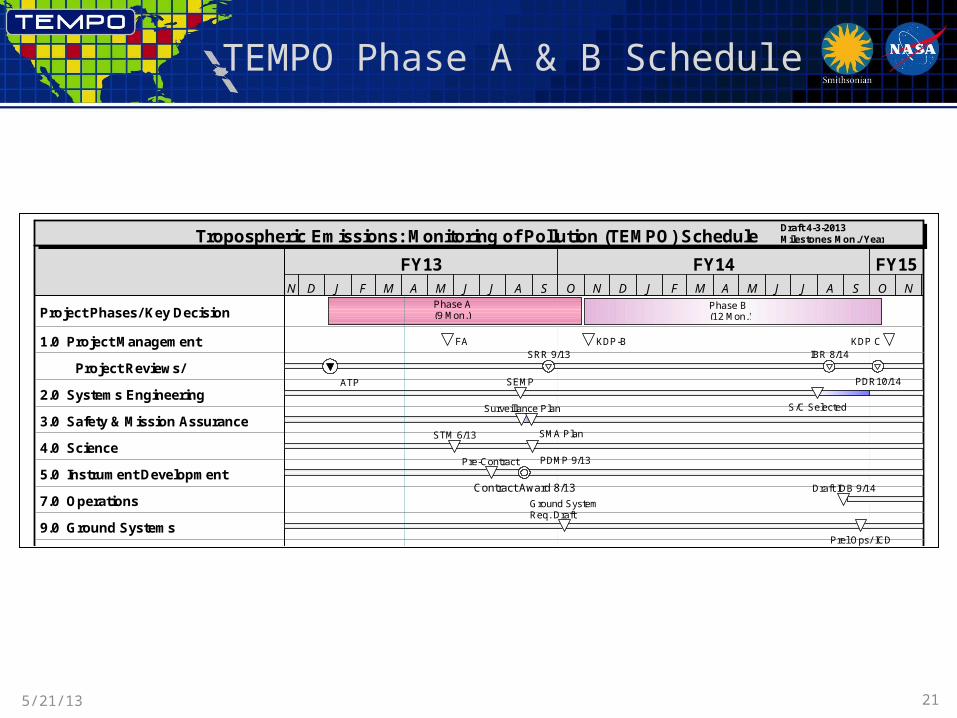
Tropospheric Emissions: Monitoring of Pollution (TEMPO) Schedule
StopLights
Project Phases/ Key Decision Points
1.0 Project Management
Project Reviews/Major Milestones
2.0 Systems Engineering
3.0 Safety & Mission Assurance
4.0 Science
5.0 Instrument Development
7.0 Instrument Operations
8.0 Launch Vehicle
9.0 Ground Systems
FAKDP-B
KDP C 11/14 KDP-E KDP-F
ATP
SRR 9/13
IBR 8/14
PDR10/14
CDR 10/15
TRR 8/16
SIR 5/17
ORR
FRR
Launch Mission Complete2/21
SEMP
S/C Selected Final S/C ICD
I&T Plan
Env. Test Plan
Instrument Del
Surveillance Plan
SMA Plan Inter. MSPSP
Final MSPSP Launch
STM 6/13
PDMP 9/13 Validation Plan
ATBDAlg.V1 Del.11/16 SDPC Ready
L2- Initial Release
Val. ReviewFinal Archive
Pre-Contract
Contract Award 8/13 FDP FTL Procure
Scan Mirror Assy Complete Instrument Delivery 5/17
Draft IDB 9/14
IDB 9/15
Handover
Outgassing & S/C On-Orbit C/O Comp. Instr. Check-Out Comp.
Ground SystemReq. Draft
Prel Ops/ ICD
Final Ops/ ICD 10/15
L-0 Data Sys 5/16 IOC G/S Test 9/17
Instr Sim Ready
Data Dis I/F
Milestone Finish
Milestone Start Critical Path Reserve
Long Lead Procurements
Task Line Level 1 Milestones
Out of Scope Schedule Margin
Phase A(9 Mon.)
Phase B(12 Mon.)
Phase C (31 Mon.)
Phase D( 25 Mon.)
Phase E(20 Mon.)
F(3)
Draft 4-3-2013,Milestones Mon./ Year
21
TEMPO Phase A & B Schedule
5/21/13
FY13 FY14 FY15N D J F M A M J J A S O N D J F M A M J J A S O N
Milestone Finish Milestone Start Slack/Float Critical Path Reserve Long Lead Procurements
Task Line Level 1 Milestones
Tropospheric Emissions: Monitoring of Pollution (TEMPO) Schedule
Project Phases/ Key Decision
1.0 Project Management
Project Reviews/
2.0 Systems Engineering
3.0 Safety & Mission Assurance
4.0 Science
5.0 Instrument Development
7.0 Operations
9.0 Ground Systems
FA KDP-B KDP C
ATP
SRR 9/13 IBR 8/14
PDR10/14SEMP
S/C SelectedSurveillance Plan
SMA PlanSTM 6/13
PDMP 9/13Pre-Contract
Contract Award 8/13 Draft IDB 9/14
Ground SystemReq. Draft
Prel Ops/ ICD
Milestone Finish Milestone Start Slack/Float Critical Path Reserve Long Lead Procurements
Task Line Level 1 Milestones
Phase A(9 Mon.)
Phase B(12 Mon.)
Draft 4-3-2013Milestones Mon./ Year
22
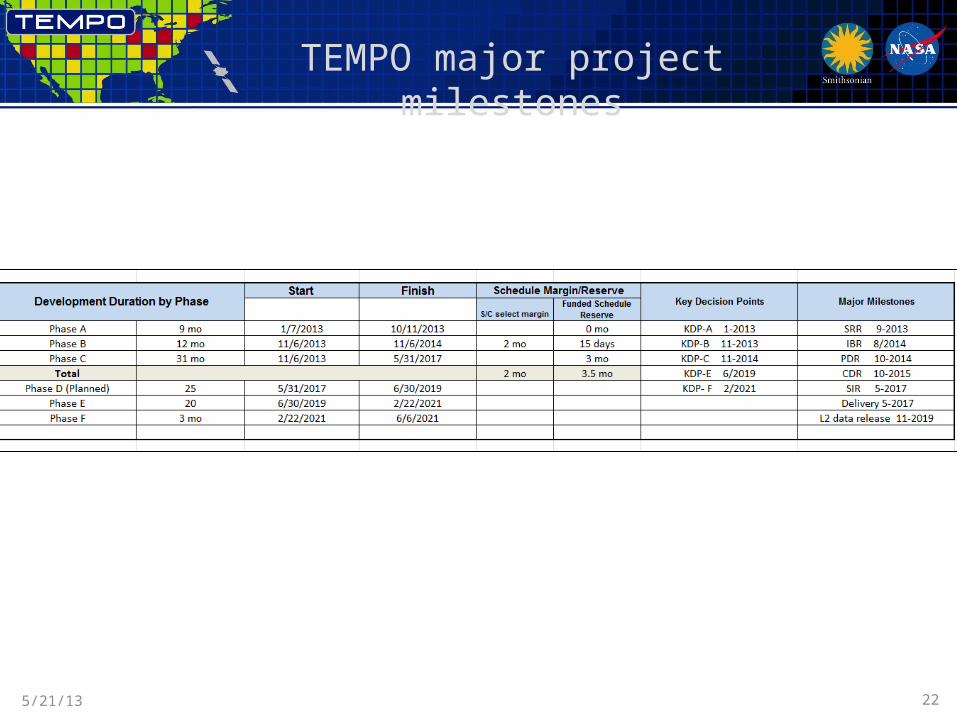
TEMPO major project milestones
5/21/13

TEMPO Organization
5/21/13 23
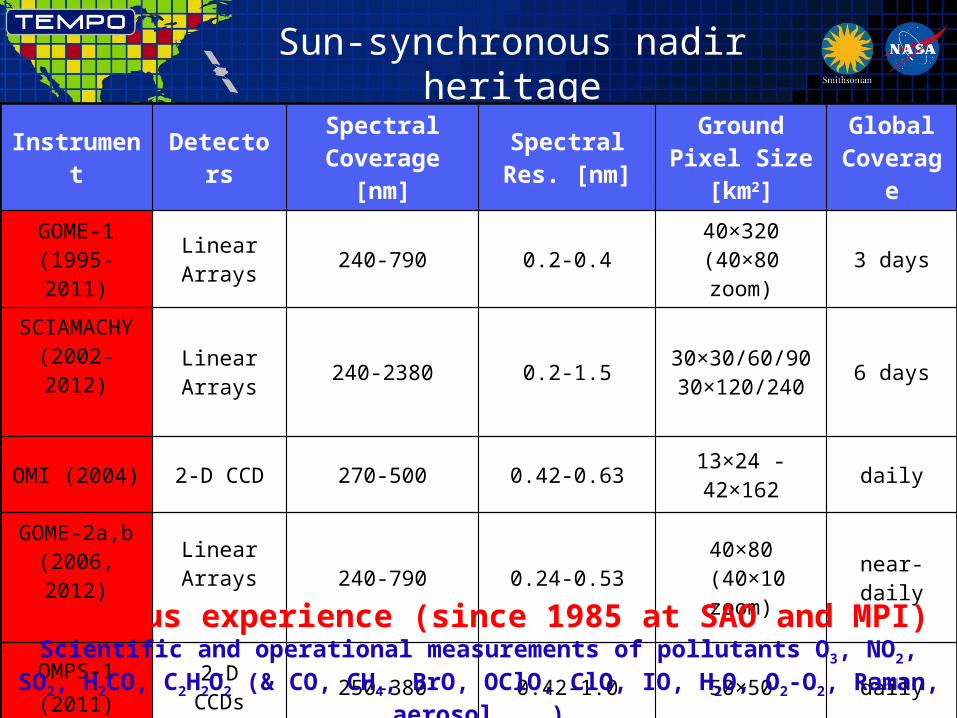
Sun-synchronous nadir heritage
5/21/13 24
Instrument DetectorsSpectral
Coverage [nm]Spectral Res.
[nm]Ground Pixel
Size [km2]Global
Coverage
GOME-1 (1995-2011)
Linear Arrays 240-790 0.2-0.4 40×320 (40×80
zoom) 3 days
SCIAMACHY (2002-2012) Linear
Arrays 240-2380 0.2-1.5 30×30/60/90 30×120/240 6 days
OMI (2004) 2-D CCD 270-500 0.42-0.63 13×24 - 42×162 daily
GOME-2a,b (2006, 2012)
Linear Arrays 240-790 0.24-0.53 40×80
(40×10 zoom) near-daily
OMPS-1(2011)
2-DCCDs 250-380 0.42-1.0 50×50 daily
Previous experience (since 1985 at SAO and MPI)Scientific and operational measurements of pollutants O3, NO2, SO2, H2CO, C2H2O2
(& CO, CH4, BrO, OClO, ClO, IO, H2O, O2-O2, Raman, aerosol, ….)
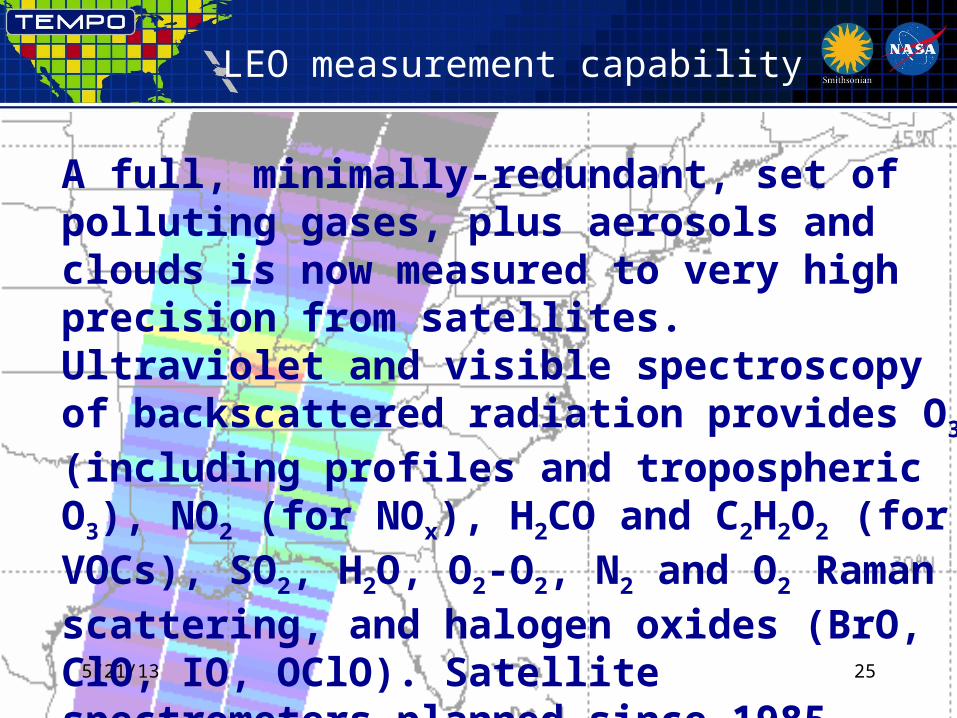
LEO measurement capability
5/21/13 25
A full, minimally-redundant, set of polluting gases, plus aerosols and clouds is now measured to very high precision from satellites. Ultraviolet and visible spectroscopy of backscattered radiation provides O3 (including profiles and tropospheric O3), NO2 (for NOx), H2CO and C2H2O2 (for VOCs), SO2, H2O, O2-O2, N2 and O2 Raman scattering, and halogen oxides (BrO, ClO, IO, OClO). Satellite spectrometers planned since 1985 began making these measurements in 1995.