tropical storm barry national hurricane center · no rt he astw ard wh ile barr y mov ed we st- no...
TRANSCRIPT

Tropical Cyclone ReportTropical Storm Barry
2-7 August 2001
Jack BevenNational Hurricane Center
22 April 2002
Barry was a strong tropical storm that caused minor damage in the western FloridaPanhandle.
a. Synoptic history
Barry formed from a tropical wave that moved westward from the coast of Africa on 24 July.The wave moved westward across the tropical Atlantic with little development until the 28 , whenth
convection started increasing just east of the Lesser Antilles. The system moved into the easternCaribbean Sea on 29 July accompanied by poorly organized thunderstorms and gusty winds.Convection continued increasing on 30-31 July as the wave moved west-northwestward through theCaribbean. It moved into the southeastern Gulf of Mexico on 1 August, accompanied by widespreadheavy rains over southern Florida and western Cuba.
A broad 1014 mb low formed along the wave near Dry Tortugas, Florida late on 1 August.The low moved northwestward and intensified. An Air Force Reserve Hurricane Hunter aircraftreached the center at 1829 UTC 2 August and found that the system had become Tropical StormBarry. A large area of tropical storm winds existed north and east of the center, primarily due tointeraction with a strong surface ridge. Post-analysis suggests that the low had become a tropicaldepression about 6 h earlier approximately 175 n mi west-northwest of Key West, Florida (Figure1 and Table 1).
Barry may not have been fully tropical when it formed, because an upper level low was overthe surface center. However, southwesterly upper level flow moved the upper low movednortheastward while Barry moved west-northwestward due to the ridge over the United States. Thisshear, combined with falling external surface pressures as the ridge weakened, caused it to weakento a depression early on 4 August. Barry then remained in a generally unfavorable environment untilearly on the 5 . The weakening ridge caused the steering currents to collapse, and Barry slowed toth
a west-southwestward drift on the 3 . This was followed by a general northeastward drift on the 4 .rd th
Flow around a mid/upper level low dropping southward into the western Gulf states causedBarry to turn northward and accelerate on 5 August. Concentrated convection formed near the centerearly that day and this led to another significant burst of intensification. The central pressure fellfrom 1004 mb to 990 mb in 7 h as the organization of the system improved dramatically in satelliteand radar imagery. Although the strengthening was short-lived, it made Barry a 60 kt cyclone. Thisintensity was maintained through landfall near Santa Rosa Beach, FL at 0500 UTC 6 August. Figure2 is a reflectivity image from the Eglin Air Force Base (AFB) radar an hour before landfall showingthat Barry was forming an eye and had strong convection in the northern eyewall.

The cyclone turned northwestward and weakened rapidly after landfall. It became a tropicaldepression over southern Alabama later on the 6 and further weakened to a low pressure area nearth
Memphis, TN the next day. The remnant low dissipated over southeastern Missouri on the 8th.
b. Meteorological statistics
Table 1 shows the best track positions and intensities for Barry, with the track plotted inFigure 1. Figures 3 and 4 depict the curves of minimum central sea-level pressure and maximumsustained one-minute average “surface” (10 m above ground level) winds, respectively, as functionsof time. These figures also contain the data on which the curves are based: aircraft reconnaissanceand dropsonde data from the Air Force Reserve Hurricane Hunters, satellite-based Dvorak techniqueintensity estimates from the Tropical Analysis and Forecast Branch (TAFB), the Satellite AnalysisBranch (SAB) of the National Environmental Satellite Data and Information Service (NESDIS), andthe Air Force Weather Agency, and estimates from synoptic data.
The Air Force Reserve Hurricane Hunters made 35 center “fixes” during Barry. Themaximum flight level winds reported by the aircraft were 71 kt just after the center made landfall.Additionally, an eyewall dropsonde measured 61 kt surface winds at 1847 UTC on the 5 . Theth
maximum surface winds reported by an official land station were 42 kt with gusts to 69 kt at stationC-72 of the Eglin AFB mesonet. Additional selected surface observations from official stations areincluded in Table 2.
Shortly after landfall, an unofficial observation from Seagrove Beach, FL reported a 3-minuteaverage wind of 82 kt with gusts to 93 kt. This and the 71 kt flight-level wind suggested thepossibility that Barry had reached hurricane strength just as it was making landfall. No officialobservations supported the Seagrove Beach data, so several efforts were made to verify its validity:
First, personnel from the NWS Forecast Office in Mobile, AL investigated the SeagroveBeach report. They indicate that the wind damage in the area was far less than what would beexpected for the reported winds. This casts some doubt as to the accuracy of the data.
Second, additional analysis was conducted by the Hurricane Research Division using theHWIND system on the aircraft and surface data. The analysis yielded a maximum sustained windat landfall of 62 kt.
Third, the WSR-88D radar at Eglin Air Force Base indicated hurricane-force winds about1500 ft above the surface as Barry approached the coast. Unfortunately, the radar failed about anhour before landfall, and it is unknown how these winds evolved as the center reached the coast. TheNational Hurricane Center (NHC) conducted post-analysis of the radar wind data using someexperimental algorithms. This was inconclusive as to whether the hurricane-force winds aloftreached the surface.
Fourth, the NHC sent a request to the public asking for additional observations from thelandfall area. Over 30 supplemental reports were received, with the most significant and usefulincluded in Table 3. Several of the wind reports were in the 60-65 kt range with higher gusts, which

supports Barry being right on the threshold of a hurricane. However, the quality of this data isuncertain due to the mostly unknown accuracy and exposure of the instruments.
The lowest aircraft-measured pressure was 990 mb at 1154 UTC 5 August and again atlandfall. The lowest pressure from an official station was 994.2 mb from the Eglin AFB mesonet(Table 2). The supplemental data included a 988.5 mb pressure in Freeport, FL (Table 3), which waslikely in the eastern side of the eye. While this and a 989.1 mb observation in Destin were slightlylower than the landfall pressure reported by aircraft, the accuracy of these supplementalmeasurements is unknown. Therefore, the best track landfall pressure will be the 990 mb reportedby the aircraft.
Most of the much-appreciated supplemental wind and pressure data are consistent with thewind and pressure values the NHC determined from reconnaissance data. However, due to theuncertainties in the data quality, the data are not quite enough to justify calling Barry a hurricane atlandfall.
The core of Barry missed most ships and buoys. The most significant marine observationwas from buoy 42039, which reported 39 kt sustained winds with gusts to 54 kt and a 1001.5 mbpressure at 2000 UTC 5 August. An unidentified ship reported 30 kt winds with gusts to 50 kt overthe southeastern Gulf from 0200-1000 UTC 2 August. This, combined with data from the CoastalMarine Automated Network Station at the Dry Tortugas, provided evidence that the tropical wavewas developing into a tropical cyclone.
Storm surges and tides associated with Barry were 2-3 ft near the landfall area in Bay andWalton counties. Tides of 2-3 ft above normal also occurred along portions of the southeastLouisiana coast in association with the strong winds early in Barry’s life.
Storm total rainfalls were generally 5-9 inches over the Florida Panhandle near and east ofwhere the center made landfall with 1-4 inches elsewhere in the affected area from southwesternGeorgia to northern Mississippi. The maximum amount from an official station was 8.91 inches atTallahassee, FL. Supplemental observations included 11.00 inches at WJHG-TV in Panama City,FL and 9.57 inches at Port St. Joe, Fl. These rains caused localized flooding. The pre-Barry tropicalwave produced 3 to 8 inches of rain over portions of southern Florida with local amounts as high as13 inches in Martin County. These rains helped relieve long-term drought conditions in southFlorida.
One tornado has been confirmed in association with Barry - an F0 near Carrabelle, FL. Thepre-Barry wave produced F0 tornadoes near Ft. Pierce and Boynton Beach, FL. All three tornadoescaused minor damage.
c. Casualty and Damage Statistics
Two deaths are directly associated with Barry: one due to a lightning strike in an outer bandnear Jacksonville, FL and one drowning in a rip current at Sanibel Island, FL. One indirect deathoccurred in a traffic accident during rains associated with the storm. Additionally, as the pre-Barry

wave moved over Cuba and the Straits of Florida, associated winds and seas capsized a boat withCuban refugees on board. Press reports indicated that 6 of the 28 passengers drowned.
The American Insurance Services Group estimates insured property damage from Barry tobe $15 million. Applying a 2:1 ratio of total damage to insured damage, the total damage from Barryis estimated to be $30 million.
d. Forecast and warning critique
Table 4 shows the average errors during the tropical storm stage of Barry for the official NHCtrack forecast and a selection of objective guidance models. The NHC errors were 31 (8 forecasts),49 (5 forecasts), 105 (4 forecasts), 156 (5 forecasts), and 244 n mi (3 forecasts) for 12, 24, 36, 48,and 72 h respectively. The average errors were better than the 10-yr (1991-2000) average at 12, 24,and 36 h and worse than both the 10-yr average and Climatology-Persistence (CLIPER) at 48 and72 hr. Several of the objective guidance models had better average errors than the official forecasts.The most notable was the Aviation model (AVNO), which was the overall best performer on Barry.
Analysis of the individual official track forecasts indicates there was a significant westwardbias. This resulted from the belief that the strong deep layer ridge over the central United Stateswould hold and move Barry westward, possibly with a landfall in Louisiana. Several later forecastsbetter anticipated the strength of the Gulf coast trough and correctly forecast landfall in the FloridaPanhandle.
The official intensity forecast errors were 7, 11, 9, 13, and 7 kt at 12, 24, 36, 48, and 72 hrespectively. These errors are near the 10-yr average at 12 and 24 h and below the 10-yr average atthe other times.
Table 5 shows the watches and warnings issued for Barry. Hurricane warnings were issuedfor portions of the northern Gulf coast in anticipation that Barry’s rapid strengthening on the 5th
would continue. These were somewhat short-fused with a lead time of about 16 hours. The earlyerroneous track forecasts led to watches and warnings along portions of the Louisiana andMississippi coasts that did not verify.
Barry was forecast to become an inland flooding threat after landfall. However, a faster thanexpected motion and weakening led to inland rainfall totals being less than anticipated.
Acknowledgments:
Much of the data in this report were provided by the local National Weather Service forecastoffices in Slidell, LA, Mobile, AL, and Tallahasee, FL. Buoy and C-MAN station data were providedby the National Data Buoy Center. Many of the supplemental observations were forwarded to theNHC by Jason Kelley of TV station WJHG in Panama City, FL. Rich Henning of the HurricaneHunters and Eglin Air Force Base contributed other supplemental observations as well as the Eglinradar data. Bill Frederick contributed the forecast verification data, and Colin McAdie analyzed theradar data.


Table 1. Best track, Tropical Storm Barry, 2 - 7 August 2001
Date/Time(UTC)
Latitude(°N)
Longitude(°W)
Pressure(mb)
WindSpeed(kt)
Stage
02 / 1200 25.7 84.8 1011 30 tropical depression
02 / 1800 26.2 84.9 1010 45 tropical storm
03 / 0000 26.4 85.6 1007 40 "
03 / 0600 26.6 86.3 1008 35 "
03 / 1200 26.9 87.0 1007 35 "
03 / 1800 26.8 87.2 1007 35 "
04 / 0000 26.7 87.5 1005 30 tropical depression
04 / 0600 26.6 87.8 1005 30 "
04 / 1200 26.9 87.7 1006 30 "
04 / 1800 27.1 87.5 1005 35 tropical storm
05 / 0000 27.3 87.3 1003 35 "
05 / 0600 27.5 86.7 1004 40 "
05 / 1200 28.1 86.4 990 50 "
05 / 1800 28.6 86.4 991 60 "
06 / 0000 29.5 86.3 992 60 "
06 / 0600 30.6 86.4 991 60 "
06 / 1200 31.8 86.9 1007 25 tropical depression
06 / 1800 32.7 87.7 1009 20 "
07 / 0000 33.3 88.5 1012 15 "
07 / 0600 34.0 89.1 1015 15 remnant low
07 / 1200 34.7 89.7 1017 10 "
07 / 1800 35.6 89.8 1018 10 "
08 / 0000 36.6 89.9 1016 10 "
08 / 0600 37.5 90.0 1017 10 "
08 / 1200 dissipated
05 / 1200 28.1 86.4 990 50 minimum pressure
Landfall:
06 / 0500 30.4 86.3 990 60 Santa Rosa Beach, Florida

Table 2.Tropical Storm Barry selected surface observations, 2-7 August 2001.
Location Pres.
(mb)
Date/
Time
(UTC)
Sust.
Wind
(kts)a
Peak
Gust
(kts)
Date/
Time
(UTC)b
Storm
Surge
(ft)c
Storm
Tide
(ft)d
Total
Rain
(in)
Alabama
Dothan 1013.6 06/0736 21 26 06/0940 1.22
Evergreen 1006.1 06/1032 20 28 05/1739 1.23
Fort Rucker 3.50
Maxwell AFB 3.21
Troy 4.05
Florida
Apalachicola 1011.9 06/0019 27 41 06/0739 6.40
Destin 999.3 06/0449 31 42 06/0421#
Crestview 996.6 06/0656 31 44 06/0603 2.18
Eglin A-5 28 39 06/0450
Eglin C-52 994.2 06/0541 27 52 06/0525
Eglin C-72 995.6 06/0613 42 69 06/0535
Mary Esther 1005.6 06/0555 24 42 06/0455 0.71
Panama City Bay Cnty. Aprt. 1008.1 06/0141 26 35 06/0440 5.19
Panama City Tyndall AFB 1009.8 06/0255 25 42 05/2350 8.68
Tallahassee 1013.5 06/0701 20 26 06/0222 8.91
Valparaiso 998.6 06/5555 35 55 06/0655 3.92e e
NOAA Buoys and C-MAN Stations
Buoy 42003 1009.7 04/1000 30 39 05/1400$
Buoy 42036 1011.6 05/0800 29 37 02/2000
Buoy 42039 1001.5 05/2000 39 54 05/2000
Cape San Blas FL (CSBF1) 1009.8 06/0000 35 44 30/1400$
Standard NWS ASOS and C-MAN averaging period is 2 min; buoys Date/time is for sustained wind when botha b
are 8 min. Eglin AFB sites are also 2 min averages sustained and gust are listed.Storm surge is water height above normal astronomical tide level. Storm tide is water height above NGVD. c d
Estimated. 10 min average e $
Incomplete record #

Table 3.Tropical Storm Barry supplemental unofficial surface observations, 2-7 August 2001.
Location Pres.
(mb)
Date/
Time
(UTC)
Sust.
Wind
(kts)
Peak
Gust
(kts)
Date/
Time
(UTC)b
Total
Rain
(in)
Alabama
Andalusia 3.12
Florala 3.48
Red Level 1003.0 06/0930 34 06/0818 3.00
Florida
Callaway 7.78
Crestview (Davidson HS) 998.3 06/0824 35 06/0724
DeFuniak Springs 997.9 06/0630 4.60
Destin 989.1 62 69f
Destin 5-10 E 48 63 06/0440
Destin AW S 1004.1 06/0435 40 06/0500
Destin Harbor 65 75 06/0500a
Fort W alton Beach
(Choctawhatchee HS)1002.7 35 06/0613
Freeport 988.5 06/0440
Hiland Park 1007.8 5.45
Lynn Haven 7.80
Mary Esther 3 SSW HRT 5.20
Miramar Beach 991.8 06/0503 57 73
Niceville 57 06/0440
Panama City Bay HS 6.53
Panama City The Cove 9.56
Panama City W JHG-TV 11.00
Phillips Inlet 64 4.05d
Port St. Joe 9.57
Santa Rosa Beach 70 06/0426
Seagrove Beach 82 93 06/0450c
St. Andrews State Park 991.8 63 06/0310a c
St. George Island 4.48
W asuau 3 E 8.80
Sailboat, likely with non-standard anemometer elevation. Date/time is for sustained wind when botha b
sustained and gust are listed. 3 minute average. 1 minute average.c d
4 minute average. f

Table 4. Preliminary track forecast evaluation for Tropical Storm Barry - heterogeneous sample. Errors in nauticalmiles for tropical storm and hurricane stages with number of forecasts in parentheses. Numbers in bold representforecasts which were better than the official forecast.
Forecast Technique Period (hours)
12 24 36 48 72
CLIP 42 (8) 76 (5) 109 (4) 148 (5) 171 (3)
GFDI 24 (8) 55 (5) 140 (4) 234 (5) 369 (5)
GFDL*30 (8) 44 (5) 122 (4) 200 (5) 273 (3)
LBAR 40 (8) 84 (5) 168 (4) 194 (5) 293 (3)
VBRI 45 (8) 118 (5) 162 (4) 161 (5)*149 (3)
VBAR 29 (6) 58 (4) 148 (4) 184 (4) 163 (2)
AVNI 26 (7) 30 (4) 73 (4) 74 (4) 86 (2)
AVNO *29 (8) 18 (5) 37 (4) 71 (5) 98 (3)
BAMD 31 (8) 63 (5) 134 (4) 170 (5) 255 (3)
BAMM 32 (8) 73 (5) 146 (4) 174 (5) 281 (3)
BAMS 36 (8) 79 (5) 166 (4) 222 (5) 358 (3)
NGPI 38 (8) 62 (5) 124 (4) 179 (5) 320 (3)*
NGPS 36 (3) 63 (1) 117 (1) 179 (2) 356 (1)
UKMI 30 (6) 35 (3) 58 (3) 107 (2) 98 (1)
UKM 31 (3)*39 (1) 58 (1) 82 (2) 99 (1)
A98E 39 (8) 46 (5) 63 (4) 92 (5) 136 (3)
A9UK 34 (3) 16 (1) 112 (1) 98 (2) 99 (1)
GUNS 24 (6) 34 (3) 95 (3) 183 (2) 221 (1)
GUNA 19 (6) 32 (3) 70 (3) 136 (2) 160 (1)
NHC Official 31 (8) 49 (5) 105 (4) 156 (5) 244 (3)
NHC Official 10-Year
Average (1991-2000)
44 (2049) 82 (1835) 118 (1646) 151 (1475) 225 (1187)
Output from these models was unavailable at time of forecast issuance.*
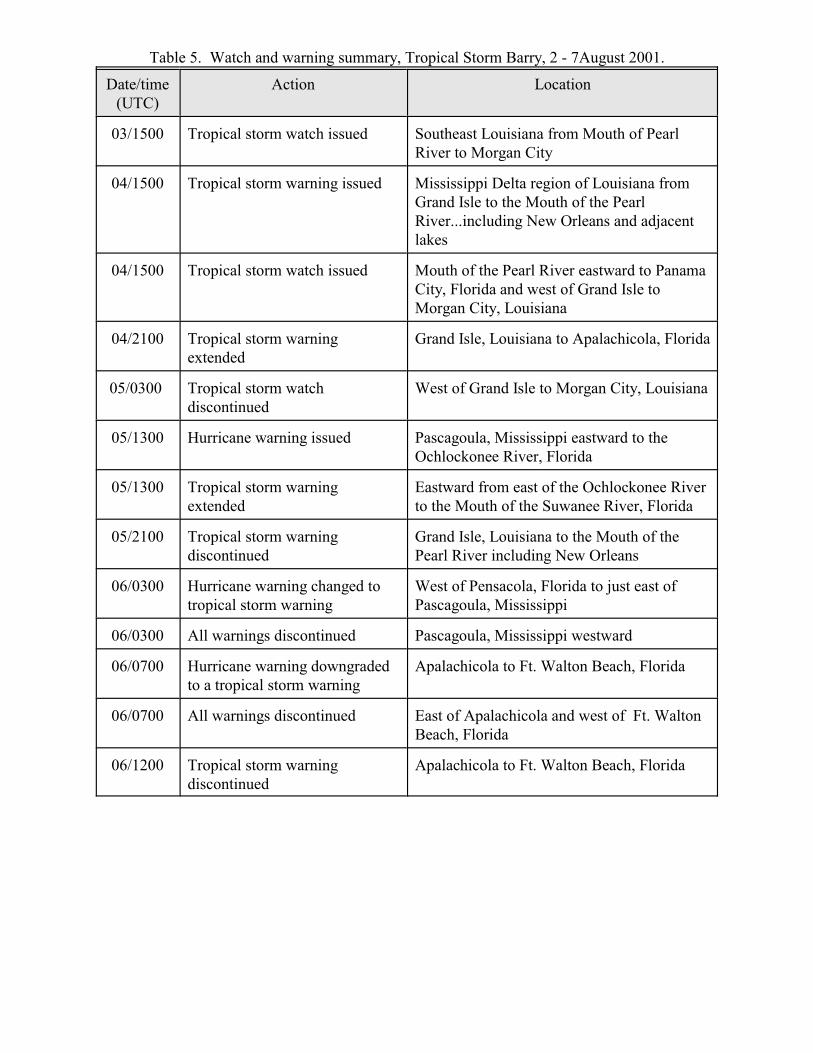
Table 5. Watch and warning summary, Tropical Storm Barry, 2 - 7August 2001.
Date/time(UTC)
Action Location
03/1500 Tropical storm watch issued Southeast Louisiana from Mouth of PearlRiver to Morgan City
04/1500 Tropical storm warning issued Mississippi Delta region of Louisiana fromGrand Isle to the Mouth of the PearlRiver...including New Orleans and adjacentlakes
04/1500 Tropical storm watch issued Mouth of the Pearl River eastward to PanamaCity, Florida and west of Grand Isle toMorgan City, Louisiana
04/2100 Tropical storm warningextended
Grand Isle, Louisiana to Apalachicola, Florida
05/0300 Tropical storm watchdiscontinued
West of Grand Isle to Morgan City, Louisiana
05/1300 Hurricane warning issued Pascagoula, Mississippi eastward to theOchlockonee River, Florida
05/1300 Tropical storm warningextended
Eastward from east of the Ochlockonee Riverto the Mouth of the Suwanee River, Florida
05/2100 Tropical storm warningdiscontinued
Grand Isle, Louisiana to the Mouth of thePearl River including New Orleans
06/0300 Hurricane warning changed totropical storm warning
West of Pensacola, Florida to just east ofPascagoula, Mississippi
06/0300 All warnings discontinued Pascagoula, Mississippi westward
06/0700 Hurricane warning downgradedto a tropical storm warning
Apalachicola to Ft. Walton Beach, Florida
06/0700 All warnings discontinued East of Apalachicola and west of Ft. WaltonBeach, Florida
06/1200 Tropical storm warningdiscontinued
Apalachicola to Ft. Walton Beach, Florida

Figure 1. Best track of Tropical Storm Barry, 2-7 August 2001

Figure 2. Eglin Air Force Base WSR-88D reflectivity image of Barry at 0354 UTC 6 August2001.

Figure 3. Best track minimum central pressure curve for Tropical Storm Barry, 2 - 7 August2001.

Figure 4. Best track maximum sustained surface wind speed curve for Tropical Storm Barry,2-7 Aug. 2001, and the observations on which the best track curve is based. Aircraft observationshave been adjusted for elevation using 90%, 80%, and 80% reduction factors for observations from700 mb, 850 mb, and 1500 ft, respectively. Dropwindsonde observations include actual 10 m winds(sfc), as well as surface estimates derived from the mean wind over the lowest 150 m of the windsounding (LLM), and from the sounding boundary layer mean (MBL).