tropical council illustrative financial statements
TRANSCRIPT

New requirements
Commentary
Formulas (Microsoft Excel version)
Provisional / Early advice
Key to colour coding
These financial statements are illustrative only and there is no obligation for local
governments to prepare financial statements in this format.
There are many ways councils can prepare financial statements which comply with the
legislative requirements and these cannot all be demonstrated in the Tropical Council
model.
Councils' financial statements should reflect each individual council's circumstances and
operational characteristics. Councils are encouraged to review the materiality of
disclosures with a view to simplifying financial statements.
Tropical Council
Illustrative Financial Statements for the year ended 30 June 2018
Version 1B
Thursday, 17 May 2018

Tropical Council
Financial statementsFor the year ended 30 June 2018
ForewordThe Tropical Council illustrative financial statements (Tropical) are produced by the Department of Local Government, Racing and
Multicultural Affairs (the Department) to assist accounting practitioners in Queensland local government to prepare financial statements
which comply with the requirements of Australian Accounting Standards and relevant legislation.
Councils should note that:
Tropical is for GUIDANCE ONLY and is not mandatory. It should be amended to reflect an individual council's circumstances and
operational characteristics.
Tropical does not cover every possible accounting scenario and instead provides example disclosures of transactions typically encountered
by councils.
Councils are responsible for ensuring that their financial statements comply with relevant legislation including Australian Accounting
Standards.
When determining what information to disclose in financial statements, councils should consider reliability, relevance and understandability
to users of the financial statements.
When determining whether a particular disclosure or accounting treatment should be undertaken, councils should also consider materiality.
The term “material” is defined in AASB 101 Presentation of Financial Statements (AASB 101.7) and further guidance can be found in AASB
108: Accounting Policies, Changes in Accounting Estimates and Errors (AASB 108.5) and the Framework for the Preparation and
Presentation of Financial Statements (paragraph QC11).
Legislative framework for preparation of annual financial statements
The Local Government Act 2009 and Local Government Regulation 2012 (City of Brisbane Act 2010 and City of Brisbane Regulation 2012
for Brisbane City Council) apply to the preparation of financial statements for the 2017-18 financial year.
Section 176 of the Local Government Regulation 2012 (S168 of the City of Brisbane Regulation 2012 ) requires councils to prepare three
different financial statements as follows:
- a general purpose financial statement
- a current-year financial sustainability statement; and
- a long-term financial sustainability statement
All of these financial statements are illustrated in the Tropical Council illustrative financial statements.
Section 177 of the Local Government Regulation 2012 (S169 of the City of Brisbane Regulation 2012 ) requires councils to prepare general
purpose financial statements in accordance with Australian Accounting Standards, Statements of Accounting Concepts, Interpretations and
Framework for the Preparation and Presentation of Financial Statements.
Use and application of Tropical 2017-18
Application to all Queensland local governments
The Tropical Council illustrative financial statements for the year ended 30 June 2018 (Tropical) have been designed to cater for all
Queensland local governments.
Tropical usability features (Microsoft Excel Version only)
Arithmetic functionality and using Tropical as a data entry model
Tropical is not intended to be used as a model that will calculate and balance ALL amounts in a council's financial statements. Some
arithmetic functionality is included to help demonstrate the relationships of the numbers in Tropical and to assist councils who use the
model as a starting point to develop their own reporting format. Some additional calculations are required if using Tropical as a template for
producing a set of council statements e.g. completing the Statement of Cash Flows.
Calculated cells are shaded in pale yellow. This shading should be removed before publication by selecting each sheet and applying "No
Fill" to the whole sheet.
If using Tropical as a template, do NOT delete amounts that are not applicable, as this will also delete formulas in the model. Instead a
zero amount should be entered and the row should be hidden.
Commentary
Text which is shaded in blue provides commentary to assist in the preparation of the financial statements. Councils should NOT include
this information in their financial statements.

Tropical Council
Financial statementsFor the year ended 30 June 2018Source references
Each Tropical worksheet includes a column on the left which lists the source references. Councils should NOT include these references in
their financial statements.
Mandatory versus optional disclosures
Some disclosures in Tropical are not mandatory requirements but are instead additional disclosures which may enhance the relevance and
useability of the financial statements for users. These disclosures are marked as "Not mandatory" in the Source Reference column.
Councils should use their discretion as to whether these additional disclosures will add value.
Rounding
Figures in Tropical have not been rounded to the nearest $1000. Whether or not rounding occurs is at the discretion of each council and
will depend on the quantum of the amounts disclosed in the financial statements. Usually rounding will be more appropriate for larger
councils.
Additional statements and disclosures
An Appropriation Statement, Capital Funding Statement and Comparison of Actual to Budget are not recognised as components of a
complete set of financial statements as per AASB 101 Presentation of Financial Statements nor are they required to be provided under
legislation. For this reason examples of these reports have not been included in Tropical. If councils intend to include this information in
their financial reports then it should only be included by way of note and suitable descriptions would need to be included to explain the basis
for preparation of these additional disclosures.
Signing of official certificate and presentation of financial statements for auditing
The financial statements given to the Auditor-General must be accompanied by a management certificate in the approved form. The
certificate is given by the Mayor and CEO, stating that in their opinion, the financial statements have been prepared in accordance with the
prescribed requirements and present a true and fair view of the Council's transactions for the financial year and financial position at the end
of the year.
The legislation also requires certificates to be given to the Auditor-General, in the approved form, certifying that the current-year financial
sustainability statement and the long-term financial sustainability statements have been accurately calculated. Tropical includes a copy of
these forms.
The long-term financial sustainability statement must be given to the Auditor-General for information purposes. The Local Government
Regulation 2012 (City of Brisbane Regulation 2012 ) does not require this statement to be audited.
Other resourcesLegislation can be viewed at www.legislation.qld.gov.au
Australian Accounting Standards can be viewed at www.aasb.com.au
Departmental local government Bulletins on a range of accounting issues can be viewed at http://www.dilgp.qld.gov.au/about-ilgp/news-
media-and-events/local-government-bulletins.html
FeedbackAll feedback and comments are welcomed. Please provide comments to:
Department of Local Government, Racing and Multicultural Affairs
Finance and Funding
PO Box 15009 City East Qld 4002 Australia
Phone: 07 3452 6721 (Samantha Cieslar)

The reader may not have accounting knowledge so use plain english language where possible.
This will enable the reader to view all the information required to interpret that note in the one place.
Financial statements
Tropical Council
For the year ended 30 June 2018
Simplification checklist
Amendments to AASB 101 Presentation of Financial Statements now apply that seek to improve financial reporting. As a
result, the standard now provides flexibility in the ordering of notes, the location of significant accounting policies within
those notes and also emphasises only including material note disclosures.
1. Have notes and note references that are not material been removed?
2. Have policy notes been co-located with the relevant note disclosure?
3. Is the information presented in plain english?
4. Does the note present council's policy position or simply repeat the standard's requirements?
The following checklist may assist councils to improve the readability of the financial statements through applying this new
flexibility:
These illustrative statements contain many notes that may not be material for your council. They can be removed from
your council's financial statements.

Tropical Council
Financial statements For the year ended 30 June 2018
Statement of Comprehensive Income
Statement of Financial Position
Statement of Changes in Equity
Statement of Cash Flows
Notes to the financial statements
1 Significant accounting policies
2 Analysis of results by function
3 Revenue
4 Grants, subsidies, contributions and donations
5 Capital income
6 Employee benefits
7 Materials and services
8 Finance costs
9 Depreciation and amortisation
10 Capital expenses
11 Cash and cash equivalents
12 Receivables
13 Inventories
14 Other financial assets
15 Non-current assets held for sale
16 Investments
17 Investment property
18 Property, plant and equipment
19 Intangible assets
20 Payables
21 Borrowings
22 Finance leases
23 Provisions
24 Other liabilities
25 Asset revaluation surplus
26 Retained surplus/(deficiency)
27 Commitments for expenditure
28 Contingent liabilities
29 Superannuation - Regional Defined Benefit Fund
30 Operating lease income
31 Reconciliation of net result for the year to net cash inflow (outflow) from operating activities
32 Reconciliation of liabilities arising from finance activities
33 Correction of error
34 Changes in accounting policy
35 Events after the reporting period
36 Financial instruments and financial risk management
37 National Competition Policy
38 Controlled entities that have not been consolidated
39 Transactions with related parties
40 Tied grants by project
Management Certificate
Independent Auditor's Report (General Purpose Financial Statements)
Current Year Financial Sustainability Statement
Certificate of Accuracy - for the Current Year Financial Sustainability Statement
Independent Auditor's Report (Current Year Financial Sustainability Statement)
Unaudited Long Term Financial Sustainability Statement
Certificate of Accuracy - for the Long Term Financial Sustainability Statement
Table of contents
Note: the Following documents must be included in Council's Annual Report with the audited General Purpose
Financial Statements. Care must be taken to ensure that the financial statements, management certificate and
Independent Auditor's Report are presented together in the annual Report. Similiarly the Current-Year and Long-Term
Financial Sustainability Statements need to be accompanied by their respective Certificates of Accuracy and, in the
case of the Current-Year Financial Sustainability Statement, the Independent Auditor's Report on that statement.

Source Reference Tropical Council
Statement of Comprehensive Income
For the year ended 30 June 2018
Consolidated Council
2018 2017 2018 2017
Note $ $ $ $
AASB 101.85 Income
AASB 101.82(a) Revenue
Recurrent revenue
Rates, levies and charges 3(a) 7,481,626 7,303,037 7,481,626 7,303,037
Fees and charges 3(b) 2,301,193 2,064,321 501,193 564,321
Rental income 3(c) 10,400 10,400 10,400 10,400
AASB 118.35(b) Interest received 3(d) 301,446 285,595 350,046 336,895
AASB 118.35(b) Sales revenue 3(e) 640,000 530,000 640,000 530,000
AASB 101.82(c) Profit from investments 3(f) 54,286 36,571 54,286 36,571
ATSI councils - 40 Year Lease Other income 3(g) 988,776 973,714 1,091,450 1,080,914
Grants, subsidies, contributions and donations 4(a) 3,230,845 1,523,121 3,230,845 1,523,121
Financial Management
(Sustainability Guideline) 2013
15,008,572 12,726,759 13,359,846 11,385,259
Capital revenue
AASB 1004.18(a)
ATSI Council 40 year lease
Grants, subsidies, contributions and donations 4(b) 1,237,578 347,529 1,237,578 347,529
AASB 101.85 Other capital income 5 481,183 127,690 488,800 127,690
Total capital revenue 1,718,761 475,219 1,726,378 475,219
Total income 16,727,333 13,201,978 15,086,224 11,860,478
Expenses
Recurrent expenses
Employee benefits 6 (5,879,043) (5,194,161) (4,628,499) (4,294,161)
Materials and services 7 (5,305,461) (4,206,662) (4,985,460) (3,896,663)
AASB 101.82(b) Finance costs 8 (833,325) (1,039,951) (833,325) (1,039,951)
AASB 116.48 Depreciation and amortisation 9 (3,761,073) (3,994,983) (3,725,712) (3,961,631)
(15,778,902) (14,435,757) (14,172,996) (13,192,406)
Capital expenses 10 (2,374,723) (348,348) (2,374,723) (348,348)
Total expenses (18,153,625) (14,784,105) (16,547,719) (13,540,754)
AASB 101.81A(a) Net result (1,426,292) (1,582,127) (1,461,495) (1,680,276)
Other comprehensive income
AASB 101.82A(a) Items that will not be reclassified to net result
AASB 101.7
AASB 116. Aus 39.1, Aus 40.1
Increase / (decrease) in asset revaluation surplus 25 2,270,683 120,682 2,186,955 47,694
AASB 101.82A Share of Comprehensive Income of associates - - - -
AASB 101.82A(b) Items that may be subsequently reclassified to net result
Available-for-sale-financial assets - - - -
Current year gains/ (losses)
- - - -
Cash flow hedging
Current year gains/ (losses) - - - -
AASB101.94 - - - -
AASB 101.81A(b) Total other comprehensive income for the year 2,270,683 120,682 2,186,955 47,694
Total comprehensive income for the year 844,391 (1,461,445) 725,460 (1,632,582)
Not mandatory
AASB 101.7
AASB 101.81A(c)
AASB 101.10(b), 81A - 105
AASB 101.85 & 99
The above statement should be read in conjunction with the accompanying notes and Significant Accounting Policies.
AASB 101.7 & AASB 101.94
Reclassification to net result
Reclassification to net result
Distinction between capital and recurrent

Source Reference Tropical Council
Statement of Comprehensive Income
For the year ended 30 June 2018
AASB 101.10(b), 81A - 105
Financial Management
(sustainability) Guideline 2013
Discontinuing operations
AASB 101.82(ea)
AASB Framework.78 & 80
AASB Framework.74
-77
AASB 101
AASB 101.10
AASB 101.10A
AASB 101.82
Where council has discontinuing operations, the total profit or loss from discontinued operations also needs to be separately
disclosed in the Statement of Comprehensive Income.
Below are relevant extracts from AASB 101 with respect to the Statement of Comprehensive Income.
An entity may present a single statement of profit or loss and other comprehensive income, with profit or loss and other
comprehensive income presented in two sections. The sections shall be presented together, with the profit or loss section
presented first followed directly by the other comprehensive income section. An entity may present the profit or loss section in a
separate statement of profit or loss. If so, the separate statement of profit or loss shall immediately precede the statement
presenting comprehensive income, which shall begin with profit or loss.
Requirements of AASB 101
Where the net gain / loss on disposal is a gain, this amount should be reported in Income as a gain (separate to revenue).
The AASB Framework document (para 78 and 80) says that losses, including those arising on the disposal of non-current
assets, form part of expenses and should be disclosed as such. Therefore if council's net "gain/loss on disposal" is a loss, then
this should be disclosed under Expenses.
(ea) a single amount for the total of discontinued operations (see AASB 5).
(d) tax expense
(b) a Statement of Profit or Loss and Other Comprehensive Income for the period
(c) a Statement of Changes in Equity for the period
(d) a Statement of Cash Flows for the period
An entity may use titles for the statements other than those used in this Standard, For example, an entity may use the title
"statement of comprehensive income" instead of "statement of profit or loss and other comprehensive income"
(c) share of the profit or loss of associates and joint ventures accounted for using the equity method
(b) finance costs
(a) revenue
82 In addition to items required by other Australian Accounting Standards, the profit or loss section or the statement of profit or
loss shall include line items that present the following amounts for the period:
(ea) comparative information in respect of the preceding period as specified in paragraphs 38 and 38A; and
(f) a Statement of Financial Position as at the beginning of the preceding period when an entity applies an accounting policy
retrospectively or makes a retrospective restatement of items in its financial statements, or when it reclassifies items in its
financial statements.
Disclosure of gains and losses on disposal of assets
(e) notes, comprising a summary of significant accounting policies and other explanatory information
The Statement of Comprehensive Income includes separate categories for capital and recurrent income and expenses. The
concept of recurrent (or operating) versus capital has been used by many councils in the Queensland local government sector in
the past. However it is not required by local government legislation or Australian Accounting Standards.
A separation between capital and recurrent revenue and expenditure is suggested to assist in calculating the operating surplus
ratio as described in the the Financial Management (Sustainability) Guideline 2013. This Guideline is published by the
Department of Infrastructure, Local Government and Planning.
10 A complete set of financial statements comprises:
(a) a Statement of Financial Position as at the end of the period

Source Reference Tropical Council
Statement of Comprehensive Income
For the year ended 30 June 2018
AASB 101.10(b), 81A - 105
AASB 101.81B
AASB 101.92
AASB 101.97
Capital Revenue and Capital Expenses
Councils need to exercise care when classifying revenue and expenditure as capital or recurrent. In particular funding such as
Natural Disaster Relief and Recovery Arrangements (NDRRA) should be consistently classified with related expenditure. For
example, expenditure on repairs and maintenance (from NDRRA funds) would result in an equivalent amount disclosed for
recurrent revenue, or for capital works an equivalent amount would be disclosed as capital revenue.
Some categories of other comprehensive income will only be relevant to a few councils, for example, hedging would only apply
to those councils who have Statutory Bodies Financial Arrangements Act 1982 approval to enter into these types of
arrangements.
(ii) owners of the parent; and
(i) non-controlling interests; and
(a) profit or loss for the period attributable to:
81B An entity shall present the following items, in addition to the profit or loss and other comprehensive income sections, as an
allocation of profit or loss and other comprehensive income for the period:
97 When items of income or expense are material, an entity shall disclose their nature and amount separately.
(ii) owners of the parent.
(i) non controlling interests; and
(b) Comprehensive Income for the period attributable to:
92 An entity shall disclose reclassification adjustments relating to components of other comprehensive income.
93 Other Australian Accounting Standards specify whether and when amounts previously recognised in other comprehensive
income are reclassified to profit or loss. Such reclassifications are referred to in this Standard as reclassification adjustments. A
reclassification adjustment is included with the related component of other comprehensive income in the period that the
adjustment is reclassified to profit or loss. For example, gains realised on the disposal of available-for-sale financial assets are
included in profit or loss of the current period. These amounts may have been recognised in other comprehensive income as
unrealised gains in the current or previous periods. Those unrealised gains must be deducted from other comprehensive income
in the period in which the realised gains are reclassified to profit or loss to avoid including them in total comprehensive income
twice.
If an entity presents profit or loss in a separate statement it shall present (a) in that statement.

Source Reference Tropical Council
Statement of Financial Position
as at 30 June 2018
2018 2017 1 July 2016 * 2018 2017 1 July 2016 *
Note $ $ $ $ $ $
Current assets
AASB 101.54(i) Cash and cash equivalents 11 5,735,156 4,276,522 4,131,951 5,360,330 3,934,878 3,862,951
AASB 101.54(h) Receivables 12 1,382,910 858,062 1,018,744 1,428,054 903,206 1,147,444
AASB 101.54(g) Inventories 13 233,957 450,006 452,000 233,957 450,006 452,000
AASB 101.54(d) Other financial assets 14 20,090 - - 20,090 - -
7,372,113 5,584,590 5,602,695 7,042,431 5,288,090 5,462,395
AASB 5. 38 & 40
AASB 101. 54(j)
15 90,000 - - 90,000 - -
Total current assets 7,462,113 5,584,590 5,602,695 7,132,431 5,288,090 5,462,395
Non-current assets
AASB 101.54(h) Receivables 12 150,000 150,000 183,780 870,000 915,000 910,050
AASB 101.54(d)
ATSI Councils - 40 year
lease
Other financial assets 14 512,991 - - 512,991 - -
AASB 101.54(e) Investments 16 1,015,715 972,849 955,000 2,095,715 2,052,849 2,035,000
AASB 101.54(b) Investment property 17 490,400 420,000 420,000 490,400 420,000 420,000
AASB 101.54(a) Property, plant and equipment 18 74,048,232 78,305,851 80,031,191 71,991,446 76,289,815 78,068,791
AASB 101.54(c) Intangible assets 19 21,000 24,000 27,000 21,000 24,000 27,000
Total non-current assets 76,238,337 79,872,700 81,616,971 75,981,551 79,701,664 81,460,841
Total assets 83,700,450 85,457,290 87,219,666 83,113,982 84,989,754 86,923,236
Current liabilities
AASB 101.54(k) Payables 20 928,769 1,302,827 1,182,136 928,769 1,302,828 1,182,106
AASB 101.54(m) Borrowings 21 2,715,347 1,025,803 1,072,716 2,715,347 1,025,803 1,072,716
AASB 101.54(l) Provisions 23 183,409 38,000 28,000 183,409 38,000 28,000
Other liabilities 24 350,821 - - 350,821 - -
Total current liabilities 4,178,346 2,366,630 2,282,852 4,178,346 2,366,631 2,282,822
Non-current liabilities
AASB 101.54(k) Payables 20 - - - - - -
AASB 101.54(m) Borrowings 21 7,437,054 11,411,917 11,919,957 7,437,054 11,411,917 11,919,957
AASB 101.54(l) Provisions 23 1,376,377 1,814,460 1,691,129 1,376,377 1,814,460 1,691,129
Total non-current liabilities 8,813,431 13,226,377 13,611,086 8,813,431 13,226,377 13,611,086
Total liabilities 12,991,777 15,593,007 15,893,938 12,991,777 15,593,008 15,893,908
Net community assets 70,708,673 69,864,283 71,325,728 70,122,205 69,396,746 71,029,328
AASB 101.55 Community equity
Asset revaluation surplus 25 5,804,509 3,533,826 3,413,144 5,565,793 3,378,838 3,331,144
Retained surplus/(deficiency) 26 64,904,165 66,330,457 67,912,584 64,556,413 66,017,908 67,698,184
Total community equity 70,708,674 69,864,283 71,325,728 70,122,206 69,396,746 71,029,328
AASB 101.40A,
AASB101.10(f) &
See ## on next page
The above statement should be read in conjunction with the accompanying notes and Significant Accounting Policies.
(0) - - (0) - -
AASB 101.10(a) & 54 -
80A
Reconciliation of Net Community Assets
and Total Community Equity
Consolidated Council
* Council has made a retrospective restatement as a consequence of a correction of an error and therefore, in accordance with AASB 101
has presented a Statement of Financial Position as at the beginning of the comparative period i.e. as at 1 July 2016. Details are disclosed
in Note 18 and 33.
Non-current assets held for sale

Source Reference Tropical Council
Statement of Financial Position
as at 30 June 2018
2018 2017 1 July 2016 * 2018 2017 1 July 2016 *
Note $ $ $ $ $ $
AASB 101.10(a) & 54 -
80A
Consolidated Council
AASB 101
##
AASB 101.40B
The third Statement of Financial Position (i.e. as at 1 July 2016) should ONLY be used if council has applied an accounting policy
retrospectively or has made a retrospective restatement of items in its financial statements or has reclassified items in its
financial statements.
Requirements of AASB 101
AASB101. 38A requires "An entity shall present, as a minimum, two statements of financial position, two statements of profit or loss and
other comprehensive income, two separate statements of profit or loss (if presented), two statements of cash flows and two statements of
changes in equity, and related notes. "
(a) the end of the current period;
The following provides guidance on the requirements of AASB 101, with respect to the Statement of Financial Position.
(b) the end of the preceding period; and
(c) the beginning of the preceding period.
In the example above the Statement of Financial Position as at 30 June 2016 has been represented.
AASB101. 40A then goes on to say "An entity shall present a third statement of financial position as at the beginning of the preceding
period in addition to the minimum comparative financial statements required in paragraph 38A if: (a) it applies an accounting policy
retrospectively, makes a retrospective restatement of items in its financial statements or reclassifies items in its financial statements; and
(b) the retrospective application, retrospective restatement or the reclassification has a material effect on the information in the statement
of financial position at the beginning of the preceding period."
When this is the case council will need to present three statements of financial position as at:

Source
ReferenceTropical Council
Statement of Changes in Equity
For the year ended 30 June 2018
Consolidated Asset
revaluation
surplus
Retained
surplus
Total
Note 25 26
$ $ $
Balance as at 1 July 2017 3,533,826 66,330,457 69,864,283
Net result - (1,426,292) (1,426,292)
Other comprehensive income for the year
2,270,683 - 2,270,683
Available-for-sale-financial assets
- - -
- - -
- - -
- - -
- - -
Total comprehensive income for the year 2,270,683 (1,426,292) 844,391
Balance as at 30 June 2018 5,804,509 64,904,165 70,708,674
Balance as at 1 July 2016 3,413,144 66,608,805 70,021,949
Effect of correction of error 33 - 1,303,779 1,303,779
Restated balances 3,413,144 67,912,584 71,325,728
Net result - (1,582,127) (1,582,127)
Other comprehensive income for the year
120,682 - 120,682
Available-for-sale-financial assets
- - -
- - -
- - -
- - -
- - -
Total comprehensive income for the year 120,682 (1,582,127) (1,461,445)
Balance as at 30 June 2017 3,533,826 66,330,457 69,864,283
The above statement should be read in conjunction with the accompanying notes and Summary of Significant Accounting Policies.
0 0 0
Reclassification to profit or loss
Cash flow hedging
Reclassification to profit or loss
Share of comprehensive income of associates
AASB 101.106
- 110
AASB 101.110
AASB 101.106
(a)
Increase / (decrease) in asset revaluation surplus
Increase / (decrease) in asset revaluation surplus
Current year gains/ (losses)
Reclassification to profit or loss
Cash flow hedging
Current year gains/ (losses)
Current year gains/ (losses)
Current year gains/ (losses)
Reclassification to profit or loss
AASB 101.106
(a)
Share of comprehensive income of associates
Reconciliation between Statement of Changes in Equity and
Statement of Financial Position

Tropical Council
Statement of Changes in Equity
For the year ended 30 June 2018
Council Asset
revaluation
surplus
Retained
Surplus
Total
Note 25 26
$ $ $
Balance as at 1 July 2017 3,378,838 66,017,908 69,396,746
Net operating surplus - (1,461,495) (1,461,495)
Other comprehensive income for the year
2,186,955 - 2,186,955
Available-for-sale-financial assets
- - -
- - -
- - -
- - -
- - -
Total comprehensive income for the year 2,186,955 (1,461,495) 725,460
Balance as at 30 June 2018 5,565,793 64,556,413 70,122,206
Balance as at 1 July 2016 3,331,144 66,394,405 69,725,549
AASB 101.110 Effect of correction of error 33 - 1,303,779 1,303,779
Restated balances 3,331,144 67,698,184 71,029,328
Net operating surplus - (1,680,276) (1,680,276)
Other comprehensive income for the year
47,694 - 47,694
Available-for-sale-financial assets
- - -
- - -
- - -
- - -
- - -
Total comprehensive income for the year 47,694 (1,680,276) (1,632,582)
Balance as at 30 June 2017 3,378,838 66,017,908 69,396,746
The above statement should be read in conjunction with the accompanying notes and Summary of Significant Accounting Policies.
0 0 0
AASB 101.106
(a)
Source
Reference
AASB 101.106
- 110
Current year gains/ (losses)
Current year gains/ (losses)
Reclassification to profit or loss
Cash flow hedging
Current year gains/ (losses)
AASB 101.106
(a)
Increase / (decrease) in asset revaluation surplus
Cash flow hedging
Reclassification to profit or loss
Reclassification to profit or loss
Current year gains/ (losses)
Reclassification to profit or loss
Share of comprehensive income of associates
Share of comprehensive income of associates
Increase / (decrease) in asset revaluation surplus
Reconciliation between Statement of Changes in Equity and
Statement of Financial Position

AASB 101
AASB 101.110 110 AASB 108 requires retrospective adjustments to effect changes in accounting policies, to the extent practicable,
except when the transition provisions in another Australian Accounting Standard require otherwise. AASB 108 also
requires restatements to correct errors to be made retrospectively, to the extent practicable. Retrospective
adjustments and retrospective restatements are not changes in equity but they are adjustments to the opening
balance of retained earnings, except when an Australian Accounting Standard requires retrospective adjustment of
another component of equity. Paragraph 106(b) requires disclosure in the Statement of Changes in Equity of the total
adjustment to each component of equity resulting, from changes in accounting policies and separately, from
corrections of errors. These adjustments are disclosed for each prior period and the beginning of the period.
(b) for each component of equity, the effects of retrospective application or retrospective restatement recognised in
accordance with AASB 108; and
(c) [Deleted by the IASB]
Requirements of AASB 101
AASB 101.106
The following provides guidance on the requirements of AASB 101, with respect to the Statement of Changes in
Equity.
106 An entity shall present a Statement of Changes in Equity as required by paragraph 10. The statement of changes
in equity includes the following information
(d) for each component of equity, a reconciliation between the carrying amount at the beginning and the end of the
period, separately disclosing changes resulting from:
(i) profit or loss;
(ii) other comprehensive income; and
(iii) transactions with owners in their capacity as owners, showing separately contributions by and distributions to
owners and
changes in ownership interests in subsidiaries that do not result in a loss of control.
(a) total comprehensive income for the period, showing separately the total amounts attributable to owners of the
parent and to non-controlling interests;

Source
ReferenceTropical Council
AASB
101.111Statement of Cash Flows
AASB 107 For the year ended 30 June 2018Consolidated Council
Note 2018 2017 2018 2017
$ $ $ $
AASB107.10 Cash flows from operating activities
AASB107.14 Receipts from customers 10,864,439 11,441,064 9,167,113 8,575,066
AASB107.14 Payments to suppliers and employees (11,367,710) (9,870,047) (9,899,840) (7,339,193)
(503,271) 1,571,017 (732,727) 1,235,873
AASB107.31 Dividend received - - 102,674 107,200
AASB107.31 Interest received 301,446 285,595 350,046 336,895
Rental income 10,400 10,400 10,400 10,400
Non capital grants and contributions 3,230,845 1,523,121 3,230,845 1,523,121
Income from investments 11,420 7,150 11,420 7,150
Borrowing costs (733,480) (942,888) (733,480) (942,888)
Net cash inflow (outflow) from operating activities 31 2,317,360 2,454,395 2,239,178 2,277,751
AASB107.10 Cash flows from investing activities
AASB107.16 Payments for property, plant and equipment (1,797,214) (2,519,972) (1,797,214) (2,505,972)
Payments for intangible assets - - -
AASB107.16 Net movement in loans and advances - - 45,000 90,000
AASB107.16 Proceeds from sale of property plant and equipment 2,041,093 187,487 2,041,093 187,487
Finance lease receipts 4,900 - 4,900 -
Grants, subsidies, contributions and donations 1,177,814 347,529 1,177,814 347,529
Net cash inflow (outflow) from investing activities 1,426,593 (1,984,956) 1,471,593 (1,880,956)
AASB107.10 Cash flows from financing activities
AASB107.17 Proceeds from borrowings - 629,153 - 629,153
AASB107.17 Repayment of borrowings (2,268,098) (937,555) (2,268,098) (937,555)
AASB107.17 Repayments made on finance leases (17,221) (16,466) (17,221) (16,466)
Net cash inflow (outflow) from financing activities (2,285,319) (324,868) (2,285,319) (324,868)
Net increase (decrease) in cash and cash equivalent held 1,458,634 144,571 1,425,452 71,927
Cash and cash equivalents at the beginning of the financial year 4,276,522 4,131,951 3,934,878 3,862,951
Cash and cash equivalents at end of the financial year 11 5,735,156 4,276,522 5,360,330 3,934,878
- - - -
The above statement should be read in conjunction with the accompanying notes and Summary of Significant Accounting Policies.
Reconciliation of Statement of Cash Flows to Cash and cash equivalents
The AASB do not specify the classification of cash flows from interest and dividends received and paid, so councils are
required to choose their own policies for classifying interest and dividends paid as either operating or financing activities, and
interest and dividends received as either operating or investing activities. By way of example, Tropical has classified both
interest and dividends received as operating activities.

Tropical Council
Notes to the financial statements
For the year ended 30 June 2018
AASB 101.31
AASB101.117-
133
1 Significant accounting policies
1.A Basis of preparation
AASB 1054.7-9
AASB 1054.8(b)
& AASB 101.16
& Aus16.3
AASB 101.117
(a), .118AASB 101.51(b) 1.B Basis of consolidation
AASB
101.138(a)
1.C Constitution
The Tropical Council is constituted under the Queensland Local Government Act 2009 (City of Brisbane Act 2010) and is
domiciled in Australia.
As per the Conceptual Framework, the four principal qualitative characteristics that make the information provided in financial
statements useful to users are understandability, relevance, reliability and comparability. Consequently, disclosures should be
tailored so that they are clear, concise and effective.
The Tropical Council Illustrative Financial Statements are designed to generically cover almost every possible disclosure
requirement that could be encountered by Queensland local governments, many of which are not applicable or not material to
individual councils. Although the foreword clearly states that the document is “for GUIDANCE ONLY” and “should be amended to
reflect an individual council’s circumstances and operational characteristics”, widespread cases have been noted where councils
and their external auditors have not adopted this principle. This has resulted in financial statements regularly including information
that is unnecessary or not tailored to the needs of interested users.
Furthermore, the following underlined additions to paragraph 31 of AASB 101 Presentation of Financial Statements, which take
effect this financial year, emphasise that disclosures are only required where they are material:
Another important change to AASB 101.31 this year states "An entity shall also consider whether to provide additional disclosures
when compliance with the specific requirements in Australian Accounting Standards is insufficient to enable users of financial
statements to understand the impact of particular transactions, other events and conditions on the entity’s financial position and
financial performance."
“An entity need not provide a specific disclosure required by an Australian Accounting Standard if the information resulting from
that disclosure is not material. This is the case even if the Australian Accounting Standard contains a list of specific requirements
or describes them as minimum requirements.”
Any decisions about disclosures that are based on materiality must be reassessed for appropriateness on an annual basis.
In these illustrative statements a great deal of detail about accounting policies is disclosed. This level of detail may not be
necessary. Council's should refer to AASB 101.119 when deciding whether to disclose a particular accounting policy.
Source
Reference
Transactions between Council and entities controlled by Council have been eliminated when preparing consolidated
accounts. In addition, the accounting policies of controlled entities have been adjusted on consolidation where necessary,
to ensure the financial report of the consolidated entity is prepared using accounting policies that are consistent with those
of the Council. Information on controlled entities that have been consolidated is included in Note 16.
These general purpose financial statements are for the period 1 July 2017 to 30 June 2018. They are prepared in
accordance with the Local Government Act 2009 and the Local Government Regulation 2012 (City of Brisbane Act 2010
and City of Brisbane Regulation 2012 ).
These financial statements have been prepared under the historical cost convention except where stated.
They comply with Australian Accounting Standards and Interpretations issued by the Australian Accounting Standards
Board (AASB). Council is a not-for-profit entity and the Australian Accounting Standards include requirements for not-for-
profit entities which are inconsistent with International Financial Reporting Standards (IFRS). Therefore in some instances
these financial statements do not comply with IFRS. The main impacts are the offsetting of revaluation gains and losses
within a class of assets and the timing of recognition of non-reciprocal grant revenue.
Council and its controlled entities together form the economic entity which is referred to in these financial statements as
the consolidated entity. The financial statements of controlled entities are included in the consolidated financial statements
where material by size or nature, from the date when control commences until the date when control ceases.
Information about controlled entities that have not been consolidated, because they are not considered material, is
included in Note 38.

Tropical Council
Notes to the financial statements
For the year ended 30 June 2018
Source
Reference
AASB 108.28-31 1.D New and revised Accounting Standards
(a) the title of the Australian Accounting Standard;
(c) the nature of the change in accounting policy;
(d) when applicable, a description of the transitional provisions;
(e) when applicable, the transitional provisions that might have an effect on future periods;
(g) the amount of the adjustment relating to periods before those presented, to the extent practicable
AASB 108.30, 31
Standard and impact Date council will
apply the
standard
AASB 9 Financial Instruments
This replaces AASB 139 Financial Instruments: Recognition and Measurement , and addresses the
classification, measurement and disclosure of financial assets and liabilities.
1 July 2018
The standard introduces a new impairment model that requires impairment provisions to be based on
expected credit losses, rather than incurred credit losses. Based on assessments to date, council
expects a small increase to impairment losses however the standard is not expected to have a material
impact overall.
AASB 15 Revenue from Contracts with Customers, AASB 1058 Income of Not-for-Profit Entities
and AASB 2016-8 Amendments to Australian Accounting Standards - Australian Implementation
Guidance for Not-for-Profit Entities
AASB 15 will replace AASB 118 Revenue, AASB 111 Construction Contracts and a number of
Interpretations. AASB 2016-8 provides Australian requirements and guidance for not-for-profit entities
in applying AASB 9 and AASB 15, and AASB 1058 will replace AASB 1004 Contributions. Together
they contain a comprehensive and robust framework for the recognition, measurement and disclosure
of income including revenue from contracts with customers.
1 July 2019
Council is still reviewing the way that income is measured and recognised to identify whether there will
be any material impact arising from these standards.
When preparing this note, councils should review new and amended AASB Standards and Interpretations that apply to 2017-18 to
consider their relevance and impact. The illustrative note below should be amended to suit each Council.
Where council has not adopted accounting standards, because they are not effective yet, AASB 108.30 requires this fact to be
disclosed. In addition "known or reasonably estimable information relevant to assessing the possible impact that application of the
new Australian Accounting Standard will have on the entity's financial statements in the period of initial application " is required. In
these illustrative financial statements Tropical Council has not applied any standards or interpretations that are not yet effective
and the following notes have been prepared on this basis. The notes below summarise changes that might affect councils that
have taken this approach, however each council will need to customise the disclosure and add in additional disclosure, where
relevant, that refers to council's specific situation.
Where there have been material changes AASB 108.28 then requires the following disclosure about the effect that the application
of the relevant standard has on the current & past periods:
Some Australian Accounting Standards and Interpretations have been issued but are not yet effective. Those standards
have not been applied in these financial statements. Council will implement them when they are effective. The standards
that are expected to have a material impact upon council's future financial statements are:
This year Council has applied AASB 2016-2 Amendments to Australian Accounting Standards – Disclosure Initiative:
Amendments to AASB 107 for the first time. As a result Council has disclosed more information to explain changes in
liabilities arising from financing activities (‘debt reconciliation’). This information is presented in note 32.
(b) when applicable, that the change in accounting policy is made in accordance with its transitional provisions;
(f) for the current period and each prior period presented, to the extent practicable, the amount of the adjustment for each
financial statement line item affected; and
NOTE: These standards may affect the timing of the recognition of some grants and donations. If your council identifies
such a change, and it is material, the impact will need to be described here. The timing of the recognition of Financial
Assistance Grants will not be affected.

Tropical Council
Notes to the financial statements
For the year ended 30 June 2018
Source
Reference
AASB 16 Leases
Council has some leases that are not in the Statement of Financial Position. These will need to be
included when this standard comes into effect. A lease liability will initially be measured at the present
value of the lease payments to be made over the lease term. A corresponding right-of-use asset will
also be recognised over the lease term. If this requirement had been adopted at 30 June 2018
management estimate that net assets would have decreased by $1,200,000. This estimate is based on
council's current obligations and various market and other assumptions.
1 July 2019
Effective for
annual report
periods
beginning on or
after:
AASB 9 Financial Instruments (December 2009) 1 January 2018
AASB 15 Revenue from Contracts with Customers 1 January 2018
AASB 16 Leases 1 January 2019
AASB 17 Insurance Contracts 1 January 2021
AASB 1058 Income of Not-for-Profit Entities 1 January 2019
AASB 1059 Service Concession Arrangements: Grantors 1 January 2019
AASB 2010-7 Amendments to Australian Accounting Standards arising from AASB 9 (December
2010)
1 January 2018
AASB 2014-1 Amendments to Australian Accounting Standards Part E - 1 January
2018
AASB 2014-5 Amendments to Australian Accounting Standards arising from AASB 15 1 January 2017
AASB 2014-7 Amendments to Australian Accounting Standards arising from AASB 9 (December
2014)
1 January 2018
AASB 2015-8 Amendments to Australian Accounting Standards – Effective Date of AASB 15 1 January 2017
AASB 16 Leases (Appendix D) 1 January 2019
AASB 2016-3 Amendments to Australian Accounting Standards – Clarifications to AASB 15 1 January 2018
AASB 2016-5 Amendments to Australian Accounting Standards – Classification and Measurement of
Share-based Payment Transactions
1 January 2018
AASB 1058 Income of Not-for-Profit Entities (Appendix D) 1 January 2019
AASB 2016-6 Amendments to Australian Accounting Standards - Applying AASB 9 Financial
Instruments with AASB 4 Insurance Contracts
1 January 2018
AASB 2016-7 Amendments to Australian Accounting Standards - Deferral of AASB 15 for Not-for-Profit
Entities
1 January 2017
AASB 2016-8 Amendments to Australian Accounting Standards - Australian Implementation Guidance
for Not-for-Profit Entities
1 January 2019
AASB 2017-1 Amendments to Australian Accounting Standards - Transfers of Investment Property,
Annual Improvements 2014-2016 Cycle and Other Amendments
1 January 2019
AASB 2017-3 Amendments to Australian Accounting Standards – Clarifications to AASB 4 1 January 2018
The following list identifies all the new and amended Australian Accounting Standards, and Interpretation, that were issued but not
yet effective at the time of compiling these illustrative statements.
Councils do not need to include this complete list in the notes to the financial statements. It is provided to assist in deciding which
are likely to have a material impact. The list was compiled during December 2017 and Councils will also need to consider any
new or amended standards that are issued after this date but prior to completion of the audit of the statements.
If council does not expect any to have a material impact. The following wording is suggested:
Some Australian Accounting Standards and Interpretations have been issued but are not yet effective. Those standards
have not been applied in these financial statements. Council will implement them when they are effective. The standards
are not expected to have a material impact upon council's future financial statements.
Tropical Council
Notes to the financial statements
For the year ended 30 June 2018
Source
Reference
AASB 2017-4 Amendments to Australian Accounting Standards – Uncertainty over Income Tax
Treatments
1 January 2019
AASB 17 Insurance Contracts (Appendix D) 1 January 2021
AASB 1059 Service Concession Arrangements: Grantors (Appendix D) 1 January 2019
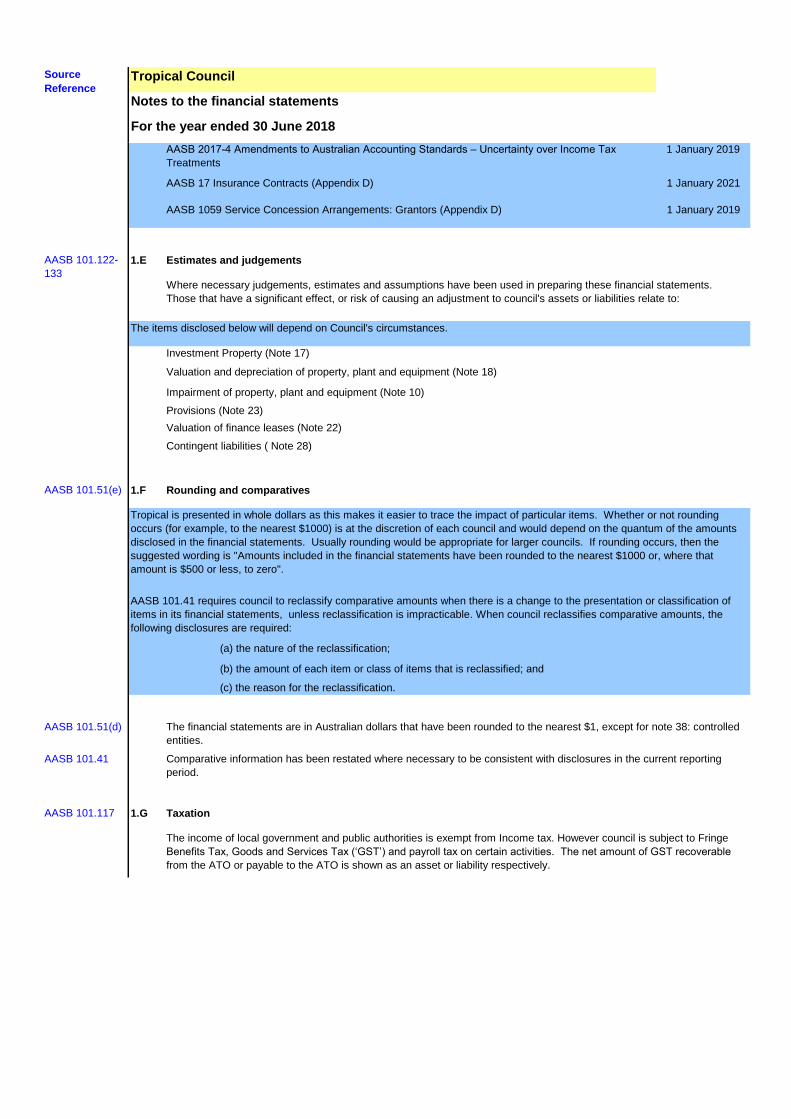
AASB 101.122-
133
1.E Estimates and judgements
Investment Property (Note 17)
Valuation and depreciation of property, plant and equipment (Note 18)
Impairment of property, plant and equipment (Note 10)
Provisions (Note 23)
Valuation of finance leases (Note 22)
Contingent liabilities ( Note 28)
AASB 101.51(e) 1.F Rounding and comparatives
(a) the nature of the reclassification;
(b) the amount of each item or class of items that is reclassified; and
(c) the reason for the reclassification.
AASB 101.51(d)
AASB 101.41
AASB 101.117 1.G Taxation
The income of local government and public authorities is exempt from Income tax. However council is subject to Fringe
Benefits Tax, Goods and Services Tax (‘GST’) and payroll tax on certain activities. The net amount of GST recoverable
from the ATO or payable to the ATO is shown as an asset or liability respectively.
The items disclosed below will depend on Council's circumstances.
Where necessary judgements, estimates and assumptions have been used in preparing these financial statements.
Those that have a significant effect, or risk of causing an adjustment to council's assets or liabilities relate to:
Comparative information has been restated where necessary to be consistent with disclosures in the current reporting
period.
The financial statements are in Australian dollars that have been rounded to the nearest $1, except for note 38: controlled
entities.
AASB 101.41 requires council to reclassify comparative amounts when there is a change to the presentation or classification of
items in its financial statements, unless reclassification is impracticable. When council reclassifies comparative amounts, the
following disclosures are required:
Tropical is presented in whole dollars as this makes it easier to trace the impact of particular items. Whether or not rounding
occurs (for example, to the nearest $1000) is at the discretion of each council and would depend on the quantum of the amounts
disclosed in the financial statements. Usually rounding would be appropriate for larger councils. If rounding occurs, then the
suggested wording is "Amounts included in the financial statements have been rounded to the nearest $1000 or, where that
amount is $500 or less, to zero".
Tropical Council
Notes to the financial statements
For the year ended 30 June 2018
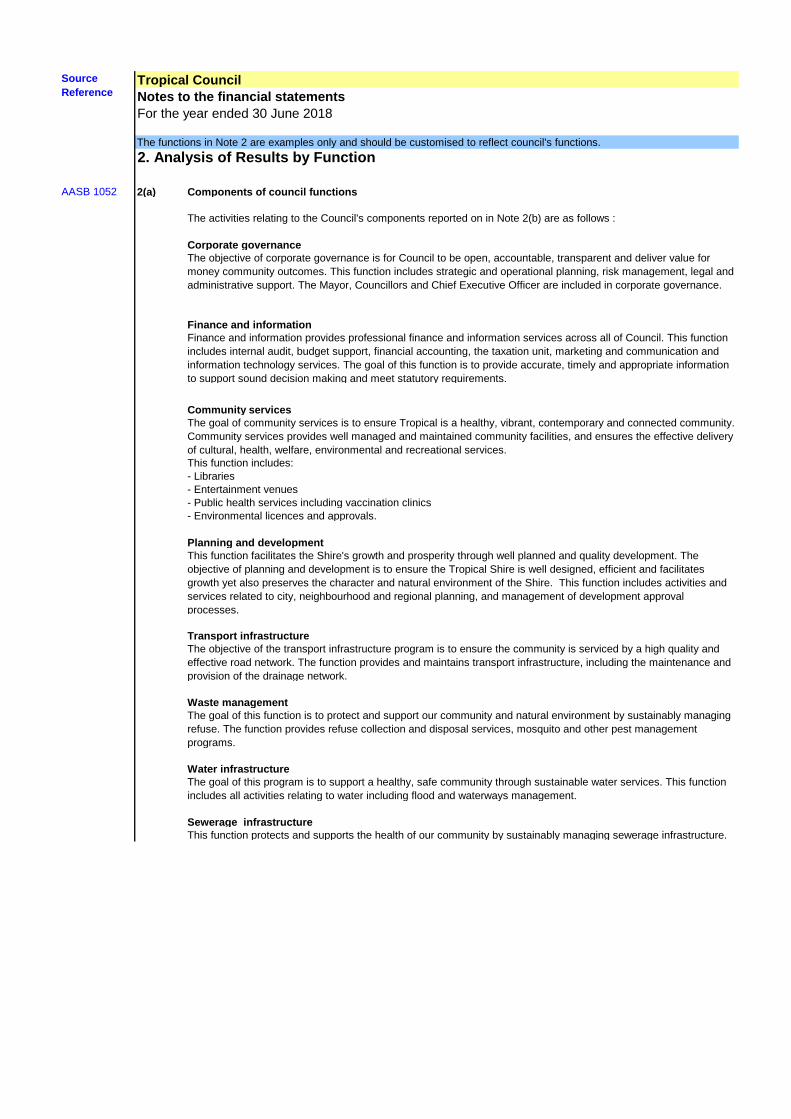
The functions in Note 2 are examples only and should be customised to reflect council's functions.
2. Analysis of Results by Function
AASB 1052 2(a) Components of council functions
The activities relating to the Council's components reported on in Note 2(b) are as follows :
Corporate governance
The objective of corporate governance is for Council to be open, accountable, transparent and deliver value for
money community outcomes. This function includes strategic and operational planning, risk management, legal and
administrative support. The Mayor, Councillors and Chief Executive Officer are included in corporate governance.
Finance and information
Finance and information provides professional finance and information services across all of Council. This function
includes internal audit, budget support, financial accounting, the taxation unit, marketing and communication and
information technology services. The goal of this function is to provide accurate, timely and appropriate information
to support sound decision making and meet statutory requirements.
Community services
The goal of community services is to ensure Tropical is a healthy, vibrant, contemporary and connected community.
Community services provides well managed and maintained community facilities, and ensures the effective delivery
of cultural, health, welfare, environmental and recreational services.
This function includes:
- Libraries
- Entertainment venues
- Public health services including vaccination clinics
- Environmental licences and approvals.
Planning and development
This function facilitates the Shire's growth and prosperity through well planned and quality development. The
objective of planning and development is to ensure the Tropical Shire is well designed, efficient and facilitates
growth yet also preserves the character and natural environment of the Shire. This function includes activities and
services related to city, neighbourhood and regional planning, and management of development approval
processes.
Transport infrastructure
The objective of the transport infrastructure program is to ensure the community is serviced by a high quality and
effective road network. The function provides and maintains transport infrastructure, including the maintenance and
provision of the drainage network.
Waste management
The goal of this function is to protect and support our community and natural environment by sustainably managing
refuse. The function provides refuse collection and disposal services, mosquito and other pest management
programs.
Water infrastructure
The goal of this program is to support a healthy, safe community through sustainable water services. This function
includes all activities relating to water including flood and waterways management.
Sewerage infrastructure
This function protects and supports the health of our community by sustainably managing sewerage infrastructure.
Source
Reference

Tropical Council
Notes to the financial statements
For the year ended 30 June 2018
The functions in Note 2 are examples only and should be customised to reflect council's functions. Note that the Standard requires grants and "other" to be disclosed.
Councils need to ensure that the names of functions in this disclosure match those disclosed in note 2(a)
AASB 1052 2 Analysis of results by function
(b) Income and expenses defined between recurring and capital are attributed to the following functions:
Year ended 30 June 2018
Functions Elimination of Total Elimination of Total Net result Net Assets
inter-function income Recurrent Capital inter-function expenses from recurrent Result
Grants Other Grants Other transactions transactions operations
$ $ $ $ $ $ $ $ $ $ $ $ $
Corporate governance 11,073 - 11,073 (446,261) - 9,998 (436,263) (435,188) (425,190) 7,802
Finance and information 3,230,845 3,173,146 750,236 1,520 - 7,155,747 (1,290,697) 25,000 (1,265,697) 1,882,449 5,890,050 9,321,634
Community services 198,590 - - 198,590 (1,306,682) (2,374,723) 38,000 (3,643,405) (1,108,092) (3,444,815) 4,683,429
Planning & development 255,076 - - 255,076 (382,371) - 5,400 (376,971) (127,295) (121,895) 101
Transport infrastructure 4,042,604 487,342 480,680 (812,743) 4,197,883 (8,664,888) - 588,495 (8,076,393) (4,622,284) (3,878,510) 47,948,745
Waste management 779,386 - - 779,386 (734,899) - 75,500 (659,399) 44,487 119,987 111,989
Water infrastructure 1,986,684 (27,800) 1,958,884 (1,715,925) - 79,900 (1,636,025) 270,759 322,859 19,181,206
Sewerage infrastructure 522,985 6,600 - 529,585 (471,816) - 18,250 (453,566) 51,169 76,019 3,563,664
Total Council 3,230,845 10,969,544 1,237,578 488,800 (840,543) 15,086,224 (15,013,539) (2,374,723) 840,543 (16,547,719) (4,043,995) (1,461,495) 84,818,570
Controlled entity net of
eliminations
1,648,726 (7,617) 1,641,109 (1,605,906) (1,605,906) 42,820 35,203 586,468
Total consolidated 3,230,845 12,618,270 1,237,578 481,183 (840,543) 16,727,333 (16,619,445) (2,374,723) 840,543 (18,153,625) (4,001,175) (1,426,292) 85,405,038
-
-
Functions Elimination of Total Elimination of Total Net result Net Assets
inter-function income Recurring Capital inter-function expenses from recurring Result
Grants Other Grants Other transactions transactions operations
$ $ $ $ $ $ $ $ $ $ $ $ $
Corporate governance 11,073 24,000 - 35,073 (446,261) - 9,998 (436,263) (435,188) (401,190) 7,802
Finance and information 1,501,781 4,880,392 - - 6,382,173 (1,290,697) (1,521,528) 25,000 (2,787,225) 3,589,695 3,594,948 9,321,634
Community services 198,590 - 198,590 (1,306,682) - 38,000 (1,268,682) (1,108,092) (1,070,092) 4,683,429
Planning & development 255,076 - - 255,076 (382,371) - 5,400 (376,971) (127,295) (121,895) 101
Transport infrastructure 2,464,532 250,000 51,619 (914,548) 1,851,603 (6,586,623) - 664,000 (5,922,623) (4,122,091) (4,071,020) 48,119,929
Waste management 779,386 - - 779,386 (734,899) - 75,500 (659,399) 44,487 119,987 111,989
Water infrastructure 1,687,492 80,099 62,901 (1,500) 1,828,992 (1,715,925) - 79,900 (1,636,025) (28,433) 192,967 19,181,206
Sewerage infrastructure 522,985 6,600 - 529,585 (471,816) - 18,250 (453,566) 51,169 76,019 3,563,664
Total Council 1,501,781 10,799,526 330,099 145,120 (916,048) 11,860,478 (12,935,274) (1,521,528) 916,048 (13,540,754) (2,135,748) (1,680,276) 84,989,754
Controlled entity net of
eliminations
1,341,500 1,341,500 (1,295,851) 52,500 (1,243,351) 45,649 98,149 467,536
Total consolidated 1,501,781 12,141,026 330,099 145,120 (916,048) 13,201,978 (14,231,125) (1,469,028) 916,048 (14,784,105) (2,090,099) (1,582,127) 85,457,290
Recurring
Capital
Capital
Gross program expenses
Source
Reference
Year ended 30 June 2017
Gross program expenses
Recurrent
Gross program income
Gross program income

Tropical Council
Notes to the financial statements
For the year ended 30 June 2018AASB 101.77, 97 Consolidated Council
2018 2017 2018 2017
Note $ $ $ $
3 Revenue
AASB 118.9 &
35(a)
(a) Rates, levies and charges
General rates / Community levy (depending on council) 5,116,713 4,864,383 5,116,713 4,864,383
Separate rates 307,035 - 307,035 -
Water 1,357,098 1,308,700 1,357,098 1,308,700
Water consumption, rental and sundries 347,424 522,889 347,424 522,889
Sewerage 521,984 500,416 521,984 500,416
Sewerage trade waste 51,181 15,520 51,181 15,520
Waste management - 294,972 - 294,972
Garbage charges 503,308 478,376 503,308 478,376
Total rates and utility charge revenue 8,204,743 7,985,256 8,204,743 7,985,256
Less: Discounts (662,061) (616,280) (662,061) (616,280)
Less: Pensioner remissions (61,056) (65,939) (61,056) (65,939)
7,481,626 7,303,037 7,481,626 7,303,037
(b) Fees and charges
Retirement home fees 1,800,000 1,500,000 - -
Building and development fees 273,330 321,000 273,330 321,000
Infringements 29,456 38,452 29,456 38,452
Licences and registrations 67,561 68,752 67,561 68,752
Bank and post office commissions 39,741 38,000 39,741 38,000
Airport landing fees 69,451 68,451 69,451 68,451
Other fees and charges 21,654 29,666 21,654 29,666
2,301,193 2,064,321 501,193 564,321
(c) Rental income
AASB 140.75(f) Investment property rental 7,400 7,400 7,400 7,400
Other rental income 3,000 3,000 3,000 3,000
10,400 10,400 10,400 10,400
AASB 118.35(b) (d) Interest received
Interest received from term deposits 266,793 232,785 266,793 232,785
Other sources - - 48,600 51,300
Interest from overdue rates and utility charges 34,653 52,810 34,653 52,810
301,446 285,595 350,046 336,895
AASB 118.35(b) (e) Sales revenue
AASB 101.117 (b)
AASB 111.39(b) &
(c), AASB 111.40
AASB 118.35(b) Sale of services
AASB 111.39(a) Contract and recoverable works 479,717 380,038 479,717 380,038
Child care centre 29,456 28,791 29,456 28,791
Motor vehicle repairs 17,564 16,987 17,564 16,987
526,737 425,816 526,737 425,816
AASB 118.35(b) Sale of goods
Nursery 50,540 43,278 50,540 43,278
Post office 23,458 22,652 23,458 22,652
Service station 39,265 38,254 39,265 38,254
113,263 104,184 113,263 104,184
Total sales revenue 640,000 530,000 640,000 530,000
Fees and charges are recognised when council is unconditionally entitled to those funds. Generally this is upon lodgement of the relevant
applications or documents, issuing of the infringement notice or when the service is provided.
Rent from investment and other property is recognised as income on a periodic straight line basis over the lease term.
Interest received from term deposits is accrued over the term of the investment.
The sale of goods is recognised when the customer has taken delivery of the goods. Revenue from services is recognised when the service is
rendered.
Revenue from contracts and recoverable works generally comprises a recoupment of material costs together with an hourly charge for use of
equipment and employees. This revenue and the associated costs are recognised by reference to the stage of completion of the contract activity
at the reporting date. Where consideration is received for the service in advance it is included in other liabilities and is recognised as revenue in
the period when the service is performed. There are no contracts in progress at the year end. The contract work carried out is not subject to
retentions.
Source Reference
The rate, levies and charges break-down is an example only and should be customised to suit council's operations. For Aboriginal councils it will be
more appropriate to refer to a "community levy" rather than "rates"
The suggested sales revenue break-down is suggested only and should be customised to suit council's operations.
AASB 1004.12 &
19 - 30
Revenue is recognised at the fair value of the consideration received or receivable, at the time indicated below.
Rates are recognised as revenue at the start of the rating period. If a ratepayer pays their rates before the start of the rating period, they are
recognised as revenue when they are received.
The fees and charges break-down provides examples of fees and charges (but is not an exhaustive list) and should be customised to suit council's
operations.

Tropical Council
Notes to the financial statements
For the year ended 30 June 2018AASB 101.77, 97 Consolidated Council
2018 2017 2018 2017
Note $ $ $ $
Source Reference
(f) Profit from investments
Profit from joint ventures 54,286 36,571 54,286 36,571
54,286 36,571 54,286 36,571
(g) Other income
AASB 118.35(b) Dividend - - 102,674 107,200
ATSI Councils - 40
year lease
Gain on revaluation of finance leases (Note 14) 16,787 - 16,787 -
Other income 971,989 973,714 971,989 973,714
988,776 973,714 1,091,450 1,080,914
Dividends are recognised when they are declared.

Tropical Council
Notes to the financial statements
For the year ended 30 June 2018AASB 101.77, 97 Consolidated Council
2018 2017 2018 2017
Note $ $ $ $
Source Reference
4 Grants, subsidies, contributions and donations
AASB Interpretation
18, AASB 118
(a) Recurrent
General purpose grants 833,040 830,094 833,040 830,094
State government subsidies and grants 1,150,987 336,789 1,150,987 336,789
Commonwealth government subsidies and grants 1,225,000 334,898 1,225,000 334,898
Donations 996 - 996 -
Contributions 20,822 21,340 20,822 21,340
3,230,845 1,523,121 3,230,845 1,523,121
(b) Capital
State government subsidies and grants 487,342 330,099 487,342 330,099
Contributions 690,472 17,430 690,472 17,430
ATSI Councils - 40
year lease
Contributions - finance lease assets recognised in respect of newly
built houses
59,764 - 59,764 -
1,237,578 347,529 1,237,578 347,529
The accounting treatment for grants depends on whether they are reciprocal or non-reciprocal. The following guidance is based on AASB 1004 and
information contained in Queensland Treasury’s APG 2 which is available at www.treasury.qld.gov.au. APG 2 is not binding on local governments, but
provides useful guidance on accounting for grants:
AASB 1004 defines ‘contributions’ as “a non-reciprocal transfer in which an entity receives assets or services or has liabilities extinguished without
directly giving approximately equal value in exchange to the other party or parties to the transfer.”
AASB 1004 distinguishes between reciprocal transfers of assets where approximately equal value is exchanged in the transfer between the transferor
and transferee and non-reciprocal transfers where equal value is not exchanged.
AASB 1004.12,
18(a)
Developers also pay infrastructure charges for trunk infrastructure, such as pumping stations, treatment works, mains, sewers and water pollution
control works. These infrastructure charges are not within the scope of AASB Interpretation 18 because there is no performance obligation associated
with them. Consequently, the infrastructure charges are recognised as income when received.
‘Contributions’ received by councils will generally take two forms:
- shown on the Statement of Financial Position as a liability only in the event of an obligation arising to return all or part of the contribution to the
transferor thereby giving rise to a liability. In these instances, the liability would be recognised as a payable taken up against expenses, rather than as
unearned revenue against income.
Contributions would generally be recognised as income when the council obtains control of them. Control is generally established when the
contribution is received.
The inclusion of conditions such as one that requires the return of monies if a breach of condition occurs, or one that requires all unspent monies to be
returned, is not sufficient to justify that a council does not control the contribution at the time of receipt or that there is a present obligation to return the
funds thereby giving rise to a liability. When the recipient of a contribution fails to meet any specific conditions attached to the transfer, it is only once
an obligation to return the monies has been determined and is being enforced by the transferor that a liability for the amount payable is recognised.
- involuntary transfers e.g. rates, taxes and fines, or
- the contribution can be measured reliably.
All of the above criteria must be satisfied for the contribution to be recognised.
AASB 1004 requires contributions to be:
Physical assets contributed to Council by developers in the form of road works, stormwater, water and wastewater infrastructure and park
equipment are recognised as revenue when the development becomes "on maintenance" (i.e. the Council obtains control of the assets and
becomes liable for any ongoing maintenance) and there is sufficient data in the form of drawings and plans to determine the approximate
specifications and values of such assets. Non-cash contributions with a value in excess of the recognition thresholds are recognised as non-
current assets. Those below the thresholds are recorded as expenses.
Grants, subsidies, donations and contributions that are non-reciprocal in nature are recognised as revenue when Council obtains control over
them, which is usually upon receipt of funds.
Where grants are received that are reciprocal in nature, revenue is recognised as the various performance obligations under the funding
agreement are fulfilled. Council does not currently have any reciprocal grants.
- voluntary transfers e.g. non-reciprocal grants and donations.
Councils must recognise the income from a contribution when:
- it obtains control of the contribution or right to receive the contribution (irrespective of whether restrictions or conditions are imposed on its use),
- it is probable that future economic benefits will flow to the agency, and
Grants and contributions are to be classified as operating or capital depending on the purpose for which they were received and not on the purpose for
which they were spent. General purpose grants and contributions are all classified as operating regardless of how they are spent.
Capital Revenue includes grants and subsidies received which are tied to specific projects for the replacement or upgrade of existing non-current
assets and/or investment in new assets. It also includes non-cash contributions which are usually infrastructure assets received from developers.
- recognised as income in the period received, subject to the recognition criteria being met, and

Tropical Council
Notes to the financial statements
For the year ended 30 June 2018AASB 101.77, 97 Consolidated Council
2018 2017 2018 2017
Note $ $ $ $
Source Reference
(c) Conditions over contributions
AASB
1004.60(a),(b) & (d)
Non-reciprocal grants for expenditure on services (if applicable) - - - -
Non-reciprocal grants for expenditure on infrastructure (if
applicable)
- 10,750 - 10,750
- 10,750 - 10,750
AASB 1004.60(e)
Non-reciprocal grants for expenditure on services (if applicable) - - - -
Non-reciprocal grants for expenditure on infrastructure (if
applicable)
- 4,843 - 4,843
- 4,843 - 4,843
5 Capital income
Gain / loss on disposal of non-current assets
Proceeds from the sale of property, plant and equipment 1,885,093 187,487 1,885,093 187,487
Less: Carrying value of property, plant and equipment disposed of (1,825,172) (59,797) (1,825,172) (59,797)
59,921 127,690 59,921 127,690
Proceeds from sale of land and improvements 156,000 - 156,000 -
Less: Carrying value of land sold (113,200) - (113,200) -
42,800 - 42,800 -
Provision for restoration of land
Discount rate adjustment to refuse restoration provision 23 8,248 - 8,248 -
8,248 - 8,248 -
AASB 116 AUS
39.1 & 40.1
Revaluations
Revaluation up of property, plant and equipment reversing previous
revaluation down
18 314,214 - 321,831 -
Revaluation up of investment property 17 56,000 - 56,000 -
370,214 - 377,831 -
Total capital income 481,183 127,690 488,800 127,690
The requirement to separately disclose grants for services versus grants for capital purposes (i.e. infrastructure ) is not mandated in local government
legislation or Australian Accounting Standards. However, this breakdown will significantly assist Council in preparing their Financial Sustainability
Statements.
AASB 1004 defines contributions as “non-reciprocal transfers to the entity”. A “non-reciprocal transfer" is defined in AASB 1004 as "a transfer in which
the entity receives assets or services or has liabilities extinguished without directly giving approximately equal value in exchange to the other party or
parties to the transfer." Therefore, in relation to grants, only non-reciprocal grants will be disclosed in the following notes.
AASB 1004.60 &
61
AASB
Framework.78 & 80
and AASB 101.34
Contributions recognised as income during the reporting period and which were obtained on the condition that they be expended in a manner
specified by the contributor but had not been expended at the reporting date:
Contributions recognised as income during a previous reporting period that were obtained in respect of the current reporting period:

Tropical Council
Notes to the financial statements
For the year ended 30 June 2018AASB 101.77, 97 Consolidated Council
2018 2017 2018 2017
Note $ $ $ $
Source Reference
6 Employee benefits
Total staff wages and salaries 4,728,303 4,283,060 3,477,759 3,383,060
Councillors' remuneration 146,175 138,091 146,175 138,091
Annual, sick and long service leave entitlements 631,625 656,415 631,625 656,415
Superannuation 29 345,729 337,833 345,729 337,833
5,851,832 5,415,399 4,601,288 4,515,399
Other employee related expenses 196,420 177,045 196,420 177,045
6,048,252 5,592,444 4,797,708 4,692,444
Less: Capitalised employee expenses (169,209) (398,283) (169,209) (398,283)
5,879,043 5,194,161 4,628,499 4,294,161
Total Council employees at the reporting date: 2018 2017 2018 2017
Elected members 7 7 7 7
Administration staff 35 31 14 14
Depot and outdoors staff 44 44 44 44
Total full time equivalent employees 86 82 65 65
7 Materials and services
Advertising and marketing 239,862 118,240 209,862 118,240
Administration supplies and consumables 581,723 441,258 530,712 398,140
AASB 1054.10 Audit of annual financial statements by the Auditor-General of
Queensland
22,015 20,769 22,015 20,769
Communications and IT 790,167 713,177 721,049 604,231
Consultants 243,100 121,876 243,100 121,876
Contractors 1,102,179 884,532 1,102,179 884,532
Donations paid 18,317 18,581 18,317 18,581
AASB 140.75(f)(ii) Investment property expenses (property generating income) 5,999 5,297 5,999 5,297
AASB 140.75(f)(iii) Investment property expenses (property not generating income) 1,482 1,031 1,482 1,031
Power 302,861 278,749 282,543 258,746
Repairs and maintenance 963,102 802,549 849,860 701,548
AASB 117.35( c) Rentals - operating leases 12,449 12,449 12,449 12,449
Subscriptions and registrations 193,017 241,065 193,017 241,065
Travel 599,048 323,601 599,048 323,601
Other materials and services 230,140 223,488 193,828 186,557
5,305,461 4,206,662 4,985,460 3,896,663
8 Finance costs
AASB 7.20 Finance costs charged by the Queensland Treasury Corporation 709,925 921,854 709,925 921,854
Finance costs relating to other bank loans 3,276 - 3,276 -
Bank charges 26,665 27,652 26,665 27,652
Impairment of debts 1,974 632 1,974 632
Interest on finance leases 20,279 21,034 20,279 21,034
Quarry rehabilitation 3,784 3,327 3,784 3,327
Refuse restoration 67,422 65,452 67,422 65,452
833,325 1,039,951 833,325 1,039,951
AASB 116.48 9 Depreciation and amortisation
Depreciation of non-current assets
Land improvements 849 914 849 914
Buildings 101,875 89,029 90,626 78,213
Major plant 146,434 127,546 146,434 127,546
Other plant and equipment 264,952 175,445 240,840 152,909
Road, drainage and bridge network 2,690,151 3,029,011 2,690,151 3,029,011
Water 392,976 404,468 392,976 404,468
Sewerage 148,259 148,259 148,259 148,259
Other infrastructure assets 12,577 17,311 12,577 17,311
18 3,758,073 3,991,983 3,722,712 3,958,631
Amortisation of intangible assets
Software 19 3,000 3,000 3,000 3,000
Total depreciation and amortisation 3,761,073 3,994,983 3,725,712 3,961,631
Councillor remuneration represents salary, and other allowances paid in respect of carrying out their duties.
As a guide, councils should show separately any component of 'materials and services' which exceeds 10% of the total or which is individually likely to
be of significance to users.

Tropical Council
Notes to the financial statements
For the year ended 30 June 2018AASB 101.77, 97 Consolidated Council
2018 2017 2018 2017
Note $ $ $ $
Source Reference
10 Capital expenses
AASB 136.126(a) Loss on impairment
Non-current assets classified as held for sale 10,000 - 10,000 -
Property, plant and equipment
Total impairment losses 10,000 - 10,000 -
Impairment loss offset against asset revaluation surplus - - - -
Impairment loss treated as expense 10,000 - 10,000 -
AASB 136.130
Provision for restoration of land 23
Discount rate adjustment to refuse restoration provision - 26,517 - 26,517
Discount rate adjustment to quarry rehabilitation liability - 7,617 - 7,617
- 34,134 - 34,134
AASB 116.40 Revaluation decrement
Revaluation down of property, plant and equipment 18 - 314,214 - 314,214
- 314,214 - 314,214
Loss on transfer of assets via finance lease
Book value of property, plant and equipment transferred 2,826,153 - 2,826,153 -
Less: Initial recognition of finance leases 461,430 - 461,430 -
2,364,723 - 2,364,723 -
Total capital expenses 2,374,723 348,348 2,374,723 348,348
AASB 107.6 & 45 11 Cash and cash equivalents
Cash at bank and on hand 2,235,156 1,528,922 1,860,330 1,187,278
Deposits at call 3,500,000 1,000,000 3,500,000 1,000,000
Term deposits - 1,750,000 1,750,000
Less bank overdraft - (2,400) - (2,400)
Balance per Statement of Cash Flows 5,735,156 4,276,522 5,360,330 3,934,878
AASB 107.48 Externally imposed expenditure restrictions at the reporting date
relate to the following cash assets:
Unspent government grants and subsidies - 10,750 - 10,750
Unspent loan monies - 262,266 - 262,266
*Internally imposed expenditure restrictions at the reporting date:
Future capital works 146,000 46,000 146,000 46,000
Future asset replacement 1,939,332 1,156,332 1,939,332 1,156,332
Future constrained works 1,522,864 832,392 1,522,864 832,392
Future recurrent expenditure 197,800 112,800 197,800 112,800
Total unspent restricted cash 3,805,996 2,420,540 3,805,996 2,420,540
* These restrictions were previously allocated as reserves
Not mandatory
Local government
legislation
Trust funds held for outside parties
Monies collected or held on behalf of other entities yet to be paid
out to or on behalf of those entities
73,058 33,258 73,058 33,258
Security deposits 13,902 32,381 13,902 32,381
86,960 65,639 86,960 65,639
Funds held in trust by outside parties
Ove Arup 10,000 10,000 10,000 10,000
10,000 10,000 10,000 10,000
ATSI Councils - 40
year lease
Council's cash and cash equivalents are subject to a number of internal and external restrictions that limit amounts available for discretionary or
future use. These include:
Cash and cash equivalents include cash on hand, all cash and cheques receipted but not banked at the year end, deposits held at call with
financial institutions, other short-term, highly liquid investments with original maturities of three months or less that are readily convertible to cash
and which are subject to an insignificant risk of changes in value, and bank overdrafts.
The loss on impairment of assets classified as held for sale arises because on transfer of land from property, plant and equipment it is no longer
measured at its fair value but at fair value less disposal costs (note 15). The impairment loss of $10,000 is the estimated amount of the disposal
costs.
The discount rate adjustment to the quarry rehabilitation liability was adjusted against expenses as there was an insufficient asset revaluation
surplus in the relevant asset class.
Cash and deposits at call are held in the National Australia Bank in normal term deposits and business cheque accounts. The bank currently has
a short term credit rating of A1+ and long term rating of AA-.
In accordance with the Local Government Act 2009 and Local Government Regulation 2012 , a separate trust bank account and separate
accounting records are maintained for funds held on behalf of outside parties. Funds held in the trust account include those funds from the sale of
land for arrears in rates, deposits for the contracted sale of land, security deposits lodged to guarantee performance and unclaimed monies (e.g.
wages). The Council performs only a custodian role in respect of these monies and because the monies cannot be used for Council purposes,
they are not considered revenue nor brought to account in the financial statements.
Some funds belonging to Council are held in the trust funds of third parties. These include grants for water and sewerage infrastructure.

Tropical Council
Notes to the financial statements
For the year ended 30 June 2018AASB 101.77, 97 Consolidated Council
2018 2017 2018 2017
Note $ $ $ $
Source Reference
AASB 101.78(b) 12 Receivables
AASB 139.43
AASB 7.21
AASB 136.59 & 63
AASB 139.43
Current
Rateable revenue and utility charges 278,568 392,112 278,712 392,256
Water charges not yet levied 39,824 36,043 39,824 36,043
Housing rental 95,464 67,500 95,464 67,500
Other debtors 839,486 318,412 839,486 318,412
AASB 139.63 Less impairment - (3,547) - (3,547)
GST recoverable 7,639 31,593 7,639 31,593
Loans and advances to controlled entities and associates - - 45,000 45,000
AASB 101.78(b) Prepayments 121,929 15,949 121,929 15,949
1,382,910 858,062 1,428,054 903,206
Non-current
Loans and advances to community organisations 150,000 150,000 150,000 150,000
Loans and advances to controlled entities and associates - - 720,000 765,000
150,000 150,000 870,000 915,000
AASB 7.36 &37
AASB7.16 Movement in accumulated impairment losses (other debtors) is as
follows:
Opening balance at 1 July 3,547 1,323 3,547 1,323
Impairment Debts written off during the year 3,547 - 3,547 -
Additional impairments recognised - 2,224 - 2,224
Impairments reversed - - - -
Closing Balance at 30 June - 3,547 - 3,547
13 Inventories
AASB 102.8 &
AASB 102AUS8.1
Inventories held for sale
Miscellaneous saleable items 1,000 1,500 1,000 1,500
Supermarket stock 250 - 250 -
Other trading stocks 250 - 250 -
1,500 1,500 1,500 1,500
AASB 102.Aus9.1 Inventories held for distribution
Quarry and road materials 957 210,500 957 210,500
Plant and equipment stores 1,500 8,006 1,500 8,006
2,457 218,506 2,457 218,506
Land purchased for development and sale 230,000 230,000 230,000 230,000
Total inventories 233,957 450,006 233,957 450,006
Debtors should include GST where applicable.
Interest is charged on outstanding rates at a rate of 11% per annum. No interest is charged on other debtors. There is no concentration of credit
risk for rates and utility charges, fees and other debtors receivable.
Loans relate to advances made to various sporting bodies. These loans arise from time to time and are subject to negotiated interest rates. The
credit risk on these loans is considered low.
Loans and advances are recognised in the same way as other receivables.
Receivables are amounts owed to council at year end. They are recognised at the amount due at the time of sale or service delivery. Settlement
is required within 30 days after the invoice is issued.
Debts are regularly assessed for collectability and allowance is made, where appropriate, for impairment. All known bad debts were written-off at
30 June. If an amount is recovered in a subsequent period it is recognised as revenue.
Subsequent recoveries of amounts previously written off in the same period are recognised as finance costs in the Statement of Comprehensive
Income.
Because Council is empowered under the provisions of the Local Government Act 2009 to sell an owner's property to recover outstanding rate
debts, Council does not impair rate receivables.
The loss is recognised in finance costs. The amount of the impairment is the difference between the asset’s carrying amount and the present
value of the estimated cash flows discounted at the effective interest rate.
AASB 102.36(a) &
Aus36.1 Stores, raw materials and water held for resale are valued at the lower of cost and net realisable value and include, where applicable, direct
material, direct labour and an appropriate portion of variable and fixed overheads. Costs are assigned on the basis of weighted average cost.
Inventories held for distribution are:
- goods to be supplied at no or nominal, charge, and
- goods to be used for the provision of services at no or nominal, charge.
These goods are valued at cost, adjusted, when applicable, for any loss of service potential.
Land acquired by Council with the intention of reselling it (with or without further development) is classified as inventory. This land is valued at the
lower of cost or net realisable value. As an inventory item, this land held for resale is treated as a current asset. Proceeds from the sale of this
land will be recognised as sales revenue on the signing of a valid unconditional contract of sale.

Tropical Council
Notes to the financial statements
For the year ended 30 June 2018AASB 101.77, 97 Consolidated Council
2018 2017 2018 2017
Note $ $ $ $
Source Reference
14 Other financial assets
AASB 139
AASB117.47(f)
AASB117.47(b)-(e)
Current
Finance leases 20,090 - 20,090 -
20,090 - 20,090 -
Non-current
Finance leases 512,991 - 512,991 -
512,991 - 512,991 -
AASB117.47(a) A reconciliation between the gross investment in the lease and the
fair value of lease payments is as follows:
Gross minimum lease payments receivable:
Not later than one year 20,090 - 20,090 -
Later than one year but not later than five years 80,360 - 80,360 -
Later than five years 698,128 - 698,128 -
798,578 - 798,578 -
Add: Estimated contingent rent 542,383 - 542,383 -
Less: Present value adjustment (807,880) - (807,880) -
Fair value of lease payments 533,081 - 533,081 -
The fair value of lease payments are receivable as follows:
Not later than one year 20,090 - 20,090 -
Later than one year but not later than five years 75,246 - 75,246 -
Later than five years 437,744 - 437,744 -
533,081 - 533,081 -
Movements in finance leases were as follows:
Opening balance - - - -
Add: Initial recognition of new leases 521,194 - - -
Less: Lease receipts (4,900) - - -
Add: Gain on revaluation 16,787 - - -
Closing balance 533,081 - - -
AASB 5.30 & 41 15 Non-current assets held for sale
AASB 5
Council has decided to sell land previously used as a depot as it is
no longer required. It has been placed with real estate agents and
is expected to be sold within one year.
100,000 - 100,000 -
Internal transfer from land and improvements 100,000 - 100,000 -
Impairment adjustment in period 10 (10,000) - (10,000) -
90,000 - 90,000 -
AASB 136.130 (f),
AASB13.93
Land classified as held for sale during the reporting period was measured at the lower of its carrying amount and fair value less cost to sell at the
time of reclassification. The fair value of the land was determined using the sales comparison approach. Sales prices of comparable land sites in
close proximity are adjusted for differences in key attributes such as property size. The most significant inputs into this valuation approach are
price per square metre. The land is categorised as a level 2 valuation. Disposal costs were estimated based on commission rates charged by the
real estate agents that have been engaged and legal costs quoted by council's solicitors.
Council has leased (insert number of dwellings under lease) dwellings as lessor to the Queensland Government for 40 years. The total lease
payment per dwelling in the current year was (insert the amount of the rent component plus the rates component - $2,800 for 2010-11). These
lease payments are required to be adjusted each year by the change in the Consumer Price Index (All Groups) for Brisbane. As the gross lease
payments are insufficient to cover the fair value (depreciated replacement cost) of the leased properties, there is no interest rate implicit in the
leases and therefore no finance income will arise from the leases. Consequently, the leases are recognised at the present value of the expected
future lease payments receivable (fair value). Gains on revaluation of finance lease assets are recognised as other income.
There is nil unearned finance income, unguaranteed residual values accruing to the benefit of Council, accumulated allowance for uncollectible
minimum lease payments receivable or contingent rents recognised as income applicable to the leases.
The calculation of fair value has included an estimate of average annual CPI increases of (insert rate used for current year, and prior year if
applicable) and a discount rate of (insert rate used for current year, and prior year if applicable.
Items of property, plant and equipment are reclassified as non-current assets as held for sale when the carrying amount of these assets will be
recovered principally through a sales transaction rather than continuing use. Non-current assets classified as held for sale are available for
immediate sale in their present condition and management believe the sale is highly probable. Non-current assets held for sale are measured at
the lower of their carrying amount and fair value less cost to sell and are not depreciated. On the eventual sale of these assets a gain or loss is
recognised.
Other financial assets are recognised at cost, with the exception of finance leases.

Tropical Council
Notes to the financial statements
For the year ended 30 June 2018AASB 101.77, 97 Consolidated Council
2018 2017 2018 2017
Note $ $ $ $
Source Reference
AASB 7 16 Investments
AASB 127.10 Interest in controlled entity Tropical Sunset Retirement Home Pty
Ltd
- - 1,080,000 1,080,000
AASB 131.38 XYZ Events Pty Ltd (Joint venture) 1,015,715 972,849 1,015,715 972,849
1,015,715 972,849 2,095,715 2,052,849
AASB 127.10 &
AASB 7.29(b) & 30
AASB 12.7(a),
AASB 10.IG18
AASB 12.10(a)(ii)
&12
16 Investments Consolidated Council
2018 2017 2018 2017
Note $ $ $ $
Interest in controlled entity Tropical Sunset Retirement Home Pty
Ltd
- - 1,080,000 1,080,000
Joint venture 1,015,715 972,849 852,000 852,000
1,015,715 972,849 1,932,000 1,932,000
AASB 12.21(a)
AASB 11.16 & 24,
AASB 12.21(b) (i)
AASB 12.B12, B13
& B14
XYZ Events Pty Ltd:
Revenue 481,769 392,105
Expenses (318,748) (282,282)
163,021 109,823
- -
163,021 109,823
- -
163,021 109,823
Council’s interest in the joint venture is measured using the equity method.
The shares in the Tropical Sunset Retirement Home Pty Ltd are not traded on an active market and their fair value cannot be ascertained reliably.
Accordingly they are shown at cost.
Council’s interest in the joint venture is measured using the equity method in the consolidated financial statements and at cost in council's
separate financial statements.
AASB 12 requires the following information to be disclosed for each of the Council's material joint ventures. In these illustrative
financial statements Council has only one joint venture which, for the purposes of illustration, is assumed to be material.
The Council has a 33.3% (2017 - 33.3%) joint venture interest in XYZ Events Pty Ltd, the principal activity of which is to provide a venue for public
functions and entertainment. XYZ's principal place of business is 22 George Street, Sunnyville, Queensland. In accordance with ownership
interest Council holds 33.3% voting rights in the company.
XYZ Events Pty Ltd is a limited liability company and as such there is a legal seperation between the parties to the joint arrangement and the
company itself. There is no contractual or other arrangement, or circumstances which indicate that council, or any of the joint venturers, have
rights to the assets or obligations for the liabilities of the company. Council accounts for this joint venture using the equity method.
The following information has been extracted from XYZ Events Pty Ltd's financial statements which were prepared in accordance with Australian
Accounting Standards. A profit distribution of $11,420 was made in this financial year (2017 $7,150).
Profit or loss from continuing operations
Note: Where council produces consolidated financial statements and council financial statements, as shown in this model, then the "council" financial
statements are separate financial statements under AASB 127 Separate Financial Statements. That standard requires council to account for
subsidiaries, joint ventures and associates using cost or in accordance with AASB 9, in the separate financial statements. In this illustrative set of
financial statements this has not been applied in the joint venture that has been illustrated because of the confusion that will arise for the majority of
councils, which simply refer to the "council' column when preparing financial statements. Those councils that prepare consolidated financial
statements and have a joint venture or associate will need to ensure that AASB 127 is complied with when preparing the separate financial
statements. For example if the cost of the joint venture was $852,000 then note 16 would appear as follows:
As the holder of 90% of the shares in Tropical Sunset Retirement Home Pty Ltd, Council has 90% voting rights in the company enabling Council
to direct the company's activities. Council uses these rights to ensure that the company provides a safe, affordable and comfortable retirement
home for community residents, congruent with Council's policy objectives.
Other comprehensive income for the year
Total comprehensive income for the year
The remaining 10% of shares are held by a number of different community groups with similar policy objectives. These non-controlling interests
are not material to the consolidated entity.
Post-tax profit or loss from discontinued operations
Profit (loss) for the year
The Council's investment in the controlled entity, the Tropical Sunset Retirement Home Pty Ltd , is accounted for at cost in the Council's separate
financial statements. This investment is eliminated in the financial statements of the economic entity upon consolidation. The shares in the
Tropical Sunset Retirement Home Pty Ltd are not traded on an active market and their fair value cannot be ascertained reliably.

Tropical Council
Notes to the financial statements
For the year ended 30 June 2018AASB 101.77, 97 Consolidated Council
2018 2017 2018 2017
Note $ $ $ $
Source Reference
AASB 12.B13
Depreciation and amortisation 17,524 15,523
interest income 20,000 21,000
interest expense - -
income tax expense - -
XYZ Events Pty Ltd:
Current assets 498,480 315,748
Non-current assets 2,649,492 2,673,096
Total assets 3,147,973 2,988,844
Current liabilities 96,147 66,090
Non-current liabilities 1,631 1,288
Total liabilities 97,778 67,378
Net assets 3,050,195 2,921,465
AASB 12.B13 The above amounts include:
Cash and cash equivalents 12,900 7,569
Current financial liabilities (excluding trade and other payables and
provisions)
- -
Non-current financial liabilities (excluding trade and other payables
and provisions)
- -
AASB 12.B14(b)
Net assets 3,050,195 2,921,465
Ownership interest in the joint venture 33% 33%
other adjustments (specify)
Carrying amount of the Council's interest in the joint venture 1,015,715 972,848
Carrying amount at the beginning of the financial year 972,849 943,428
Share of profit (loss) 3(f) 54,286 36,571
Distribution received (11,420) (7,150)
Carrying amount at the end of financial year 1,015,715 972,849
The movement in the carrying amount of the Council's investment in the joint venture is as follows:
The company's net assets reconcile to to the carrying amount of the investment as follows:
The above profit (loss) for the year includes:

Tropical Council
Notes to the financial statements
For the year ended 30 June 2018AASB 101.77, 97 Consolidated Council
2018 2017 2018 2017
Note $ $ $ $
Source Reference
AASB 140 17 Investment property
AASB 140 para 5-
20
AASB 140 para 20-
56, 75(a)
AASB 140 para
8(e), 53, 54
Investment property does not include community housing.
AASB 140.75(f)(i)
AASB 140 Para 35
AASB 140.76 Fair value at beginning of financial year 420,000 420,000 420,000 420,000
Revaluation adjustment to the income account 5 56,000 - 56,000 -
Transfer of land held for unascertained future purposes from
property, plant and equipment
14,400 - 14,400 -
Fair value at end of financial year 490,400 420,000 490,400 420,000
Investment property comprises:
- rental property
- the 'Big Window' buildings and plant
How we determined the fair value of rental property
AASB140.75 (e)
AASB 13.93 (d)
Income from investment property is shown in Note 3(c). Expenses in respect of investment property are shown in Note 7.
- land which is held for future development or an undetermined future use.
Investment property is property held for the primary purpose of earning rentals and/or capital appreciation. This includes land held by Council for a
currently undetermined future use.
Investment property is initially recognised at cost (including transaction costs) and subsequently at fair value. Where investment property is
acquired at no or nominal cost it is recognised at fair value.
Property that is being constructed or developed for future use as investment property is also classified as investment property. Investment
property under construction is measured at fair value, unless fair value cannot be reliably determined for an individual property (in which case the
property concerned is measured at cost until fair value can be reliably determined).
Gains or losses arising from changes in the fair value of investment property are recognised as incomes or expenses respectively for the period in
which they arise. Investment property is not depreciated and is not tested for impairment.
Council obtains independent valuations from a professional valuer at least every 3 years for all rental properties. The last valuation was
undertaken by J Long Valuers as at 30 June 2018.
Council's rental properties are all residential properties in areas with regular sales of comparable properties. Therefore they were valued using the
sales comparison approach. Sales prices of comparable residential properties in close proximity are adjusted for differences in key attributes such
as property size. The most significant input into this approach is price per square metre of land, price per square metre of living area and number
of bedrooms.
It is a requirement of AASB 140 that investment property held at fair value is revalued each year and that the increment / decrement is taken to the
Statement of Comprehensive Income in profit or loss. While Tropical shows a $0 revaluation adjustment in 2017, in practice a council must undertake
a revaluation each year in order to comply with AASB 140.
Pursuant to accounting standard AASB 140 Investment Property , property that is being constructed or developed for future use as investment
property is now classified as investment property rather than as property, plant and equipment. Investment property under construction is measured at
fair value, unless fair value cannot be reliably determined for an individual property (in which case the property concerned is measured at cost until fair
value can be reliably determined).
AASB 140 defines investment property as "...held (by the owner or by the lessee under a finance lease) to earn rentals or for capital appreciation or
both, rather than for:
(a) use in the production or supply of goods or services or for administrative purposes...."
Therefore councils need to determine the purpose for which land or buildings are held before classifying them as investment property.
Land and buildings that are held for community housing, for example are not held primarily for rental and therefore should not be
classified as investment property.

Tropical Council
Notes to the financial statements
For the year ended 30 June 2018AASB 101.77, 97 Consolidated Council
2018 2017 2018 2017
Note $ $ $ $
Source Reference
How we determined the fair value of the "Big Window"
AASB140.75 (e)
AASB13.93(d) &
(h)(i)
Significant unobservable input Range of
inputs
Relationship of
unobservable
inputs to fair
value
Change in fair
value arising
from 1%
increase in
input
Change in fair
value arising
from 1%
decrease in
inputDiscount rate 3.5-4.5%(4%) The higher the
discount rate,
the lower the
fair value.
-$ 11,841 $ 12,986
Capitalisation rate 4.3-
4.7%(4.4%)
-$ 32,500 $ 53,121
Expected vacancy rate 8-9% (8.5%) -$ 4,992 $ 4,992
Rental growth rate 2.5-4%(3.5%) The higher the
rental growth
rate, the higher
the fair value.
$ 12,523 -$ 9,750
Condition rating(remaining useful life) new-5.5 (100%-
0%)
The higher the
condition
rating, the
lower the fair
value.
-$ 2,005 $ 2,005
Residual value $0 - $15,000 The higher the
residual value
the higher the
fair value.
A $1,000
increase in
residual value
will increase
fair value by
A $1,000
decrease in
residual value
will decrease
fair value by
How we determined the fair value of land
AASB13.93
The resulting estimate of fair value is classed as a level 3 valuation under AASB 13 because it is based on a number of "unobservable" inputs.
The table below describes the significant unobservable inputs used in this valuation together with a description of the valuation's sensitivity to
changes in those inputs.
Land fair values were determined by independent valuer, J Long Valuers effective 30 June 2018. They were valued using the sales comparison
approach.Sales prices of comparable land sites in close proximity were adjusted for differences in key attributes such as property size. The most
significant inputs into this valuation approach are price per square metre.
The higher the
capitalisation
rate and
expected
vacancy rate,
the lower the
fair value
- discounted cash flow projections based on reliable estimates of future cash flows
- the replacement cost of the buildings adjusted for depreciation
- current prices for properties of a different nature, in close proximity to the "Big window", and recent prices of similar properties in other areas,
adjusted to reflect differences.
The "Big Window" comprises a number of unique buildings that are leased out under operating lease. Because of its unique nature the "Big
window" is difficult to value and a number of asssumptions and judgements must be made. The last valuation was derived by J Long Valuers,
independent professional valuers, at 30 June 2017 ($205,100). J Long Valuers have considerable experience valuing similar investments and
made the valuation after considering a range of different calculations based on the following:

Tropical Council
Notes to the financial statements
For the year ended 30 June 2018
18 Property, plant and equipment
AASB 116.73 Consolidated - 30 June 2018 Note Total
Basis of measurement Fair Value Fair Value Fair Value Cost Fair Value Fair Value Fair Value Fair Value Cost
Fair value category Level 2 Levels 2 & 3 Level 2 Level 3 Level 3 Level 3 Level 3
Asset values $ $ $ $ $ $ $ $ $ $
Opening gross value as at 1 July 2017 4,050,985 5,722,838 2,211,181 2,254,214 78,630,365 23,086,180 7,070,212 186,203 762,102 123,974,280
Additions* - 30,435 301,428 120,976 - - - 44,117 1,300,258 1,797,214
Disposals 5 (113,200) (2,826,153) (154,210) (62,197) - (2,332,641) - - - (5,488,401)
Revaluation adjustment to other comprehensive
income(asset revaluation surplus)
26 110,250 42,618 - - 1,025,511 (30,195) - - - 1,148,184
Revaluation adjustment to income (capital income) 5 - - - - 314,214 - - - - 314,214
Assets classified as held for sale 15 (100,000) - - - - - - - - (100,000)
Assets transferred to investment property 17 (14,400) - - - - - - - - (14,400)
Transfers between classes - - - 412,584 803,572 - - (1,216,156) -
Closing gross value as at 30 June 2018 3,933,635 2,969,738 2,358,399 2,312,993 80,382,674 21,526,916 7,070,212 230,320 846,204 121,631,091
Accumulated depreciation and impairment
Opening balance as at 1 July 2017 6,076 1,813,032 659,845 1,130,143 30,527,153 7,929,207 3,511,411 91,562 - 45,668,429
Depreciation provided in period 9 849 101,875 146,434 264,952 2,690,151 392,976 148,259 12,577 - 3,758,073
Depreciation on disposals 5 - - (26,107) (85,449) - (612,320) - - - (723,876)
Revaluation adjustment to asset revaluation surplus 26 - 646 - - (1,104,603) (15,810) - - - (1,119,767)
Impairment adjustment to asset revaluation surplus 26 - - - - - - - - -
Impairment adjustment to Income 10 - - - - - - - -
Assets transferred to investment property 17 - - - - - - - - - -
Transfers between classes - - - - - - - - - -
Accumulated depreciation as at 30 June 2018 6,925 1,915,553 780,172 1,309,646 32,112,701 7,694,053 3,659,670 104,139 - 47,582,859
Consolidated book value as at 30 June 2018 3,926,710 1,054,185 1,578,227 1,003,347 48,269,973 13,832,863 3,410,542 126,181 846,204 74,048,232
Residual value 3,921,610 800,000 453,970 78,000 - - - - - -
Range of estimated useful life in years Land: Not
depreciated.
Improvements
: 7 - 40
40 - 100 12 2 - 20 5 - 100 20 - 80 20 - 60 20 - 40 - -
Current-year financial
sustainability statement
Additions comprise:
$ $ $ $ $ $ $ $ $ $
Renewals 1,002,650 1,002,650
Other additions 30,435 301,428 120,976 44,117 297,608 794,564
Total additions - 30,435 301,428 120,976 - - - 44,117 1,300,258 1,797,214
- - - - - - - - - -
Source Reference
Buildings Other plant
and
equipment
Land and
improvements
Major plant
AASB 136.126
# Note these two figures must agree
Work in
progress
Road,
drainage and
bridge
network
Water Sewerage Other
infrastructure
assets

18 Property, plant and equipment
Tropical Council
Notes to the Financial Statements
For the year ended 30 June 2018
AASB 116.73 Consolidated - 30 June 2017 Note Total
Basis of measurement Fair Value Fair Value Fair Value Cost Fair Value Fair Value Fair Value Fair Value Cost
Fair value category Level 2 Levels 2 & 3 Level 2 Level 3 Level 3 Level 3 Level 3
Asset values $ $ $ $ $ $ $ $ $
Opening gross value as at 1 July 2016 3,998,485 5,607,626 1,983,254 1,888,126 77,420,964 23,065,805 7,070,212 180,955 419,543 121,634,970
Adjustment to opening value 34 - - - - 1,600,023 - - - - 1,600,023
Additions - 120,888 272,500 535,028 - - - 5,248 1,586,308 2,519,972
Disposals 5 - - (183,400) (168,940) - - - - - (352,340)
Revaluation adjustment to other comprehensive
income(asset revaluation surplus)
26 52,500 (5,676) 138,827 - - (27,296) - - - 158,355
Revaluation adjustment to income (capital income) 5 - - - - (1,586,700) - - - - (1,586,700)
Assets classified as held for sale 15 - - - - - - - - - -
Assets transferred to investment property 17 - - - - - - - - - -
Transfers between classes - - - - 1,196,078 47,671 - - (1,243,749) -
Closing gross value as at 30 June 2017 4,050,985 5,722,838 2,211,181 2,254,214 78,630,365 23,086,180 7,070,212 186,203 762,102 123,974,280
Accumulated depreciation and impairment
Opening balance as at 1 July 2016 5,162 1,723,691 594,976 1,142,916 28,474,384 7,529,026 3,363,152 74,251 - 42,907,558
Adjustment to opening value 34 - - - - 296,244 - - - - 296,244
Depreciation provided in period 9 914 89,029 127,546 175,445 3,029,011 404,468 148,259 17,311 - 3,991,983
Depreciation on disposals 5 - (104,325) (188,218) - - - - - (292,543)
Revaluation adjustment to asset revaluation surplus 26 - 312 41,648 - - (4,287) - - - 37,673
Impairment adjustment to asset revaluation surplus 26 - - - - - - - - - -
Impairment adjustment to income - - - - - - - - - -
Revaluation adjustment to income 5 - - - - (1,272,486) - - - - (1,272,486)
Transfers between classes - - - - - - - - - -
Accumulated depreciation as at 30 June 2017 6,076 1,813,032 659,845 1,130,143 30,527,153 7,929,207 3,511,411 91,562 - 45,668,429
Consolidated book value as at 30 June 2017 4,044,909 3,909,806 1,551,336 1,124,071 48,103,212 15,156,973 3,558,801 94,641 762,102 78,305,851
Residual value 4,015,920 800,000 452,701 850,000 23,487,016 - - - - -
Range of estimated useful life in years Land: Not
depreciated.
Improvements
: 7 - 40
40 - 100 12 2 - 20 5 - 100 20 - 80 20 - 60 20 - 40 - -
AASB 136.126
Land and
improvements
Buildings Other plant
and
equipment
Major plant
Source Reference
Work in
progress
Sewerage Other
infrastructure
assets
Road,
drainage and
bridge
Water

18 Property, plant and equipment
Tropical Council
Notes to the Financial Statements
For the year ended 30 June 2018
AASB 116.73 Council - 30 June 2018 Note Total
Basis of measurement Fair Value Fair Value Fair Value Cost Fair Value Fair Value Fair Value Fair Value Cost
Fair value category Level 2 Levels 2 & 3 Level 2 Level 3 Level 3 Level 3 Level 3
Asset values $ $ $ $ $ $ $ $ $ $
Opening gross value as at 1 July 2017 2,948,485 5,182,038 2,211,181 1,816,214 78,630,365 23,086,180 7,070,212 186,203 762,102 121,892,980
Additions - 30,435 301,428 120,976 - - - 44,117 1,300,258 1,797,214
Disposals 5 (113,200) (2,826,153) (154,210) (62,197) - (7,332,641) - - - (10,488,401)
Revaluation adjustment to other comprehensive
income(asset revaluation surplus)
26 47,508 21,632 - - 1,025,511 (30,195) - - - 1,064,456
Revaluation adjustment to income (capital income) 5 7,617 - - - 314,214 - - - - 321,831
Assets classified as held for sale 15 (100,000) - - - - - - - - (100,000)
Assets transferred to investment property 17 (14,400) - - - - - - - - (14,400)
Transfers between classes - - - - 412,584 803,572 - - (1,216,156) -
Closing gross value as at 30 June 2018 2,776,010 2,407,952 2,358,399 1,874,993 80,382,674 16,526,916 7,070,212 230,320 846,204 114,473,680
Accumulated depreciation and impairment
Opening balance as at 1 July 2017 6,076 1,791,504 659,845 1,086,407 30,527,153 7,929,207 3,511,411 91,562 - 45,603,165
Depreciation provided in period 9 849 90,626 146,434 240,840 2,690,151 392,976 148,259 12,577 - 3,722,712
Depreciation on disposals 5 - - (26,107) (85,449) - (5,612,320) - - - (5,723,876)
Revaluation adjustment to asset revaluation surplus 26 - 646 - - (1,104,603) (15,810) - - - (1,119,767)
Impairment adjustment to asset revaluation surplus 26 - - - - - - - - -
Impairment adjustment to income 10 - - - - - - - -
Assets classified as held for sale 15 - - - - - - - - - -
Assets transferred to investment property 17 - - - - - - - - - -
Transfers between classes - - - - - - - - - -
Accumulated depreciation as at 30 June 2018 6,925 1,882,776 780,172 1,241,798 32,112,701 2,694,053 3,659,670 104,139 - 42,482,234
Total written down value as at 30 June 2018 2,769,085 525,176 1,578,227 633,195 48,269,973 13,832,863 3,410,542 126,181 846,204 71,991,446
Residual value 2,769,085 250,000 453,970 136,000 - - - - -
Range of estimated useful life in years Land: Not
depreciated.
Improvements
: 7 - 40
40 - 100 12 2 - 20 5 - 100 10 - 60 20 - 60 20 - 40 -
Current-year financial
sustainability statement
Additions comprise:
$ $ $ $ $ $ $ $ $ $
Renewals 162,450 75,200 765,000 1,002,650
Other additions 30,435 138,978 45,776 44,117 535,258 794,564
Total additions - 30,435 301,428 120,976 - - - 44,117 1,300,258 1,797,214
- - - - - - - - - -
AASB 136.126
Source Reference
Water SewerageOther plant
and
equipment
Work in
progress
Land and
improvements
Buildings Major plant Other
infrastructure
assets
Road,
drainage and
bridge
network

18 Property, plant and equipment
Tropical Council
Notes to the Financial Statements
For the year ended 30 June 2018
AASB 116.73 Council - 30 June 2017 Note Total
Basis of measurement Fair Value Fair Value Fair Value Cost Fair Value Fair Value Fair Value Fair Value Cost
Fair value category Level 2 Levels 2 & 3 Level 2 Level 3 Level 3 Level 3 Level 3
Asset values $ $ $ $ $ $ $ $ $
Opening gross value as at 1 July 2016 2,948,485 5,087,626 1,983,254 1,464,126 77,420,964 23,065,805 7,070,212 180,955 419,543 119,640,970
Adjustment to opening value 34 - - - - 1,600,023 - - - - 1,600,023
Additions - 120,888 272,500 521,028 - - - 5,248 1,586,308 2,505,972
Disposals 5 - - (183,400) (168,940) - - - - - (352,340)
Revaluation adjustment to other comprehensive
income(asset revaluation surplus)
26 - (26,476) 138,827 - - (27,296) - - - 85,055
Revaluation adjustment to income (capital income) 5 - - - - (1,586,700) - - - - (1,586,700)
Assets classified as held for sale 15 - - - - - - - - - -
Assets transferred to investment property 17 - - - - - - - - - -
Transfers between classes - - - - 1,196,078 47,671 - - (1,243,749) -
Closing gross value as at 30 June 2017 2,948,485 5,182,038 2,211,181 1,816,214 78,630,365 23,086,180 7,070,212 186,203 762,102 121,892,980
Accumulated depreciation and impairment
Opening balance as at 1 July 2016 5,162 1,713,291 594,976 1,121,716 28,474,384 7,529,026 3,363,152 74,251 - 42,875,958
Adjustment to opening value 34 - - - - 296,244 - - - - 296,244
Depreciation provided in period 9 914 78,213 127,546 152,909 3,029,011 404,468 148,259 17,311 - 3,958,631
Depreciation on disposals 5 - - (104,325) (188,218) - - - - - (292,543)
Revaluation adjustment to asset revaluation surplus 26 - - 41,648 - - (4,287) - - - 37,361
Revaluation adjustment to income 5 - - - - (1,272,486) - - - (1,272,486)
Impairment adjustment to asset revaluation surplus 26 - - - - - - - - - -
Impairment adjustment to income - - - - - - - - - -
Assets classified as held for sale - - - - - - - - - -
Assets transferred to investment property - - - - - - - - - -
Transfers between classes - - - - - - - - - -
Accumulated depreciation as at 30 June 2017 6,076 1,791,504 659,845 1,086,407 30,527,153 7,929,207 3,511,411 91,562 - 45,603,165
Total written down value as at 30 June 2017 2,942,409 3,390,534 1,551,336 729,807 48,103,212 15,156,973 3,558,801 94,641 762,102 76,289,815
Residual value 2,942,409 250,000 452,701 128,000 23,487,016 - - - -
Range of estimated useful life in years Land: Not
depreciated.
Improvements
: 7 - 40
40 - 100 12 2 - 20 5 - 100 20 - 80 20 - 60 20 - 40 -
Land and
improvements
Buildings
AASB 136.126
Source Reference
Work in
progress
Other plant
and
equipment
Major plant Road,
drainage and
bridge
network
Water Sewerage Other
infrastructure
assets

18 Property, plant and equipment
AASB 116.
74(b)
Important information about impairment of local government assets
Many local government assets are unique, with no active market. The fair value of those assets is calculated using a cost based method known as current replacement cost. Due to the way that AASB 136
Impairment calculates impairment, assets that are measured in this way will never be impaired. Instead the fair value of the asset at 30 June should reflect any "impaired" condition. Local Government
Bulletin 16/2011 provides specific guidance on this issue.
However, assets that are measured at cost or fair value calculated using another method (eg market value) may be impaired in accordance with AASB 136.
AASB116 para 74 (b) requires financial statements to disclose the amount of expenditures recognised in the carrying amount of an item of property, plant and equipment in the course of its construction. In
previous versions of Tropical, work in progress has been disclosed in a separate note, but it has now been included in the above note as it forms part of property, plant and equipment. Many other illustrative
accounts also include WIP with property, plant and equipment.

Tropical Council
Notes to the financial statements
For the year ended 30 June 2018
18 Property, plant and equipment
18 (a) Recognition
LG Reg 2012
Section 206
AASB 1051.11 &
12
Land under roads
DLGCRR Local
Government
Bulletin 06/09
Deed of Grant in Trust Land
This note will only be applicable to the Northern Peninsula Regional Council and the Torres Strait Island Regional Council.
Land Act 1994
Crocodile Island
Turtle Island
Land Act 1994
18(b) Measurement
AASB 116.7,
AASB 116.29 -
31,73AASB 116.15
AASB 116.13
AASB116.Aus15.1
18(c) Depreciation
AASB 116.55
AASB116.50, 58 &
60
AASB 116.43 - 44
AASB 116.8
AASB 116.56
AASB 116.51
AASB 136 18(d) Impairment
AASB 136.9, 59, 6,
Aus6.1
Property, plant and equipment received in the form of contributions, are recognised as assets and revenues at fair value.
Source Reference
Plant and equipment with a total value of less than $5,000, and infrastructure assets and buildings with a total value of less than $10,000 are treated as
an expense in the year of acquisition. All other items of property, plant and equipment are capitalised.
Cost is determined as the fair value of the assets given as consideration plus costs incidental to the acquisition, including freight in, architect's fees and
engineering design fees and all other establishment costs.
This note will only be applicable to Aboriginal shire
Replacement of a major component of an asset, in order to maintain its service potential, is treated as the acquisition of a new asset. However, routine
operating maintenance, repair costs and minor renewals to maintain the operational capacity and useful life of the non-current asset is expensed as
incurred.
Expenditure incurred in accordance with Natural Disaster Relief and Recovery Arrangements on road assets is analysed to determine whether the
expenditure is capital in nature. The analysis of the expenditure requires Council engineers to review the nature and extent of expenditure on a given
asset. For example, expenditure that patches a road is generally maintenance in nature, whereas a kerb to kerb rebuild is treated as capital. Material
expenditure that extends the useful life or renews the service potential of the asset is capitalised.
Land under roads acquired before 30 June 2008 is recognised as a non-current asset where the Council holds title or a financial lease over the asset.
The Tropical Council currently does not have any such land holdings.
Land under the roads and reserve land which falls under the Land Act 1994 or the Land Title Act 1994 is controlled by the Queensland Government
pursuant to the relevant legislation. This land is not recognised in these financial statements.
The Council is located on land assigned to it under various Deeds of Grant in Trust (DOGIT) pursuant to Section 34I of the Land Act 1994. The land
comprises an area of approximately 3130 hectares, as follows:
The land is administered by the Department of Natural Resources and Mines and the Council has restricted use of this land for the benefit of island
inhabitants. The DOGIT land has not been taken up in the Council's assets as it cannot be reliably measured.
The Council is located on land assigned to it under a Deed of Grant in Trust (DOGIT) under Section 34I of the Land Act 1994. It comprises an area of
The depreciable amount of improvements to or on leasehold land is allocated progressively over the estimated useful lives of the improvements to the
Council or the unexpired period of the lease, whichever is the shorter.
The land is administered by the Department of Natural Resources and Mines and the Council has restricted use of this land for the benefit of shire
inhabitants. The DOGIT land has not been taken up in the Council's assets as it cannot be reliably measured.
The asset recognition threshold disclosed in the following note will depend on the amount set by council.
Property plant and equipment assets are initially recorded at cost. Subsequently, each class of property, plant and equipment is stated at cost or fair
value (as shown in the table above) less, where applicable, any accumulated depreciation and accumulated impairment loss.
Direct labour and materials and an appropriate proportion of overheads incurred in the acquisition or construction of assets are also included in their
cost.
Land is not depreciated as it has an unlimited useful life. Depreciation on other property, plant and equipment assets is calculated on a straight-line
basis so as to write-off the net cost or revalued amount of each depreciable asset, less its estimated residual value, progressively over its estimated
useful life to the Council. Management believe that the straight-line basis appropriately reflects the pattern of consumption of all Council assets.
Assets are depreciated from the date of acquisition or, in respect of internally constructed assets, from the time an asset is completed and
commissioned ready for use, at which time they are reclassified from work in progress to the appropriate property, plant and equipment class.
Where assets have separately identifiable components that are subject to regular replacement, these components are assigned useful lives distinct
from the asset to which they relate. Any expenditure that increases the originally assessed capacity or service potential of an asset is capitalised and
the new depreciable amount is depreciated over the remaining useful life of the asset to the Council.
Major spares purchased specifically for particular assets that are above the asset recognition threshold are capitalised and depreciated on the same
basis as the asset to which they relate.
Depreciation methods, estimated useful lives and residual values of property, plant and equipment assets are reviewed at the end of each reporting
period and adjusted where necessary to reflect any changes in the pattern of consumption, physical wear and tear, technical or commercial
obsolescence, or management intentions. The condition assessments performed as part of the annual valuation process for assets measured at
written down current replacement cost are used to estimate the useful lives of these assets at each reporting date.
Property, plant and equipment is assessed for indicators of impairment annually. If an indicator of possible impairment exists, the Council determines
the asset's recoverable amount. Any amount by which the asset's carrying amount exceeds the recoverable amount is recorded as an impairment
loss.

Tropical Council
Notes to the financial statements
For the year ended 30 June 2018
Source Reference
AASB 136.60
AASB 136.117 &
119
18(e) Major Plant
This distinction is no longer required by legislation, however some councils may wish to keep this policy.
18(f) Valuation
(i) Valuation processes
AASB 13.93(g)
AASB116.36,
AASB 13.93(g)
AASB 116.
Aus39.1, Aus40.1
& Aus40.2
AASB 116.35
AASB13.93 (c),
(e)(iv) There were no transfers between levels 1 and 2 during the year, nor between levels 2 and 3.
AASB13.95,
93(e)(iv) Council's policy is to recognise transfers in and out of the fair value hierarchy levels as at the end of the reporting period.
Council's valuation policies and procedures are set by the finance committee of the executive management team which comprises the Chief Executive
Officer, Chief Finance Officer, Director of Finance and Director of Internal Audit. They are reviewed annually taking into consideration an analysis of
movements in fair value and other relevant information.
An impairment loss is recognised as an expense in the Statement of Comprehensive Income, unless the asset is carried at a revalued amount. When
the asset is measured at a revalued amount, the impairment loss is offset against the asset revaluation surplus of the relevant class to the extent
available.
Where an impairment loss subsequently reverses, the carrying amount of the asset is increased to the revised estimate of its recoverable amount, but
so that the increased carrying amount does not exceed the carrying amount that would have been determined had no impairment loss been recognised
for the asset in prior years. A reversal of an impairment loss is recognised as income unless the asset is carried at a revalued amount, in which case
the reversal of the impairment loss is treated as a revaluation surplus increase.
Plant with a cost in excess of $150,000, which is prone to a high degree of price fluctuations or in danger of becoming obsolete, is classified as major
plant. This asset class primarily includes specialised earthmoving equipment.
Non-current physical assets measured at fair value are revalued, where required, so that the carrying amount of each class of asset does not
materially differ from its fair value at the reporting date. This is achieved by engaging independent, professionally qualified valuers to determine the fair
value for each class of property, plant and equipment assets at least once every 3 years. This process involves the valuer physically sighting a
representative sample of Council assets across all asset classes and making their own assessments of the condition of the assets at the date of
inspection.
In the intervening years, Council uses internal engineers and asset managers to assess the condition and cost assumptions associated with all
infrastructure assets, the results of which are considered in combination with an appropriate cost index for the region. Together these are used to form
the basis of a management valuation for infrastructure asset classes in each of the intervening years. With respect to the valuation of the land and
improvements, buildings and major plant asset classes in the intervening years, management engage independent, professionally qualified valuers to
perform a "desktop" valuation. A desktop valuation involves management providing updated information to the valuer regarding additions, deletions
and changes in assumptions such as useful life, residual value and condition rating. The valuer then determines suitable indices which are applied to
each of these asset classes.
An analysis performed by management has indicated that, on average, the variance between an indexed asset value and the valuation by an
independent valuer when performed is not significant and the indices used by Council are sound. Further details in relation to valuers, the methods of
valuation and the key assumptions used in valuing each different asset class are disclosed below.
If material increases/decreases are noted in asset values after an independent valuation is undertaken it could indicate that the previous index was not
appropriate and Council should revisit/change the index for future interim valuations.
- Fair value based on unobservable inputs for the asset and liability (level 3)
- Fair value based on quoted prices (unadjusted) in active markets for identical assets or liabilities (Level 1)
- Fair value based on inputs that are directly or indirectly observable, such as prices for similar assets, for the asset or liability (level 2)
Further disclosure in relation to identified asset classes need only be provided for material asset classes. Minor asset classes (such as other infrastructure
assets and major plant in this example) could potentially be excluded from further note disclosure on the bais of materiality.
Any revaluation increment arising on the revaluation of an asset is credited to the appropriate class of the asset revaluation surplus, except to the
extent it reverses a revaluation decrement for the class previously recognised as an expense. A decrease in the carrying amount on revaluation is
charged as an expense to the extent it exceeds the balance, if any, in the revaluation surplus of that asset class.
On revaluation, accumulated depreciation is restated proportionately with the change in the carrying amount of the asset and any change in the
estimate of remaining useful life. Separately identified components of assets are measured on the same basis as the assets to which they relate.
In accordance with AASB 13 fair value measurements are categorised on the following basis:

Tropical Council
Notes to the financial statements
For the year ended 30 June 2018
Source Reference
AASB13.93(d)
Land (level 2)
AASB13.93, AASB
116.77
Buildings (level 2 and 3)
AASB13.93, AASB
116.77
AASB 13.27
Buildings $ $
- Non-Specialised Buildings (level 2) 952,509 3,808,130
- Specialised Buildings (level 3) 101,676 101,676
Total 1,054,185 3,909,806
Major plant (Level 2)
AASB13.93, AASB
116.77
Infrastructure assets (level 3)
AASB13.93, AASB
116.77
Current replacement cost
While the unit rates based on square metres can be supported by market evidence (level 2), the estimates of residual value, useful life, pattern of
consumption and asset condition that are used to calculate accumulated depreciation comprise unobservable inputs (level 3). Where these other
inputs are significant to the valuation the overall valuation has been classified as level 3.
The fair value of buildings were also were determined by independent valuer, J Long Valuers effective 30 June 2018. Where there is a market for
Council building assets, they are categorised as non-specialised buildings and fair value is derived from the sales prices of comparable properties after
adjusting for differences in key attributes such as property size (level 2). The most significant inputs into this valuation approach were price per square
metre.
Where Council buildings are of a specialist nature and there is no active market for the assets, fair value has been determined on the basis of
replacement with a new asset having similar service potential including allowances for preliminaries and professional fees. The gross current values
have been derived from reference to market data for recent projects and costing guides issued by the Australian Institute of Quantity Surveyors,
Rawlinson's (Australian Construction Handbook). Where a depth in market can be identified, the net current value of a building asset is the difference
between the market value of the asset as a whole (including land) and the market value of the land component. Where there is no depth of market, the
net current value of a building asset is the gross current value less accumulated depreciation to reflect the consumed or expired service potential of the
asset.
In determining the level of accumulated depreciation the asset has been disaggregated into significant components which exhibit useful lives.
Allowance has been made for the typical asset life cycle and renewal treatments of each component, residual value at the time the asset is considered
to be no longer available for use and the condition of the asset. Condition was assessed taking into account both physical characteristics as well as
holistic factors such as functionality, capability, utilisation and obsolescence.
Tropical council has presented land and buildings on the basis that present use reflects highest and best use but each Council needs to consider such
disclosures on a case by case basis - refer AASB 13 para 27.
(ii) Valuation techniques used to derive fair values
The unit rates (labour and materials) and quantities applied to determine the CRC of an asset or asset component were based on a "Greenfield"
assumption meaning that the CRC was determined as the full cost of replacement with a new asset including components that may not need to be
replaced, such as earthworks. The DRC was determined using methods relevant to the asset class as described under individual asset categories
below.
The fair value of major plant is measured at current market value as at 30 June 2018 as independently determined by XAB and Associates, Registered
Valuers. Fair value was derived by reference to market based evidence including observable historical second hand sales data for specialised earth-
moving equipment of similar age, condition and specification. The key assumptions used in assessing the condition included site condition; type of
usage; major mechanical component condition; and machine hours. The fair value takes into account transport costs to transport the plant to market,
but does not include transaction costs.
Where an asset class covers both Level 2 and Level 3 as in this example, it should be disaggregated into subclasses (e.g. specialised and non-specialised).
The accompanying disclosure should explain why it is considered a Level 2 or 3 and the different basis of valuation and relevant inputs, as is demonstrated
above.
Land fair values were determined by independent valuer, J Long Valuers effective 30 June 2018. Level 2 valuation inputs were used to value land in
freehold title as well as land used for special purposes, which is restricted in use under current zoning rules. Sales prices of comparable land sites in
close proximity are adjusted for differences in key attributes such as property size. The most significant inputs into this valuation approach are price per
square metre.
All Council infrastructure assets were fair valued using written down current replacement cost. This valuation comprises the asset's current
replacement cost (CRC) less accumulated depreciation calculated on the basis of such cost to reflect the already consumed or expired future
economic benefits of the asset. Council first determined the gross cost of replacing the full service potential of the asset and then adjusted this amount
to take account of the expired service potential of the asset.
CRC was measured by reference to the lowest cost at which the gross future economic benefits of the asset could currently be obtained in the normal
course of business. Where existing assets were over designed, had excess capacity, or were redundant an adjustment was made so that the resulting
valuation reflected the cost of replacing the existing economic benefits based on an efficient set of modern equivalent assets to achieve the required
level of service output within the council's planning horizon.
Council categorises its road infrastructure into urban and rural roads and the further sub-categorises these into sealed and unsealed roads. Urban
roads are managed in segments of 200m, while rural roads are managed in 2km segments. All road segments are then componentised into formation,
pavement and seal (where applicable). Council assumes that environmental factors such as soil type, climate and topography are consistent across
each segment. Council also assumes a segment is designed and constructed to the same standard and uses a consistent amount of labour and
materials.
Roads

Tropical Council
Notes to the financial statements
For the year ended 30 June 2018
Source Reference
Accumulated depreciation
AASB13.93, AASB
116.77
Bridges
Current replacement cost
AASB13.93, AASB
116.77
Accumulated depreciation
3) The Surface Health Cracking Index (SHCI), which is a function of the percentage area of cracking, the annual rainfall and the lane-AADT. A larger
percentage cracking and annual rainfall combined with high traffic levels causes a migration of base and sub base material resulting in damage to the
underlying pavement from the ingress of water.
In determining the level of accumulated depreciation, remaining useful lives were calculated based on condition assessments. The condition
assessments were made using a seven point scale with 0 being the lowest and 6 being the highest. A 0 condition assessment indicates an asset with a
very high level of remaining service potential. 6 represents an asset at the end of its useful life.
A full valuation of bridges assets was undertaken by independent valuers, Australian Fair Valuers (AFV), effective 30 June 2018. Each bridge is
assessed individually, with the valuation varying according to the material type used for construction, the deck area, condition and size. Construction
estimates were determined on a similar basis to roads.
1) The Pavement Health Roughness Index (PHNI), which is a function of both the surface roughness and of lane average annual daily traffic
(AADT). Perfect health (as indicated by roughness) is retained for all traffic levels up to a roughness of 40 NAASRA (National Association of Australian
State Road Authorities) per roughness counts per kilometre.
The last full valuation of road infrastructure was undertaken effective 30 June 2016. CRC at 30 June 2018 was determined by Council engineers using
the ABS Producers' Price Index "Roads and Bridges Construction - Queensland (3101) A2333727L" which was x.x%. A full valuation of sealed roads
and associated infrastructure is planned in 2019.
4) The Surface Health Texture Index (SHTI), which is a function of the percentage of road affected by texture distresses, rainfall and lane AADT. The
index covers surface distresses caused by ravelling and stripping, leading to the loss of stone, which affects the waterproofing provided by the road
surface.
CRC was calculated by reference to asset linear and area specifications, estimated labour and material inputs, services costs, and overhead
allocations. Council assumes that pavements are constructed to depths of x cms for high traffic areas and y cms for lower traffic locations. Council also
assumes that all raw materials can be sourced from the local Tropicana Quarry with haulage rates of between $x and $y per tonne depending on the
location of the segment being valued. For internal construction estimates, material and services prices were based on existing supplier contract rates
or supplier price lists and labour wage rates were based on Council's Enterprise Bargaining Agreement (EBA). All direct costs were allocated to assets
at standard usage quantities according to recently completed similar projects. Where construction is outsourced, CRC was based on the average of
completed similar projects over the last few years.
2) The Pavement Health Rutting Index (PHRI), which is a function of mean rut depth, annual rainfall and lane AADT. Perfect health (as indicated by
rutting) is retained for all levels of traffic and rainfall until mean rut depth is 2mm.
In determining the level of accumulated depreciation, roads were disaggregated into significant components which exhibited different useful lives.
A consumption assessment was undertaken based on four Austroads pavement health indices, each expressed as a percentage and incorporated into
the World Bank's HDM deterioration model to provide an estimate of current health, the proportion of health remaining and the remaining useful lives of
the assets. The four health indices used were:

Tropical Council
Notes to the financial statements
For the year ended 30 June 2018
Source Reference
Drainage infrastructure
Current replacement cost
Accumulated depreciation
AASB13.93, AASB
116.77
Current replacement cost
Accumulated depreciation
Water and Sewerage
AASB13.93, AASB
116.77
Current replacement cost
Accumulated depreciation
Accumulated depreciation was determined through assessment of the remaining air space for each landfill cell, which was also used to determine
percentage cell capacity used in the year.
The Council region is split into 4 distinct areas based on geographic (coastal / rural / mountainous) and environmental factors (sand; acid sulphate soil;
soft rock; and hard rock). Council assumes that these factors are consistent across each of these 4 regions and that costs of labour are consistent
within each of these regions, depending on the materials used.
Carpo's cost models were derived from the following sources:
Waste Landfill Cells (Other Infrastructure)
• Carpo database
• Schedule rates for construction of asset or similar assets
• Cost curves derived by Carpo
• Depth factors - The depth of the trench (e.g. trenching above 1.5m requires shoring/ trench cage which increases costs
and slows production).
Water and sewerage infrastructure fair values were determined by independent valuers, Carpo (Qld) Pty Ltd effective 30 June 2018. CRC was
calculated based on expected replacement costs. In all cases the assets were disaggregated to component level to ensure a reliable measure of cost
and service capacity and deterioration of estimated remaining life.
• Building Price Index tables
Consistent with roads, Council assumes that environmental factors such as soil type, climate and topography are consistent across each segment and
that a segment is designed and constructed to the same standard and uses a consistent amount of labour and materials. Where drainage assets are
located underground and physical inspection is not possible, the age, size and type of construction material, together with current and planned
maintenance records are used to determine the fair value at reporting date. Construction estimates were determined on a similar basis to sewerage.
Estimates of expired service potential and remaining useful lives were determined on a straight line basis based on industry standard practices and
past experience, supported by maintenance programs.
In determining the level of accumulated depreciation, drainage assets were disaggregated into significant components which exhibited different useful
lives.
• Suppliers' quotations
Waste landfill cells fair values were determined by Council engineers effective 30 June 2018. CRC was calculated by reference to landfill cell area and
volume specifications, estimated labour and material inputs, services costs, and overhead allocations. Material and services costs were determined by
reference to existing supplier contracts and labour costs by reference to Council's EBA
A full valuation of drainage infrastructure was undertaken by independent valuers, GZD, effective 30 June 2018. Similar to roads, drainage assets are
managed in segments of 200m; pits, pipes and channels being the major components.
• Recent contract and tender data
• Rawlinson's Rates for building and construction, and
Factors taken into account in determining replacement costs included:
• Development factors - the area in which development takes place (e.g. rural areas would have little or no restoration
requirements, whereas a high density area would have large amounts of high quality footpaths, road pavements and
associated infrastructure that would require reinstatement, and would also require traffic control).
• Soil factors - The types of soil or other surface material (e.g. areas where soil is sandy are difficult to excavate and
would require shoring while areas where the soil is generally free of rock would not present any great difficulty for excavation).
Valuation unit rates (replacement costs) were increased by 20% to allow for project overheads including survey, environmental and investigation costs
(6%), engineering design (5%), planning (3%) and project management (6%).

Tropical Council
Notes to the financial statements
For the year ended 30 June 2018
Source Reference
• Where pipes have been relined, the total pipe useful life was determined as the pipe age when the reline occurred plus the reline life.
• The relining of pipes was valued at reline rates and depreciated over the reline life (70 years). The reline fair value was based on age.
AASB13.93(i)
Consolidated Council
2018 2017 2018 2017
Note $ $ $ $
19 Intangible assets
AASB 138.68 - 70
AASB 138.54
AASB 138.57 &
118
AASB 138.88, .100
& .104
Software
Opening gross carrying value 30,000 30,000 30,000 30,000
Additions
Disposals
Software under development
Transfers from software under
development
Closing gross carrying value 30,000 30,000 30,000 30,000
Accumulated amortisation
Opening balance 6,000 3,000 6,000 3,000
Amortisation in the period 3,000 3,000 3,000 3,000
Closing balance 9,000 6,000 9,000 6,000
Net carrying value at end of financial
year
21,000 24,000 21,000 24,000
AASB 138. 57 &
118
The software has a finite life estimated
at 10 years.
Straight line amortisation has been
used with no residual value.
Total intangible assets 21,000 24,000 21,000 24,000
Where there are material transfers into or out of level 3 of the fair value hierarchy, the reasons for those transfers must be disclosed. Otherwise, these
disclosures are not required as they are adequately covered by the PP&E movements reconciliation.
(iii) Changes in Fair Value Measurements using significant unobservable inputs (level 3)
Where site inspections were not conducted (i.e. for passive assets and active assets for which no site inspections were undertaken), the remaining
useful life was calculated on an age basis after taking into consideration current and planned maintenance records.
AASB 13 requires the fair value of non-financial assets to be calculated based on their "highest and best use". If the highest and best use of a non-financial
asset differs from its current use then this must be disclosed together with an explanation for why the asset is being used in a manner that differs from its
highest and best use.
For wastewater gravity mains the assumption that the pipes will be relined was adopted. The fair value for sewer gravity mains was determined as
follows:
• For all pipes, replacement cost was determined based on replacement by trench excavation, useful life was determined as the pipe useful life plus the
reline useful life, and the pipe fair value was based on age.
Amortisation methods, estimated useful lives and residual values are reviewed at the end of each reporting period and adjusted where appropriate.
Intangible assets with a cost or other value exceeding $10,000 are recognised as intangible assets in the financial statements, items with a lesser
value being expensed.
Expenditure on research activities relating to internally-generated intangible assets is recognised as an expense in the period in which it is incurred.
Costs associated with the development of computer software are capitalised and are amortised on a straight-line basis over the period of expected
benefit to Council.
In determining accumulated depreciation, assets were either subject to a site inspection or an assessment to determine remaining useful life. Where
site inspections were conducted (i.e. for active assets), the assets were allocated a condition assessment rating of between 1 and 5, which was used
to estimate remaining useful life - 1 being excellent with a remaining useful life of 95% and 5 being unserviceable with a remaining useful life of 5%.
The higher the condition rating, the lower the fair value.
AASB 138.118 -
128 In the following example, intangible assets only comprise internally generated software recognised at cost. Therefore the only movement for the year is
amortisation. The note should be customised to suit councils' operations by referring to the disclosure requirements in AASB 138.118 - 128. For example, if
impairment has been recognised then impairment losses need to be separately disclosed.

Tropical Council
Notes to the financial statements
For the year ended 30 June 2018
Source Reference
20 Payables
AASB101.69 &
AASB 119.8 - 16 &
128 - 130
AASB 119.14
AASB 119.10 & 11
Consolidated Council
2018 2017 2018 2017
Note $ $ $ $
Current
Creditors and accruals 523,770 731,036 523,770 731,037
Annual leave 285,863 428,339 285,863 428,339
Sick leave 98,323 118,308 98,323 118,308
Other entitlements 20,813 25,144 20,813 25,144
928,769 1,302,827 928,769 1,302,828
Non-current
Annual leave
- - - -
Creditors are recognised when goods or services are received, at the amount owed. Amounts owing are unsecured and are generally settled on 30
day terms.
Liabilities are recognised for employee benefits such as wages and salaries, sick, annual and long service leave in respect of services provided by the
employees up to the reporting date. The liability is calculated using the present value of remuneration rates that will be paid when the liability is
expected to be settled and includes related on-costs.
Discount rates as at 30 June are published each year by the department in a local government Bulletin available at http://dilgp.qld.gov.au/bulletins/local-
government/about-us/local-government-bulletins.html. These rates will assist in calculating non-current liabilities.
As Council does not have an unconditional right to defer settlement of the annual leave beyond twelve months after the reporting date, annual leave is
classified as a current liability.
The liability for salaries and wages is measured as the amount unpaid at the reporting date at current pay rates in respect of employees' services up to that
date.
Annual leave expected to be settled within 12 months are calculated on current wage and salary levels and includes related employee on-costs. Amounts
not expected to be settled within 12 months are calculated on projected future wage and salary levels and related employee on-costs, and are discounted to
present values.
Accounting for GST
Creditors should include GST where applicable. The net amount owing to or from ATO in respect of GST should also be shown under trade and other
payables, if a liability, or trade and other receivables, if an asset.
Classification of employee benefits
AASB 101 para 69 says “An entity shall classify a liability as current when:
(a) it expects to settle the liability in its normal operating cycle;
(b) it holds the liability primarily for the purpose of trading;
(c) the liability is due to be settled within twelve months after the reporting period; or
(d) it does not have an unconditional right to defer settlement of the liability for at least twelve months after the reporting period… .
An entity shall classify all other liabilities as non-current.”
On-costs such as further leave entitlement accruing during leave, employer's contribution, etc., should be included in the calculation of the liability. These on-
costs should reflect the real on-costs incurred by the Council.
Where a council does not have an unconditional right to defer settlement of the liability for at least 12 months, the non-current portion is still discounted, but
classified as a current liability, with disclosure of how much of the current liability is not expected to be taken within 12 months.
AASB119.11 &
153
Council has an obligation to pay sick leave on termination to certain employees and therefore a liability has been recognised for this obligation.

Tropical Council
Notes to the financial statements
For the year ended 30 June 2018
Source Reference
AASB 7.8 21 Borrowings
AASB 7.8(g)
AASB 123.Aus 8.1,
& Aus 26.1 , AASB
7.18
Debt policy is
required by the
Local Government
Regulation 2012,
disclosure optional
Consolidated Council
2018 2017 2018 2017
Note $ $ $ $
Current
Loans - Queensland Treasury
Corporation
2,682,337 986,582 2,682,337 986,582
Loans - other 15,000 22,000 15,000 22,000
Finance leases 22 18,010 17,221 18,010 17,221
2,715,347 1,025,803 2,715,347 1,025,803
Non-current
Loans - Queensland Treasury
Corporation
6,988,273 10,934,286 6,988,273 10,934,286
Loans - other 24,313 35,153 24,313 35,153
Finance leases 22 424,468 442,478 424,468 442,478
7,437,054 11,411,917 7,437,054 11,411,917
Not mandatory Loans - Queensland Treasury
CorporationOpening balance at beginning of
financial year
11,920,868 12,286,423 11,920,868 12,286,423
Loans raised - 550,000 - 550,000
Principal repayments (2,250,258) (915,555) (2,250,258) (915,555)
Book value at end of financial year 9,670,610 11,920,868 9,670,610 11,920,868
AASB 7.25 & 29
Not mandatory Loans - other
Opening balance at beginning of
financial year
57,153 - 57,153 -
Loans raised - 79,153 - 79,153
Repayments (17,840) (22,000) (17,840) (22,000)
Book value at end of financial year 39,313 57,153 39,313 57,153
AASB 7.14(a)
AASB 116.74 (a)
AASB 107. 50(a)
Borrowings are initially recognised at fair value plus any directly attributable transaction costs. Thereafter, they are measured at amortised cost.
Principal and interest repayments are made quarterly/semi annually/annually in arrears.
Council adopts an annual debt policy that sets out council's planned borrowings for the next nine years. Council's current policy is to only borrow for
capital projects and for a term no longer than the expected life of the asset. Council also aims to comply with the Queensland Treasury Corporation's
borrowing guidelines and ensure that sustainability indicators remain within acceptable levels at all times.
No assets have been pledged as security by the Council for any liabilities, however all loans are guaranteed by the Queensland Government.
On 30 October 2017, an overdraft facility with (insert name of financial institution) was approved with a limit of $500,000. This facility remained fully
undrawn at 30 June 2018 and is available for use in the next reporting period.
All borrowings are in $A denominated amounts and interest is expensed as it accrues. No interest has been capitalised during the current or
comparative reporting period. Expected final repayment dates vary from 31 December 2018 to 31 December 2023 (Available from QTC Maturity
Analysis). There have been no defaults or breaches of the loan agreement during the period.
The QTC loan market value at the reporting date was $9,491.673. This represents the value of the debt if Council repaid it at that date. As it is the
intention of Council to hold the debt for its term, no provision is required to be made in these accounts.

Tropical Council
Notes to the financial statements
For the year ended 30 June 2018
Source Reference
AASB 117.31 22 Finance leases
Consolidated Council
2018 2017 2018 2017
Note $ $ $ $
Not mandatory Movements in finance lease during the
reporting period were as follows:
Balance at beginning of financial year 668,750 706,250 668,750 706,250
Payments made in the period (37,500) (37,500) (37,500) (37,500)
Minimum lease payments 631,250 668,750 631,250 668,750
AASB 117.31(b) The above minimum lease payments
are payable as follows:
Not later than one year 37,500 37,500 37,500 37,500
Later than 1 year but not later than 5
years
150,000 150,000 150,000 150,000
Later than 5 years 443,750 481,250 443,750 481,250
Total minimum lease payments 631,250 668,750 631,250 668,750
Less: Future finance charges (188,772) (209,051) (188,772) (209,051)
Lease liability recognised in the
financial statements
442,478 459,699 442,478 459,699
Classified as:
Current 18,010 17,221 18,010 17,221
Non-current 424,468 442,478 424,468 442,478
442,478 459,699 442,478 459,699
The present value of above minimum
lease payments are payable as follows:
Not later than one year 36,741 36,741 36,741 36,741
Later than 1 year but not later than 5
years
131,559 131,559 131,559 131,559
Later than 5 years 274,178 291,399 274,178 291,399
442,478 459,699 442,478 459,699
AASB 117.31(e)
AASB 117.31(a)
Plant and equipment 425,000 450,000 425,000 450,000
23 Provisions
Long Service Leave
AASB 116.16(c ),
AASB 137.85 Refuse dump restoration and quarry rehabilitation
Interpretation 1
The provision for refuse restoration is calculated as the present value of anticipated future costs associated with the closure of the dump sites,
decontamination and monitoring of historical residues and leaching on these sites. The calculation of this provision requires assumptions such as
application of environmental legislation, site closure dates, available technologies and engineering cost estimates. These uncertainties may result in
future actual expenditure differing from amounts currently provided. Because of the long-term nature of the liability, the most significant uncertainty in
estimating the provision is the costs that will be incurred. The provision recognised for dump sites is reviewed at least annually and updated based on
the facts and circumstances available at the time. Management estimates that the site will close in 2019 and that the restoration will occur
progressively over the subsequent four years.
As refuse dumps are on state reserves / DOGIT land (amend to suit council) which the Council does not control, the provision for restoration is treated
as an expense in the year the provision is first recognised. Changes in the provision are treated as an expense or income.
The provision for long service leave represents the present value of the estimated future cash outflows to be made in respect of services provided by
employees up to the reporting date. The liability is calculated using current pay rates and projected future increases in those rates and includes related
employee on-costs. The estimates are adjusted for the probability of the employee remaining in the Council's employment or other associated
employment which would result in the Council being required to meet the liability. Adjustments are then made to allow for the proportion of the benefit
earned to date, and the result is discounted to present value. The interest rates attaching to Commonwealth Government guaranteed securities at the
reporting date are used to discount the estimated future cash outflows to their present value.
Where employees have met the prerequisite length of service and council does not have an unconditional right to defer this liability beyond 12 months
long service leave is classified as a current liability. Otherwise it is classified as non-current.
Leases of buildings, plant and equipment under which all the risks and rewards of ownership have been substantially assumed are classified as
finance leases. These leases are amortised on a straight-line basis over the term of the lease or, where it is likely that ownership of the asset will be
obtained, the life of the asset. Other leases, where substantially all the risks and benefits remain with the lessor, are classified as operating leases.
Tropical has been prepared on the basis that:
- where there is no underlying tangible asset, the cost of a restoration provision does not constitute an asset, and
- where there is an underlying asset the cost must be dealt with in accordance with AASB116 paragraph 11 and Interpretation 1.
The Queensland Audit Office supports this view.
A provision is made for the cost of restoring refuse dumps and quarries where it is probable the Council will be liable, or required, to do this when the
use of the facilities is complete.
AASB 137.84 & 85
The carrying value of the leased assets is as follows:
The balance of the lease contract is for a period of 17 years. The interest rate was fixed at the inception of the lease at 4.58%. Under the terms of the
lease, the Council has the option to acquire the asset for 40% of its agreed value on expiry of the lease.
A lease asset and a liability equal to the lower of the present value of the minimum lease payments or of the fair value of the asset are recorded at the
inception of the lease. Lease liabilities are reduced by repayments of principal. The interest components of the lease payments are expensed as
finance costs.
AASB 117.20 & 25
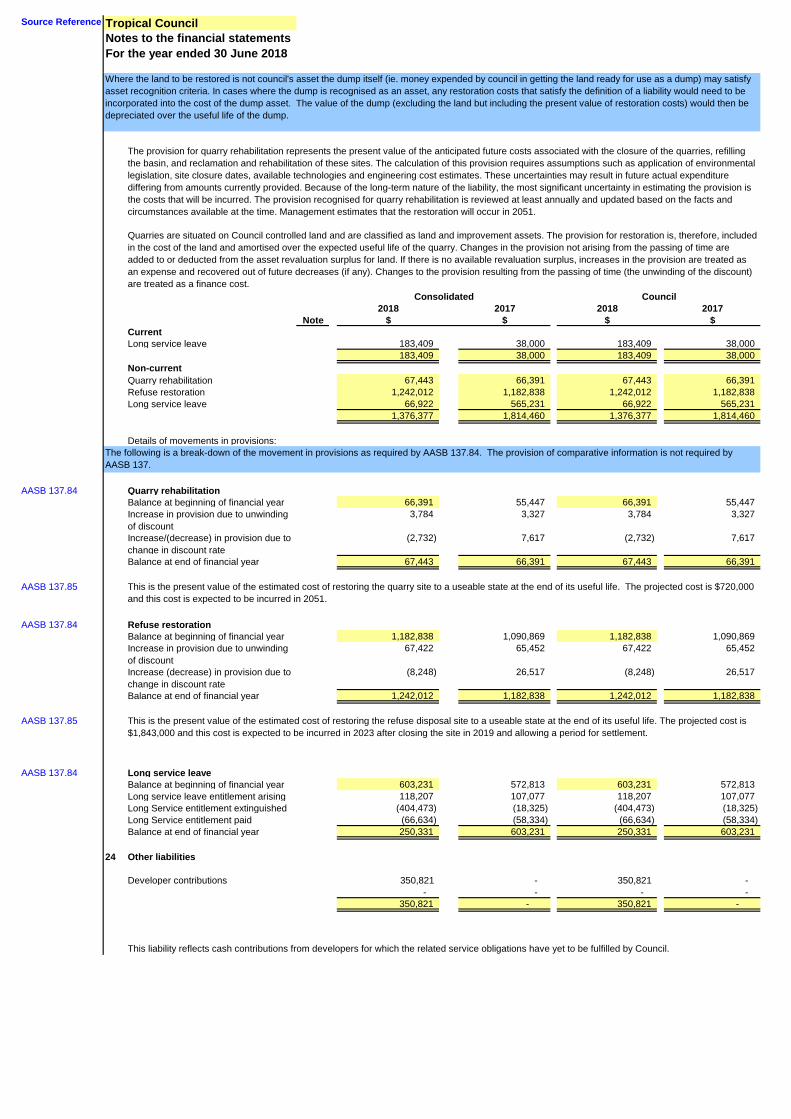
Tropical Council
Notes to the financial statements
For the year ended 30 June 2018
Source Reference
Consolidated Council
2018 2017 2018 2017
Note $ $ $ $
Current
Long service leave 183,409 38,000 183,409 38,000
183,409 38,000 183,409 38,000
Non-current
Quarry rehabilitation 67,443 66,391 67,443 66,391
Refuse restoration 1,242,012 1,182,838 1,242,012 1,182,838
Long service leave 66,922 565,231 66,922 565,231
1,376,377 1,814,460 1,376,377 1,814,460
Details of movements in provisions:
AASB 137.84 Quarry rehabilitation
Balance at beginning of financial year 66,391 55,447 66,391 55,447
Increase in provision due to unwinding
of discount
3,784 3,327 3,784 3,327
Increase/(decrease) in provision due to
change in discount rate
(2,732) 7,617 (2,732) 7,617
Balance at end of financial year 67,443 66,391 67,443 66,391
AASB 137.85
AASB 137.84 Refuse restoration
Balance at beginning of financial year 1,182,838 1,090,869 1,182,838 1,090,869
Increase in provision due to unwinding
of discount
67,422 65,452 67,422 65,452
Increase (decrease) in provision due to
change in discount rate
(8,248) 26,517 (8,248) 26,517
Balance at end of financial year 1,242,012 1,182,838 1,242,012 1,182,838
AASB 137.85
AASB 137.84 Long service leave
Balance at beginning of financial year 603,231 572,813 603,231 572,813
Long service leave entitlement arising 118,207 107,077 118,207 107,077
Long Service entitlement extinguished (404,473) (18,325) (404,473) (18,325)
Long Service entitlement paid (66,634) (58,334) (66,634) (58,334)
Balance at end of financial year 250,331 603,231 250,331 603,231
24 Other liabilities
Developer contributions 350,821 - 350,821 -
- - - -
350,821 - 350,821 -
The following is a break-down of the movement in provisions as required by AASB 137.84. The provision of comparative information is not required by
AASB 137.
This is the present value of the estimated cost of restoring the quarry site to a useable state at the end of its useful life. The projected cost is $720,000
and this cost is expected to be incurred in 2051.
This is the present value of the estimated cost of restoring the refuse disposal site to a useable state at the end of its useful life. The projected cost is
$1,843,000 and this cost is expected to be incurred in 2023 after closing the site in 2019 and allowing a period for settlement.
This liability reflects cash contributions from developers for which the related service obligations have yet to be fulfilled by Council.
The provision for quarry rehabilitation represents the present value of the anticipated future costs associated with the closure of the quarries, refilling
the basin, and reclamation and rehabilitation of these sites. The calculation of this provision requires assumptions such as application of environmental
legislation, site closure dates, available technologies and engineering cost estimates. These uncertainties may result in future actual expenditure
differing from amounts currently provided. Because of the long-term nature of the liability, the most significant uncertainty in estimating the provision is
the costs that will be incurred. The provision recognised for quarry rehabilitation is reviewed at least annually and updated based on the facts and
circumstances available at the time. Management estimates that the restoration will occur in 2051.
Where the land to be restored is not council's asset the dump itself (ie. money expended by council in getting the land ready for use as a dump) may satisfy
asset recognition criteria. In cases where the dump is recognised as an asset, any restoration costs that satisfy the definition of a liability would need to be
incorporated into the cost of the dump asset. The value of the dump (excluding the land but including the present value of restoration costs) would then be
depreciated over the useful life of the dump.
Quarries are situated on Council controlled land and are classified as land and improvement assets. The provision for restoration is, therefore, included
in the cost of the land and amortised over the expected useful life of the quarry. Changes in the provision not arising from the passing of time are
added to or deducted from the asset revaluation surplus for land. If there is no available revaluation surplus, increases in the provision are treated as
an expense and recovered out of future decreases (if any). Changes to the provision resulting from the passing of time (the unwinding of the discount)
are treated as a finance cost.

Tropical Council
Notes to the financial statements
For the year ended 30 June 2018
Source Reference
AASB 116.77(f) 25 Asset revaluation surplus
AASB 116.39 to
AASB 116.42
Consolidated Council
2018 2017 2018 2017
Note $ $ $ $
Movements in the asset revaluation
surplus were as follows:
Balance at beginning of financial year 3,533,826 3,413,144 3,378,838 3,331,144
Net adjustment to non-current assets at
end of period to reflect a change in
current fair value:Land and improvements 110,250 52,500 47,508 -
Buildings 41,972 (5,988) 20,986 (26,476)
Major plant - 97,179 - 97,179
Road, drainage and bridge network 2,130,114 - 2,130,114 -
Water (14,385) (23,009) (14,385) (23,009)
Impairment:
Land and improvements - - - -
Buildings - -
Water - - - -
Change in value of future rehabilitation
cost:
Land and improvements 2,732 - 2,732 -
Balance at end of financial year 5,804,509 3,533,826 5,565,793 3,378,838
Consolidated Council
2018 2017 2018 2017
Note $ $ $ $
Asset revaluation surplus analysis
The closing balance of the asset
revaluation surplus comprises the
following asset categories:
Land and improvements 292,982 232,500 98,252 180,000
Buildings 516,972 722,464 495,986 642,976
Major plant 85,000 182,179 85,000 182,179
Road, drainage and bridge network 3,377,522 873,274 3,377,522 873,274
Water 985,615 976,991 985,615 976,991
Sewerage 479,000 479,000 479,000 479,000
Other infrastructure assets 67,418 67,418 44,418 44,418
5,804,509 3,533,826 5,565,793 3,378,838
The asset revaluation surplus comprises adjustments relating to changes in value of property, plant and equipment that do not result from the use of
those assets. Net incremental changes in the carrying value of classes of non-current assets since their initial recognition are accumulated in the asset
revaluation surplus. Increases and decreases on revaluation are offset within a class of assets.
Where a class of assets is decreased on revaluation, that decrease is offset first against the amount remaining in the asset revaluation surplus in
respect of that class. Any excess is treated as an expense.
When an asset is disposed of, the amount reported in surplus in respect of that asset is retained in the asset revaluation surplus and not transferred to
retained surplus.
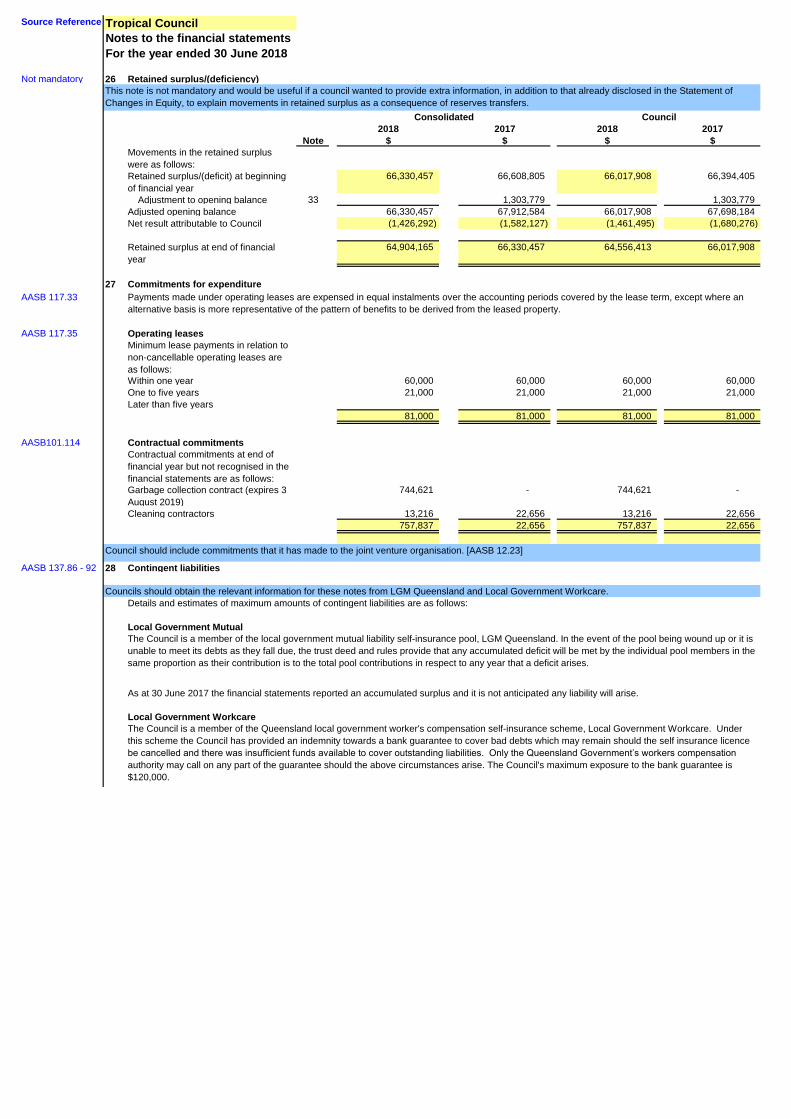
Tropical Council
Notes to the financial statements
For the year ended 30 June 2018
Source Reference
Not mandatory 26 Retained surplus/(deficiency)
Consolidated Council
2018 2017 2018 2017
Note $ $ $ $
Movements in the retained surplus
were as follows:
Retained surplus/(deficit) at beginning
of financial year
66,330,457 66,608,805 66,017,908 66,394,405
Adjustment to opening balance 33 1,303,779 1,303,779
Adjusted opening balance 66,330,457 67,912,584 66,017,908 67,698,184
Net result attributable to Council (1,426,292) (1,582,127) (1,461,495) (1,680,276)
Retained surplus at end of financial
year
64,904,165 66,330,457 64,556,413 66,017,908
27 Commitments for expenditure
AASB 117.33
AASB 117.35 Operating leases
Minimum lease payments in relation to
non-cancellable operating leases are
as follows:
Within one year 60,000 60,000 60,000 60,000
One to five years 21,000 21,000 21,000 21,000
Later than five years
81,000 81,000 81,000 81,000
Contractual commitments
Contractual commitments at end of
financial year but not recognised in the
financial statements are as follows:
Garbage collection contract (expires 3
August 2019)
744,621 - 744,621 -
Cleaning contractors 13,216 22,656 13,216 22,656
757,837 22,656 757,837 22,656
AASB 137.86 - 92 28 Contingent liabilities
Councils should obtain the relevant information for these notes from LGM Queensland and Local Government Workcare.
Local Government Mutual
Local Government Workcare
This note is not mandatory and would be useful if a council wanted to provide extra information, in addition to that already disclosed in the Statement of
Changes in Equity, to explain movements in retained surplus as a consequence of reserves transfers.
Payments made under operating leases are expensed in equal instalments over the accounting periods covered by the lease term, except where an
alternative basis is more representative of the pattern of benefits to be derived from the leased property.
AASB101.114
The Council is a member of the Queensland local government worker's compensation self-insurance scheme, Local Government Workcare. Under
this scheme the Council has provided an indemnity towards a bank guarantee to cover bad debts which may remain should the self insurance licence
be cancelled and there was insufficient funds available to cover outstanding liabilities. Only the Queensland Government’s workers compensation
authority may call on any part of the guarantee should the above circumstances arise. The Council's maximum exposure to the bank guarantee is
$120,000.
As at 30 June 2017 the financial statements reported an accumulated surplus and it is not anticipated any liability will arise.
Details and estimates of maximum amounts of contingent liabilities are as follows:
The Council is a member of the local government mutual liability self-insurance pool, LGM Queensland. In the event of the pool being wound up or it is
unable to meet its debts as they fall due, the trust deed and rules provide that any accumulated deficit will be met by the individual pool members in the
same proportion as their contribution is to the total pool contributions in respect to any year that a deficit arises.
Council should include commitments that it has made to the joint venture organisation. [AASB 12.23]

Tropical Council
Notes to the financial statements
For the year ended 30 June 2018
Source Reference
AASB 119.148 29
AASB119.148d(ii)
AASB 119.135(c)
AASB 119.148(b)
AASB 119.135(b)
AASB
119.148(d)(v)
Consolidated Council
2018 2017 2018 2017
Note $ $ $ $
AASB 119.135(c) Superannuation contributions made to
the Regional Defined Benefits Fund
26,321 25,215 26,321 26,321
AASB 119.53 Other superannuation contributions for
employees
319,408 312,618 319,408 311,512
AASB 124.19(g) Total superannuation contributions paid
by Council for employees:
6
345,729 337,833 345,729 337,833
2019 2019
$ $
AASB
119.148(d)(iii)
Contributions council expects to make
to the Regional Defined Benefits Fund
for 2018-19 25,321 25,321
Superannuation - Regional Defined Benefit Fund
The following note is based on advice received from LGIA Super in May 2018.
Council contibutes to the LGIAsuper Regional Defined Benefits Fund (the scheme), at the rate of 12% for each permanent employee who is a defined
benefit member. This rate is set in accordance with the LGIAsuper trust deed and may be varied on the advice of an actuary. The Regional Defined
Benefits Fund is a complying superannuation scheme for the purpose of the Commonwealth Superannuation Industry (Supervision) legislation and is
also governed by the Local Government Act 2009.
The most significant risks that may result in LGIAsuper increasing the contribution rate, on the advice of the actuary, are:
There are currently 72 entities contributing to the scheme and any changes in contribution rates would apply equally to all 72 entities. Tropical Council
made <insert percentage>% of the total contributions to the plan for the 2017-18 financial year.
Investment risk - The risk that the scheme's investment returns will be lower than assumed and additional contributions are needed to fund the
shortfall.
There are currently 72 entities contributing to the scheme and any changes in contribution rates would apply equally to all 72 entities. Tropical Council
made less than 4% of the total contributions to the plan in the 2017-18 financial year.
Salary growth risk - The risk that wages or salaries will rise more rapidly than assumed, increasing vested benefits to be funded.
OR if council contributes greater than 4% of total contributions to the plan, Council will need to disclose the following:
No changes have been made to prescribed employer contributions which remain at 12% of employee assets and there are no known requirements to
change the rate of contributions.
Another actuarial investigation is being conducted as at 1 July 2018. At the time of signing these financial statements this investigation is still in
progress.
Any amount by which the scheme is over or under funded may affect future benefits and result in a change to the contribution rate, but has not been
recognised as an asset or liability of the Council.
The scheme is a defined benefit plan, however Council is not able to account for it as a defined benefit plan in accordance with AASB119 because
LGIAsuper is unable to account for its proportionate share of the defined benefit obligation, plan assets and costs.
The last completed actuarial assessment of the scheme was undertaken as at 1 July 2015. The actuary indicated that “At the valuation date of 1 July
2015, the net assets of the scheme exceeded the vested benefits and the scheme was in a satisfactory financial position as at the valuation date." The
Council is not aware of anything that has happened since that time that indicates the assets of the scheme are not sufficient to meet the vested
benefits, as at the reporting date.
Technically Tropical council can be liable to the scheme for a portion of another local governments’ obligations should that local government be unable
to meet them. However the risk of this occurring is extremely low and in accordance with the LGIAsuper trust deed changes to council's obligations will
only be made on the advice of an actuary.
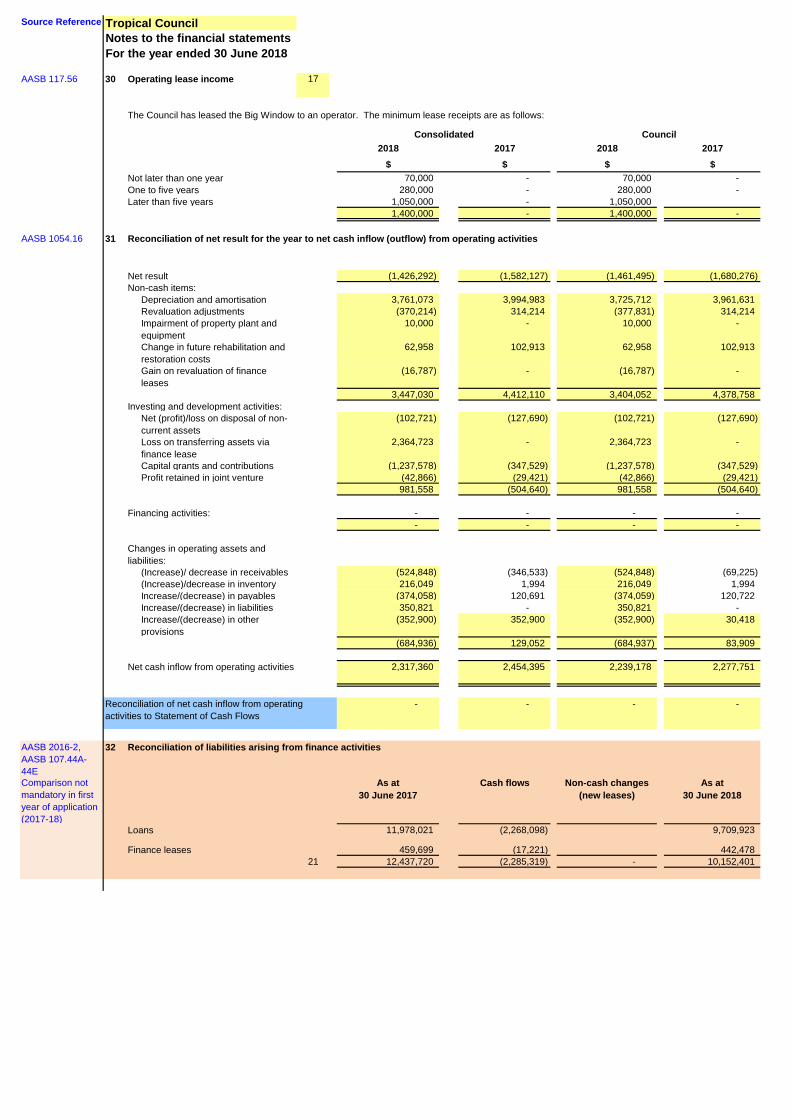
Tropical Council
Notes to the financial statements
For the year ended 30 June 2018
Source Reference
AASB 117.56 30 Operating lease income 17
Consolidated Council
2018 2017 2018 2017
$ $ $ $
Not later than one year 70,000 - 70,000 -
One to five years 280,000 - 280,000 -
Later than five years 1,050,000 - 1,050,000
1,400,000 - 1,400,000 -
AASB 1054.16 31
Net result (1,426,292) (1,582,127) (1,461,495) (1,680,276)
Non-cash items:
Depreciation and amortisation 3,761,073 3,994,983 3,725,712 3,961,631
Revaluation adjustments (370,214) 314,214 (377,831) 314,214
Impairment of property plant and
equipment
10,000 - 10,000 -
Change in future rehabilitation and
restoration costs
62,958 102,913 62,958 102,913
Gain on revaluation of finance
leases
(16,787) - (16,787) -
3,447,030 4,412,110 3,404,052 4,378,758
Investing and development activities:
Net (profit)/loss on disposal of non-
current assets
(102,721) (127,690) (102,721) (127,690)
Loss on transferring assets via
finance lease
2,364,723 - 2,364,723 -
Capital grants and contributions (1,237,578) (347,529) (1,237,578) (347,529)
Profit retained in joint venture (42,866) (29,421) (42,866) (29,421)
981,558 (504,640) 981,558 (504,640)
Financing activities: - - - -
- - - -
Changes in operating assets and
liabilities:
(Increase)/ decrease in receivables (524,848) (346,533) (524,848) (69,225)
(Increase)/decrease in inventory 216,049 1,994 216,049 1,994
Increase/(decrease) in payables (374,058) 120,691 (374,059) 120,722
Increase/(decrease) in liabilities 350,821 - 350,821 -
Increase/(decrease) in other
provisions
(352,900) 352,900 (352,900) 30,418
(684,936) 129,052 (684,937) 83,909
Net cash inflow from operating activities 2,317,360 2,454,395 2,239,178 2,277,751
- - - -
AASB 2016-2,
AASB 107.44A-
44E
32
Comparison not
mandatory in first
year of application
(2017-18)
As at
30 June 2017
Cash flows Non-cash changes
(new leases)
As at
30 June 2018
Loans 11,978,021 (2,268,098) 9,709,923
Finance leases 459,699 (17,221) 442,478
21 12,437,720 (2,285,319) - 10,152,401
Reconciliation of net result for the year to net cash inflow (outflow) from operating activities
The Council has leased the Big Window to an operator. The minimum lease receipts are as follows:
Reconciliation of net cash inflow from operating
activities to Statement of Cash Flows
Reconciliation of liabilities arising from finance activities

Tropical Council
Notes to the financial statements
For the year ended 30 June 2018
Source Reference
AASB 108.49 33 Correction of error
As at
30 June 2017
As at
1 July 2016
As at
30 June 2017
As at
1 July 2016
Gross value of roads added 1,600,023 1,600,023 1,600,023 1,600,023
Accumulated depreciation (318,559) (296,244) (318,559) (296,244)
Net value 1,281,464 1,303,779 1,281,464 1,303,779
Period ended
30 June 2018
Period ended
30 June 2017
Period ended
30 June 2018
Period ended
30 June 2017
Increase in depreciation charge - 22,315 - 22,315
Decrease in net result attributable to
council
- 22,315 - 22,315
Increase in property, plant and
equipment
- 1,281,464 - 1,281,464
Increase in retained surplus - 1,281,464 - 1,281,464
AASB 101.40A
AASB 108.28 - 31 34 Changes in accounting policy
AASB 110.19 - 22 35 Events after the reporting period
William Happy Bridge
West portion of Sunshine Road
Council chambers.
In September 2018 the following roads, bridges and infrastructure were damaged by flooding. The flooding also caused severe disruption to council
operations. At the time of signing these financial statements the financial effect of the flooding could not be reliably estimated, however all assets are
insured and Council expects the rectification costs to be covered by that insurance:
A restated Statement of Financial Position has been included in the financial statements as at 1 July 2016.
Severe weather conditions that occur after the end of the financial year and affect infrastructure and other assets will need to be disclosed as a post balance
date event. Where the conditions occur before balance date, councils need to assess assets, including road assets, for impairment at balance date.
This note will only be used if council needs to disclose the quantitative effect of changes in accounting policies. If it is not relevant it should be deleted.
On 1 August 2018 the Council entered into a refuse disposal contract with XYZ Waste Ltd. Under this contract XYZ Waste Ltd will take responsibility
for management of the Council's waste disposal facility and collection and disposal of all domestic and trade waste in the Council area for a period of
ten years. The fee payable to XYZ Waste Limited depends on the amount of waste generated, and is estimated to be in the region of $80 million over
the ten year period. Forty-seven employees ceased to be employed by the Council and became employees of XYZ Waste Limited as a result of the
arrangement.
There were no material adjusting events after the balance date (if applicable) .
The depreciation charge for the period ended 30 June 2018 was calculated after the error was discovered and therefore did not need correction.
In the process of valuing the Council's assets at 30 June 2018, it was discovered that certain roads had been omitted from previous financial reports.
This error has been corrected by adjusting the opening balances at 1 July 2016 and the comparative amounts for 2016-17. The adjustments are as
follows:
Correction of prior year errors in relation to initial recognition/derecognition of assets should be adjusted against retained surplus and not against asset
revaluation surplus.

Tropical Council
Notes to the financial statements
AASB 7.31 - 42 36 Financial instruments and financial risk management
AASB 7.32
- credit risk
- liquidity risk
- market risk
AASB 7.33
Credit risk
AASB 7.33(a)
AASB 7.33(b)
AASB 7.36(b)
AASB 7.36(a)
The following paragraph would need to be amended for Councils with non-category 1 powers:
Investments in financial instruments are required to be made with Queensland Treasury Corporation (QTC) or similar state/
commonwealth bodies or financial institutions in Australia, in line with the requirements of the Statutory Bodies Financial
Arrangements Act 1982 .
No collateral is held as security relating to the financial assets held by Tropical Council.
The following table represents the maximum exposure to credit risk based on the carrying amounts of financial assets at the
end of the reporting period:
Financial assets and financial liabilities
Source
Reference
Tropical Council has exposure to the following risks arising from financial instruments:
For the year ended 30 June 2018
Tropical Council is responsible for the establishment and oversight of the risk management framework, together with
developing and monitoring risk management policies.
Credit risk is the risk of financial loss if a counterparty to a financial instrument fails to meet its contractual obligations. These
obligations arise principally from the Council's investments and receivables from customers.
The Council's risk management policies are established to identify and analyse the risks faced, to set appropriate limits and
controls and to monitor these risks and adherence against limits. The Council aims to manage volatility to minimise potential
adverse effects on the financial performance of the Council.
Council's risk committee / management (as appropriate) approves policies for overall risk management, as well as specifically
for managing credit, liquidity and market risk.
If these policies have changed since the prior period, these changes must be disclosed (AASB 7.33 (c ))
Tropical Council does not enter into derivatives.
Exposure to credit risk is managed through regular analysis of credit counterparty ability to meet payment obligations. The
carrying amount of financial assets represents the maximum credit exposure.

Tropical Council
Notes to the financial statements
Source
Reference
For the year ended 30 June 2018
Note 2018 2017 2018 2017
Financial assets $ $ $ $
Cash and cash equivalents 11 5,735,156 4,276,522 5,360,330 3,934,878
Receivables - rates 12 278,568 392,112 278,712 392,256
Receivables - other 12 1,132,413 600,001 1,897,413 1,410,001
Other financial assets 14 533,081 0 533,081 0
Other credit exposures
AASB 7 B10(c) Guarantees 28 120,000 120,000 120,000 120,000
Total financial assets 7,799,218 5,388,635 8,189,536 5,857,135
Cash and cash equivalents
AASB 7.33(a)
Other financial assets
AASB 7.36 (c)
Trade and other receivables
AASB 7.33(b)
AASB 7.33(b)
AASB 7.34(c)
AASB 7.38
By the nature of the Councils operations, there is a geographical concentration of risk in the Council's area. Because the area
is largely (e.g. agricultural/mining ), there is also a concentration in the (e.g. agricultural/mining ) sector.
The following paragraph does not apply to Aboriginal shire councils:
In the case of rate receivables, the Council has the power to sell the property to recover any defaulted amounts. In effect this
power protects the Council against credit risk in the case of defaults.
In other cases, the Council assesses the credit risk before providing goods or services and applies normal business credit
protection procedures to minimise the risk.
Other investments are held with financial institutions, which are rated AAA to AA- [update as applicable ] based on rating
agency [insert name of ratings agency] ratings, and whilst not capital guaranteed, the likelihood of a credit failure is assessed
as remote (if applicable).
Consolidated
The Council may be exposed to credit risk through its investments in the QTC Cash Fund and QTC Working Capital Facility.
The QTC Cash Fund is an asset management portfolio that invests with a wide range of high credit rated counterparties.
Deposits with the QTC Cash Fund are capital guaranteed. Working Capital Facility deposits have a duration of one day and all
investments are required to have a minimum credit rating of "A-", therefore the likelihood of the counterparty having capacity
to meet its financial commitments is strong.
Council

Tropical Council
Notes to the financial statements
Source
Reference
For the year ended 30 June 2018AASB 7.37
2018 2017 2018 2017
$ $ $ $
Not past due 1,396,277 977,913 2,161,421 1,788,057
Past due 31-60 days 13,456 13,000 13,456 13,000
Past due 61-90 days 1,248 1,200 1,248 1,200
More than 90 days 0 0 0 0
Impaired 0 0 0 0
Total 1,410,981 992,113 2,176,125 1,802,257
AASB 7.37 (b)
AASB 7 .39 Liquidity risk
AASB 7.33(a),
34 & 39( c)
AASB 7.39(c)
AASB 107.50(a)
2018 2017 2018 2017
$ $ $ $
Overdraft - QTC working capital
facility
500,000 500,000 500,000 500,000
Available at 30 June 500,000 500,000 500,000 500,000
AASB 7.39(a)
Tropical Council is exposed to liquidity risk through its normal course of business and through its borrowings with QTC and
other financial institutions (if applicable)).
Consolidated Council
The following table sets out the liquidity risk in relation to financial liabilities held by the Council. It represents the remaining
contractual cashflows (principal and interest) of financial liabilities at the end of the reporting period, excluding the impact of
netting agreements:
CouncilConsolidated
Ageing of past due receivables and the amount of any impairment is disclosed in the following table:
The Council manages its exposure to liquidity risk by maintaining sufficient cash deposits and undrawn facilities, both short
and long term, to cater for unexpected volatility in cash flows. These facilities are disclosed in note 22. The following lines of
credit were available at the end of the reporting period:
Liquidity risk is the risk that the Council will encounter difficulty in meeting the obligations associated with its financial liabilities
that are settled by delivering cash or another financial asset.
For impaired financial assets the factors the Council considered when imparing the asset need to be disclosed.

Tropical Council
Notes to the financial statements
Source
Reference
For the year ended 30 June 2018Consolidated
0 to 1 year 1 to 5 years Over 5 years Total
contractual
cash flows
Carrying
amount
$ $ $ $ $
2018
Trade and other payables 523,770 - - 523,770 523,770
Loans - QTC 2,682,337 2,400,398 4,900,535 9,983,270 9,670,610
Loans - other 15,000 10,500 18,303 43,803 39,313
Finance leases 18,010 222,666 214,050 454,726 442,478
3,239,117 2,633,564 5,132,888 11,005,569 10,676,171
2017
Trade and other payables 731,036 - - 731,036 731,036
Loans - QTC 986,582 4,863,529 6,818,757 12,668,868 11,920,868
Loans - other 22,000 8,000 31,029 61,029 57,153
Finance leases 17,221 198,456 276,022 491,699 459,699
1,756,839 5,069,985 7,125,808 13,952,632 13,168,756
Council
0 to 1 year 1 to 5 years Over 5 years Total
contractual
cash flows
Carrying
amount
$ $ $ $ $
2018
Trade and other payables 523,770 - - 523,770 523,770
Loans - QTC 2,682,337 2,400,398 4,900,535 9,983,270 9,670,610
Loans - other 15,000 10,500 18,303 43,803 39,313
Finance leases 18,010 222,666 214,050 454,726 442,478
3,239,117 2,633,564 5,132,888 11,005,569 10,676,171
2017
Trade and other payables 731,037 - - 731,037 731,037
Loans - QTC 986,582 4,863,529 6,818,757 12,668,868 11,920,868
Loans - other 22,000 8,000 31,029 61,029 57,153
Finance leases 17,221 198,456 276,022 491,699 459,699
1,756,840 5,069,985 7,125,808 13,952,633 13,168,757
The outflows in the above table are not expected to occur significantly earlier or for significantly different amounts than
indicated in the table.
AASB 7.B10A

Tropical Council
Notes to the financial statements
Source
Reference
For the year ended 30 June 2018AASB 7.40 Market risk
Interest rate risk
AASB 7.40
Sensitivity
AASB 7.40(a) &
(b)
1% increase 1% decrease 1% increase 1% decrease
Consolidated $ $ $ $ $
2018
QTC cash fund 3,500,000 35,000 (35,000) 35,000 (35,000)
Other investments - - - - -
Loans - QTC* 9,670,610 - - - -
Loans - other 39,313 (393) 393 (393) 393
Net total 34,607 (34,607) 34,607 (34,607)
2017
QTC cash fund 2,750,000 27,500 (27,500) 27,500 (27,500)
Other investments - - - -
Loans - QTC* 11,920,868 - - - -
Loans - other 57,153 (572) 572 (572) 572
Net total 26,928 (26,928) 26,928 (26,928)
The Council has access to a mix of variable and fixed rate funding options through QTC so that interest rate risk exposure can
be minimised.
Tropical Council is exposed to interest rate risk through investments and borrowings with QTC and other financial institutions
(if applicable)).
Net carrying
amount
Sensitivity to interest rate movements is shown for variable financial assets and liabilities based on the carrying amount at
reporting date.
Effect on Equity
The following interest rate sensitivity analysis depicts what effect a reasonably possible change in interest rates (assumed to
be 1%) would have on the profit and equity, based on the carrying values at the end of the reporting period. The calculation
assumes that the change in interest rates would be held constant over the period.
Effect on Net Result
Market risk is the risk that changes in market prices, such as interest rates, will affect the Council's income or the value of its
holdings of financial instruments.

Tropical Council
Notes to the financial statements
Source
Reference
For the year ended 30 June 2018
1% increase 1% decrease 1% increase 1% decrease
Council $ $ $ $ $
2018
QTC cash fund 3,500,000 35,000 (35,000) 35,000 (35,000)
Other investments - - - -
Loans - QTC* 9,670,610 - - - -
Loans - other 39,313 (393) 393 (393) 393
Net total 34,607 (34,607) 34,607 (34,607)
2017
QTC cash fund 2,750,000 27,500 (27,500) 27,500 (27,500)
Other investments - - - -
Loans - QTC* 11,920,868 - - - -
Loans - other 57,153 (572) 572 (572) 572
Net total 26,928 (26,928) 26,928 (26,928)
The sensitivity analysis provided by QTC is currently based on a 1% change but this is subject to change.
AASB 7.21 Fair value
AASB 7.29(a)
QTC applies a book rate approach in the management of debt and interest rate risk, to limit the impact of market value
movements to clients' cost of funding. The book value represents the carrying value based on amortised cost using the
effective interest method.
The fair value of trade and other receivables and payables is assumed to approximate the value of the original transaction,
less any allowance for impairment.
The fair value of borrowings with QTC is based on the market value of debt outstanding. The market value of a debt obligation
is the discounted value of future cash flows based on prevailing market rates and represents the amount required to be repaid
if this was to occur at balance date. The market value of debt is provided by QTC and is discussed below/ disclosed in Note
22.
In relation to the QTC loans held by the Council, the following has been applied: (include as applicable)
QTC Fixed Rate Loan - financial instruments with fixed interest rates which are carried at amortised cost are not subject to
interest rate sensitivity.
The following statements may be included as required based on the Council's portfolio with QTC:
*QTC Generic Debt Pool - the generic debt pool products approximate a fixed rate loan. There is a negligible impact on
interest sensitivity from changes in interest rates for generic debt pool borrowings.
QTC Client Specific Pool - client specific pool products are often rebalanced to a target benchmark duration. This partially
exposes clients to the level of interest rates at the time of rebalancing. Sensitivity on these products is provided by QTC
through calculating the interest effect over the period.
In the case of financial instuments, disclosures of fair value are not required when the carrying value is a reasonable approximation
of fair value, such as cash and cash equivalents, short term payables/receivables.
Net carrying
amount
Effect on Net Result Effect on Equity

Tropical Council
Notes to the financial statements
Source
Reference
For the year ended 30 June 2018
AASB 7.25 Note Carrying
amount
Fair value Carrying
amount
Fair value
Consolidated $ $ $ $
Financial assets
QTC cash fund
Other investments
Financial liabilities
Loans - QTC
Loans - Other
Council
Financial assets
QTC cash fund
Other investments
Financial liabilities
Loans - QTC
Loans - Other
AASB 7.29(a) Disclosures of fair value are not required when the carrying value is a reasonable approximation of fair value, such as cash and
cash equivalents, short term payables/receivables.
The following table may be omitted where fair value disclosures for each class of financial assets and financial liabilities are
sufficiently disclosed elsewhere (refer Notes 11, 14 and 22). In these Tropical Council Illustrative Financial Statements the relevant
disclosures about the fair value of financial instruments have been made in the other notes, therefore dollar values have not been
included in this table.
20172018

Tropical Council
Notes to the financial statements
For the year ended 30 June 2018
37 National Competition Policy
Councils with significant business activities will need to make the appropriate disclosures for those activities in the annual report.
Disclosures about business activities to which the Competitive Code of Conduct applies, are only made in the annual financial statements
*Section 38 of the Local Government Regulation 2012 lists the local government's whose activities are prescribed building certifying activities
Business activities to which the code of competitive conduct is applied
The Tropical Council applies the competitive code of conduct to the following activities:
Roads
Water and sewerage
Waste management
Plant operations
The following activity statements are for activities subject to the competitive code of conduct:
Roads Water and Waste Plant
sewerage management operations
2018 2018 2018 2018
$ $ $ $
Revenue for services provided to the Council 704,191 30,000 - 854,604
Revenue for services provided to external clients - 2,103,460 801,481 -
Community service obligations - 25,000 - -
704,191 2,158,460 801,481 854,604
Less : Expenditure 617,975 2,119,793 702,381 945,278
Surplus/(deficit) 86,216 38,667 99,100 (90,674)
Description of CSO's provided to business activities:
Activities CSO description Net cost
$
Water and sewerage For providing free services to public areas 25,000
A "business activity" of a local government is any activity that involves trading in goods or services.
Source
Reference
(a) A building certifying activity that:
S32 - 36
Local
Government
Regulation
2012
The code of competitive conduct (CCC) must be applied to the following business activities:
The CSO value is determined by Council, and represents an activities cost(s) which would not be incurred if the primary
objective of the activities was to make a profit. The Council provides funding from general revenue to the business activity to
cover the cost of providing non-commercial community services or costs deemed to be CSO's by the Council.
(i) involves performing building certifying functions within the meaning of the Building Act, section 8; and
(ii) is prescribed under a regulation*.
Each local government may elect to apply a Code of Competitive Conduct (CCC) to any other identified business activities. However, for any with current expenditure of
$325,000 or more, the local government must decide, by resolution each year, whether to apply the CCC to that activity.
In general, applying the competitive code of conduct means that the competitive neutrality principle is applied to the business activity.
Under the competitive neutrality principle, an entity that is conducting a business activity in competition with the private sector should not enjoy a net advantage over
competitors only because the entity is in the public sector.
The competitive neutrality principle may be applied by commercialisation or full cost pricing. This includes removing any competitive advantage or disadvantage, where
possible, and charging for goods and services at full cost.
In addition the cost of performing community service obligations, less any revenue received from carrying out those obligations, must be treated as revenue for the business
activity.
A community service obligation is an obligation the local government imposes on a business activity that is not in it's commercial interest. For example, giving a concession to
pensioners.
A local government's financial statements must contain an activity statement for each business activity to which the CCC applies.
This requires the application of full cost pricing, identifying the cost of community service obligations (CSO) and eliminating
the advantages and disadvantages of public ownership within that activity.
(b) A roads activity, other than a roads activity for which business in conducted only through a sole supplier arrangement, that involves:
(i) the construction or maintenance of state controlled roads for which the local government submits an offer to carry out work in response to a tender invitation.
(ii) construction or road maintenance on another local government's roads which the local government has put out to tender.

Tropical Council
Notes to the financial statements
For the year ended 30 June 2018
38
Controlled Entity Ownership
Interest
2018 2017 2018 2017 2018 2017 2018 2017 2018 2017
$'000 $'000 $'000 $'000 $'000 $'000 $'000 $'000 $'000 $'000
Happy plants pty ltd 100% 100 120 95 85 5 35 15 6 0 0
Council Development trust 100% 250 10 95 95 240 -85 2500 3600 2300 3500
Tropical Art Gallery 100% 60 6 40 30 20 -24 5 6 0 0
Mayor's Flood Appeal Nil 300 500 425 356 -125 144 19 144 0 0
Tropical Economic
Development Council
30%
500 500 250 250 250 250 500 250 0 0
The Council Development trust's main purpose is to attract economic development and jobs to the Tropical Shire. The Tropical Economic Development Council has a similar purpose
The Art Gallery promotes local artists and provides art based activities for adults and children in the council area. It is funded primarily through State funding and commission on art sales.
The Mayor's Flood Appeal raises funds to assist people with emergency assistance during and after floods
Happy plants provides plants at or close to cost to community groups such as community gardens and groups undertaking replanting within the Tropical Council area.
Source
Reference
Controlled entities that have not been consolidatedNot
mandatory
Tropical council has a number of controlled entities that are not consolidated because their size and nature means that they are not material to
council's operations.
A summary of those entities, their net assets and results for the year ended 30 June 2018 follows:
Liabilities
Controlled Entities - Financial Results:
Revenue Expenses Profit / (Loss) Assets

Tropical Council
Notes to the financial statements
The bulletin can be accessed here: http://www.dilgp.qld.gov.au/newsletters-and-brochures/bulletin-02-16.html
39 Transactions with related parties
AASB 124.18,
19(c)
AASB 124.13
2018
$
2017
$
2018
$
2017
$
2018
$
2017
$
Tropical Sunset Retirement Home Pty Ltd 11,023 10,130
Tropical Economic Development Council 25,000 20,000 3,000 3,000 1,250 1,200
Tropical Art Gallery 60,000 55,000 830 800
Total 85,000 75,000 3,000 3,000 13,103 12,130
Source
Reference
For the year ended 30 June 2018
(a) Subsidiaries
The following transactions occurred with subsidiaries:
Council provides free rental accommodation and administration services to the Tropical Art Gallery, which is dependent on Council. All funding support given to subsidiaries was agreed
to by the Council for the 2016-17 and 2017-2018 financial years.
Note: This transaction is likely immaterial but is included here for illustrative purposes
The department has released a bulletin 02/16 which contains detailed information about the requirements of AASB 124: Related Party Disclosures as they relate to Queensland local
governments. The department recommends that councils read this bulletin prior to making the disclosure required by this standard. The following example disclosure pertains to Tropical Council's
transactions. Councils are reminded of the need to tailor their disclosure according to their circumstances.
Subsidiary
The group consists of Tropical Council and six subsidiaries. Only one of the subsidiaries, Tropical Sunset Retirement Home Pty Ltd , is consolidated (Note 16). Details of the other
subsidiaries are disclosed in Note 38.
Grants and subsidies provided by councilGoods and services supplied by council, on normal terms and conditions
Rental accommodation Garbage charges

Tropical Council
Notes to the financial statements
The bulletin can be accessed here: http://www.dilgp.qld.gov.au/newsletters-and-brochures/bulletin-02-16.html
39 Transactions with related parties
Source
Reference
For the year ended 30 June 2018
The department has released a bulletin 02/16 which contains detailed information about the requirements of AASB 124: Related Party Disclosures as they relate to Queensland local
governments. The department recommends that councils read this bulletin prior to making the disclosure required by this standard. The following example disclosure pertains to Tropical Council's
transactions. Councils are reminded of the need to tailor their disclosure according to their circumstances.
AASB 124.18,
19(c)(b) Transactions with associates
If council has associates, transactions with them may need to be disclosed
AASB 124.18,
19(c)(c) Transactions with joint ventures
2018 2017
$ $
11,420 7,150
AASB 124.18,
19(c)
AASB 124.9
2018 2017
$ $
Short-term employee benefits 510,000 453,000
Post-employment benefits 57,553 47,565
Long-term benefits 60,250 52,000
Termination benefits 0 0
Total 627,803 552,565
Note: This transaction is likely immaterial but is included here for illustrative
purposes
KMP include the Mayor, councillors, council's Chief Executive Officer and some executive management. The compensation paid to KMP comprises:
(d) Transactions with key management personnel (KMP)
Key management personnel are those persons having authority and responsibility for planning, directing and controlling the activities of the entity, directly or indirectly, including any director
(whether executive or otherwise) of that entity.
Profit distribution from XYZ Events Pty Ltd (note 16)

Tropical Council
Notes to the financial statements
The bulletin can be accessed here: http://www.dilgp.qld.gov.au/newsletters-and-brochures/bulletin-02-16.html
39 Transactions with related parties
Source
Reference
For the year ended 30 June 2018
The department has released a bulletin 02/16 which contains detailed information about the requirements of AASB 124: Related Party Disclosures as they relate to Queensland local
governments. The department recommends that councils read this bulletin prior to making the disclosure required by this standard. The following example disclosure pertains to Tropical Council's
transactions. Councils are reminded of the need to tailor their disclosure according to their circumstances.
AASB 124.18,
19(c)(e) Transactions with other related parties
AASB 124.9
(c) dependants of that person or that person’s spouse or domestic partner.
Details of transactions between council and other related parties are disclosed below:
AASB124.24 2018 2017
$ $
39(e)(i) 155,423 0
39(e)(ii) 690,472 0
39(e)(iii) 233,420 210,330
39(e)(iv) 230,012 75,220
AASB
124.9(b)(viii)39(e)(v) 200,413 0
Additional
information
Infrastructure contributions from entities controlled by key management personnel
Employee expenses for close family members of key management personnel
Purchase of materials and services from entities controlled by key management personnel
Key management personnel services provided by a related entity
Close members of the family of a person are those family members who may be expected to influence, or be influenced by, that person in their dealings with the entity and include:
(a) that person’s children and spouse or domestic partner;
(b) children of that person’s spouse or domestic partner; and
Other related parties include the close family members of KMP and any entities controlled or jointly controlled by KMP or their close family members. Close family members include a
spouse, child and dependent of a KMP or their spouse.
Details of Transaction
Fees and charges charged to entities controlled by key management personnel
Transactions that are individually significant, either because of their amount or nature, are included in the aggregate disclosure contained in this table but also need to be disclosed separately as illustrated below.

Tropical Council
Notes to the financial statements
The bulletin can be accessed here: http://www.dilgp.qld.gov.au/newsletters-and-brochures/bulletin-02-16.html
39 Transactions with related parties
Source
Reference
For the year ended 30 June 2018
The department has released a bulletin 02/16 which contains detailed information about the requirements of AASB 124: Related Party Disclosures as they relate to Queensland local
governments. The department recommends that councils read this bulletin prior to making the disclosure required by this standard. The following example disclosure pertains to Tropical Council's
transactions. Councils are reminded of the need to tailor their disclosure according to their circumstances.
Fees and charges charged to entities
controlled by key management
personnel
$
Infrastructure charges 125,590
An application fee for Boundary
Realignment and another for material
change of use.
1,500
Other fees and charges 28,333
Total 155,423
(i) The fees and charges charged to entities controlled by key management personnel were on an arm's length basis in accordance with the schedule of fees and charges adopted by
council. The total disclosed includes the following:
(ii) Green Developments Pty Ltd, a company jointly controlled by Councillor Fred Smith and a close family member during 2017-18, completed a new subdivision “Avondale Heights” in
2017-18. In accordance with the infrastructure agreement water and sewerage infrastructure, roads and some parks within the development were handed over to council. The fair value
of this infrastructure at the hand over date was $690,472.
Progressive Development Company Pty Ltd, a company controlled by a close family member of Councillor
Rosalind Jones. The company’s development projects were assessed and approved in accordance with council’s
normal terms and conditions. Councillor Rosalind Jones declared her conflict of interest in this matter and did not
participate in any decisions related to the company’s application.
These applications were made by Better Homes Pty Ltd, a company controlled by the Mayor, Councillor David
Dean. The applications relate to parcels of land in Taylor St, Bedford and Main St, Sofaville. These applications
are currently being assessed by council.
Details of related party
Various other related parties

Tropical Council
Notes to the financial statements
The bulletin can be accessed here: http://www.dilgp.qld.gov.au/newsletters-and-brochures/bulletin-02-16.html
39 Transactions with related parties
Source
Reference
For the year ended 30 June 2018
The department has released a bulletin 02/16 which contains detailed information about the requirements of AASB 124: Related Party Disclosures as they relate to Queensland local
governments. The department recommends that councils read this bulletin prior to making the disclosure required by this standard. The following example disclosure pertains to Tropical Council's
transactions. Councils are reminded of the need to tailor their disclosure according to their circumstances.
2018 2017
Rental of an office building $ 70,012 $ 65,020
Petrol $ 15,000 $ 10,200
Consultancy services $ 145,000 $ -
Total $ 230,012 $ 75,220
(iv) The consolidated entity purchased the following material and services from entities that are controlled by members of key management personnel. All purchases were at arm’s length
and were in the normal course of council operations:
Included in the above are consultancy services purchased from Bright Water Pty Ltd amounting to $145,000 during 2017-18. During this time Councillor Roger Jacobs was the owner of
this business. All purchases were at arm’s length, on normal terms and conditions and were in the normal course of council’s operations. As at 30 June 2018 there were no amounts
owed by council to the company.
(iii) All close family members of key management personnel were employed through an arm’s length process. They are paid in accordance with the Award for the job they perform.
The Chief Executive Officer, Ms Doris Dean, is a close family member of the Mayor, Councillor David Dean. Ms Dean’s compensation package has not been included in this disclosure
because it has been disclosed at d) Key Management Personnel compensation. Ms Dean was employed through an arm’s length process and is compensated at a market salary that
was determined by Salary Consultants Pty Ltd, an independent agent based in Cairns.
(v) Payments totalling $180,523 were made to Executive Recruitment Agency Pty Ltd for the services of Mrs Daphne Smith who acted in the Chief Executive Officer position during the
period 13 July 2017 to 15 December 2017. A number of smaller amounts, totalling $19,890, were also paid to recruitment agencies for temporary key management personnel at various
times throughout the year. These amounts have been excluded from the KMP remuneration disclosures in (d) above.
The council employs 452 staff of which only 4 are close family members of key management personnel.

Tropical Council
Notes to the financial statements
The bulletin can be accessed here: http://www.dilgp.qld.gov.au/newsletters-and-brochures/bulletin-02-16.html
39 Transactions with related parties
Source
Reference
For the year ended 30 June 2018
The department has released a bulletin 02/16 which contains detailed information about the requirements of AASB 124: Related Party Disclosures as they relate to Queensland local
governments. The department recommends that councils read this bulletin prior to making the disclosure required by this standard. The following example disclosure pertains to Tropical Council's
transactions. Councils are reminded of the need to tailor their disclosure according to their circumstances.
AASB 124.18(b) (f) Outstanding balances
The following balances are outstanding at the end of the reporting period in relation to transactions with related parties:
Receivables
30-Jun-18 30-Jun-17 30-Jun-18 30-Jun-17
Past due 31-60 days $400 $0 $0 $0
Past due 61-90 days $400 $0 $0 $0
More than 90 days overdue $6,523 $0 $53,000 $0
Total Owing $7,323 $0 $53,000 $0
The $7,323 housing rent that is outstanding is owed by the Mayor, Councillor David Dean.
AASB
124.18(c)&(d)No expense has been recognised in the current year or prior year for bad or doubtful debts in respect of amounts owed by related parties.
AASB124.18(b)(ii) (g) Loans and guarantees to/from related parties
Council does not make loans to or receive loans from related parties. No guarantees have been provided.
AASB 124.18(b) (h) Commitments to/from other related parties
Housing rent owed by key management
personnel
Amounts owed by entities controlled by
key management personnel
Better Homes Pty Ltd, a company controlled by the Mayor, Councillor David Dean, owes $53,000 in rates and interest on a commercial property. Council is pursuing this debt in
accordance with the approved debt collection policy.
Council entered into a contract for cleaning services with Cleaning Up Pty Ltd, a company owned by a close family member of Councillor Fred Smith on 29 June 2018. The contract will
take effect on 1 September 2018 and is valued at $50,000. The contract was the result of a tender process in accordance with council's normal procedures and policies. Councillor Fred
Smith was not involved in the decision to award this contract to Cleaning Up Pty Ltd.

Tropical Council
Notes to the financial statements
The bulletin can be accessed here: http://www.dilgp.qld.gov.au/newsletters-and-brochures/bulletin-02-16.html
39 Transactions with related parties
Source
Reference
For the year ended 30 June 2018
The department has released a bulletin 02/16 which contains detailed information about the requirements of AASB 124: Related Party Disclosures as they relate to Queensland local
governments. The department recommends that councils read this bulletin prior to making the disclosure required by this standard. The following example disclosure pertains to Tropical Council's
transactions. Councils are reminded of the need to tailor their disclosure according to their circumstances.
(i) Transactions with related parties that have not been disclosed
- Payment of rates
- Dog registration
- Borrowing books from a council library
AASB 124.23
1. Materiality
AASB 101.7 Related Party Disclosures under AASB 124 are only required if they individually or collectively material, either in size or nature.
2. Even if no money changes hand a material transaction may have occurred
AASB 124.9
AASB 124.23 "Disclosures that related party transactions were made on terms equivalent to those that prevail in arm's length transactions are made only if such terms can be substantiated."
A transaction may be material because of it's nature, despite being immaterial in dollar terms. Transactions between council and KMP are more likely to be material because of their
nature. This is because KMP have fiduciary responsibilities to council.
"A related party transaction is a transfer of resources, services or obligations between council and a related party, regardless of whether a price is charged."
Most of the entities and people that are related parties of council live and operate within the Tropical Council Shire. Therefore, on a regular basis ordinary citizen transactions occur
between Council and its related parties. Some examples include:
Council has not included these types of transaction in its disclosure, where they are made on the same terms and conditions available to the general public.
3. Where council has used the term "arm's length', "normal terms and conditions" or a similar term to describe a transaction these will need to be substantiated ie. Council will need
demonstrate that this is true.
- Use of the daffy duck memorial swimming pool

Tropical Council
Notes to the financial statements
For the year ended 30 June 2018
40 Tied grants by project
Not mandatory
Balance Revenue Expense Transfers Balance
01/07/17 between grants 30/06/2018
$ $ $ $ $
Commonwealth government grants
Organisation (insert name)
(insert name of program/project) 0 0 0 0 0
(insert name of program/project) 0 0 0 0 0
Total 0 0 0 0 0
Organisation (insert name)
(insert name of program/project) 0 0 0 0 0
(insert name of program/project) 0 0 0 0 0
Total 0 0 0 0 0
Total - Commonwealth government 0 0 0 0 0
State government grants
Organisation (insert name)
(insert name of program/project) 0 0 0 0 0
(insert name of program/project) 0 0 0 0 0
Total 0 0 0 0 0
Organisation (insert name)
(insert name of program/project) 0 0 0 0 0
(insert name of program/project) 0 0 0 0 0
Total 0 0 0 0 0
Total - State government 0 0 0 0 0
Other grant providers
Organisation (insert name)
(insert name of program/project) 0 0 0 0 0
(insert name of program/project) 0 0 0 0 0
Total 0 0 0 0 0
Organisation (insert name)
(insert name of program/project) 0 0 0 0 0
(insert name of program/project) 0 0 0 0 0
Total 0 0 0 0 0
Total - Other grant providers 0 0 0 0 0
Total grants 0 0 0 0 0
Add back negative (ie overspent)
grants
0 0 0 0 0
Unspent grant revenue 0 0 0 0 0
Therefore, if this note is prepared on a cash basis, the amount of unspent grants and subsidies disclosed in note 11 should agree to
total grants as at 30/6/18 after excluding overspent grants and adjusting for any year end creditors and accruals.
This note is not required under local government legislation or Australian Accounting Standards and is therefore optional. Historically
some councils, in particular Aboriginal shire councils, have included it in their annual financial statements by listing the various special
purpose projects for which they need to provide separate acquittals.
The following note has been prepared on a cash basis.
Source
Reference
If this note is included it should reconcile with other information disclosed in the financial statements and notes.
- if any grants in Note 43 are overspent as at 30/6/18 i.e. a negative balance.
The total grants balance as at 30/6/18 will not reconcile with the externally imposed restrictions upon cash, disclosed in note 11 if:
- Note 43 is prepared on a cash basis, and / or
Councils that prepare this note to satisfy requirements for audited grant acquittals may be required to prepare the note on a cash,
rather than an accruals, basis. Therefore the note should disclose whether it has been prepared on a cash or accruals basis.

(i) the prescribed requirements of the Local Government Act 2009 and Local Government Regulation 2012 for the establishment and keeping of
accounts have been complied with in all material respects; and
(ii) the general purpose financial statements, as set out on pages x to x, present a true and fair view, in accordance with Australian Accounting
Standards, of the Council’s and the consolidated entity’s transactions for the financial year and financial position at the end of the year.
(i) the prescribed requirements of the City of Brisbane Act 2010 and City of Brisbane Regulation 2012 for the establishment and keeping of
accounts have been complied with in all material respects; and
(ii) the general purpose financial statements, as set out on pages x to x, present a true and fair view, in accordance with Australian Accounting
Standards, of the Council’s and the consolidated entity’s transactions for the financial year and financial position at the end of the year.
Management Certificate
For the year ended 30 June 2018
Tropical Council
Financial statements
For the year ended 30 June 2018
Brisbane City Council
Financial statements
For the year ended 30 June 2018
Management Certificate
Date: ______/______/______ Date:______/______/_______
These general purpose financial statements have been prepared pursuant to sections 176 and 177 of the Local Government Regulation 2012 (the
Regulation) and other prescribed requirements.
In accordance with section 212(5) of the Regulation we certify that:
_____________________________________ ___________________________________
Mayor Chief Executive Officer
Name Name
Lord Mayor Chief Executive Officer
Name Name
Date: ______/______/______ Date:______/______/_______
For the year ended 30 June 2018
These general purpose financial statements have been prepared pursuant to sections 168 and 169 of the City of Brisbane Regulation 2012 (the
Regulation) and other prescribed requirements.
In accordance with section 202(5) of the Regulation we certify that:
_____________________________________ ___________________________________

(i) the prescribed requirements of the Local Government Act 2009 and Local Government Regulation 2012 for the establishment and keeping
of accounts have been complied with in all material respects; and
(ii) the general purpose financial statements, as set out on pages x to x, present a true and fair view, in accordance with Australian Accounting
Standards, of the Council’s transactions for the financial year and financial position at the end of the year.
Mayor Chief Executive Officer
Date: ______/______/______ Date:______/______/_______
For the year ended 30 June 2018
These general purpose financial statements have been prepared pursuant to sections 176 and 177 of the Local Government Regulation 2012 (the
Regulation) and other prescribed requirements.
In accordance with section 212(5) of the Regulation we certify that:
Name Name
_____________________________________ ___________________________________
Tropical Council
Financial statements
For the year ended 30 June 2018
Management Certificate

Tropical Council
Current Year Financial Sustainability Statement
Certificate of Accuracy - for the Current Year Financial Sustainability Statement
Independent Auditor's Report (Current Year Financial Sustainability Statement)
Talk to your auditors about the length of your audit opinion before completing
page numbering. The audit opinion may span a number of pages.

How the measure is calculated Actual -
Consolidated
Actual -
Council
Target
Operating surplus ratio Net result (excluding capital items)
divided by total operating revenue
(excluding capital items)
-160% -166% Between 0%
and 10%
Asset sustainability ratio Capital expenditure on the
replacement of assets (renewals)
divided by depreciation expense.
27% 27% greater than
90%
Net financial liabilities ratio Total liabilities less current assets
divided by total operating revenue
(excluding capital items)
37% 44% not greater
than 60%
Note 1 - Basis of Preparation
The following certificate is applicable to Brisbane City Council:
Certificate of Accuracy
For the year ended 30 June 2018
This current-year financial sustainability statement has been prepared pursuant to Section 170 of the City of Brisbane
Regulation 2012 (the regulation).
Date: ______/______/______ Date:______/______/_______
In accordance with Section 202(5) of the Regulation we certify that this current-year financial sustainability statement
has been accurately calculated.
_____________________________________ ___________________________________
Lord Mayor Chief Executive Officer
Name Name
Tropical Council
Current-year Financial Sustainability Statement
For the year ended 30 June 2018
Certificate of Accuracy
Measures of Financial Sustainability
Council's performance at 30 June 2018 against key financial ratios and targets:
This example statement contains the minimum information that is required by section 178 (1) of the Local Government Regulation 2012. Councils can change the way in
which this information is presented, however the operating surplus, asset sustainability and net financial liabilities ratios must all be calculated in accordance with the financial
management (sustainability) guideline issued by the Department of Infrastructure, Local Government and Planning. The current-year financial sustainability statement must
be given to the Auditor-General for auditing.
The current-year financial sustainability statement that is given to the auditor-general must be accompanied by a signed certificate in the form below:
The current year financial sustainability statement is a special purpose statement prepared in accordance with the requirements of the Local Government Regulation 2012
and the Financial Management (Sustainability) Guideline 2013. The amounts used to calculate the three reported measures are prepared on an accrual basis and are drawn
from the Council's audited general purpose financial statements for the year ended 30 June 2018.
Name Name
Date: ______/______/______ Date:______/______/_______
For the year ended 30 June 2018
This current-year financial sustainability statement has been prepared pursuant to Section 178
of the Local Government Regulation 2012 (the regulation).
In accordance with Section 212(5) of the Regulation we certify that this current-year financial
sustainability statement has been accurately calculated.
_____________________________________ ___________________________________
Mayor Chief Executive Officer

Tropical Council
Long Term Financial Sustainability Statement - Unaudited
Certificate of Accuracy - for the Long Term Financial Sustainability Statement

Measure Target Actuals at 30
June 2018
30 June 2019 30 June 2020 30 June 2021 30 June 2022 30 June 2023 30 June 2024 30 June 2025 30 June 2026
Operating surplus ratio Net result divided by total
operating revenue
Between 0%
and 10%
-160%
Asset sustainability ratio Capital expenditure on the
replacement of assets (renewals)
divided by depreciation expense.
greater than
90%
27%
Net financial liabilities ratio Total liabilities less current assets
divided by total operating revenue
not greater
than 60%
37%
Operating surplus ratio Net result divided by total
operating revenue
Between 0%
and 10%
-166%
Asset sustainability ratio Capital expenditure on the
replacement of assets (renewals)
divided by depreciation expense.
greater than
90%
27%
Net financial liabilities ratio Total liabilities less current assets
divided by total operating revenue
not greater
than 60%
44%
Tropical Council
Unaudited Long-Term Financial Sustainability Statement
Prepared as at 30 June 2018
Measures of Financial Sustainability
Tropical Council's Financial Management Strategy
Example 1
Council measures revenue and expenditure trends over time as a guide to future requirements and to make decisions about the efficient allocation of
resources to ensure the most effective provision of services. Council ensures that its financial management strategy is prudent and that its long-term
financial forecast shows a sound financial position whilst also being able to meet the community’s current and future needs.
The table below summarises how we performed against set targets for the seven key financial performance indicators established in our financial strategy. In
summary, we achieved or bettered six of the financial targets, performing strongly in our ability to generate cash from day-to-day operations, meeting all
financial commitments in the financial year, and keeping debt to conservative and manageable levels. This was achieved while maintaining community
services and making ongoing investment in community infrastructure. Our operating result in this period was adversely affected by the impacts of water
reform and this issue is outlined in more detail in the coming pages.
This example statement contains the minimum information that is required by section 178(2) of the Local Government Regulation 2012. Councils can change
the way in which this information is presented, however the operating surplus, asset sustainability and net financial liabilities ratios must all be calculated in
accordance with the financial management (sustainability) guideline issued by the Department of Infrastructure, Local Government and Planning. The long-
term financial sustainability statement must be given to the Auditor-General for information.
Projected for the years ended
Consolidated
Council
Example 2
Council aims to operate within a set of conservative guide-posts to ensure we are financially sustainable in the short, medium and long term. As part of our
financial strategy, we have adopted seven key financial performance indicators to guide our financial health. In addition to the financial indicators, we have
the above three sustainability indicators that have been set by the Department of Infrastructure, Local Government and Planning to help monitor the long-
term sustainability of all councils across Queensland. Throughout the financial year, these indicators are calculated and reported on monthly at Council
meetings, as part of a full suite of financial reports. Should there be any deviation outside these parameters, the executive management and Council will be
fully informed and may take corrective action as required.

Certificate of Accuracy
For the long-term financial sustainability statement prepared as at 30 June 2018
This long-term financial sustainability statement has been prepared pursuant to Section 170 of the City of Brisbane
Regulation 2012 (the regulation).
Date: ______/______/______ Date:______/______/_______
In accordance with Section 202(5) of the Regulation we certify that this current-year financial sustainability statement has
been accurately calculated.
_____________________________________ ___________________________________
Lord Mayor Chief Executive Officer
Name Name
In accordance with Section 212(5) of the Regulation we certify that this long-term financial sustainability statement has
been accurately calculated.
The long-term financial sustainability statement that is given to the auditor-general must be accompanied by a signed certificate in the form below:
The following certificate is applicable to Brisbane City Council:
Certificate of Accuracy
Mayor Chief Executive Officer
_____________________________________ ___________________________________
For the long-term financial sustainability statement prepared as at 30 June 2018
This long-term financial sustainability statement has been prepared pursuant to Section 178 of the Local Government
Regulation 2012 (the regulation).
Name Name
Date: ______/______/______ Date:______/______/_______

Rse_0344_.01