tritium management loop design status - info - home
TRANSCRIPT

ORNL/TM-2017/511
Tritium Management Loop Design Status
J. D. RaderD. K. FeldeJ. McFarlaneM. S. GreenwoodA. L. QuallsP. Calderoni, INL
December 2017
Approved for public release.Distribution is unlimited.

DOCUMENT AVAILABILITYReports produced after January 1, 1996, are generally available free via US Department ofEnergy (DOE) SciTech Connect.
Website: http://www.osti.gov/scitech/
Reports produced before January 1, 1996, may be purchased by members of the publicfrom the following source:
National Technical Information Service5285 Port Royal RoadSpringfield, VA 22161Telephone: 703-605-6000 (1-800-553-6847)TDD: 703-487-4639Fax: 703-605-6900E-mail: [email protected]: http://classic.ntis.gov/
Reports are available to DOE employees, DOE contractors, Energy Technology Data Ex-change representatives, and International Nuclear Information System representatives from thefollowing source:
Office of Scientific and Technical InformationPO Box 62Oak Ridge, TN 37831Telephone: 865-576-8401Fax: 865-576-5728E-mail: [email protected]: http://www.osti.gov/contact.html
This report was prepared as an account of work sponsored by anagency of the United States Government. Neither the United StatesGovernment nor any agency thereof, nor any of their employees,makes any warranty, express or implied, or assumes any legal lia-bility or responsibility for the accuracy, completeness, or usefulnessof any information, apparatus, product, or process disclosed, or rep-resents that its use would not infringe privately owned rights. Refer-ence herein to any specific commercial product, process, or serviceby trade name, trademark, manufacturer, or otherwise, does not nec-essarily constitute or imply its endorsement, recommendation, or fa-voring by the United States Government or any agency thereof. Theviews and opinions of authors expressed herein do not necessarilystate or reflect those of the United States Government or any agencythereof.

ORNL/TM-2017/511
Reactor & Nuclear Systems DivisionNuclear Security & Isotope Technology Division
Tritium Management Loop Design Status
Authors:J. D. RaderD. K. Felde
J. McFarlaneM. S. Greenwood
A. L. QuallsP. Calderoni, INL
Date Published: December 2017
Prepared byOAK RIDGE NATIONAL LABORATORY
Oak Ridge, TN 37831-6283managed by
UT-Battelle, LLCfor the
US DEPARTMENT OF ENERGYunder contract DE-AC05-00OR22725


CONTENTS
LIST OF FIGURES . . . . . . . . . . . . . . . . . . . . . . . . . . . . . . . . . . . . . . . . . . . . vLIST OF TABLES . . . . . . . . . . . . . . . . . . . . . . . . . . . . . . . . . . . . . . . . . . . . viiACRONYMS . . . . . . . . . . . . . . . . . . . . . . . . . . . . . . . . . . . . . . . . . . . . . . . ixABSTRACT . . . . . . . . . . . . . . . . . . . . . . . . . . . . . . . . . . . . . . . . . . . . . . . . 11. INTRODUCTION . . . . . . . . . . . . . . . . . . . . . . . . . . . . . . . . . . . . . . . . . . 12. TRITIUM LIFECYCLE BEHAVIOR AND REACTOR CHEMISTRY CONTROL . . . . . . . . 3
2.1 Tritium Production . . . . . . . . . . . . . . . . . . . . . . . . . . . . . . . . . . . . . . . 32.2 Tritium Speciation Calculations . . . . . . . . . . . . . . . . . . . . . . . . . . . . . . . . 4
3. PROPOSED TESTING TO MEET OBJECTIVES . . . . . . . . . . . . . . . . . . . . . . . . . . 73.1 Static Tests: Phase 1 Task Definitions . . . . . . . . . . . . . . . . . . . . . . . . . . . . . 7
3.1.1 Task 1: Investigate the use of LiT as tritium source for the test loop . . . . . . . . . 73.1.2 Task 2: Tritium adsorption in FLiBe/getter systems at different redox conditions . . . 73.1.3 Task 3: Development of sensors to measure tritium concentration in FLiBe . . . . . 83.1.4 Task 4: Modeling and simulation analysis . . . . . . . . . . . . . . . . . . . . . . . 8
3.2 Flow Tests: Phase 2 Task Definitions . . . . . . . . . . . . . . . . . . . . . . . . . . . . . . 93.2.1 Task 1: Tritium Test Assembly Design for ORNL Loop . . . . . . . . . . . . . . . . 93.2.2 Task 2: Detailed Loop Design and Fabrication . . . . . . . . . . . . . . . . . . . . . 12
4. DESIGN CALCULATIONS . . . . . . . . . . . . . . . . . . . . . . . . . . . . . . . . . . . . . 194.1 Loop Pressure Drop Scoping Evaluation . . . . . . . . . . . . . . . . . . . . . . . . . . . . 194.2 Tritium Transport Modeling . . . . . . . . . . . . . . . . . . . . . . . . . . . . . . . . . . 22
4.2.1 Model Comparison with Analytical Results . . . . . . . . . . . . . . . . . . . . . . 224.3 Modeling of Test Loop . . . . . . . . . . . . . . . . . . . . . . . . . . . . . . . . . . . . . 294.4 Planned Analysis . . . . . . . . . . . . . . . . . . . . . . . . . . . . . . . . . . . . . . . . 29
5. COST AND SCHEDULE . . . . . . . . . . . . . . . . . . . . . . . . . . . . . . . . . . . . . . . 316. SUMMARY . . . . . . . . . . . . . . . . . . . . . . . . . . . . . . . . . . . . . . . . . . . . . . 337. REFERENCES . . . . . . . . . . . . . . . . . . . . . . . . . . . . . . . . . . . . . . . . . . . . 35APPENDIX A. Binary Gas Diffusion . . . . . . . . . . . . . . . . . . . . . . . . . . . . . . . . . . . A-1APPENDIX B. Derivation of Axial Tritium Distribution for Molten Salt Application . . . . . . . . . B-1
iii


LIST OF FIGURES
1 Tritium speciation. . . . . . . . . . . . . . . . . . . . . . . . . . . . . . . . . . . . . . . . 62 Process flow diagram for the test loop. . . . . . . . . . . . . . . . . . . . . . . . . . . . . . 153 Instrument cabinet . . . . . . . . . . . . . . . . . . . . . . . . . . . . . . . . . . . . . . . . 164 Test loop positioned in walk-in hood . . . . . . . . . . . . . . . . . . . . . . . . . . . . . . 175 Flow loop schematic . . . . . . . . . . . . . . . . . . . . . . . . . . . . . . . . . . . . . . 196 Comparison of the total loop pressure drop as a function of flowrate at 700C. . . . . . . . . 207 Comparison of loop pressure drop as a function of flowrate at two temperatures using
Mathcad. . . . . . . . . . . . . . . . . . . . . . . . . . . . . . . . . . . . . . . . . . . . . 218 Modelica model for PbLi vacuum permeator test. . . . . . . . . . . . . . . . . . . . . . . . 239 Time history of Pb-17Li vacuum permeator tritium removal efficiency . . . . . . . . . . . . 2410 Axial tritium distribution at three radial locations for PbLi permeator test . . . . . . . . . . . 2511 Modelica model for FLiBe vacuum permeator test. . . . . . . . . . . . . . . . . . . . . . . 2612 Time history of FLiBe vacuum permeator tritium removal efficiency . . . . . . . . . . . . . 2713 Axial tritium distribution at three radial locations for FLiBe permeator test . . . . . . . . . . 2814 Modelica model for test loop . . . . . . . . . . . . . . . . . . . . . . . . . . . . . . . . . . 2915 Tritium management project schedule – Phase 1 & 2 . . . . . . . . . . . . . . . . . . . . . 31
v

LIST OF TABLES
1 Calculation of tritium injection to represent equilibrium conditions . . . . . . . . . . . . . . 32 Task 2 Tests . . . . . . . . . . . . . . . . . . . . . . . . . . . . . . . . . . . . . . . . . . . 73 Task 3 Tests . . . . . . . . . . . . . . . . . . . . . . . . . . . . . . . . . . . . . . . . . . . 84 Task 4 Tests . . . . . . . . . . . . . . . . . . . . . . . . . . . . . . . . . . . . . . . . . . . 95 Pump specification notes . . . . . . . . . . . . . . . . . . . . . . . . . . . . . . . . . . . . 146 Pressure losses in molten salt flow loop at 1.9 L/s (30 gpm) and 700C . . . . . . . . . . . . 197 Pressure losses in molten salt flow loop at 0.95 L/s (15 gpm) and 700C . . . . . . . . . . . 208 Radial tritium distribution for Pb-17Li comparison . . . . . . . . . . . . . . . . . . . . . . 249 Comparison of PbLi analytical results to present model . . . . . . . . . . . . . . . . . . . . 2410 Parameters for FLiBe test . . . . . . . . . . . . . . . . . . . . . . . . . . . . . . . . . . . . 2611 Correlations for FLiBe test . . . . . . . . . . . . . . . . . . . . . . . . . . . . . . . . . . . 2712 Radial tritium distribution for FLiBe comparison . . . . . . . . . . . . . . . . . . . . . . . 2813 Comparison of FLiBe analytical results to present model . . . . . . . . . . . . . . . . . . . 2814 Parameters for binary gas mass diffusion calculation . . . . . . . . . . . . . . . . . . . . . . A-3
vii


ACRONYMSCSTF Coolant Salt Test FacilityESV emergency shutoff valveFHR fluoride salt high temperature reactorFLiBe LiF-BeF2FLiNaK LiF-NaF-KFMWth megawatts-thermalMSRE Molten Salt Reactor ExperimentORNL Oak Ridge National LaboratoryPB pebble bedPFD process flow diagramPHTS primary heat transfer systemP&ID process and instrumentation diagramPID proportional-integral-derivativePLC programmable logic controllerPNNL Pacific Northwest National LaboratoryRAFM reduced activation ferritic martensiticRHS right-hand side
ix


ABSTRACT
This report summarizes physical, chemical, and engineering analyses that have been performed to supportdevelopment of a test loop to study tritium migration in FLiBe (2LiF-BeF2) salts. The loop will operateunder turbulent flow, and a schematic of the apparatus has been used to develop a model in Mathcad tosuggest flow parameters that should be targeted in loop operation. The introduction of tritium into the loophas been discussed, as well as various means to capture or divert the tritium from egress through a testassembly. Permeation was calculated, starting with the development of a Modelica model for a transportthrough a nickel window into a vacuum, followed by modification of the model for a FLiBe system with anargon sweep gas on the downstream side of the permeation interface. Results suggest that tritium removalwith a simple tubular permeation device will occur readily. Although this system is idealized, it suggeststhat rapid measurement capability in the loop may be necessary to study and understand tritium removalfrom the system.
1. INTRODUCTION
The relatively large production rate of tritium in molten salt reactors is a primary challenge for deploymentof this reactor type, and methods to manage tritium disposition must be developed to limit the release oftritium to the environment. At the high operating temperature of molten salt reactors, tritium can penetratemetal boundaries. This is problematic in the primary-to-intermediate loop heat exchanger of proposedreactor designs because it creates a potential pathway to the environment.
It is considered important to develop and demonstrate both redox control capability and specific tritiumcapture methods prior to moving to larger scale systems. Redox control in the fluoride salt-based systemwill control the form of tritium and will therefore impact the release rates. Therefore, the underlyingmechanisms must be understood in designing tritium capture methods.
The tritium management project is divided into two phases that are intended to lay the groundwork for anengineering scale facility. Static capsule tests in Phase 1 will examine materials and compatibility issuesand inform the design of test assemblies for the flow tests in Phase 2. It is also considered important tosimulate reactor-like tritium concentrations in the appropriate form, so a second goal of the Phase 1 effortwill be to produce a lithium tritide (LiT) pellet as a means to introduce tritium into the flow loop of Phase 2.
The Phase 2 tests will provide a platform for examining tritium capture methods in a flowing system withturbulent flow conditions and associated mixing and concentration gradients. The smaller scale of thesetests will allow for comparison of different methods and down-select for use in the engineering scalefacility. Additionally, the development and proof-testing of tritium measurement techniques and in-situmeasurement and control of the redox condition of the salt will provide a basis for design of similarsystems in the engineering scale facility.
This report includes a section on tritium lifecycle behavior and reactor chemistry control, providing a basisfor the planned experimental work. This is followed by a more detailed description of the proposed testingin Phases 1 and 2, including a description of the flow test loop.
The proposed test loop is then analyzed using computer models. Both thermal-hydraulic and tracesubstance transport modeling has been developed. Simultaneous calculation for the molten saltpressure-temperature fields and tritium transport/speciation solution is possible using the unified models
1

demonstrated. The developed models are compared to analytical solutions and other codes if applicable asa preliminary verification to their fidelity and performance.
2

2. TRITIUM LIFECYCLE BEHAVIOR AND REACTOR CHEMISTRY CONTROL
2.1 Tritium Production
Scaling of the tritium mitigation experiment will require an estimate of the amount of tritium to beintroduced, which will be based on (a) the steady state introduction of a flowing mixture of T2 gas or (b)addition of LiT. In either case, a steady-state concentration will be established in the pumped loop bypasssection before introducing flow to the test section.
Parameters for calculations of equilibrium tritium production are provided from the thesis work ofStempien [1]. The analysis of tritium production is based on a 236 MWth Mk1 PB-FHR. The 6 Lexperimental loop to be built at ORNL, which is described in more detail later in this report, will have a 2.5L bypass that can be charged with tritium before allowing the salt to flow to the test assembly. If it isassumed that the 6 L test loop will scale with the primary heat transport system (PHTS) of Mk1 (46.82m3), the volumetric scaling factor is 7,800. At the beginning of a run, tritium will be introduced into the 2.5L loop bypass, where a steady-state concentration will be established. The test assembly will be isolatedfrom the bypass, so the concentration of tritium in the bypass loop must be greater than that required forloading the complete assembly (6 L/2.5 L) by a factor of 2.4 g to give the desired concentration in thecomplete loop. In Table 1 below, details of Mk1 are given in column 2. The tritium loading required toscale the 6 L ORNL loop to the Mk1 PHTS is shown in column 3, which dictates the tritium loading in thebypass loop, shown in column 4. Note that these idealized calculations assume that losses duringintroduction of tritium are minimal, that equilibrium is quickly established, and factors such as flow rateand surface/volume ratio have no effect on equilibrium concentration. Thus, the injection rate to reproducesteady state conditions is estimated as ∼4 mCi/h.
Table 1. Calculation of tritium injection to represent equilibrium conditions
Mk1 (PHTSLoop)
ORNL loop includingtest assembly scaledwrt Mk1 PHTS
ORNL loop bypass,2.4x more tritiumthan complete loop
Volume (m3) 46.82 6 × 10⁻³ 2.5 × 10⁻³
Power (MWth) 236 0 0Equilibrium T production (Ci/d) 692 n/a n/aVolumetric T production (atom T/m3-s) 3.5 × 10¹⁵ 3.5 × 10¹⁵ 8.4 × 10¹⁵
Production or injection (mol T/s) 2.7 × 10⁻⁷ 3.5 × 10⁻¹¹ 3.5 × 10⁻¹¹
T production or Injection (Ci/h) 2.9 × 101 3.7 × 10⁻³ 3.7 × 10⁻³
Conversion factors used in the calculations are:1: 1 mol tritium = 29263.8 Ci; 3.59 ×10¹⁴ Bq/g2: Molar mass tritium = 3.016 g/mol
An alternative method of tritium injection is to add a pellet of LiT (molar mass of ∼10 g/mol) into thebypass loop and allow it to dissolve into the salt. Over a 24-hour period, the amount of tritium to beinjected (based on the analysis above) will be as much as 89 mCi, or 3.0 × 10⁻⁶mol T. This corresponds to∼30 µg of LiT.
The equilibrium calculations give a minimum in the total tritium inventory in the loop, as they do notaccount for tritium retained in the salt or on structural surfaces. Tritium concentrations in the salt can becalculated if the chemical potential of the salt is known, assuming thermodynamic equilibrium. Graphite
3

can have an uptake of 15% of the total inventory of tritium produced, as T2 and TF, mainly on the surfaceof the outer pyrolytic carbon layer. Although the Coolant Salt Technology Facility (CSTF) experiment atORNL [2] indicated that the system had to be “passivated” before an equilibrium experiment could becarried out, interaction of fluoride with metal surfaces in the reactor does not form a passivation layer. Therole of these interactions on the salt chemistry must be explored in the static and flowing experimental saltsystems.
2.2 Tritium Speciation Calculations
Tritium can be added to the loop either in the form of T2 gas or as LiT, as mentioned previously. Theaddition of a small amount of LiT to the salt is not going to affect the chemical potential, expressed as∆GF2 in [1]. Hence, the expression for fluorine potential formulated by Stempien can be used, defined bythe equilibrium (1), and the expression for the standard Gibbs free energy as calculated by Stempien usingHSC Chemistry, (2). The units of ∆G0
TF are kJ/mol TF. Temperature, T, is in K.
T2 + F2 → 2TF (1)
∆G0TF = −4.6976 × 10⁻¹⁰T 3 + 3.1425 × 10⁻⁶T 2 − 8.8612 × 10⁻³T − 2.7305 × 10² (2)
At 650C, ∆G0T F is -278.589 kJ/mol TF. For an FHR, the equilibrium governing the dissolution of LiT (3)
may be governed by HF/H2 in contact with the salt (4). PT F and PT2 are the fractional partial pressures ofTF and T2, and R is the gas constant in units of 8.314 J/mol-K.
LiT + TF↔ LiF + T2 (3)
∆GF2 = 2RT ln
PTF√PT2
+ 2∆G0TF (4)
Thus, given the fluorine chemical potential, the ratio of TF to T2 can be determined, or vice versa. In thisparticular calculation, the ratio of PTF and PT2 was determined for several redox potentials ranging from-660 to -720 kJ/mol F2 at 650C. The partial pressure of TF to T2 can be determined knowing the Henry’slaw coefficients for TF and T2, equations (5,6) and substituting them into equations (7,8) to determine theconcentrations in the molten salt phase. The units of the Henry’s law constants are mol/m3-Pa, and thetemperature coefficient, t, is in units of C. Molten salt concentrations can be determined by solving Eq. (9)as a quadratic equation, giving two roots, one of which leads to a negative concentration and is thereforeunphysical. In this expression, ctotal is the total concentration of tritium introduced into the system, 30 µgof LiT or 3 × 10⁻⁴ mol/m3, as discussed earlier. With these results, the equilibrium for Eq. (3) iscompletely determined based on the equilibrium constant expression for Eq. (3), as shown in Eq. (10), andthe determination of ∆G0
LiT+TF in Eq. (11). Note that except for LiF, concentrations are being used insteadof activities in Eq. (11), an assumption that has been used with other fluoride salt solutes. This probablycauses little error for the low concentration species: T2, LiT, and TF. Activities for LiF in the eutectic havebeen determined by Holm [3, 4] and more recently by Romero-Serrano et al. [5].
4

kTF,FLiBe = 0.001707 exp−0.00426t (5)
kT2,FLiBe = 2.714 × 10⁻⁸ exp−0.004235t (6)
cTF = kTF,FLiBePTF ptotal (7)
cT2 = kT2,FLiBePT2 ptotal (8)
PTF√PT2
=
ctotal−2cT2ptotalkTF,FLiBe√
cT2ptotalkT2 ,FLiBe
= exp∆GF2 − 2∆G0
TF
2RT(9)
KLiT+TF =aLiF[T2]
[LiT] [TF](10)
∆G0LiT+TF = ∆G0
f ,LiF,FLiBe + ∆G0f ,TH + ∆G0
f ,LiH + ∆G0f ,HF (11)
Thermodynamic data for LiH, LiF, and HF are available from JANAF [6]. The graph below (Fig. 1a)replicates the Stempien graph, 3.16, based on the equilibrium LiH + HF↔ LiF + H2. The H replaces T forthis calculation. The partial excess Gibbs free energy of LiF in the molten salt has been reported by Holm[3] at 862C as:
GELiF =
(−15.527 − 90.245X − 114.198X2
)X2 (12)
For LiF in FLiBe at a mole fraction, X, of 0.667, from Holm and Romero-Serrano [3] and [5], one cancalculate an activity coefficient of 0.91. For the purposes of the calculation, the chosen redox potential setsthe ratio of the partial pressures of T2 and TF in contact with the salt. From there, one can calculate thedissolved T2 and TF based on Henry’s law coefficients. The dissolved concentrations T2 and TF are givenin the second plot (Fig. 1b). The partial pressures of T2 and TF over the salt are low (ranging from 6 × 10⁻³
to 1 × 10⁻⁴, and 2 × 10⁻⁶ to 4 × 10⁻⁵ atm respectively), assuming ptotal = 101325 Pa. The redox potentialcould be set by introducing a non-tritiated H2/HF mixture, or a couple based on a multivalent metalfluoride. At 650C and at reducing conditions (MSRE operated at -700 kJ/mol) the equilibrium is pushedway over to the right, meaning that LiF and T2 are more stable than LiT and TF. The LiF was assumed tobe set by the salt concentration and not to change, so any change in concentration of LiT is related to theT2/TF equilibrium. Data that are missing that would improve this calculation are free energies of mixingfor LiF/BeF2, thermodynamic data for TF and T2, and solubility data for LiH or LiT in FLiBe.
5

(a) LiH in FLiBe
(b) Tritium in FLiBe
Figure 1. Tritium speciation.

3. PROPOSED TESTING TO MEET OBJECTIVES
The objective of Phase 1 is to provide information in support of the design and operation of the flow loop.A breakdown of the tasks is provided below. This is followed by a discussion of the test assemblies andcapture methods proposed for testing in the flow loop of Phase 2.
3.1 Static Tests: Phase 1 Task Definitions
3.1.1 Task 1: Investigate the use of LiT as tritium source for the test loop
As it is not feasible to generate tritium in situ by transmutation, the current design of the loop includes aninjection system based on a thin-walled, closed-ended nickel tube that is pressurized with a mixture of inertgas and T2 [2]. This system was used in a tritium test loop as part of the MSRE program. While proven andreliable, it has several disadvantages, including a slow response time and the fact that tritium is injectedfrom a metal/liquid interface rather than generated in the liquid bulk, which better simulates in-coreconditions. There are plans to investigate whether the rapid dissolution of LiT could be an alternativemethod to provide a controlled T concentration in the liquid bulk. Scoping calculations show that thehydride is highly unstable in the salt at the reference temperature, but the method to fabricate LiT and itsuse as a tritium source should be validated by scoping experiments.
3.1.2 Task 2: Tritium adsorption in FLiBe/getter systems at different redox conditions
The solubility of hydrogen isotopes in fluoride salt depends on the redox condition of the system, becausethis determines whether the isotopes of hydrogen (H, D, T) are present in elemental form (e.g., H2) or asHF. The activities for this project will focus on a comparative analysis of adsorption in differentcrucible/FLiBe/getter systems under controlled redox conditions. Redox control is established by flowingdifferent mixtures of H2/HF in an Ar purge above the melt. This is also planned for the loop experiments.T2 gas will be added to the flowing mixture, effectively establishing a controlled concentration of HT. Theprecise determination of transport properties will not be an objective of this task, as this will be a functionof the loop conditions. However, the kinetics of sorption and desorption will be analyzed to determine howthey affect tritium migration in the absence of flow as a baseline case. Tests to be carried out will becomplementary to those at the University of Wisconsin [7].
Table 2. Task 2 Tests
D2 Tests (1 year)
2.1 Ni/FLiBe2.2 Ni/FLiBe/Nuclear graphite2.3 Ni/FLiBe/Nickel coated metallic getter particles2.4 Ni/FLiBe/C getters (high porosity, high denisty foams, etc)2.5 Ni/FLiBe/proton conducting membrane
T2 Test (6 months)
2.6 Ni/FLiBe2.7 Ni/FLiBe/Nuclear graphite2.8 Ni/FLiBe/Nickel coated metallic getter particles2.9 Ni/FLiBe/C getters (high porosity, high density foams, etc).
Getter materials are discussed in Sec. 3.2.1. Provisions must be considered to allow post-experimentanalysis of the getter materials (removal of salt from crucibles, removal of salt residues by acid cleaning,
7

etc). In the first phase of testing, D2 will be used instead of T2, in concentrations high enough to allow itsdiscrimination. This will simplify handling and supporting analysis. The preliminary matrix for tests isprovided in Table 2.
3.1.3 Task 3: Development of sensors to measure tritium concentration in FLiBe
The development of sensors capable of measuring the local concentration of tritium in FLiBe wouldsubstantially increase the accuracy of the performance assessment to be conducted in the flow loop. Sensorfabrication activities are included in the scope. The sensor test matrix is provided in Table 3.
Table 3. Task 3 Tests
Sensor tests (1 year) 3.1 Permeation sensor (nickel membrane)3.2 Electrochemical sensor (impedance spectroscopy)
A permeation cell with a nickel window has been described previously by Calderoni et al. [8] The cell,which is designed to operate at molten salt temperatures of 500-700C, measures the concentration oftritium above the molten salt surface from 0.1 ppm to 10%. The cell can either be used to inject tritium intothe salt from a gas stream (4 cm3/min Ar/H2) or to remove tritium from the salt for monitoring (into a flowof 20 cm3/min Ar/H2). One key aspect of the permeation cell design is a nickel-200 plate window throughwhich tritium will readily diffuse. In Calderoni’s work, the sweep gas transported diffused tritium to asampling system that included a quadrupole mass spectrometer and a gas chromatograph equipped with aproportional counter.
An electrochemical sensor for online monitoring of fluoride chemical potential is now under development,and fundamental work in this area would contribute to Task 3 of this proposed scope of work. Anodicstripping voltammetry has been used to measure dissolved chromium in FLiNaK salts and can be used tomonitor trace metals at concentrations as low as 1 ppm [9]. In this work at the University of Wisconsin,working, counter, and reference electrodes were all made from platinum wire. Although the electrodeswere immersed in the salt, an accompanying thermocouple was located in a headspace formed by analumina apparatus. Such an assembly would require modification for FLiBe salts because of the solubilityof Al2O3. A collaboration of Pacific Northwest Nuclear Laboratory (PNNL) and University of Cincinnati[10] used cyclic voltammetry to investigate europium redox couples in chloride salts. As these are activeareas of research, it is expected that a collaboration will be encouraged to use the ORNL loop as a test bedfor molten salt electrochemical measurements.
3.1.4 Task 4: Modeling and simulation analysis
Modeling and simulation analysis are performed in support of Tasks 2 and 3. The main objectives are givenin Table 4.
Modeling is discussed in Sec. 4. Several modeling tools were assessed, including TMAP [11] andTRIDENT [1]. It was determined that a unified simulation tool could be developed in the Modelicaenvironment. While the development is not complete, the foundation for a complete modeling solution hasbeen laid.
8
Table 4. Task 4 Tests
Modeling andsimulation activities
4.1 Support to the design development of the test cells(Task 2) and permeation sensor (Task 3), as wellas the definition of test parameters (temperature,pressure, flow, input tritium concentration, etc.)
4.2 Support to data analysis for the evaluation oftransport properties and the impact of parasitic ef-fects (permeation losses, adsorption in structuralcomponents, etc.)
3.2 Flow Tests: Phase 2 Task Definitions
3.2.1 Task 1: Tritium Test Assembly Design for ORNL Loop
The goal of the tritium mitigation operation is to keep the partial pressure of tritium below 0.05 Pa in theprimary circuit to prevent removal through the heat exchangers. Test sections will be created that can beinterchanged on the pumped loop. Tritium mitigation by sorption (adsorption, absorption, andchemisorption) will be investigated. Permeation through membranes will also be tested. Both sorption andpermeation rates are dependent on the diffusion of tritium to the capturing material and adsorption onto thematerial surface. In permeation, absorption into the material is the step after adsorption, followed bydiffusion through the barrier, release from the other side of the barrier, and diffusion into the recovery fluid.Tritium barriers will not be credited in these tests, although a tungsten coating may be used to minimizeloss outside of the test section.
We have considered five configurations for the tritium test assembly, in addition to an empty tube: (i)adsorption onto nuclear graphite (pyrolytic carbon), (ii) adsorption onto a high porosity carbon bed, (iii)adsorption on a metallic getter such as ZrC, (iv) permeation through a membrane, such as the diffusionthrough Ni or Pd coating on a porous support, and (v) permeation through a proton conducting membrane.These are be discussed in more detail below.
(i) Adsorption: nuclear graphite (pyrolytic carbon)
Both TF and T2 can be removed from the molten salt by graphite [7]. The partial pressure of T2 can bereduced by two orders of magnitude and that of TF by one order of magnitude. Graphite in the reactor willhold up tritium release, but it may take different forms, depending on its properties and configuration. In anFHR, graphite will be present as a coating for fuel particles and also as an assembly for housing the fuel.Pyrolytic carbon layers greatly reduce the permeation of tritium into the graphite. Pebbles like thosedesigned for gas-cooled reactors have no pyrolytic carbon layer, so they will allow tritium to permeateeasily. The tritium will move along grain boundaries and become trapped through dissociativechemisorption at edges and grain boundaries.
There are several factors that will affect the adsorption of tritium into the carbon. It is not known if carbonsorption in an FHR is limited by kinetics or solubility. Besides the form of the carbon as discussed earlier,radiation damage to the carbon and radiation flux may affect tritium migration. Radiation lowers hydrogenatom diffusivity in carbon by one or two orders of magnitude, so it would also reduce the rate of tritiumcapture. The carbon will saturate if it is not recirculated as in a pebble bed reactor, as a loading of 2-10wppm T/C is needed to maintain a low tritium partial pressure. Saturation will also depend on the
9

non-radiolytic hydrogen present. If hydrogen is added to the system to control the redox conditions of thesalt, the hydrogen will also adsorb onto carbon, as will the tritium. Under accident conditions, the tritiumcan be desorbed when temperatures are elevated. The study of carbon materials is being conducted at theUniversity of Wisconsin[7].
(ii) Adsorption: high porosity carbon for adsorption bed
Non-nuclear grade porous carbon (e.g., activated carbon CAL-TR, or Maxsorb MSC-30) may have aspecific surface area that is up to 1,000x that of nuclear grade graphite (e.g., IG110U), and results fromUniversity of Wisconsin [7] show a hydrogen uptake of close to 5 cm3/g at pressures up to 9,000 Pa.Although this material is less stable than nuclear-grade graphite, it could be employed outside the corewhere fields are much lower. The adsorption beds would likely be prepared as fixed beds for the loopdesign. Other possibilities for the reactor include a fluidized bed, in which the absorbent is transported withthe salt, and a counter current flow moving bed. It would be more difficult to engineer the bed in the lattercases, although the moving bed allows for online regeneration and chemistry control by introduction of asweep gas (H2/HF).
ORNL has graphite spheres that are 3 cm in diameter available for bed preparation. These have been madeto simulate FHR fuel. They can be packed into a tube configured to give the correct flow rate and pressuredrop specified for the loop. Online analysis could be conducted by passing a sweep gas through the testsection at the same flow rate/across the same interfacial area as for the other test sections. Analysis of thegraphite would be completed post-test by heating and monitoring the gas release of tritium during theregeneration cycle.
(iii) Adsorption: metallic getter (ZrC)
Carbides will be present in the fuel assemblies: SiC and ZrC. The latter is introduced as a sacrificial layerto absorb excess oxygen generated during fissioning of uranium in UO2. (Porter, Knight et al. 2013) Suchcarbides may have a role in the sorption of tritium as dissociative chemisorption of hydrogen has beenobserved for ZrC, NbC, and HfC at a specific crystal face (111) [12, 13]; however, retention of tritiumrequires migration into the material, and that has been shown to be negligible for temperatures above700C for deuterium implanted into metal carbides [14]. Another key factor is the stability of the carbide inthe molten salt. For instance, ZrC as a getter would have to be more stable than ZrF4 or Zr under FHRconditions of temperature and fluorine chemical potential. The Gibbs energy of formation for ZrF4 rangesfrom -440 (500C) to -410 (800C). Hence it is not as stable as BeF2, -455 (500C) to -430 (800C)[1].The Gibbs energy of formation of ZrC is much lower than that of Be2C, so it is likely that if it wereintroduced as the carbide, ZrC would be stable and would not affect the chemistry of the molten salt.Except for bench-scale research on the dissociative chemisorption of hydrogen on surfaces, the use ofmetal-carbide getters does not look promising at FHR operating temperatures. There is discussion in theliterature of using carbides to enhance hydrogen transport within composite Ni-ZrC electrode materials, butthis work has been done at temperatures below 100C [15], well below the range of FHR operation.
(iv) Permeation through a membrane (diffusion through Ni or Pd coating on porous ceramic support)
Hydrogen can reversibly adsorb and dissolve in base metals such as Ni or Pd. The hydrogen (or tritium)will transport through the membrane following the concentration or temperature gradient or both. Apermeation membrane placed upstream of a heat exchanger will remove much of the tritium before itencounters the high-surface area heat exchanger, where tritium release can be problematic. The equationfor tritium flux, J (atom/s) through a tube of length L, outer diameter do, inner diameter d, is given by Eq.
10

(13) [16]:
J =2πL
ln(
dod
)Φ (T )(px
2 − px1
)(13)
where Φ is the permeation coefficient of the material, and the term on the RHS of the equation gives thedifference in partial pressure from the downstream and upstream side of the membrane, respectively. Theexponent x is experimentally determined and varies from 0.5 to 1.0, depending on whether the permeationis bulk or surface limited. When x is 0.5, the equation becomes a form of Sievert’s Law, which states thatthe concentration of dissolved hydrogen is proportional to the square root of the partial pressure ofhydrogen in contact with the surface. If the thickness of the metal layer and the permeation coefficient areknown, then the flux of hydrogen through the metal over a given length can be calculated. Film thicknessesof 25 µm can be used if support is provided. ITER plans to use Pd-Ag on stainless steel as a means toseparate hydrogen, but at lower temperatures than an FHR [17]. This material’s permeability is about 3.5times that of Ni, a structural metal under consideration for FHRs. A ceramic such as alumina can be usedas a support, which dissolves in FLiBe salt, but in this case it would be protected by the metal layer.Layered materials with secondary permeation layers can also be used. Cermets, which are a sinteredmixture of ceramic and metal, have also been proposed. A drawback of diffusion-controlled permeation isthat it depends on the difference in pressure from the upstream and the downstream sides. In the case oflow concentrations of tritium in the loop, the permeation flux will be very low.
For ORNL testing, Ni-coated tubing will be tested for permeability to tritium. The thickness of the tubingwill be minimal, 10-20 mil (254-508 µm). The sorptive Ni layer on the tubing can be made even thinner, 25µm, to improve flux. A number of concentric tubes will be mounted in the larger test-section with amanifold design so that either a sweep gas can be passed inside or outside the tubing or a vacuum can bepulled, thus maintaining a concentration (or partial pressure) drop across the Ni membrane. The sweep gaswill be analyzed on-line using ion chamber counters and mass spectrometry. Getters can also be deployedin the stack to give integrated tritium capture, which may be necessary for mass balance calculations.
(v) Permeation: proton conducting (Perovskite on ceramic support/yttria)
To increase flux, other membrane configurations have been considered. With a proton-conductingmembrane, 100% selectivity for hydrogen can be achieved in response to an applied voltage. This is a newtechnology that was developed for fuel cells and is being considered for fusion applications [18, 19].Doped perovskites can be configured as hydrogen pumps [20, 21, 22, 23] and can easily be made bysintering stoichiometric oxides[24, 25, 26, 27]. However, because of the novelty, the technology is not aswell developed as technologies for metal-coated membranes. Static testing of the materials in contact withmolten salt would be needed before these can be considered for the loop section. Tritium sorptionexperiments in a non-pumped configuration are also recommended. Deployment of the proton-conductingmembrane in the ORNL tritium test loop would be similar to that of the Ni-coated membrane, except thatelectrical isolation and the ability to add a bias to the membrane would be required. This engineeringwould be additional scope that could be addressed in a side project beyond the main focus of the tritiumextraction tests.
In summary, five configurations were considered for the tritium test assembly, in addition to an empty testsection. Some of these methods for tritium separation and trapping use relatively well understoodtechnologies, such as using graphite of different grades as a getter medium. Interaction of hydrogen with
11
these materials has been studied, but kinetics of sorption and desorption are still not well understood.Hence, static testing in Phase 1 should focus on kinetic vs capacity limitations for nuclear-grade graphite vshighly porous graphite. Any test plan should be complementary to the study of graphite at the University ofWisconsin. Metal carbides were suggested as a possibile getter material, but literature on the topicindicates that although these materials may superficially adsorb tritium, there is little penetration into theinterior. Particularly at FHR operating temperature, metal carbides will not affect the release of tritium intothe environment.
Permeation through membranes has also been postulated as a means for removal of tritium from the moltensalt. Expressions have been developed for permeation rates based on concentration gradient, but thistechnology should be further explored in both static and loop tests, as the expressions are empirical anddependent on assumptions about tritium behavior that have not been rigorously tested. Permeation rates arelikely to be low because of the low partial pressure of tritium in the primary loop. Application of an electricfield to a proton-conducting membrane may effectively pump tritium from the loop. The engineering andtesting of this material is very much in its infancy, especially in relation to FHR operation. It isrecommended that fundamental research be conducted in this area to develop this concept for enhancedpermeation rates.
3.2.2 Task 2: Detailed Loop Design and Fabrication
At the nominal operating temperature of the molten salt system, tritium and hydrogen permeation throughthe metal walls and structural components can be significant. In order to assess the effectiveness of atritium removal or capture system, accounting for tritium losses throughout the balance of the test loop isimportant. Developing a method for tritium introduction that provides a bounded initial concentration oftritium can reduce uncertainties associated with the longer term system losses. To this end, features wereincorporated into the flow loop design to reflect this proposed test methodology.
A process flow diagram is shown in Fig. 2 for the test loop. The storage tank in this concept provides alocation for melting and freezing the salt but is not used for tritium or other component additions. Themolten salt would be lifted into the test loop, and then a freeze valve on the vertical dip tube line would becooled to isolate the storage tank from the remainder of the system. The molten salt has lowertritium/hydrogen permeability than the metal walls of the system, so the salt in the freeze valve shouldprovide an adequate barrier.
The test loop consists of a cantilever-type centrifugal pump, an auxiliary/sample tank, and piping withflanged connections to allow installation of a test assembly. An example of a membrane-type test assemblyis shown in the diagram where a bundle of thin-walled nickel tubes is installed in a U-shaped shell. Saltflows through the tubes, and the shell is swept with argon gas to collect tritium that has permeated throughthe tube walls. There are freeze valves and a bypass line upstream of the test assembly. The freeze valvesallow isolation of the test assembly while flowing salt through the bypass line to establish initial tritium andredox conditions in the salt. Opening the freeze valves to the test assembly and closing the bypass freezevalve will initiate flow of salt to the test assembly.
An "addition tube" is shown entering the horizontal flow leg downstream of the bypass line. This is apotential method of injecting tritium/hydrogen into the flowing salt that depends on permeation of a nickeltube by the tritium or hydrogen, similar to the method used by Mays in the CSTF [2]. An alternativeapproach is the use of LiT pellets, as discussed in section 2.1. For this case, the pellets would likely be
12

added to the auxiliary tank and dissolved in the salt. The small flow through the auxiliary tank wouldprovide mixing into the main salt volume of the loop.
The auxiliary tank is designed to receive a small (leakage) flow from the pump and circulate salt back tothe suction of the pump. Tritium can potentially be added in LiT form to establish initial conditions in thesalt. The gas headspace in the auxiliary tank may be used for redox control of the salt via H2/HF addition.
An enclosure surrounds the pump, auxiliary tank, and piping up to the flanges where the test assembly isattached. This region is swept with argon gas and directed to the sampling system for measurement of thetritium content. This measurement represents tritium losses from the non-test assembly portion of the loop.
The storage tank will be fabricated from 8-inch Sch 10 pipe and end caps. A 6-inch Class 150 weld-neckflange will be welded to the tank body. The mating flange will contain ports for the dip tube and gas lines:a supply and vent for an argon cover gas used to inert the atmosphere in the tank and provide the gaspressure for moving salt into the test assembly. Metal C-ring seals are planned for the flange seals. Thesewere chosen partly due to their capability for achieving low gas leak rates.
The storage tank will also be used as the transfer vessel for receiving salt from the salt purification system.The tank will be moved to the fume hood containing the salt purification system. A transfer tube will beconnected between the purification vessel and the storage tank, and molten salt will be transferred betweenthe tanks using dip tube(s) and gas pressure.
Gases will be supplied from cylinders with appropriate safety controls. The gas sources are shown in asimplified form in Fig. 2. Hazardous gas sources will include emergency shutoff valves (ESVs) at thecylinders to provide PLC (programmable logic controller) controlled shutoff under adverse conditions.This is shown for the HF source in Fig. 2, but not for the hydrogen and tritium gas supplies. Wherepossible, gas will be controlled using gas mass flow controllers. In some cases, it may be necessary tocontrol gas addition to the system via partial pressure measurements in a known volume. Pressuretransmitters with appropriate accuracy will be used in this case.
Tritium accounting will be an important factor in evaluating the effectiveness of tritium capture methods.The sampling system is not well defined at this point and should be considered only as a placeholder on thediagram. Additional detail and instrumentation will be added as the design progresses.
The system will be controlled by an Allen Bradley Controllogix PLC. The instrument cabinet withcontroller, input/output modules, and associated terminal strips has been completed as a joint effort withanother project and is ready for field wiring connections in the lab. A photo of the instrument cabinetinstalled in the building 4505 lab is shown in Fig. 3. Process instrumentation will include pressure, flow,and temperature measurements.
A thermal management system will be made up of heater jackets and heat trace with heater powercontrolled by solid state relays through the PLC. The PLC heater control methodology was developed on aprevious molten salt project and will be adapted for use on this system [28]. A temperature measurementfor each heater zone is used as the input to a PID control loop that in turn controls the percentage of timethat the heater is turned on via the solid state relays.
Several of the loop components will require development. A pump with a suitable flow rate and developedhead must be procured. In particular, a pump with dry gas seals is desirable to eliminate potential reactionwith organic-based lubricants that are more commonly used in lubricated bearings and seals in hightemperature pumps. The FLiNaK test loop at ORNL [28] has successfully used dry gas seals, although
13

operating hours on the seals are not extensive at this time. Key elements of the pump specification areshown in Table 5.
Table 5. Pump specification notesParameter NoteFlow rate 1 L/s (16 gpm)Total developed head (TDH) 148 kPa (25 feet of salt)
Pump style Cantilever shaft design with dry gas seals located outsideof wetted salt and high temperature zone
Fluid temperature 700C (normal operating)Wetted material Hastelloy C276
The analysis used to develop pump head requirements is described below (Sec. 4.1). The shaft length forthe pump and the location of seals and bearings are also important, especially considering the spacelimitations imposed by the walk-in hood. A sketch showing the pump installed above the storage tank isshown in Fig. 4. There is approximately 1.25 m available from the bottom of the pump to the top of theinside of the walk-in hood for the pump seals, bearings, and motor. An alternate design shown wouldextend the shaft and locate the motor above the hood top, with the dry gas seal located further from thehigh temperature region but still inside the hood.
The salt level in the pump (and auxiliary tank) will be the highest fluid level in the system. An argon gascover with trace amounts of H2/HF will be maintained above the salt level in the pump casing and auxiliarytank, also enabling the use of the dry gas seals on the pump shaft. A designed leakage flow rate through thepump or a small percentage bypass flow to the auxiliary tank will be used to provide a well-mixedrepresentation of the molten salt condition in the flowing salt.
Freeze valves have been used in other molten salt applications at ORNL but the specific size and geometrywill be new. Some development and testing of the freeze valves will be included in the scope of the project.
Methods for redox potential measurement and control must be developed for the test loop. Sensordevelopment is part of the Phase 1 work scope, as described previously (Sec. 3.1.3).
14

Figure 2. Process flow diagram for the test loop.

Figure 3. Instrument cabinet.
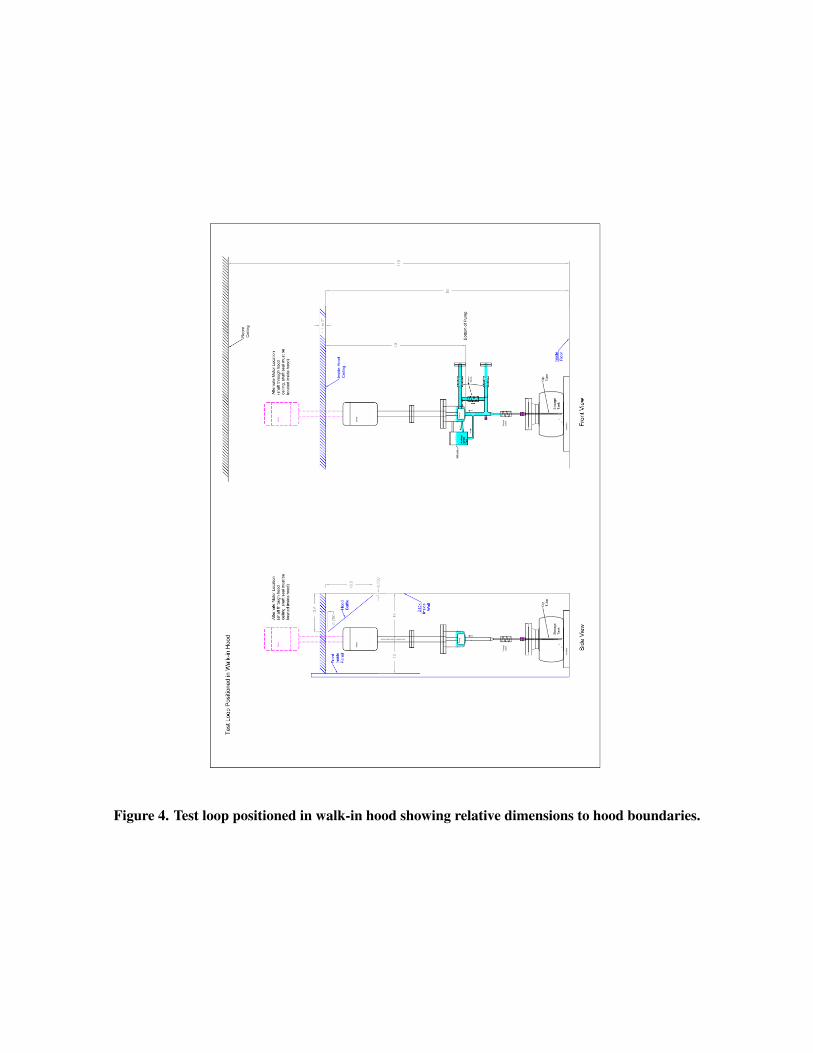
Figure 4. Test loop positioned in walk-in hood showing relative dimensions to hood boundaries.


4. DESIGN CALCULATIONS
4.1 Loop Pressure Drop Scoping Evaluation
The pump for this loop must accommodate planned and unplanned loop design changes. A pressure dropcalculation was performed in Mathcad [29] using the design shown in Fig. 2. The Mathcad workbook actsas a design tool, easily allowing the user to change pipe and tube geometry, as well as salt temperature andflowrate. Additional hydraulic components can be added as required. A snapshot of the schematic isprovided in Fig. 5.
Figure 5. Flow loop schematic excerpt showing permeator test section and pump. Sections of loopnumbered for convenience.
A model of the molten salt loop in RELAP5-3D 4.3.4 [30] was created using the SNAP tool [31] tobenchmark the capability of RELAP5-3D to help with future loop analysis. A breakout of the pressuredrops of the components of the molten salt loop for both the Mathcad and RELAP5-3D calculations for anexample statepoint is provided in Table 6. As shown in the table, there is good agreement between theRELAP5-3D calculation and the Mathcad calculation at each individual component.
Table 6. Pressure losses in molten salt flow loop at 1.9 L/s (30 gpm) and 700C
Loss Type Mathcad RELAP5-3D Description No. in[kPa] [kPa] Fig. 5
Friction 8.9 8.9 Flow in pump outlet line 1Form 11.8 11.8 Area change into permeator 2Friction 130.6 130.8 Flow in permeator tubes 3Form 30.1 30.2 Bends in permeator tubes 4Form 17.4 17.4 Area change from permeator 5Friction 15.9 15.5 Flow in pump inlet line 6Form 15.8 15.9 Bend in pump inlet line 7Total 230.5 230.5
A comparison of the pressure drop as a function of flowrate at the design temperature is shown in Fig. 6.The two curves show excellent agreement at all flowrates and are nearly indistinguishable.
The pressure drop at 1.9 L/s (30 gpm) is somewhat higher than desired from a system operating pressureperspective (Table 5). At half the flow rate, 0.95 L/s (15 gpm), the total pressure drop is reduced to 67 kPa.The Reynolds number in the permeator tubes for this lower flow is ∼6700, as compared to ∼13500 for the
19

Figure 6. Comparison between RELAP5-3D and Mathcad of the total loop pressure drop as a functionof flowrate at 700C.
higher flow case, both in the turbulent flow regime. The breakdown of pressure drop data is shown in Table7 for the lower flow rate.
Table 7. Pressure losses in molten salt flow loop at 0.95 L/s (15 gpm) and 700C
Loss Type Mathcad RELAP5-3D Description No. in[kPa] [kPa] Fig. 5
Friction 2.6 2.6 Flow in pump outlet line 1Form 3.0 3.0 Area change into permeator 2Friction 39.1 39.2 Flow in permeator tubes 3Form 9.0 9.1 Bends in permeator tubes 4Form 4.3 4.4 Area change from permeator 5Friction 4.4 4.6 Flow in pump inlet line 6Form 4.7 4.7 Bend in pump inlet line 7Total 67.1 67.1
Finally, the loop pressure drop as a function of flowrate was also calculated at design and limitingtemperatures using Mathcad, as shown in Fig. 7. As the FLiBe salt has a higher viscosity at lowtemperature, the pressure drop is much higher than when it was at the elevated design temperature. This isan important consideration when designing the loop, as it will be useful to perform tests at differenttemperatures. It is recognized that 500C may be conservatively low. The point of the figure is toemphasize the need to consider a range of operating temperatures when sizing components and designingthe loop.
20

Figure 7. Comparison of loop pressure drop as a function of flowrate at two temperatures usingMathcad.
21

4.2 Tritium Transport Modeling
A generic trace substance transport model has been developed in the Modelica environment [32] in thelatest version of the ORNL TRANSFORM Library. This model allows for dynamic solubility modeling oftrace substances according to both Henry’s and Sievert’s laws. It also allows for transport of tracesubstances between fluid and solid materials. The transport model is directly coupled to thethermal-hydraulic solution and draws the temperature and flow field from the heat transfer and fluid flowsolution. Diffusion, solubility, and permeability of trace substances in fluids and solids is calculateddynamically allowing for analysis of transients.
Multiple trace substances can be tracked. Each trace substance interacts with materials independent ofother trace substances. Trace substances can also interact with each other simulating chemical reactions.Together, these models allow for calculation of tritium transport and speciation in a molten salt loop.Additional capabilities not used in this analysis include (1) radioactive decay models for each tracesubstance with allowance for one trace substance decaying into another, (2) fission source of tracesubstance which can be coupled to a power source/distribution, and (3) transmutation of trace substancefrom exposure to radiation. While each of these capabilities is interesting to consider and provides the userwith power to model many scenarios, the focus here is on tritium transport and speciation.
Discussion of tritium transport modeling begins with model comparisons to analytical results (Sec. 4.2.1)and is followed by modeling of the proposed test loop (Sec. 4.3).
4.2.1 Model Comparison with Analytical Results
Two comparisons to analytical results are now described. The first is for tritium in Pb-17Li as described inHumrickhouse and Merrill [33]. The second is for a molten salt application.
4.2.1.1 Sievert’s Law Application
The Modelica model of the vacuum permeator described in Humrickhouse and Merrill [33] is shown inFig. 8.
The model is straightforward. A constant mass source of Pb-17Li at a fixed temperature is given a knownconcentration of tritium. The Pb-17Li flows through the permeator, depositing its tritium in reducedactivation ferritic martensitic (RAFM) tubes. Since tritium is dissolved in Pb-17Li and RAFM according toSievert’s law, the interface condition between the fluid and the metal is given by (14):
CPbLi
KPbLi=
CRAFM
KRAFM(14)
The vacuum condition on the outside of the tubes acts as a tritium sink. The ratio of the amount of tritiumthat exits the permeator dissolved in the fluid is compared to the amount that entered, resulting in acalculation of the removal efficiency, η. The efficiency as a function of time as calculated by Modelica isshown in Fig. 9.
22

Figure 8. Modelica model for PbLi vacuum permeator test.
The fina, steady-state value matches well with that calculated using the methodology adapted fromHumrickhouse and Merrill [33] as listed in Table 8. The exact values from [33] are not used, but insteadthey were recalculated to match the Sherwood number correlation used in Modelica. Namely, the exponenton the Schmidt number is 2/5 in Modelica and 1/3 in [33]. The tritium concentration as a function of axialposition in the permeator at different radial locations is shown in Fig. 10 for new and original models.Excellent agreement is demonstrated. The concentration of tritium at the beginning, middle, and end of thepermeator as a function of radial position for both the new and original work is listed in Table 8. Asummary of key parameters from the original work and the present work is given in Table 9.
23

Figure 9. Time history of Pb-17Li vacuum permeator tritium removal efficiency.
Table 8. Radial tritium distribution for Pb-17Li comparison
Loc. Rad. Pos. Theo. Val.[frac. inlet]
Calc. Val.[frac. inlet] Comment
InletBulk 0.984 0.969
Middle of firstpermeator volume
Liq. Int. 0.655 0.645Sol. Int. 5.508 5.420
MiddleBulk 0.557 0.553
Middle of centerpermeator volume
Liq. Int. 0.371 0.368Sol. Int. 3.117 3.096
OutletBulk 0.315 0.316
Middle of lastpermeator volume
Liq. Int. 0.210 0.209Sol. Int. 1.764 1.760
Table 9. Comparison of PbLi analytical results to present model
Parameter Symbol Theo. Val. Calc. Val. UnitsRemoval efficiency η 0.690 0.684 -Mass transfer coefficient KT 0.414 0.414 mm/s
24
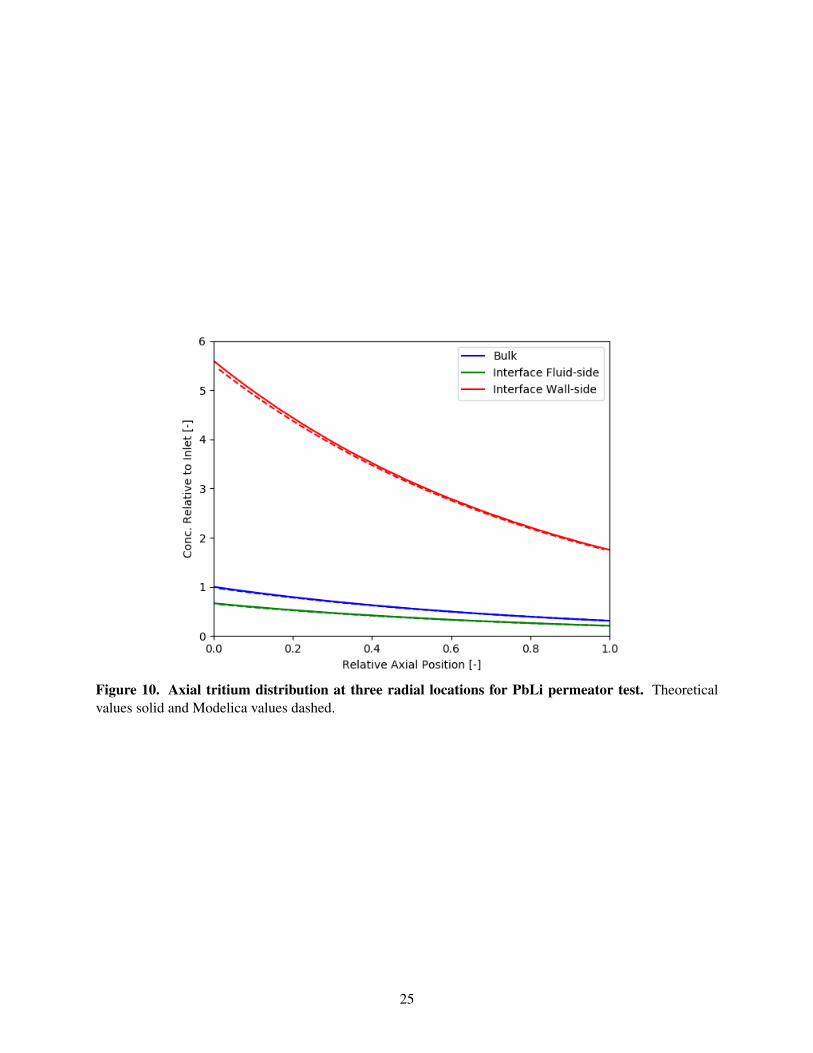
Figure 10. Axial tritium distribution at three radial locations for PbLi permeator test. Theoreticalvalues solid and Modelica values dashed.
25

4.2.1.2 Henry’s Law Application
Similar to the above calculation, an ideal vacuum permeator is created in Modelica using FLiBe as thecarrier salt and nickel as the tube material. The Modelica model is shown in Fig. 11.
Figure 11. Modelica model for FLiBe vacuum permeator test.
Since tritium is soluble according to Henry’s law in FLiBe and Sievert’s law in nickel, the interfacecondition between the salt and the metal is changed as shown in Eq. (15):
CFLiBe
KFLiBe=
(CNi
KNi
)2
(15)
As there is no reference document, key parameters for this test are listed in Table 10. Correlations are listedin Table 11. The derivation of the analytical solution is provided in App. B.
Table 10. Parameters for FLiBe test
Parameter Symbol Value UnitsLength L 50 mInner diameter d 2.54 cmOuter diameter do 2.59 cmVelocity v 2.5 m/sTemperature T 700 C
26

Table 11. Correlations for FLiBe test (Temperatures in K)
Parameter Symbol Value UnitsFLiBe Density ρ 2415.6 − 0.49072T kg/m3
FLiBe Viscosity µ 1.16 × 10⁻⁴ exp(
3755T
)Pa-s
Sherwood Number Sh 0.023Re4/5Sc2/5 -Diffusion coefficient (T2 in FLiBe) Dl 9.3 × 10⁻⁷ exp
(−42000
RT
)m2/s
Henry’s law constant (T2 in FLiBe) KH 8.27 × 10⁻⁹ exp(4.27 × 10⁻³T
)mol/m3-Pa
Diffusion coefficient (T2 in Ni) Ds 7.43 × 10⁻⁷ exp(−44100
RT
)m2/s
Solubility (T2 in Ni) Ks 953 × exp(−10700
RT
)mol/m3-
√MPa
An efficiency, η, is calculated as a function of time using the Modelica model, as shown in Fig. 12.Steady-state axial distributions at fixed radial locations for both the theoretical and Modelica models areshown in Fig. 13. Radial tritium distributions at fixed axial locations are given in Table 12, with keycalculated values summarized in Table 13. Excellent agreement is demonstrated.
Now that the trace substance model has been compared to both Sievert’s and Henry’s analytical solutions,the model for scoping out the performance of the test loop can be used with confidence.
Figure 12. Time history of FLiBe vacuum permeator tritium removal efficiency.
27

Figure 13. Axial tritium distribution at three radial locations for FLiBe permeator test. Theoreticalvalues solid and Modelica values dashed.
Table 12. Radial tritium distribution for FLiBe comparison
Loc. Rad. Pos. Theo. Val.[frac. inlet]
Calc. Val.[frac. inlet] Comment
InletBulk 0.995 0.989
Middle of firstpermeator volume
Liq. Int. 1.415 × 10⁻³ 1.468 × 10⁻³
Sol. Int. 13.157 13.420
MiddleBulk 0.765 0.762
Middle of centerpermeator volume
Liq. Int. 8.369 × 10⁻⁴ 8.707 × 10⁻⁴
Sol. Int. 10.118 10.334
OutletBulk 0.588 0.586
Middle of lastpermeator volume
Liq. Int. 4.948 × 10⁻⁴ 5.161 × 10⁻⁴
Sol. Int. 7.780 7.956
Table 13. Comparison of FLiBe analytical results to present model
Parameter Symbol Theo. Val. Calc. Val. UnitsRemoval efficiency η 0.415 0.414 -Reynolds number Re 20616 20619 -Schmidt number Sc 595 595 -Sherwood number Sh 838 837 -Mass transfer coefficient KT 0.171 0.171 mm/s
28

4.3 Modeling of Test Loop
A Modelica model of the test loop has been created, as shown in Fig. 14. The model contains all of therelevant components shown in Fig. 5 and also includes the sweep gas system. As a vacuum conditionoutside the permeator is no longer appropriate, a binary gas mass diffusion coefficient is calculated fortritium in Ar as described in App. A. This model is capable of modeling simultaneous transport of T2 andTF, but the redox control capability is not yet implemented. Therefore, results are not presented and arereserved for a future publication, where a more thorough investigation of the predicted test loopperformance can be provided.
Figure 14. Modelica model for test loop.
4.4 Planned Analysis
The Modelica model of the test loop from Sec. 4.3 can also be used to perform the pressure dropcalculations replacing the model shown in Sec. 4.1. Further, the tritium transport modeling capabilities canbe expanded to simultaneously consider T2 and TF with redox control. Currently, both T2 and TF can
29

simultaneously be a trace substance, but their interaction is not easily accommodated in the current versionof TRANSFORM. A simple first step would be to force a ratio of T2 to TF, as presented in Sec. 2.2, over arange of fixed redox potentials. Later, the model could be modified to explicitly include the cover gasbehavior, as well as H/T isotopic exchange and H2 or HT and HF transport.
A useful validation activity for the tritium transport modeling is to compare the model to experimental datafrom the CSTF [2]. Several steady-state and transient experiments were performed which could be used tobenchmark the model while waiting for the construction of the loop and procurement of loop materials.
30

5. COST AND SCHEDULE
Cost for the development program has been estimated assuming a 6-year timeline at ∼$7.3M. Major tasksare shown in Fig. 15. System checkout is shown covering two years and reflects the addition of tritiuminstrumentation and other components that are phased in the schedule to spread out some of the hardwareacquisition costs. Cost breakdown by year is shown at the bottom of the schedule.
Figure 15. Tritium management project schedule – Phase 1 & 2.
Key elements in the early part of the schedule will impact the time line. Procurement of a high temperaturepump for the flow loop is expected to take 9 to 12 months. Selection and procurement of special materialsfor the static capsule tests is important for that work to inform the fabrication of test assemblies for the flowloop. Additional funding earlier in the time line could improve the ability to meet the proposed overallschedule.
31


6. SUMMARY
The results of the Phase 1 and Phase 2 testing will provide the data necessary for design of tritium capturemethod(s) to be qualified in the engineering scale facility.
Tritium addition methods, and especially the development of LiT pellets, will be directly transferable to theengineering-scale facility. Development of redox control methods and associated measurement techniqueswill also be a key technology for operating the engineering-scale facility and molten salt reactors ingeneral. The test assemblies evaluated in the ORNL loop will be scalable to the engineering-scale facilityand will provide a basis for down-selecting appropriate designs and methods for tritium management.
Modeling of the proposed test loop is being used to size equipment and predict test section performance.Models for the pressure drop of the proposed loop are available to help wth pump procurement. A tracesubstance model has been developed and verified against simple analytical solutions for predicting tritiumtransport in the loop. A combined thermal-hydraulic and tritium transport/diffusion model will soon beavailable which will allow for dynamic modeling of the test loop. Partial validation of the dynamic modelis possible by using historical data from [2] with subsequent validation to follow operation of the test loop.
The analysis presented in this report indicates that a molten salt loop test assembly to study tritiumtransport is feasible. However, the following aspects must be considered in a detailed design, which is thenext step, pump design and procurement, materials compatibility, freeze valve development and testing,tritium injection method and testing, redox control of the molten salt, and instrumentation for monitoringof fluoride chemical potential and tritium detection.
33


7. REFERENCES
References
[1] J. D. Stempien. Tritium transport, corrosion, and fuel performance modeling in the fluoridesalt-cooled high-temperture reactor (FHR). PhD thesis, Massachusetts Institute of Technology, 2015.
[2] G. T. Mays, A. N. Smith, and J. R. Engel. Distribution and behavior of tritium in the coolant-salttechnology facility. Technical Report ORNL/TM-5759, Oak Ridge National Laboratory, 1977.
[3] J. L. Holm. Thermodynamic properties of some molten alkali fluoride-beryllium fluoride mixtures.Chemicke Zvesti, 30(6):759–767, 1976.
[4] J. L. Holm and O. J. Kleppa. Enthalpies of mixing in liquid beryllium fluoride-alkali fluoridemixtures. Inorganic Chemistry, 8(2):207–212, 1969.
[5] A. Romero-Serrano, M. Hallen-Lopez, and et al. Thermodynamic analysis of LiF-BeF2 and KF-BeF2melts by a structural model. Journal of Fluorine Chemistry, 130:336–340, 2009.
[6] M. W. Chase Jr. NIST-JANAF thermochemical tables. Journal of Physical Chemistry ReferenceData, 1998.
[7] C. W. Forsberg and et al. Tritium control and capture in salt-cooled fission and fusion reactors:Status, challenges, and path forward. Nuclear Technology, 197(2):119–139, 2017.
[8] P. Calderoni, P. Sharpe, M. Hara, and Y. Oya. Measurement of tritium permeation in flibe (2lif-bef2).Fusion Engineering and Design, 83(7-9):1331–1334, 2008.
[9] D. Ludwig, L. Olson, K. Sridharan, M. Anderson, and T. Allen. High temperature electrochemistry ofmolten fluoride salt for measurement of dissolved chromium. Corrosion Engineering, Science andTechnology, 46(4):360–364, 2011.
[10] C. A. Schroll, S. Chatterjee, T. Levitskaia, W. R. Heineman, and S. A. Bryan.Spectroelectrochemistry of eucl3 in four molten salt eutectics: 3 licl-nacl, 3 licl-2 kcl, licl-rbcl, and 3licl-2 cscl; at 873k. Electroanalysis, 28(9):2158–2165, 2016.
[11] G. R. Longhurst. Tmap7 user manual. Technical report, Idaho National Engineering andEnvironmental Laboratory, 2008.
[12] T. Aizawa and et al. Hydrogen adsorption on transition-metal carbide (111) surfaces. SurfaceScience, 381(2-3):157–164, 1997.
[13] S. T. Tokumitsu, T. Anazawa, and et al. Interaction of hydrogen with ZrC(111) surface:Angle-resolved photoemission study. Surface Science, 351(1-3):165–171, 1996.
[14] M. Balden and et al. Deuterium retention by implantation in carbide-doped graphites. PhysicaScripta, T103:38–42, 2003.
[15] M. Horigome and et al. Impregnation of metal carbides in Raney Ni-PTFE hydrogen electrodes.International Journal of Hydrogen Energy, 32(3):365–370, 2007.
[16] S. R. Sherman and T. M. Adams. Tritium barrier materials and separation systems for the ngnp.Technical Report WSRC-STI-2008-00358, Savannah River National Laboratory, August 2008.
35

[17] S. Welte, G. Ana, I. Cristescu, L. Doerr, B. Knutz, J. Konrad, and R. Michling. Construction andcommissioing of an iter sized pd/ag permeator for a water detritiation experiment. FusionEngineering and Design, 84:1969–1972, 2009.
[18] T. Xia, C. He, H. Yang, W. Zhao, L. Yang, and TMT Team. Hydrogen extraction characteristics ofhigh-temperature proton conductor ceramics for hydrogen isotopes purification and recovery. FusionEngineering and Design, 89:1500–1504, 2014.
[19] H. Borland, L. Llivina, S. Colominas, and J. Abella. Proton conducting ceramics for potentiometrichydrogen sensors for molten metals. Fusion Engineering and Design, 88:2431–2435, 2013.
[20] A. H. McDaniel, E. C. Miller, and et al. Sr- and Mn-doped LaAlO3-delta for solar thermochemicalH2 and CO production. Energy & Environmental Science, 6(8):2424–2428, 2013.
[21] A. H. McDaniel, A. Ambrosini, and et al. Nonstoichiometric perovskite oxides for solarthermochemical h-2 and co production. In R. Pitchumani, editor, Proceedings of the Solarpaces 2013International Conference, volume 49, pages 2009–2018, 2014.
[22] F. Chen. Novel methods of tritium sequestration: high temperature gettering and separationmembrane materials discovery for nuclear energy systems. Technical report, NEUP US DOE, 2014.
[23] R. Munkundan, E. L. Brosha, S. A. Birdsell, A. L. Costello, F. H. Garzon, and R. S. Willms. Tritiumconductivity and isotope effect in proton-conducting perovskites. Journal of the ElectrochemicalSociety, 146(6):2184–2187, 1999.
[24] G. G. Chang and et al. Control of interpenetration in a microporous metal-organic framework forsignificantly enhanced C2H2/CO2 separation at room temperature. Chemical Communications, 52(17):3494–3496, 2016.
[25] S. J. Nikodemski, J. H. Tong, and et al. Solid-state reactive sintering mechanism for protonconducting ceramics. Solid State Ionics, 253:201–210, 2013.
[26] J. H. Tong, D. Clark, and et al. Solid-state reactive sintering mechanism for large-grainedyttrium-doped barium zirconate proton conducting ceramics. Journal of Materials Chemistry, 20(30):6333–6341, 2010.
[27] J. H. Tong, D. Clark, and et al. Cost-effective solid-state reactive sintering method for highconductivity proton conducting yttrium-doped barium zirconium ceramics. Solid State Ionics, 181(11-12):496–503, 2010.
[28] G. Yoder and et al. Start-up operation experience with a liquid fluoride salt forced convection loop.Submitted to Nuclear Engineering and Design.
[29] PTC. PTC Mathcad, 2017. URLhttps://www.ptc.com/en/engineering-math-software/mathcad.
[30] RELAP5-3D Code Development Team. RELAP5-3D code manual volume I: Code structure, systemmodels and solution methods revision 4.3 INL/MIS-15-36723. Technical report, Idaho NationalLaboratory, 2015.
[31] Applied Programming Technology. Snap, 2017. URLhttps://www.aptplot.com/snap/index.jsp.
36

[32] Modelica Association. Modelica and modelica association, 2017. URL https://modelica.org.
[33] P. W. Humrickhouse and B. J. Merrill. Vacuum permeator analysis for extraction of tritium fromDCLL blankets. Fusion Science and Technology, 68(2):295–302, 2015.
[34] R. B. Bird, W. E. Stewart, and E. N. Lightfoot. Transport Phenomena. John Wiley & Sons. Inc., rev.2nd edition, 2007.
[35] J. D. Rogers and F. G. Brickwedde. Deuterium and tritium saturated-liquid PVT according to thequantum-mechanical principle of corresponding states. Journal of Chemical Physics, 42(8):2822–2825, 1965.
37


APPENDIX A. Binary Gas Diffusion


APPENDIX A. Binary Gas Diffusion
Calculation of the tritium transport rate from the outside of the permeator tubes to the Ar sweep gasrequires calculation of the diffusion coefficient of T2 in Ar. This is done using kinetic gas theory asdescribed in Bird [34]. The parameters for the binary gas mass diffusion calculation are listed in Table 14.The equation for calculation of the diffusion coefficient, DAB, for a mixture of two gases, A (Ar) & B (T2),is:
DAB = D0
√T 3
(1
MA+ 1
MB
)pσ2
ABΩAB(
kTεAB
) (16)
The value of collision diameter σAB is calculated from the arithmetic mean:
σAB =σA + σB
2(17)
The value of the characteristic energy εAB is calculated from the geometric mean:
εAB =√εAεB (18)
The value of the collision integral ΩAB as a function of reduced temperature is calculated frominterpolating the table provided in App. E of Bird [34]. In the Modelica calculation, the pressure, p, andtemperature, T , are allowed to vary with time, though the initial calculations are isothermal and isobaric.For example, at 700C and 1 atm with Ar and T2, the calculation results in 3.357 cm2/s.
Table 14. Parameters for binary gas mass diffusion calculationParameter Symbol Value Units Ref.
Diffusion constant D03
16NA
√2R3
π[34]
Ideal gas constant R 8.314 Jmol−K -
Avogadro’s number NA 6.022x × 1023 1mol -
Boltzmann’s constant k 1.381 × 10⁻²³ JK -
Molar mass species A MA 39.944 gm/mol -Molar mass species B MB 6.032 gm/mol -Collision diameter species A σA 3.418 Å [34]Collision diameter species B σB 2.949 Å [35]Characteristic energy species A εA
k 124 K [34]Characteristic energy species B εB
k 34.5 K [35]
A-3


APPENDIX B. Derivation of Axial Tritium Distribution for Molten SaltApplication


APPENDIX B. Derivation of Axial Tritium Distribution for Molten Salt Application
See below for derivation of axial tritium concentration based on Humrickhouse and Merrill [33].
Radial tritium flux in fluid:
Jl = KT(CB −Cw,l
)(19)
Wall interface condition:
Cw,s = Ks
√Cw,l
KH(20)
Radial tritium flux in solid (from cylindrical solution with vacuum boundary):
Js =2DsCw,s
d ln dod
(21)
Set fluxes equal:
Jl = Js (22)
KT(CB −Cw,l
)=
2DsCw,s
d ln dod
(23)
Substitute for wall interface condition:
KT(CB −Cw,l
)=
2DsKs
√Cw,lKH
d ln dod
(24)
Solve for Cw,l using quadratic equation:
Cw,l = CB +2 ± 2
√CBξ + 1ξ
(25)
Where:
ξ = KH
KT d ln dod
DsKs
2
(26)
Substitute Cw,l back into fluid flux:
Jl = KT
CB −
CB +2 ± 2
√CBξ + 1ξ
(27)
B-3

Perform differential mass balance on control volume:
∂CB (z)∂z
= −4vd
Jl (28)
Replace Jl and simplify:
∂CB (z)∂z
=8KT
vdξ
(1 ±
√ξCB (z) + 1
)(29)
Rearrange for solution:
∂CB
1 ±√ξCB + 1
=8KT
vdξ∂z (30)
Integrate both sides:
∫8KT
vdξ∂z =
8KT zvdξ
+ Const. (31)
∫1
1 ±√ξCB + 1
∂CB = −2(ln
( √ξCB + 1 ± 1
)∓
√ξCB + 1
)ξ
+ Const. (32)
Set equal, cancel out ξ in denominator, then define concentration at z=0 to C0 to solve for Const.:
CB (0) = C0 (33)
−2(ln
( √ξCB (z) + 1 ± 1
)∓
√ξCB (z) + 1
)=
8KT zvd
+ Const. (34)
Const. = −2(ln
( √ξC0 + 1 ± 1
)∓
√ξC0 + 1
)(35)
−2(ln
( √ξCB (z) + 1 ± 1
)∓
√ξCB (z) + 1
)+ 2
(ln
( √ξC0 + 1 ± 1
)∓
√ξC0 + 1
)=
8KT zvd
(36)
By inspection we find that the second solution is correct, yielding as the final result:
−2(ln
( √ξCB (z) + 1 − 1
)+
√ξCB (z) + 1
)+ 2
(ln
( √ξC0 + 1 − 1
)+
√ξC0 + 1
)=
8KT zvd
(37)
This function does not have a closed form solution for CB (z) and requires an iterative approach to solve ateach axial location.
B-4