tripolar laplacian electrocardiogram and moment of activation...
TRANSCRIPT

IOP PUBLISHING PHYSIOLOGICAL MEASUREMENT
Physiol. Meas. 28 (2007) 515–529 doi:10.1088/0967-3334/28/5/006
Tripolar Laplacian electrocardiogram and moment ofactivation isochronal mapping
W Besio and T Chen
Department of Biomedical Engineering, Louisiana Tech University, 711 South Vienna St.,Ruston, LA, USA
E-mail: [email protected]
Received 8 November 2006, accepted for publication 20 March 2007Published 20 April 2007Online at stacks.iop.org/PM/28/515
AbstractThe electrocardiogram (ECG) provides useful global temporal assessmentof the cardiac activity, but has limited spatial capabilities. The Laplacianelectrocardiogram (LECG), an improvement over the ECG, provides highspatiotemporal distributed information about cardiac electrical activation. Wedesigned and developed LECG tripolar concentric ring electrode active sensorsbased on the finite element algorithm ‘nine-point method’ (NPM). The activesensors were used in an array of 6 by 12 (72) locations to record bipolar andtripolar LECG from the body surface over the anterolateral chest. Comparedto bipolar LECG, tripolar LECG showed significantly higher spatial selectivitywhich may be helpful in inferring information about cardiac activations detectedon the body surface. In this study the moment of activation (MOA), anindicator of a depolarization wave passing below the active sensors, was used tosurmise possible timing information of the cardiac electrical activation belowthe active sensors’ recording sites. The MOA on the body surface was used togenerate isochronal maps that may some day be used by clinicians in diagnosingarrhythmias and assessing the efficacy of therapies.
Keywords: Laplacian electrocardiogram (LECG), tripolar concentric ringelectrode (TCE), nine-point method (NPM), spatial selectivity, active sensor
(Some figures in this article are in colour only in the electronic version)
1. Introduction
Non-invasive evaluation of cardiac electrical activation is currently of interest in clinicalapplications for its effectiveness and timeliness. Body surface Laplacian mapping (BSLM)has been shown to be an alternative to BSPM with a better spatial resolution and enhanced
0967-3334/07/050515+15$30.00 © 2007 IOP Publishing Ltd Printed in the UK 515

516 W Besio and T Chen
capability of localization by using the estimated Laplacian of body surface potentials to createmaps (Oostendorp and Oosterom 1996, He and Cohen 1991, 1992, 1995, He and Wu 1999,Umetani et al 1998, Wu et al 1998, 1999, He 1998, Ono et al 1997, Lian et al 2002a, 2002b,Li et al 2002, 2003, He et al 2002, Besio and Tarjan 2002a, 2002b, Besio et al 2001, Besio2001). The Laplacian is the second spatial derivative of the potentials on the body surfacewhich reduces the smoothing effect of the torso volume conduction and provides more detailsin localizing and differentiating multiple concurrent dipole sources (He and Cohen 1992).The surface Laplacian can also be interpreted as an equivalent current density (He and Cohen1992, 1995). Several studies (Umetani et al 1998, He and Wu 1999, Wu et al 1999, He et al2002, Lian et al 2002b, Li et al 2003) utilized large numbers of unipolar electrodes placedon the chest surface to measure the body surface potentials, and from that data the Laplacianelectrocardiogram (LECG) was derived by using a five-point finite difference algorithm (FPM)or a spline surface Laplacian estimator.
Fattorusso and Tilmant (1949) were the first to use bipolar concentric ring electrodes incardiology. He and Cohen (1991, 1992, 1995) developed a bipolar concentric electrode todirectly measure the body surface LECG and demonstrated that the LECG has a better spatialresolution in resolving and imaging spatially distributed cardiac electrical activation than bodysurface potentials.
Lu and Tarjan (1999) developed an active LECG sensor with a tripolar concentric ringelectrode (TCE) where the outer ring and the center disc were electrically shorted. This TCEwith the outer ring and the center disc shorted is referred to here as a quasi-bipolar sensor(QBS). Besio et al (2001), Besio (2001), Besio and Tarjan (2002a, 2002b) demonstratedthe efficacy of using this QBS for detecting atrial activation patterns by recording from 35locations on the chest surface. Based on the nine-point method (NPM) (Besio et al 2006),a new active Laplacian TCE sensor was designed without the outer ring and the center discelectrically shorted.
For this study we used the new active Laplacian TCE sensor (Besio and Chen 2006) toacquire signals. The averaged cardiac activation cycle of the LECG on the body surface,BSLM which shows the Laplacian potential distribution at the time instant of the Lead II ECGR-wave peak, and Laplacian moment of activation (MOA) isochronal mapping (Besio et al2001, Besio 2001, Besio and Tarjan 2002a, 2002b) were performed. The BSLM was usedto relate the multiple earlier activation areas of the MOA map with respect to the underlyingcardiac electrical activations.
2. Methods
2.1. Design of an active LECG TCE sensor and signal pre-processing
In the present study the active sensor and signal pre-processing were developed using the TCEfor acquiring body surface LECG. Equation (1) (Besio et al 2006) shows the new algorithmfor approximating the surface tripolar Laplacian with the TCE:
�V ∼= 1
3r2[16 × (Vmr − Vc) − 1 × (Vor − Vc)] (1)
where Vor, Vmr and Vc denote the average potentials on the TCE elements which include outer,middle and center electrode elements, respectively (figure 1(A)), and r is the inter-elementdistance. To be compatible with the LECG definition (He and Cohen 1995, He and Wu 1999),

Laplacian electrocardiogram isochronal mapping 517
(A) (B)
Figure 1. The new active LECG TCE sensor. (A) Schematic of the electrodes. (B) The circuit sideof the sensor. Two flexible shielded cables were used to connect the signals from the instrumentationamplifiers to a Grass amplifier system (Grass Telefactor, 15LT, W Warwick, RI, USA).
the negative of the surface Laplacian was used in this study as shown in (2):
Ltripolar = −�V ∼= − 1
3r2[16 × (Vmr − Vc) − 1 × (Vor − Vc)]
= 1
3r2[1 × (Vor − Vc) − 16 × (Vmr − Vc)]. (2)
On the new active LECG TCE sensor, two ultra-high input impedance instrumentationamplifiers (IA) were used for the first stage amplification of signals from the TCE. Thesetwo IAs performed the two differences between each concentric ring and the center disc. Thegains of the first stage amplification were both set to 10. The output signals from these twoIAs were connected to a Grass amplifier system (1–500 Hz, gain 2000; total gain 20 000). Forthe tripolar LECG the signals from the Grass amplifier were digitized (described later) andthen pre-processed based on equation (2).
The two IAs are implemented on one side of a printed circuit board (PCB). Figure 1(B)depicts the circuit side of this new design. On the other side of the sensor board are the TCEwhich are gold-plated copper for good electrical conductivity. The dimensions of the TCE areshown in figure 1(A). The potential differences between each concentric ring and the centerdisc are recorded simultaneously to acquire LECG.
To determine whether the tripolar LECG provides better spatial selectivity than thebipolar LECG (He and Cohen 1992, Besio et al 2006), the tripolar and bipolar LECG wererecorded simultaneously and compared in this study. Equation (3) shows the algorithm forapproximating the bipolar LECG (He and Cohen 1992, Besio et al 2006):
Lbipolar = −�V ∼= − 4
(2r)2(Vor − Vc) = 1
r2(Vc − Vor). (3)
In the signal pre-processing the bipolar LECG was obtained as the negative value of the outerring to disc potential difference (He and Cohen 1992, Besio et al 2006). Thus the tripolar andbipolar LECGs were recorded with the same conditions.
2.2. Data acquisition system
Six active LECG TCE sensors and one Lead II ECG sensor, which served as a time reference,were used to record the cardiac body surface data. Thirteen channels of data, two for eachactive LECG TCE sensor and one for the Lead II ECG sensor, were recorded simultaneously

518 W Besio and T Chen
Figure 2. The electrode side of six active LECG TCE sensors configured in a 3 row by 2 columnmatrix and attached to the inside of a wide elastic strap. Three gold-plated electrode elements oneach sensor’s back side make contact with the body surface.
(16 bit, 2 kHz, 30 s, Dataq Instruments DI-720 Series, Akron, OH, USA) to a battery-poweredlaptop. The active LECG TCE sensors were also battery-powered.
2.3. LECG acquisition from human subjects
All signal acquisition was performed in accordance with the Louisiana Tech University IRBapproved protocol. Signals were recorded from six healthy male subjects of 20–25 years.The six active LECG TCE sensors were attached inside a wide elastic strap as shown infigure 2. The strap was wrapped around the body to hold the electrodes in place. A thin coatof Ten20 electrode paste (DO Weaver and Co, Aurora, CO, USA) was spread uniformly onthe electrodes.
While recording, the subjects lay in a supine position and were asked to relax and remainstationary to avoid the influence of fluctuations of the heart position on the body surface ECGand LECG (Macleod et al 2000). The actual recordings were repeated with the active LECGTCE sensor array moved to each of the preplanned locations with 1.2 cm horizontal spatialsampling resolution on the chest. In the recording sensor array, the distance between twoadjacent electrodes’ center discs was 3.6 cm (inter-electrode spacing). The red dots/squaremarkers in figure 3 show the first six locations recorded. Then the array was translated 1.2 cmhorizontally to the green dots/open circle markers and again to the blue dots/triangle markersfor a total of 18 recording sites. Eighteen more locations (3 row by 6 column) were recordedby moving the sensor array 4.8 cm horizontally to cover the next recording surface with twomore translations. Then after recording the surface above the nipple line, the sensor array wasmoved downward to cover the surface under the nipple line with the same process repeated.The total 6 row by 12 column matrix body surface cardiac LECG signals were recorded foreach subject from 72 locations as shown in figure 3.

Laplacian electrocardiogram isochronal mapping 519
Figure 3. The 6 row by 12 column matrix of recording sites over the anterolateral chest, a frontalview. Each dot/marker represents a recording site. Horizontal and vertical distances betweenthe two recording sites are 1.2 and 3.6 cm respectively. The nipple line and sternal midline arereferences for the recording sites and are represented with dashed lines. The intersection of thesetwo lines was the origin. Right and left from the reader’s perspective are used to designate twosides of the sternal midline.
2.4. LECG post-processing
The right hip was used as the recording reference for each subject. The LECG data werebaseline-adjusted for drift before it was Weiner filtered (He and Wu 1999, He 1998). In post-processing, each LECG signal was windowed and synchronized relative to the simultaneouslyrecorded Lead II ECG R-wave peak after performing QRS detection (Besio and Kota 2004).A 1600-point window digital Weiner filter was applied to cover one 800 ms cardiac cycle.Then the Weiner filtered LECG were ensemble averaged, based on the 800 ms window.
2.5. LECG MOA algorithm
The MOA is defined as ‘the instant the dipole that represents the depolarization wavefrontcrosses the vector normal to the active sensor’s surface’ (Besio et al 2001). There is a delay forthe depolarization wavefront to propagate over the body surface. The MOA is determined bycalculating the time when the dipoles’ activation wavefront may be directly below the sensor.An array of active LECG TCE sensors provides spatial information about the propagationdelays on the body surface. Cross-correlation for pattern matching between the LECG andLead II ECG was used to find the best fit. The time offset between these two similar waves wasdesignated as the MOA with the units in (ms). A new algorithm for detecting MOA (Besioand Kota 2004) was automated and achieved greater than 99% efficiency on simulated signalswith noise. The MOA could be zero, which means the LECG wave happens at the same timeas the Lead II ECG R-wave peak. A positive MOA means the LECG wave happens later thanthe Lead II ECG R-wave peak, and a negative value means the LECG wave happens earlierthan the Lead II ECG R-wave peak.
2.6. Comparison of spatial selectivity
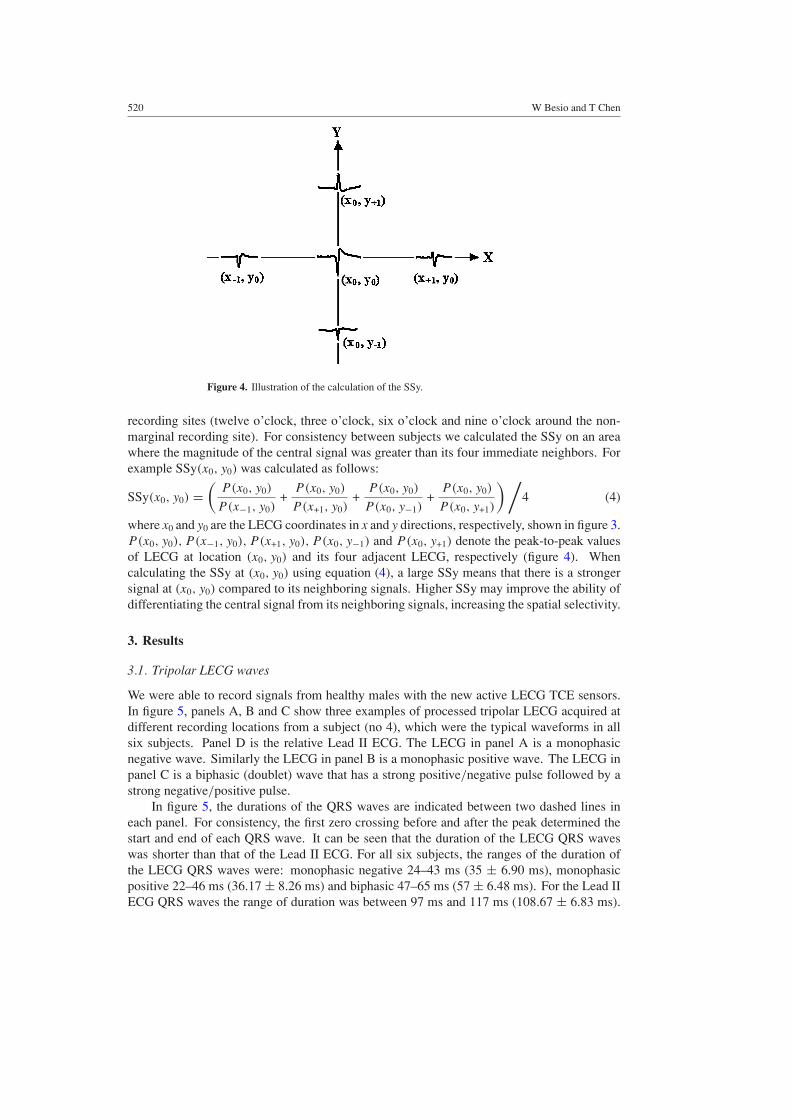
To compare the spatial selectivity, we used the SSy. The SSy is calculated as the average of theratios of the peak-to-peak values of the LECG at one recording site among its four neighboring
520 W Besio and T Chen
Figure 4. Illustration of the calculation of the SSy.
recording sites (twelve o’clock, three o’clock, six o’clock and nine o’clock around the non-marginal recording site). For consistency between subjects we calculated the SSy on an areawhere the magnitude of the central signal was greater than its four immediate neighbors. Forexample SSy(x0, y0) was calculated as follows:
SSy(x0, y0) =(
P(x0, y0)
P (x−1, y0)+
P(x0, y0)
P (x+1, y0)+
P(x0, y0)
P (x0, y−1)+
P(x0, y0)
P (x0, y+1)
) /4 (4)
where x0 and y0 are the LECG coordinates in x and y directions, respectively, shown in figure 3.P(x0, y0), P (x−1, y0), P (x+1, y0), P (x0, y−1) and P(x0, y+1) denote the peak-to-peak valuesof LECG at location (x0, y0) and its four adjacent LECG, respectively (figure 4). Whencalculating the SSy at (x0, y0) using equation (4), a large SSy means that there is a strongersignal at (x0, y0) compared to its neighboring signals. Higher SSy may improve the ability ofdifferentiating the central signal from its neighboring signals, increasing the spatial selectivity.
3. Results
3.1. Tripolar LECG waves
We were able to record signals from healthy males with the new active LECG TCE sensors.In figure 5, panels A, B and C show three examples of processed tripolar LECG acquired atdifferent recording locations from a subject (no 4), which were the typical waveforms in allsix subjects. Panel D is the relative Lead II ECG. The LECG in panel A is a monophasicnegative wave. Similarly the LECG in panel B is a monophasic positive wave. The LECG inpanel C is a biphasic (doublet) wave that has a strong positive/negative pulse followed by astrong negative/positive pulse.
In figure 5, the durations of the QRS waves are indicated between two dashed lines ineach panel. For consistency, the first zero crossing before and after the peak determined thestart and end of each QRS wave. It can be seen that the duration of the LECG QRS waveswas shorter than that of the Lead II ECG. For all six subjects, the ranges of the duration ofthe LECG QRS waves were: monophasic negative 24–43 ms (35 ± 6.90 ms), monophasicpositive 22–46 ms (36.17 ± 8.26 ms) and biphasic 47–65 ms (57 ± 6.48 ms). For the Lead IIECG QRS waves the range of duration was between 97 ms and 117 ms (108.67 ± 6.83 ms).

Laplacian electrocardiogram isochronal mapping 521
A
B
C
D
Figure 5. Tripolar LECG: panel A (monophasic negative), panel B (monophasic positive) andpanel C (biphasic/doublet); panel D is the relative Lead II ECG recorded simultaneously. Theabscissa designates the time in 100 ms increments. The ordinate designates the magnitude of thewaveform with the units in (mV cm−2) for LECG and (mV) for Lead II ECG. T-waves are markedin the figure.
Panels A, B and C reflect that the T-wave which represents ventricular repolarization can beseen clearly with different polarities in the LECG.
In figure 5 the MOA are also shown for the LECG in panels A, B and C. As a referencefor calculating MOA, the R-wave peak of Lead II ECG was set to the position correspondingto 400 ms. Then the MOA was designated as the time difference between the position of thehighest correlated LECG wave and 400 ms. In figure 5, the MOA was 4.5 ms, 5.0 ms and−9.0 ms for LECG in panels A, B and C, respectively.
3.2. Comparison of the tripolar and bipolar LECG
Both tripolar and bipolar LECG were recorded simultaneously. Figure 6 shows one averagedcardiac activation cycle of the LECG recorded from the anterolateral chest surface of the samesubject’s (no 4) signals. Panels A and B represent tripolar and bipolar LECG respectively. The

522 W Besio and T Chen
A
B
Figure 6. One averaged cardiac activation cycle of LECG in a 6 row by 12 column topologyrecorded from the anterolateral chest of subject no 4. Panels A and B represent tripolar and bipolarLECG, respectively. The abscissa and ordinate designate the recording location over the chestmeasured in (cm). The two dashed lines correspond to the nipple line and sternal midline.
LECG waveforms are shown in a 6 row by 12 column topology with respect to the recordingsites of figure 3.
The LECG presented in panels A, B and C of figure 5 are represented in figure 6 at locations(3, 1.8), (11.4, −1.8) and (7.8, −1.8), respectively. Note that the LECG obtained from thetripolar (figure 6, panel A) and the bipolar (figure 6, panel B) electrodes exhibited similarmorphology, polarity and magnitude sequence over the whole area of the chest. Observingfigure 6, strong negative waves (area ‘a’) were shown in both tripolar and bipolar presentations,mainly around the center right side of the sternal midline, namely the subject’s left 3rd and4th rib area. Strong positive waves (area ‘b’) were discovered in the lower right area, whichis actually the subject’s left lateral false rib area.
Table 1 presents the SSy of the tripolar and bipolar LECG compared over the centralsignal in area ‘a’ in all six subjects. Due to anatomic variations, for each subject the area ‘a’which showed strong negative waves over the central chest was located at slightly differentpositions. Therefore table 1 does not show the SSy at the same location in all six subjects. Forexample, for subject no 4 (figure 6), SSy(1.8, −1.8) of the tripolar and bipolar LECG wereshown in table 1. However, SSy(1.8, 1.8) was described for subject no 3 since that location iswhere the strong negative signals were seen. A one-tail paired two-sample t-test showed theSSy for the tripolar to be significantly better than for the bipolar LECG (p = 0.0011).

Laplacian electrocardiogram isochronal mapping 523
Table 1. SSy of the tripolar and bipolar LECG over the area ‘a’ in all six subjects.
Subject no SSy(x0, y0) Tripolar Bipolar
1 SSy(3, 1.8) 1.955 0.9632 SSy(1.8, 1.8) 2.238 1.1533 SSy(1.8, 1.8) 3.805 3.3184 SSy(1.8, −1.8) 3.635 2.3715 SSy(1.8, 1.8) 2.497 0.6516 SSy(3, 1.8) 4.334 2.420
Consistent LECG morphology was discovered in all subjects with a few variations inlocation and magnitude of the waveforms. For example, area ‘a’ and area ‘b’ were bothpresent in all six subjects. For subject no 4, area ‘a’ was located just below the nipple line.However, for subject no 3, area ‘a’ moved vertically one row upward, which was just abovethe nipple line. For area ‘b’, the signals in the 4th row of subject no 1 were much larger thanthe signals in the 5th row. In figure 6, the same two rows had nearly the same peak-to-peakvalues. This alteration could result from the effects of the variations in the heart position andconductivities in each subject (Macleod et al 2000).
3.3. BSLM
Tripolar BSLM was performed for each subject at the time instant of the Lead II ECG R-wavepeak. Multiple localized positive and negative activities are revealed for all six subjects.Figure 7 shows the tripolar BSLM from subject no 4. The physical unit of the color bar/scalein the BSLM is in (mV cm−2). In this map, there are three positive activities denoted by P1,P2 and P3 and two negative activities denoted by N1 and N2.
The pattern characteristics of the BSLM at the instant of the R-wave peak are consistentamong all subjects with certain variations in the number of the activities and their locations.The positive activities all occurred in the left inferior chest area and the negative activitiesappeared over the right anterior central chest. N1 and N2 were present in all six subjects overthe central or left central chest with slightly different locations. P3 was seen at nearly the samelocation in all subjects over the left lateral inferior chest but encompassed slightly differentareas. P1 and P2 were both observed in three subjects (nos 2, 4 and 5) with minor locationdifferences. For some subjects whose tripolar BSLM did not exhibit simultaneous P1 and P2activities, at least one of the activities still occurred, that is, either P1 (subject no 1) or P2(subjects nos 3 and 6). For subjects no 3 and 6, there is a third negative area shown aroundthe left inferior chest.
3.4. MOA isochronal mapping
The MOA were used to produce isochronal maps of the tripolar LECG on the body surface.The isochrones represent timing of cardiac electrical activation as it reaches the body surfacebelow the active LECG TCE sensors. Figure 8 shows the MOA isochronal map from subjectno 4. The propagation time sequence of the cardiac activation as seen on the chest surface withrespect to the Lead II ECG R-wave peak is shown using isochrones with the MOA denoted inunits of (ms). The range of the MOA was restricted to −40 to 40 ms with isochrones of 5 msincrements shown by bold black lines.
Note that the isochrones of the MOA map, figure 8, had diverse geometric patterns.Regions of sparse (e.g. area with center located at (2, −2)) and crowded (e.g. area with center

524 W Besio and T Chen
Figure 7. Tripolar BSLM from subject no 4. P1, P2 and P3 denote three positive activities. N1 andN2 denote two negative activities. The abscissa and ordinate (x, y) in (cm) designate the position ofthe BSLM over the chest. The two dashed lines correspond to the nipple line and sternal midline.
located at (0, 6)) isochrones, indicating spatial nonuniformities of cardiac activation spread,were discovered on the MOA map. The range of MOA in figure 8 is −14.5 ms to 25.5 ms.Multiple localized earlier activation areas were observed. The areas with centers located at(2, −2) and (10, −6) had early MOA isochrones of −10 ms. Other earlier activation timesequences with centers located at (−1.8, 3), (6, −2), (8, −2) and (7, −8) had early MOAisochrones of −5 ms. Positive time sequences showing later activation are viewed over abroad area which is mainly on the top and right side of the map.
For all six subjects the range of MOA is −25 to 31 ms. As the cardiac activation projectsto the chest, the earlier activation area over the central or left central chest (e.g. located at (2,−2) in figure 8) is viewed in all six subjects with slightly different locations and occurrencetimes. The deviation for this earlier area is within a range of 2.5–3.6 cm in X or Y. The variationin the early occurrence time is within 10 ms. For the two earlier activation areas over the leftchest (e.g. located at (6, −2) and (8, −2) in figure 8), they were observed simultaneously fromtwo subjects (nos 4 and 6) with slight variation in locations. However for subjects no 1, 2and 3 only one such earlier area appeared around the left chest. For subject no 5, there is nosuch earlier area shown. Four subjects (except nos 2 and 6) showed an earlier activation areaover the left lateral inferior chest (e.g. located at (10, −6) in figure 8) with minor variation inlocations. For the other earlier activation areas among subjects, such as the ones located at(−1.8, 3) in figure 8, there were very large variations which we cannot explain in this study.On the right side of the MOA maps, all six subjects show similar positive timing patterns,delayed activation after the R-wave peak.

Laplacian electrocardiogram isochronal mapping 525
Figure 8. MOA isochronal map showing the timing of the cardiac electrical activation as seenon the chest surface relative to the Lead II ECG R-wave peak for subject no 4. The abscissa andordinate (x, y) in (cm) designate the position of the MOA map over the chest. The two dashed linescorrespond to the nipple line and sternal midline. The redder color/darker shade designates earlieractivation with respect to the Lead II ECG R-wave and the bluer color/lighter shade designates thelater activation.
4. Discussion
Previous studies (He and Cohen 1991, 1992, 1995, He and Wu 1999, Umetani et al 1998, Wuet al 1998, 1999, He 1998, Ono et al 1997, Lian et al 2002a, 2002b, Li et al 2002, 2003,He et al 2002, Besio and Tarjan 2002a, 2002b, Besio et al 2001, Besio 2001, Lu and Tarjan1999) applied unipolar, bipolar and quasi-bipolar electrodes to record and estimate the LECG.For unipolar electrodes the FPM and spline surface Laplacian estimators were used to derivethe LECG from the potential ECG. As a result, it may be sensitive to measurement noise.For the FPM Laplacian estimation, the five discs were shown to be directionally dependent(Geselowitz and Ferrara 1999). Lian et al (2001) reported that the directional dependencereported may not be valid. Our new active LECG TCE sensor has a circular symmetricaldesign, which overcomes the stated directionality problem. Further with the new active LECGTCE sensor, the LECG can be obtained directly from the body surface. This positive aspectcould be beneficial when CT and MRI are not available to obtain the body surface geometricparameters that are necessary for the spline LECG estimation (He et al 2002, Lian et al 2002b,Li et al 2003).
Since the skin surface generally conforms to the planar surface of the sensor (Lian et al2001), we can appropriately perform an estimate of the local Laplacian. The dimensions

526 W Besio and T Chen
of the electrode elements on the new active LECG TCE sensor were chosen based on thefollowing three reasons: (a) previous research (Besio et al 2001, Besio 2001) used the sameelectrode element dimensions; (b) the distance between the heart wall and the sensor, which isroughly 3–5 cm, was shown to be the optimal diameter for the outer ring of the concentric ringelectrode sensor (Kaufer 1992); (c) the smaller the spacing between the elements, the closerapproximation of the ‘true’ Laplacian, but the weaker the signal. The dimensions chosenassure sufficient amplitude for a reasonable signal-to-noise ratio (SNR).
This paper reports on the experimental investigation of a new active LECG TCE sensorused on a group of six healthy human male subjects. Since the recordings were conductedat 1.2 cm and 3.6 cm intervals in horizontal and vertical directions respectively, the LECGwe acquired had higher spatial resolution compared with the other previous LECG recordings(Besio et al 2001), 72 versus 35 locations over the same chest area. Another positive attributeis that the inter-element spacing on the new sensor is less than 1.0 cm (figure 1(A)), providingeven greater spatial resolution. In this pilot study, the vertical spatial resolution was less thanthe horizontal resolution. However, in the BSLM and MOA algorithm, vertical and horizontaldirections were interpolated to have the same spatial resolution.
In figure 5, the duration of the LECG QRS waves is shorter than that of the Lead II ECGwhich is consistent with the previous simulation results (He and Cohen 1992) that the LECGhas a sharper and narrower shape compared to the ECG. This is why the LECG has a higherspatial resolution than the potential ECG.
Note that the tripolar and bipolar LECG recorded simultaneously using these active LECGTCE sensors show similar activation patterns (figure 6, panels A and B). From both panelsin figure 6, we can see the LECG’s polarity changes while the cardiac electrical activationis spreading over the whole chest. If the wavefronts are represented by moving dipoles, thedipoles move forward and gyrate as well. The conventional V-leads capture this activity. Asthe depolarization moves from the right to the left ventricle and downward in the septum andupward in the free wall, the signals go from monophasic negative to monophasic positiveand somewhere between the two metamorphose as shown by the biphasic template. Theswings may be interpreted as the wavefront moving toward the active LECG TCE sensorexhibiting one direction of polarization, while the departure of the wavefront displays theopposite polarization.
In figure 6 the LECG showed strong signals at a few electrodes around area ‘a’, whereasmost other electrodes far away from area ‘a’ showed relatively weak signals. Area ‘b’ alsoshowed strong signals. The signal strength on the body surface depends on many factorsincluding source strength, source orientation and volume conduction properties. For example,the cardiac signals are attenuated due to the low conductivity of the lungs. From the figures,it appears that area ‘a’ overlaps with the heart base, whereas area ‘b’ may be near the heartapex.
The SSy, which was calculated at the center of area ‘a’, was used in this study to directlycompare the local sensitivity between the tripolar and bipolar LECG. The SSy for the tripolarLECG in all six subjects is greater than for the bipolar LECG (table 1). This increased SSy mayresult in tripolar LECG more accurately locating the cardiac activation origins over bipolarLECG. We must clarify that we have not performed invasive experiments to verify wherethe source is located under our electrode array, but have reported on similar characteristicspreviously (Besio et al 2006).
MOA denotes the activation time on the body surface of the LECG at each recording siteand can be used to make isochronal maps. As mentioned previously, the zero-crossing of theLECG (Lu and Tarjan 1999, Kaufer 1992) has been used as a time reference as long as thetrajectory of the depolarization wavefront is simple. In such a case zero-crossing occurs when

Laplacian electrocardiogram isochronal mapping 527
the vector passes the axis of the sensor (Kaufer 1992). This appears to be an inappropriatemodel in the present study for at least two reasons: (i) the LECG are not always biphasicwaveform (doublet) and (ii) the dipoles move along complicated paths. A new approach withhigh noise immunity was found when the Lead II ECG was used as a reference and correlatedwith the LECG (Besio et al 2001, Besio 2001, Besio and Kota 2004). The correlation resultsin leading or lagging times as MOA of the LECG.
Comparing our tripolar BSLM with the previous studies of the FPM and spline BSLM(Wu et al 1999 , Li et al 2003), the detailed spatial patterns are similar (e.g., N1 in the tripolarBSLM corresponds to N2 reported by Li et al; N2 in the tripolar BSLM corresponds to N3reported by Li et al; P1, P2 and P3 in the tripolar BSLM correspond to P2 activity and itssubcomponents reported by Wu et al). In the MOA isochronal map, we can see multiple earlieractivation areas. For subject no 4, in figure 8 the earlier activation area which is located at(2,−2) (also area ‘a’ in figure 6) coincides with the negative activity N1 in figure 7. This earlieractivation area may reflect the earliest epicardial breakthrough of the right ventricle duringventricular depolarization (Wyndham et al 1979, Li et al 2003). N2 activity appeared at almostthe same location as the earlier activation area located at (6, −2). According to Wyndhamet al (1979), this earlier activation area may be related to the subsequent breakthrough occurringin the left ventricular site anteriorly adjacent to the mid-portion of the septum. P2 activity maybe related to the earlier activation area located at (7, −8) with larger variance in location. Thisearlier activation area may reflect the initial depolarization of the left ventricle (Li et al 2003).The earlier activation area center at (10, −6) appears to correspond to P3 activity. It mayalso reflect the initial depolarization of the left ventricle (Li et al 2003). P1 activity cannot berelated to any earlier activation area in figure 8.
For the other earlier activation areas located at (8, −2) and (−1.8, 3) in figure 8, wecannot find the corresponding positive or negative activities in figure 7. This may result fromthe following two reasons. First, the MOA isochronal map may provide more spatiotemporaldetails than the BSLM. For example, the earlier activation area at (8, −2) in figure 8 maybe related to another epicardial breakthrough occurring in the left ventricle. Second, thepropagation of the wavefront (or dipole) is very complex. It is affected by the anatomicallocation or orientation of the heart. And the movement of our sensors on the body surfacerelative to the heart due to respiration may also cause some distortions of the time sequence.This may also explain why P1 activity cannot be related to any earlier activation area infigure 8.
There were slight variations in the number of the activities, activation times and locationsin the tripolar BSLM and MOA maps among subjects. This may be due to differences inbody conductivity and variation in heart orientation/position within the chest caused by thebody position (Macleod et al 2000). However within each subject, the patterns of the multipleactivations in the tripolar BSLM and MOA map can be related such that the MOA map can beinterpreted with respect to the underlying cardiac electrical activations. For example, for everysubject N1 activity can always be related to the corresponding earlier activation area over thecentral or left central chest of the MOA map. P3 activity can be related to the earlier activationarea over the left lateral inferior chest for four subjects (except nos 2 and 6). N2 activity canbe related to the earlier activation area around the left chest for four subjects (except nos 1 and5) with minor location differences.
In some cases, the automated procedure for calculating MOA (Besio and Kota 2004)chose an incorrect value. The Lead II ECG QRS wave is about 100 ms in healthy subjects.Some recording sites lead the R-wave peak and some lag behind. In this study the normalrange of the MOA was chosen between −40 ms and 40 ms. If the MOA exceeded this range,it was considered incorrect. In these situations, when making MOA isochronal maps, the

528 W Besio and T Chen
incorrect MOA was discarded manually and its neighbor’s MOA were used to interpolate thenew MOA for this recording site. In this study, there were on average three incorrect MOAvalues corrected out of 72 for each subject. The incorrect MOA were in the range of −82 to112 ms in all six subjects. For example, for subject no 4, the three incorrect MOA values were87 ms, 104 ms and −79 ms.
In this pilot study, the MOA was derived from the LECG which was recorded on thebody surface. Therefore MOA isochronal mapping only provides an approximation of theunderlying cardiac activation. We explained the MOA isochronal map with respect tothe underlying cardiac electrical events by comparing and relating to the BSLM and previousstudies (Wyndham et al 1979, Li et al 2003). The explanation has not been verified withinvasive measurements or other localizing modalities. Since only six subjects have beenrecorded, no statistical conclusion on the MOA time sequence patterns is available and it isdifficult to draw any definitive conclusions on the merits of the TCE-based MOA mapping.
5. Summary
The present study is a pilot study investigating the spatiotemporal patterns of the tripolar BSLMand Laplacian MOA isochronal maps from healthy male subjects using the newly designedactive LECG TCE sensor. The long-term goal is to provide a practical non-invasive tool forclinicians diagnosing arrhythmias and assessing the efficacy of therapy. We demonstrated thatthe active LECG TCE sensor provides enhanced spatial information than the bipolar concentricring electrode which other authors have shown provides increased spatial frequencies overconventional disc electrodes (He and Cohen 1992). The tripolar BSLM showed similarattributes as the spline BSLM (Li et al 2003) but without constructing the surface geometryfunction. By comparing with the BSLM, the Laplacian MOA isochronal maps may be relatedto the underlying cardiac activations. The results presented for the six healthy subjectsstudied are promising considering biological variability. Further work is necessary for clinicalvalidation.
Acknowledgments
The authors thank Dr Peter Tarjan for his advice in editing the manuscript, Dr Wei Jiang forher assistance in hardware testing techniques and all of our lab members for their kindness.
References
Besio W 2001 A study of Laplacian surface maps from moments of activation to detect cardiovascular disease PhDDissertation University of Miami
Besio W, Aakula R, Koka K and Dai W 2006 Development of a tri-polar concentric ring electrode for acquiringaccurate Laplacian body surface potentials Ann. Biomed. Eng. 34 426–35
Besio W and Chen T 2006 Non-invasive Laplacian electrocardiography and moment of activation mapping Proc.28th Annual Int. Conf. IEEE EMBS
Besio W and Kota A 2004 Laplacian ECG moment of activation detection algorithm during pacing Proc. IEEE EMBCvol 1 pp 948–51
Besio W, Lu C and Tarjan P 2001 A feasibility study for body surface cardiac propagation maps of humans fromLaplacian moments of activation Electromagnetics 21 621–32
Besio W and Tarjan P 2002a Atrial activation pattern from surface Laplacian electrocardiograms of humans Int. J.Bioelectromagnetism 4 95–6
Besio W and Tarjan P 2002b Filtering of surface Laplacian electrocardiograms from humans to produce atrialactivation patterns Proc. IEEE EMBC 2002 and BMES Annual Meeting pp 1379–80
Fattorusso V and Tilmant J 1949 Exploration du champ electrique precordial a l’aide de deux electrodes circulaires,concentriques et rapprochees Arch. Mal Coeur 42 452–5 (in French)

Laplacian electrocardiogram isochronal mapping 529
Geselowitz D B and Ferrara J E 1999 Is accurate recording of the ECG surface Laplacian feasible? IEEE Trans.Biomed. Eng. 46 377–81
He B 1998 Theory and applications of body surface Laplacian ECG mapping Proc. IEEE EMBC 17 102–9He B and Cohen R 1991 Body surface Laplacian mapping in man Proc. IEEE EMBC 13 784–6He B and Cohen R 1992 Body surface Laplacian ECG mapping IEEE Trans. Biomed. Eng. 39 1179–91He B and Cohen R 1995 Body surface Laplacian electrocardiographic mapping—a review Crit. Rev. Biomed. Eng.
23 475–510He B, Li G and Lian J 2002 A spline Laplacian ECG estimator in a realistic geometry volume conductor IEEE Trans.
Biomed. Eng. 49 110–7He B and Wu D 1997 A bioelectric inverse imaging technique based on surface Laplacians IEEE Trans. Biomed.
Eng. 44 529–38He B and Wu D 1999 Laplacian electrocardiography Crit. Rev. Biomed. Eng. 27 285–338Kaufer M 1992 Multi-ring sensing electrodes for arrhythmia detection and classification MS Thesis University of
MiamiLi G, Lian J and He B 2002 On the spatial resolution of body surface potential and Laplacian pace mapping Pacing
Clin. Electrophysiol. 25 420–9Li G, Lian J, Salla P, Cheng J, Shah P, Ramachandra I, Avitall B and He B 2003 Body surface Laplacian ECG
mapping of ventricular depolarization in normal subjects J. Cardiovasc. Electrophysiol. 14 6–27Lian J, Li G, Cheng J, Avitall B and He B 2002b Body surface Laplacian ECG mapping of atrial activation in normal
subjects Med. Biol. Eng. Comput. 40 650–9Lian J, Srinivasan S, Tsai H and He B 2001 Comments on ‘Is accurate recording of the ECG surface Laplacian
feasible?’ IEEE Trans. Biomed. Eng. 48 610–3Lian J, Srinivasan S, Tsai H, Wu D, Avitall B and He B 2002a On the estimation of noise level and signal to noise ratio
of Laplacian ECG during ventricular depolarization and repolarization Pacing Clin. Electrophysiol. 25 1474–87Lu C and Tarjan P 1999 An ultra-high common-mode rejection ratio (CMRR) AC instrumentation amplifier for
Laplacian electrocardiographic measurement Biomed. Instrum. Technol. 33 76–83Macleod R, Ni Q, Punske B, Ershler P, Yilmaz B and Taccardi B 2000 Effects of heart position on the body surface
ECG Int. Soc. for Computerized Electrocardiography Conference (Yosemite, CA)Ono K, Hosaka H and He B 1997 A comparison of body surface Laplacian and potential maps during paced ventricular
activation Methods Info. Med. 36 336–8Oostendorp T F and Oosterom A V 1996 The surface Laplacian of the potential: theory and application IEEE Trans.
Biomed. Eng. 43 394–405Umetani K, Okamoto Y, Mashima S, Ono K, Hosaka H and He B 1998 Body surface Laplacian mapping in patients
with left or right ventricular bundle branch block Pacing Clin. Electrophysiol. 21 2043–54Wu D, Schablowski M, Hosaka H and He B 1998 A simulation study of Laplacian ECG in a realistically shaped torso
volume conductor: myocardial infarction Bioelectrochem. Bioenerg. 47 231–5Wu D, Tsai H and He B 1999 On the estimation of the Laplacian electrocardiogram during ventricular activation Ann.
Biomed. Eng. 27 731–45Wyndham C R, Meeran M K, Smith T, Saxena A, Engelman R M, Levitsky S and Rosen K M 1979 Epicardial
activation of the intact human heart without conduction defect Circulation 59 161–8