trip-monitoring survey: downtown travel data obtained by...
TRANSCRIPT

Transportation Research Record 1050 35
Trip-Monitoring Survey:
Obtained by Following a
Downtown Travel Data
Small Sample of Vehicles
GORDON W. FOSTER
ABSTRACT
In this paper is outlined a unique type of survey that was developed to assess the impact of a new downtown "regional center" plan on traffic and parking and to facilitate the planning of improvements. It enabled essential information to be collected easily and economically, without interference with or disruption of traffic flow, for such items as the total number of persons and people parking in the downtown area, the number passing through without parking, the number of persons dropped off, and travel path data for analyzing the impact of circulation changes. This was accomplished by having observers follow a small unbiased sample of vehicles entering through a cordon line. The specific procedures for the tripmonitoring survey are described to enable others to use similar car-following methods in their own areas. There are also brief explanations of how data from this survey were combined with traditional parking and traffic survey information to analyze parking and traffic needs and a discussion of some areas where additional survey effort might further enhance the survey results.
The trip-monitoring survey was devised to provide central business district (CBD) "control" totals on vehicle and person trips and to provide travel path data in connection with traffic and parking analysis for a new regional center plan in downtown Buffalo. The author is not aware that this type of survey has been conducted in any other place. However, the survey appears to be such an efficient way of supplying much valuable information that it is being presented here in the belief that others will find it a useful procedure in other situations.
The development of the trip-monitoring survey came about when the central staff of the Niagara Frontier Transportation Committee [the metropolitan planning organization (MPO) for Erie and Niagara Counties, New York) was assigned responsibility for the transportation element in developing the new Buffalo Regional Center plan. Important information needed for the planning process included
• Total vehicles destined to downtown Buffalo with automobile destinations established on a blockby-block basis,
• Total persons destined to downtown Buffalo by transit and by automobile with person-trip destinations established on a block-by-block basis,
• Estimates of parking needs with development proposals and changes in parking facility locations, and
• Estimates of traffic volumes levels of service with development circulation and parking changes.
and capacity proposals and
A typical parking inventory usage and turnover survey was programmed to establish existing parking conditions, including an interview survey of parkers to establish the origin, parking location, and ultimate destination of those who parked. Because a major parking survey of about half the desired study area had been performed by a consultant in 1980, and updated in 1983, the new survey, also in 1983, was designed to cover only the additional area and it was done in a manner consistent with that of the ear lier survey for a s irnilar 8-hr time period from
10 a.rn. to 6 p.m. The boundaries of the parking study area, including the two parts totaling 146 blocks and 25,000 parking spaces in all, are shown in Figure 1 along with the cordon line encompassing the entire CBD.
Downtown cordon counts were conducted for 48 hr by machine and conducted manually with vehicle classification for 8 hr on typical weekdays. The cordon was designed not to intersect the heavy through traffic movement on I-190 but only that entering or exiting the CBD. Downtown intersection turning movement counts were conducted for 8 hr and supplemented with rnidblock machine counts to estab-1 ish existing flows on the street system.
A regional on-board transit survey had also been scheduled at the same time to provide origin-destination information for downtown-destined transit passengers.
What was desired and not easy to establish was a firm figure for the total number of vehicles (cars and trucks) and persons parking in downtown compared with those just entering and passing through, the number of persons arriving as "drop-offs," and a convenient means of estimating traffic volumes and turning movements after circulation changes were made. Although figures on the total number of vehicles and persons corning downtown could theoretically be derived from the parking surveys and interviews, this was not satisfactory as the only source for such information for the following reasons:
• It did not provide any information about arrivals downtown outside the time period of the parking survey;
• It did not provide any information about arrivals in areas on the fringe of downtown outside the proposed parking study area;
• There was a desire to firmly resolve differences in total trips to the CBD indicated by the existing regional transportation model, ground counts, and various estimates of downtown employment and activity; and
• There was concern for the statistical reli-

36
·.
Lake Erie
- Cordon Line
• 1 Cordon Crossing Location and Number
c:::::J New Parking Study Area
l==:J Previously Surveyed Parking Study Area
Transportation Research Record 1050
/
FIGURE 1 Buffalo CBD cordon and parking study area.
ability of the figures for the total number of parkers derived from the parking surveys (at the completion of both the parking and trip-monitoring surveys, the latter consistently showed more vehicles parking downtown than the former, particularly illegally parked vehicles).
Initially it was proposed to seek the desired information by conducting typical cordon station interviews. This idea was rejected because of the extensive delays that would be caused to rush hour traffic and the resistance that motorists might register. A second idea was to simply hand out survey cards to a sample of motorists for response and mail-back, but this was thought to be statistically unreliable because of the likely bias due to greater response rates from well-educated motorists. Also, none of these methods would have aided in estimating the impacts of circulation changes.
In response to these concerns and needs, the idea of having observers in their own cars follow a selected sample of vehicles entering the CBD was born. Each selected vehicle would be followed until it either parked within the cordon or went back out of the cordon. Observers would count the number of per-
sons in the car, plot the route on a downtown street map right on the survey form, note locations and number of persons picked up or dropped off, and note the final location of parking or the cordon station where tht: vehicle exited. A numb~r cf S!.!pervisory staff field tested the concept and found it to be a workable idea. In the process it was found that a far higher percentage of vehicles entering the CBD apparently passed through without parking then had been previously imagined: this explained some of the lack of consistency between existing data and further indicated the need to do the survey.
ELEMENTS OF THE SURVEY
Sample Selection and Statistical Reliability
The trip-monitoring survey sample must be drawn from recent data on total vehicles entering through a cordon line. In this case the primary objective in sample selection was to provide overall CBD data in accord with commonly accepted standards of reliability. Thus an overall sample size was proposed the confidence level of which was 95 percent that the
Foster
results were within ±5 percent of the true answer for the day of the survey.
The survey results were collected during many days and assembled to represent one "typical" Mondaythrough-Fr iday working day. The formula used in determining sample size is
D = Z j [P(l - P)/n] y, f [(N - n)/(N - I)] y,
where
D allowable error, Z standard normal point associated with the per
centage confidence intervals (1.96 for 95 percent) ,
P proportion of time a given attribute occurs, N population size, and n = sample size.
Because parking for automobiles was a major focus of the overall study, it was proposed to sample just automobile traffic sufficiently to provide the desired 95/±5 percent reliability for any data including those that might be split 50-50 percent. Such a split in survey results presents the most stringent condition for sampling and required an overall automobile sample of approximately 400 vehicles. This also permitted the apportioned sample of 19 (of the 400) at the lowest volume "major" entrance to the CBD to provide data about which it was possible to be 90 percent confident that the results were within ±20 percent of the true value.
It may be noted that there is some i mpact on reliability ft:om day-to-day var i ations in traffic, but this was not thought to be s i gnificant for the purposes of this survey. Both the cordon and the tripmoni tor ing survey were conducted only on days that were considered to experience normal weekday traffic volumes.
A separate truck sample was proposed but not at the same level of statistical reliability as the automobile survey, which would requ i re nearly as large a sample. A one hundred vehiclli! sample of tr ucks was selected , wh i ch would provide data to the overall CBD level about which it would be possible to be 95 percent confident that the results were within ±10 percent of the true value for the survey day. The CBD truck data could be subdivided into five relatively equal parts and it was possible to be 90 percent confident that the results in any part were within ±20 percent of the true value.
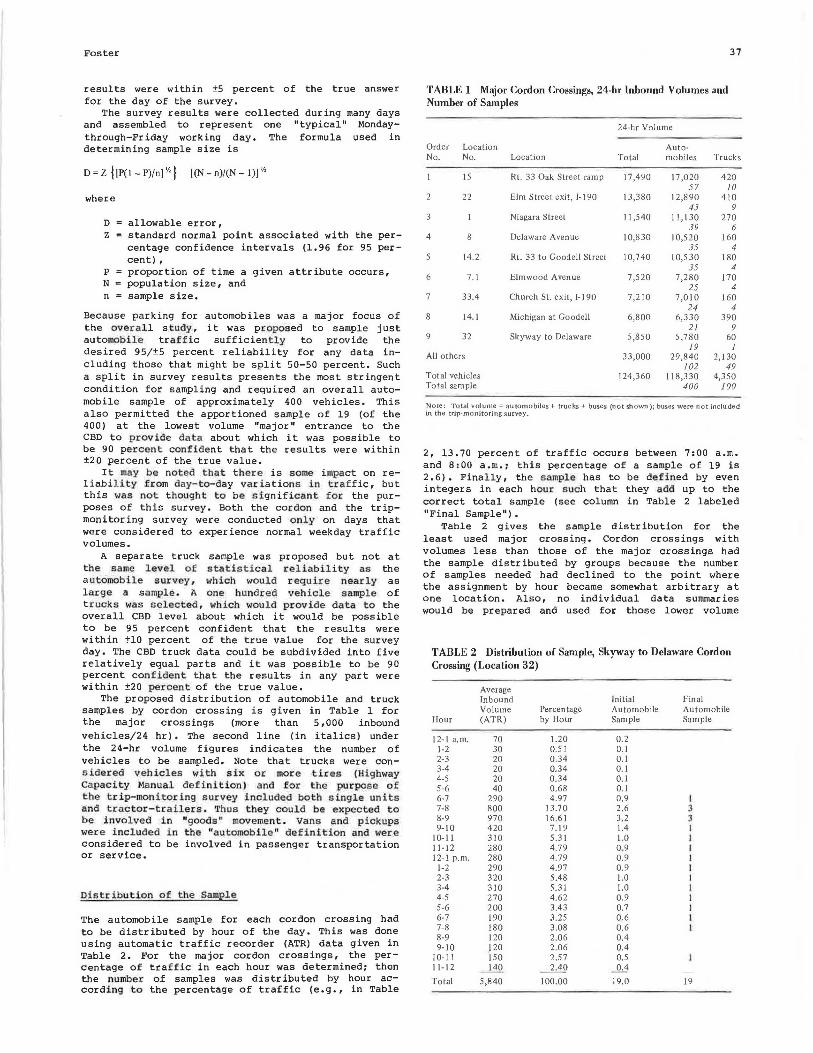
The proposed distribution of automobile and truck samples by cordon crossing is given in Table 1 for the major crossings (more than 5 ,000 inbound vehicles/24 hr). The second line (in italics) under the 24-hr volume figures indicates the number of vehicles to be sampled. Note that trucks were considered vehicles with six or more tires (.Highway Capacity Manual definition) a nd for the purpose of the trip-monitoring survey included both single units and tractor-trailers . Thus they could be expected to be involved in "goods" movement . vans and pickups were i ncluded in the "automobile" definition and were considered to be involved in passenger transportation or service.
Distribut i on o f the Sample
The automobile sample for each cordon crossing had to be distributed by hour of the day. This was done using automatic traffic recorder (ATR) data given in Table 2. For the major cordon crossings, the percentage of traffic in each hour was determinedi then the number of samples was distributed by hour according to the percentage of traffic (e.g., in Table
37
TABLE 1 Major Cordon Crossings, 24-hr Inbound Volumes and Number of Samples
24-hr Volume
Order Location Auto-No. No. Location Total mobiles Trucks
15 Rt. 33 Oak Street ramp 17 ,490 17,020 420 57 10
2 22 Elm Street exit, 1-190 13 ,3 80 12,890 410 43 9
Niagara Street 11,540 11,130 270 39 6
4 Delaware Avenue 10,830 10,520 160 35 4
14.2 Rt. 33 to Goodell Street 10,740 10,530 180 35 4
6 7.1 Elmwood Avenue 7,520 7,280 170 25 4
33.4 Church St. exit, 1-190 7,210 7,010 160 24 4
8 14.1 Michigan at Goodell 6,800 6,330 390 21 9
9 32 Skyway to Delaware 5,850 5,780 60 19 I
All others 33,000 29,840 2,130 102 49
Total vehicles 124,360 118,330 4,350 Total sample 400 JOO
No te: Total volume = automobiles+ trucks+ buses (not shown )i buses were not included in the trip-monitoring survey.
2, 13.70 percent of traffic occurs between 7:00 a.m. and 8:00 a.m.; this percentage of a sample of 19 is 2.6). Finally, the sample has to be defined by even integers in each hour such that they a.dd up to the correct total sample (see column in Table 2 labeled 11 Final Sample 11
) •
Table 2 gives the sample distribution for the least used major crossing. Cordon crossings with volumes less than those of the major crossings had the sample distributed by groups because the number of samples needed had declined to the point where the assignment by hour became somewhat arbitrary at one location. Also, no individual data summaries would be prepared and used for those lower volume
TABLE 2 Distribution of Sample, Skyway to Delaware Cordon Crossing (Location 32)
Average Inbound Volume
Hour (ATR)
12-1 a.m. 70 1-2 30 2-3 20 3-4 20 4-5 20 5-6 40 6-7 290 7-8 800 8-9 970 9-10 420
10-11 310 11-12 280 12-1 p.m. 280
1-2 290 2-3 320 3-4 310 4-5 270 5-6 200 6-7 190 7-8 180 8-9 120 9-10 120
10-11 150 11-12 _!1Q Total 5,840
Percentage by Hour
1.20 0.51 0.34 0.34 0.34 0.68 4.97
13.70 16.61 7.19 5.31 4.79 4.79 4.97 5.48 5.31 4.62 3.43 3.25 3.08 2.06 2.06 2.57
-1A.9 100.00
Initial Automobile Sample
0.2 0.1 0.1 0.1 0.1 0.1 0.9 2.6 3.2 1.4 1.0 0.9 0.9 0.9 1.0 1.0 0.9 0.7 0.6 0.6 0.4 0.4 0.5 ~ 19.0
Final Automobile Sample
I 3 3 I 1 I 1 1 I 1 I I I I
19
38 Transportation Research Record 1050
TABLE 3 Automobile Sample Selection, 1,000 to 2,000 Inbound ADT Group
Hour
6-7 a.m. 7-8 8-9 9-10
10-11 11-12 12-1 p.m.
1-2 2-3 3-4 4-5 5-6 6-7 7-8 8-9
Total
Total Sample
1 3 3 2 1 2 2 2 2 2 2 l l l l
26
Cordon Crossing Samples
Michigan at S. Park (29.3)
W. Seneca Exit, 1-190 (24.4)
crossings. In each of the groups, the hourly distribution of traffic at one location was considered representative of the group as a whole.
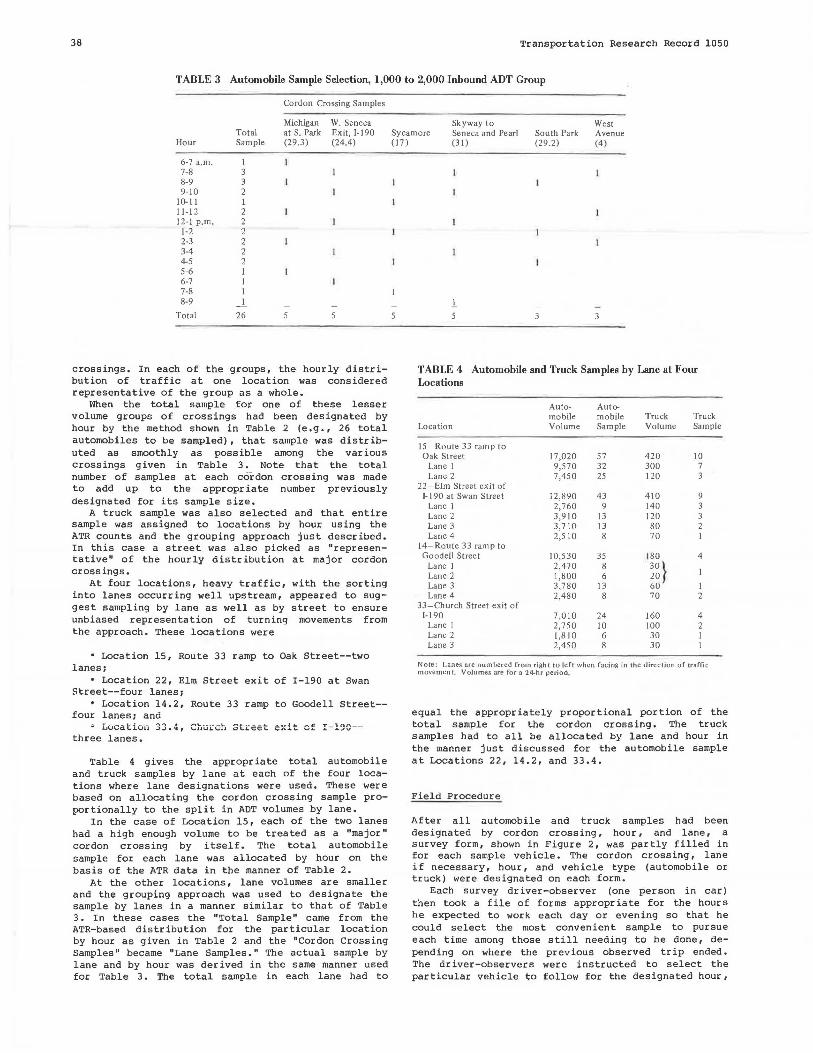
When the total sample for one of these lesser volume groups of crossings had been designated by hour by the method shown in Table 2 (e.g., 26 total automobiles to be sampled), that sample was distributed as smoothly as possible among the various crossings given in Table 3. Note that the total number of samples at each cordon crossing was made to add up to the appropriate number previously designated for its sample size.
A truck sample was also selected and that entire sample was assigned to locations by hour using the ATR counts and the grouping approach just described. In this case a street was also picked as "representative" of the hourly distribution at major cordon crossings.
At four locations, heavy traffic, with the sorting into lanes occurring well upstream, appeared to suggest sampling by lane as well as by street to ensure unbiased representation of turning movements from the approach. These locations were
• Location 15, Route 33 ramp to Oak Street--two lanes;
• Location 22, Elm Street exit of I-190 at Swan Street--four lanes;
• Location 14.2, Route 33 ramp to Goodell Street-four lanes; and
; Lucatio{1 three lanes.
,..'L.- •••• _\., ,..,_ ___ .._ \...UU.L\,;U L)l.....L'CC\. e:~it cf I-190--
Table 4 gives the appropriate total automobile and truck samples by lane at each of the four locations where lane designations were used. These were based on allocating the cordon crossing sample proportionally to the split in ADT volumes by lane.
In the case of Location 15, each of the two lanes had a high enough volume to be treated as a "major" cordon crossing by itself. The total automobile sample for each lane was allocated by hour on the basis of the ATR data in the manner of Table 2.
At the other locations, lane volumes are smaller and the grouping approach was used to designate the sample by lanes in a manner similar to that of Table 3. In these cases the "Total Sample" came from the ATR-based distribution for the particular location by hour as given in Table 2 and the "Cordon Crossing Samples" became "Lane Samples. " The actual sample by lane and by hour was derived in the same manner used for Table 3. The total sample in each lane had to
Sycamore Skyway to Seneca and Pearl (31)
South Park (29.2)
West Avenue
(17) (4)
l 3
TABLE 4 Automobile and Truck Samples by Lane at Four Locations
Auto- Auto-mobile mobile Truck Truck
Location Volume Sample Volume Sample
15 - Route 33 ramp to Oak Street 17,020 57 420 10
Lane l 9,570 32 300 7 Lane 2 7,450 25 120 3
22 - Elm Street exit of 1-190 at Swan Street 12,890 43 410 9
Lane l 2, 760 9 140 3 Lane 2 3,910 13 120 3 Lane 3 3,710 13 80 2 Lane 4 2,510 8 70 I
14- Route 33 ramp to Goodell Street 10,530 35 180 4
Lane l 2,470 8 30 } Lane 2 1,800 6 20 Lane 3 3,780 13 60 l Lane 4 2,480 8 70 2
33-Church Street exit of 1-190 7,010 24 160 4
Lane l 2,750 10 100 2 Lane 2 1,810 6 30 I Lane 3 2,450 8 30 l
Note: Lanes are numbered from right to left when facing in the direction of traffic movement. VoJumes are for a 24-hr period.
equal the appropriately proportional portion of the total sample for the cordon crossing. The truck samples had to all be allocated by lane and hour in the manner just discussed for the automobile sample at Locations 22, 14.2, and 33.4.
Field Procedure
After all automobile and truck samples had been designated by cordon crossing, hour, and lane, a survey form, shown in Figure 2, was partly filled in for each sample vehicle. The cordon crossing, lane if necessary, hour, and vehicle type (automobile or truck) were designated on each form.
Each survey driver-observer (one person in car) then took a file of forms appropriate for the hours he expected to work each day or evening so that he could select the most convenient sample to pursue each time among those still needing to be done, depending on where the previous observed trip ended. The driver-observers were instructed to select the particular vehicle to follow for the designated hour,

Foster
5 g, ~ ~ ,I
rt
CORDON CROSSING INBOUND: ____ __ _
HOUR: ___ ___ _
LANE*(If applicable)
~ .. )r I
/ Genesee
/ Sycamore
Broadway
.~ -= Wlllfam
"Cllnton
Swan
Seneca
Ohio
39
Vehicle Type:...: ___ ___ License:'-----
No. Occupants ''"-------------Time In:·----------~
Parking Location: (mark on map)
Parking Type: on street free lot
Parking Cost: (if visible)
metered ramp
CORDON CROSSING OUTBOUND : (through trips only)
FIGURE 2 Survey form.
lane, and vehicle type by a random selection method; in the case of automobiles, by counting to the fifth after reaching position and readiness to start. Trucks were infrequent enough that the first to come was normally picked. If the driver-observer lost a vehicle in traffic, he merely returned to pick another sample for the same location, hour, and vehicle type. This was a rare occurrence .
As each sampled vehicle completed its trip either by stopping and parking or by passing on through the cordon, the survey form was appropriately completed.
If a vehicle stopped and picked up, or dropped off, persons but did not park, the pick-ups and drop-offs were recorded and became part of the total regional CBD trip data; but the vehicle was still treated as a "through trip." The map that was part of the survey form was marked to show the route of each vehicle and the location of parking or passenger pick-ups and drop-offs. The entire survey of 500 vehicles was f ully completed without incident by two persons in 2 working weeks. The complete instructions to driver-observers are included at the end of this paper as Appendix A.
Drop-off or Pickup location:
(mark on map) &
No. of persons:
*Lanes are numbered from right to left when facing in direction of traff1c movement.
PROCESSING THE SURVEY DATA
Coding Format and Procedure
It was desirable to code the data for computer processing and summary. The format needed to be set up to accomplish two basic objectives:
1. Provide the ability to summarize both vehicle and person trips to the CBD by their origin at the cordon line and their destination block and type of parking, whether curb or off-street. (Al though data by block would not be statistically reliable for this survey, coding destinations to block locations provided maximum flexibility in how the study area could be divided for subarea summaries.)
2. Provide the ability to trace vehicle paths on the downtown street network and to pull out of the file data on all paths through any one or more links.
The first step in processsing the survey information was to put a serial number on each completed survey form so that the appropriate field sheets

40
could be identified for any piece of information drawn from the computer.
Consideration of Item 1 indicated that separate coding lines might be needed to indicate separate destinations of persons dropped off as distinct from those who continued in an automobile until it parked, in which cas e both activities are shown on a single form.
Consideration of Item 2 appeared to require two special steps.
• The data set from the trip-monitoring survey included all trips traveling through the CBD without parking and trips inbound that parked. This left missing only the outbound trips of those who parked to have a "complete" record of all of a typical day's downtown travel paths. It was decided to synthesize the most likely outbound trips to complete the trip file. This was done by having coders (who were the same persons who had been driver-observers) generate a trip record for the most likely return trip outbound to the same or near by cordon crossing for each trip they encountered in coding that came inbound and parked.
• Links in the downtown street network needed to be numbered so they could be identified in a computer listing. Each direction on two-way streets was given a separate link number. Three-digit numbers were used and the travel paths were simply listed out link by link at the end of the coded data, including the link in which, or off of which, the vehicle parked. For curb parking the link number was also coded as the parking location.
When all of the possible trip types had been listed for coding, there were 9:
• Type o--Vehicle went through CBD without parking, dropping off, or picking up passengers.
• Type !--Vehicle parked in CBD and driver and other persons in automobile (if any) left automobile together (i.e., no picking up or dropping off).
• Type 2--Vehicle parked in CBD and dropped off persons before reaching the parking location.
• Type 3--Vehicle dropped off passengers in CBD but did not park or pick up passengers.
• Type 4--Vehicle picked up passengers in CBD but did not park or drop any passengers.
• Type 5--Vehicle picked up and dropped off passengers but did not park. (Pick-ups are disregarded if automobile subsequently parks. This survey does not include intra-CBD trips.)
• Type 6--Synthesized return vehicle trip from
- c -00 - ro - "'iri LO LO a. .
Transportation Research Record 1050
parking location to exit cordon crossing, same or logical pair to entrance crossing (reverse of 1).
• Type 7--Synthesized return vehicle trip from parking location to exit cordon crossing (same or logical pair to entrance crossing) with passenger pick-ups on the way (reverse of 2) •
• Type 8--Additional inbound person trips not ending in the same location as those recorded on the same coding line as the vehicle trip.
The coding card layout is shown in Figure 3. The complete coding instructions are included at the end of the paper as Appendix B. Of particular interest may be the use of the "factor" (Columns 31-33) to expand the sampled data to represent the full universe of CBD trips. The factor for each sample represented the 24-hr volume of vehicles (automobiles or trucks) divided by the number of sample vehicles at each inbound crossing. Synthesized outbound trips carried the same factor as the inbound trips with which they were paired. Person trips become the number of persons in the car, or dropped off, multiplied by the factor . It also may be noten that the hour of the trip (crossing the cordon) was coded to permit data to be summarized by hour if desired. Of course, the hour of travel was not available for the synthesized outbound trips.
When coding was completed, the information was keypunched onto computer tape for further processing.
Preparing the Data for Use (person and vehicle trip e nds )
Five tabulations were prepared initially from the data to be used first for review and correction and then for summaries of downtown trip activity and expansions of the parking data. These are listed as follows with the total 24-hr trips (expanded by the factor) for the Buffalo CBD as a whole:
1 . Dropped-off passengers by block of destination By vehicles later parking (Type 8
trips) 2,070 By vehicles passing through (Types
3 and 5) 4,190 Total 6,260
2. Vehicles destined downtown and persons arriving by automobile at their block of parking (Trip types 1 and 2)
Automobiles 61,420 Trucks 1,760 Persons with automobiles 79,970
J . Inbound vehicles parking and passing through the CBD by cordon crossing
., 8. 80
·-<'? Types 1-3, 5, 8 Types 4 -7
0 l:: Types0-5,8 Types 0 i= . z Inbound 0,3-7 t?" "' 0 :3 CV> Dest ination Origin I- ... 8. ow
Card ., g. Xing Outb .r. :> >- ~i "' Q_ Curb c: '->
No .:J i= Loe L Xing ~ ~'=- "'I- ZonE Block Pkng Zonf Block Fac!Or Rou te Trip Types 0-7 <( _ 0.. -- ,... ,... ,_. I- -- - I- --.-1 2 3 4 5 6 7 B 9 10 11 12 13 1~ 15 16 17 18 19 2C 21 l2E 27 2111~ JO 31 3l 33 13<1 35 3E 3 31139 40"' 4 6 4J ..__ ..... ..... ..... - -i-- - I- --,_
1 - ........... ..... - -- - I- _,._ ..... 2 ..__ ..... .......... ...... -1-- - ..... ,_I- I-
3 - ._ _ ...... - -1-- - ..... -- I-
4 - ,_...__ ..__ --- - ..... 1- - .....
FIG URE 3 Card format for coding.

Foster 41
11111111 Cordon Line
e 1 Cordon Crossing Location and Number
~ Daily Inbound Vehicles ~ and % Parking Downtown
- Major CBD Routes for Inbound Traffic i j ! I ........................... ~ ..
FIGURE 4 Buffalo CBD cordon distribution of major flows.
Number Percen tage Automobiles parking 61,420 52 Automobiles passing
through 561910 _!ll. Total automobiles 118,330 100 Trucks parking 1,760 40 Trucks passing
through 2,590 ~ Total trucks 4,350 100 Total vehicles
parking 63,180 51 Total vehicles
passing through 59,500 49 Total vehicles
(except buses) entering CBD 122,680 100
4. Routes (link by link) traversed by more than 500 inbound vehicles from each cordon crossing. (Although no meaningful total number could be provided here, the results of this tabulation with 3 were combined to produce Figure 4.)
5 . Automobiles and trucks by location of parking,
curb or off-street, by block (this was tabulated only for the parking study area)
Number Per centag e Automobiles at curb 13,790 25 Automobiles off
street 401330 75 Total automobiles
parking 54,120 100 Trucks at curb 560 34 Trucks off street 11080 __.§.&. Total trucks parking 1,640 100 Total vehicles at
curb 14,350 26 Total vehicles off
street 411410 74 Total vehicles
parking 55,760 100
The information from the trip-monitoring survey, combined with the results of the transit on-board survey, made it possible to establish the total person trip arrivals downtown on a typical weekday by mode as follows:
42
Number Percent age Drivers 61,420 56 ~assengers arriving with
driver 18,550 17 Passengers dropped off 6,260 6 Transit passengers 231390 -1! Total 109,620 100
To provide appropriately detailed parking information, adjustments i n the parking survey data were required to bring it into a consistent relationship with the trip-monitoring survey. Vehicle totals, derived block by block from the parking survey, were summed within the two portions of the study area and compared to trip-monitoring survey vehicle totals for vehicles parking in the same portions. This required adjustment of the trip- monitoring data to include only trips that would be present during the B hr of the parking survey. (See discussion of the adjustment in the next section of the paper.)
The parking survey figures, block by block, were adjusted upward by the ratio of the adjusted tripmon i tor ing total di·~ ided by the parking ourvey total. These figures for vehicle trips were then converted to person trips by multiplying each block's vehicle total by the trip-monitoring survey's ratio of person trips to vehicle trips. Finally, these person trips were distributed to their blocks of final destination on the basis of the results of the parker interviews. Transit passengers and automobile drop-offs were added as appropriate.
Thus downtown block, zone, and district summaries could be prepared of final person trip ends (one way) from the various surveys. These data, including the parking walkers' trip table (parking lots to final destinations) were extremely helpful in analyzing the impact on parking needs of the possible changes in the location of business activity or of the elimination or relocation of parking facilities.
Preparing the Data f or Use (travel paths)
The use of the data for travel path analysis does not lend itself so well to statistical summary here. The process called for printing out the full card data on every trip passing through a street section that might be closed or changed, such as a case in which it was proposed to reverse the direction of one-way traffic. The travel paths were then plotted
Transportation Research Record 1050
manually on large maps of the CBD. Then new paths were drawn that represented the new routes traffic could be expected to take after the proposed change. Considerable judgment had to be used in estimating the amount of traffic shifted in the peak hours for the purpose of capacity analysis of the changed flows. This is discussed further in the next section of the paper.
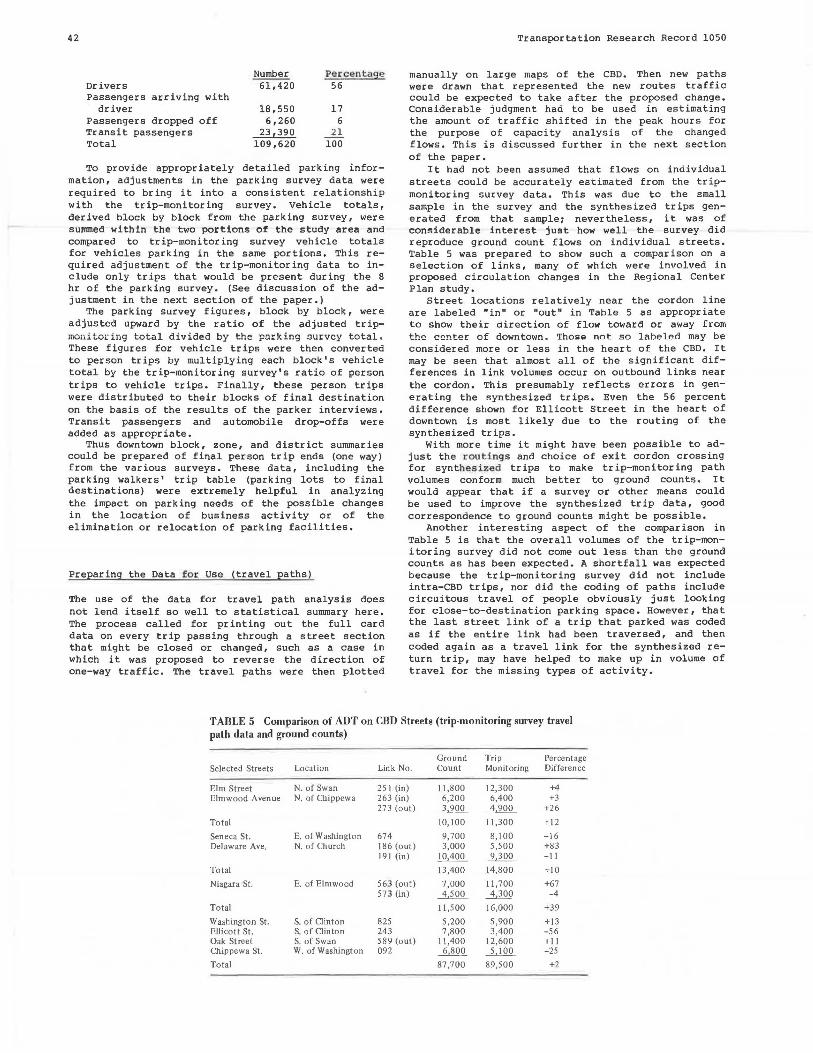
It had not been assumed that flows on individual streets could be accurately estimated from the tr i pmonitoring survey data. This was due to the small sample in the survey and the synthesized trips generated from that sample; nevertheless, it was of considerable interest just how well the survey did reproduce ground count flows on individual streets. Table 5 was prepared to show such a comparison on a selection of links, many of which were involved i n proposed circulation changes in the Regional Center Plan study.
Street locations relatively near the cordon line are labeled "in" or "out" in Table 5 as appropriate to show their direction of flow toward or away from the center of downtown . Tho~& not so labelen may be considered more or less in the heart of the CBD. It may be seen that almost all of the significant differences in link volumes occur on outbound links near the cordon. This presumably reflects errors in generating the synthesized trips, Even the 56 percent difference shown for Ellicott Street in the heart of downtown is most likely due to the routing of the synthesized trips.
With more time it might have been possible to adjust the r out ing s and choice of exit cordon crossing for synthesized trips to make trip-monitoring path volumes conform much better to ground counts. It would appear that if a survey or other means could be used to improve the syn th es ized trip data, good correspondence to ground counts might be possible.
Another interesting aspect of the comparison in Table 5 is that the overall volumes of the trip-moni toring survey did not come out less than the ground counts as has been expected. A shortfall was expected because the trip-monitoring survey did not include intra-CBD trips, nor did the coding of paths include circuitous travel of people obviously just looking for close-to-destination parking space. However, that the last street link of a trip that parked was coded as if the entire link had been traversed, and then coded again as a travel link for the synthesized return trip, may have helped to make up in volume of travel for the missing types of activity.
TABLE 5 Comparison of ADT on CBD Streets (trip-monitoring survey travel path data and ground counts)
Ground Trip Percentage Selected Streets Location Link No. Count Monitoring Difference
Elm Street N. of Swan 251 (in) 11,800 12,300 +4 Elmwood Avenue N. of Chippewa 263 (in) 6,200 6,400 +3
273 (out) 3 900 4,900 +26
Total 10,100 11,300 +12
Seneca St. E. of Washington 674 9,700 8,100 -16 Delaware Ave. N. of Church 186 (out) 3,000 5,500 +83
191 (in) 10,400 9,300 -II
Total 13,400 14,800 +10
Niagara St. E. of Elmwood 563 (out) 7,000 11,700 +67 573 (in) 4,500 4,300 -4
Total 11,500 16,000 +39
Washington St. S. of Clinton 825 5,200 5,900 +13 Ellicott St. S. of Clinton 243 7,800 3,400 -56 Oak Street S. of Swan 589 (out) 11,400 12,600 +II Chippewa St. W. of Washington 092 6,800 __LlQQ_ -25
Total 87,700 89,500 +2

Foster
SURVEY CONCERNS
Safe ty and Privacy Aspects o f t he Survey
When there is discussion of this type of survey in a group for the first time, there is generally some concern expressed about possible incidents or accidents that might arise. Although such things are always possible, the selection of intelligent and responsible driver-observers who believe that they can do the survey in the desired manner appears to be the most important step in minimizing the chances of this sort of misfortune . With such people available, there were no accidents or incidents of any type to mar the conduct of the Buffalo survey.
A second concern sometimes raised is whether this survey constitutes an invasion of privacy. It is not believed that it does, as described here, because all the observing is done in public areas and there is no attempt to determine the purpose of trips. Follow-up questioning could trigger such concerns. It would not appear to be advisable, for instance, to send questionnaires to home addresses of automobile owners (determined from license plate nUJnbers) about observed trips of their vehicles. The leaving of a postpaid reply card on an observed vehicle asking for data on the outbound trip might be more acceptable because the driver could choose to respond or not.
Vehicle and Person Trip Ends
The principal concern that developed in using the trip-monitoring data for expansion of the parking survey was the adjustment of volumes for the time period of the parking survey. The appropriate volume of trip ends applicable to the parking survey had to represent not only those who parked in the appropriate area but also those who would be in that area between the hours of 10 a.m. and 6 p.m. when the parking survey was conducted. It was easy enough to exclude all the trip-monitoring survey trips that came into the CBD after 6 p.m. because the hour of entry was coded. The tougher question was which of those trips that entered the CBD before 10 a.m. were still there at 10 a.m.
This parking duration question was answered by going back to the field sheets and making a judgment based on when and where the vehicle parked. If the time was before 9 a .m., a vehicle that parked at a restaurant was excluded; one that parked in an allday lot was included. Those that parked illegally, or at metered spaces before 8 a.m. (for 2-hr meters) were excluded, those that parked in free curb spaces on the fringe of the CBD and headed off on foot toward the central area were included. Unfortunately, there was a group about which it was impossible to be sure, and the best judgment possible had to be accepted.
In a similar case in the future on these early morning trips, it would probably be helpful to have the survey observer indicate directly on the field sheet whether or not the vehicle was likely to remain in the time period of the parking survey. Leaving a postpaid reply card on the windshield of each observed car after it parks (for early morning arrivals) might be a means of picking up some information or some sample of the original sample regarding length of parking, but this would probably require either additional time or an assistant with the driver-observer. Also, "carding" cars that enter large parking ramps or private or guarded areas would pose the problem of gaining access and finding the parked vehicle.
43
Travel Path Data
A similar type of concern about the time of trips arose in using the travel path data. The analysts using the data wanted travel paths of just the peak rush hour trips identified to aid in adjusting peakhour flows for capacity analysis of new circulation proposals. The morning trips inbound between the hours of 6 a.m. and 10 a.m. appeared to be "typical" enough for that purpose in that time period, but what travel paths would be most representative of the evening rush hour? All of the paths of those entering the CBD between the hours of 3 p.m. and 6 p.m. appeared to be a natural enough choice, but what others? A large component of this group should be the synthesized trips, which are the most speculative data in the survey. Here again, the desirability of finding some way to better establish the time and route of travel for the outbound travel component was pointed out. In this particular study the analysts looked at the travel patterns of all the synthesized trips using the street links under study for their evening rush period analysis.
A means of getting a firmer hold on outbound travel path data could include following a sample of outbound trips from point of origin at curbs and in off-street lots and ramps. Key points in setting up the sample framework would involve determination of the total quantity of cars (the universe) leaving designated areas and establishing the pattern of departures by hour. Parking survey turnover data adjusted to match inbound trip-monitoring survey control totals would provide the universe of automobiles previously described.
The overall hourly pattern of CBD departures could be derived from outbound cordon crossing data. The process would require splitting the measured outbound hourly flows into two parts: that due to "through" outbound trips and that due to outbound trips originating within the CBD, which would represent the trips to be sampled. The hourly pattern of the through trips could be estimated from the through trips sampled in the inbound trip-monitoring survey and the appropriate volumes subtracted from the total outbound volumes to give the hourly pattern for outbound sampling. Cordon classification counts for outbound traffic, as well as inbound, would be desirable for such an outbound trip-monitoring survey.
CONCLUSIONS AND RECOMMENDATIONS
The trip-monitoring survey exceeded all expectations both in the smoothness and the uneventfulness of the actual conduct of the survey and in the usefulness of the data that were collected. It was particularly beneficial to have reliable data on total travel into downtown Buffalo for the first time. There are frequent requests for such information and it was extremely useful in the Buffalo Regional Center study. Time and time again in that study the trip table data for persons walking to their destinations from their parking locations were used to analyze the impact of replacing existing parking facilities with new development and to determine the most desirable locations for additional parking facilities . Without the trip-monitoring survey, it would have been much more difficult to provide such data with confidence. Similarly, the travel path information was used frequently to analyze many different roadway proposals and changes in circulation patterns.
Use of the trip-monitoring survey is fully recommended to others with need for this type of information with one proviso: that competent and responsible driver-observers be available. It would not be

44
reconunended to send out anyone as a driver-observer who does not want to do it or who does not believe it can be done safely. Questions of adequate insurance coverage and what to do in case of accident should be resolved to everyone's satisfaction in advance.
It may be of interest that the Buffalo trip-monitoring survey and cordon counting program altogether cost $15 ,000 in 1983 and took 49 manweeks of staff time. Most of the staff time involved temporary field workers at $4.00 per hour who took the 8-hr manual classification counts at the cordon stations.
For future trip-monitoring surveys conducted in conjunction with parking surveys, the leaving of postpaid reply cards on the windshelds of sampled early morning arrivals is suggested where practical. These would request departure times for the return trip and perhaps also the exit cordon station if travel path data are sought. Reply cards should be as brief and to the point as possible to maximize the response. Any additional information of this type that is received would be helpful. If there is a need for high rel iahil ity in the travel path data, the trip monitoring of exiting drivers from their points of origin in the CBD may be justified.
ACKNOWLEDGMENTS
The author wishes to acknowledge the important contributions made to the development and implementation of the trip-monitoring survey, and to the preparation of this paper, by Edward H. Small, Jr., Staff Director of the Niagara Frontier Transportation Conunittee, and also to acknowledge the help of Douglas Struckle, Marc Prentice, and Steve Szopinski who believed in the usefulness and practicality of this type of survey and who carried it out safely, effectively, and efficiently.
APPENDIX A--INSTRUCTIONS FOR CAR-FOLLOWING PROCEDURE, BUFFALO CBD TRIP-MONITORING SURVEY
The survey will be conducted by having driver-observers in their cars follow vehicles from a designated cordon crossing point until they either stop and park or exit through the cordon.
Safety and accident avoidance is always the primary concern. Follow at safe distances. If a vehicle ,!_ .. __ , -~ _ .. __ --•--• ,, __ ------.:!·---- .. .!.L.'l.. - ----J.:O .1.Ub-C.r l::>.Lill!J.l.Y L~:O"-d.1.... \.Ut::: l:"l.Ut.;t:::UUl.C W.L\..U a llCW
vehicle. Do not attempt to write while automobile is in motion.
Driver-observers should have a file of survey field sheets from which the most convenient sample may be taken for the next trip after the previous trip is completed. The survey form should have the following information on it before the survey is started:
. Cordon crossing point from which sample is selectedi . The hour period within which the sample is selectedi
• The lane in which the sample is to be selected, if applicablei and
• The vehicle type of the sample: (a) automobile (a vehicle with four tires including vans or pickup trucks and motorcycles and automobiles with trailers) and (b) truck (any vehicle with six or more tires and slow-moving, truck-like four-tired vehicles).
Transportation Research Record 1050
Select sample vehicle in an unbiased method. If lane is not designated and there is more than one lane on the approach, select sample vehicle before its lane becomes known. The suggested method of sample selection is, after being in position and ready, count off five vehicles taking the fifth that meets the sample er i ter ia. With trucks, in some locations it may be necessary to use a lower count, perhaps even the first truck to come. Write down the correct time on the survey form when the sample is selected but before putting automobile in motion.
Follow the sample vehicle safely, noting the license number and number of occupants. When vehicle parks or exits the cordon, stop in a safe location and write down the information requested on the survey form. Trace the vehicle's route in ink on the map on the survey form.
If passengers are dropped off or picked up, note the location and number of persons involved on the map and in the appropriate blank on the survey form. Show whether it is a pick-up or a drop-off.
APPENDIX B--CODING INSTRUCTIONS, CBD TRIPMONITORING SURVEY
General
All coding blocks are to be filled in accord with the instructions. There are to be no blank blocks except beyond Column 33.
Survey Form Number (Columns l-3)
Survey forms are to be numbered consecutively through the survey and numbers coded. Write numbers at the top of the survey field sheets as well as on coding sheets. Fill all blocks (i.e., survey form 1 is coded 001) • Survey form numbers are repeated when additional coding lines are filled out for extra trip activity connected with a single vehicle trip.
Line Number (Column 4)
Code 1 for the first line filled out, which will record the inbound vehicle trip and person data if vehicle parked, dropped off, or picked up passengers. Code 2, 3, and so forth for additional lines filled out for extra person trip activity connected with the single vehicle trip. A final line (same form number) will be filled out for the synthesized return vehicle trip if vehicle parked inbound.
Trip TyPe (Column 5)
• Code 0--Vehicle went through CBD without parking, dropping off, or picking up passengers.
• Code 1--Vehicle parked in CBD and driver and other persons (if any) in car left car together (i.e., no picking up or dropping off).
• Code 2--Vehicle parked in CBD and dropped off persons before reaching the parking location.
• Code 3--Vehicle dropped off passengers in CBD but did not park or pick up passengers.
• Code 4--Vehicle picked up passengers in CBD but did not park or drop off any passengers.
• Code 5--Vehicle picked up and dropped off passengers but did not park (pick-ups are disregarded if car subsequently parksi this survey does not include intra-CBD trips).

Foster
• Code 6--synthesized return vehicle trip from parking location to exit cordon crossing, same or logical pair to entrance crossing (reverse of 1),
• Code 7--synthesized return vehicle trip from parking location to exit cordon crossing (same or logical pair to entrance crossing) with passenger pick-ups on the way (reverse of 2) •
• Code 8--Additional inbound person trips not ending in the same location as those recorded on the same coding line as the vehicle trip.
I nbound Cordon Crossing Location (Columns 6-8 )
Code the number of the crossing location in the two spaces before the dot. In some cases, such as Michigan and Goodell, there are two roadways on which vehicles may enter. Use N = 1, E = 2, S = 3, W = 4 in Column 8 for this designation where applicable. Otherwise code a 0 (e.g., entering the CBD on Michigan from the north would be coded 14.11 code Os for trip types 6 and 7).
inbound Crossing Lan e (Column 9 )
Code the number of the lane at an inbound cordon crossing where applicable 1 otherwise, code O. Lanes are numbered from right to left when facing in the direction of traffic movement,
Outbound Cordon Cr ossing (Columns 10- 12)
For trip types O, 3, 4, 5, 6, and 7 the location at which the trip went back through the cordon is coded in the same manner as the inbound cordon crossing (Columns 6-8). For trip types 1, 2, and 8, code Os in all spaces.
Vehicle TyPe (Column 13)
Code 1 = automobile: Code 2 truck.
Hour (Columns 14-15)
Code the hour of the inbound cordon crossing in military time (e.g., 4:10 p.m. = 16:10). Code 0 for trip types 6 and 7.
Aut omobile Occupancy (Column 16)
Code the number of persons in the automobile when it went inbound across the CBD cordon. Code 0 for trucks and for trip types 6, 7, and 8.
Per s on Tr i ps (Column 17)
Code the number of persons having trips ending in the Buffalo CBD represented by this particular coding line, Code a separate line for each drop-off having a different CBD origin or destination block. Code 0 for trip types O, 4, 6, and 7 (all vehicles). Also code 0 for all truck trips except types 3, 5, and B (drop-offs).
Destina·tion Zone (Columns 18-19 )
Code the traffic analysis zone where vehicle and/or person trips represented by the coding line ended. Code Os for trip types 0, 4, 6, and 7. For trip type 2, the destination is always where the vehicle trip
45
ended. The person trips dropped off before parking are shown on separate lines as trip type 8.
Destination BJ.eek (Columns 20-22)
Code the parking survey block number where the vehicle trip ended for trip types l and 2 and where person trips ended for trip types 3, 5, and a. Code Os for trip types O, 4, 6, and 7. If the trip ended outside the area of the numbered blocks, code Os.
Dest i nation Curb Parking (Columns 23-25)
This section is only for vehicles that park downtown on the street (trip types l and 2). For all others, code Os. If a vehicle parks downtown on the major street network, code the number of the link on which the vehicle parks. Note that the links are directional and the link for the direction in which the vehicle is headed should be used on two-way streets. If the vehicle parks on a street not on the major network, code the number of the street in blocks 23-24 and code a 0 in block 25. If street numbers cannot be found in the "Downtown Directory," code Os.
Origin Zone (Columns 26-27)
This section only applies to trip types 4, 5, 6, and 7. For all others, code Os in Columns 26-27. For trips having origins in the Buffalo CBD, code the traffic analysis zone of origin. It is not necessary to code additional pick-ups beyond those that can be shown with the vehicle trip.
Origin Block (Columns 28-30)
This section also applies only to trip types 4, 5, 6, and 7. For other types, code Os in Columns 28-30. For trips having origins in the area where blocks are numbered, code the appropriate block number. Otherwise, code Os.
Fac t o r (Columns 31- 33 )
Code the appropriate factor. For automobiles it will be between 142 and 385. For trucks it will be between 16 and 74. If a truck factor is 40, code it 040. The same factor applies to all trips from a single survey form.
Route (Columns 34-78)
This section applies only to vehicle trips: it does not apply to trip type 8 (leave blank). Code in sequential order the majo r network links traversed by the vehi c le . If the trip is not fully on the major ne twork , code thos e links that are used in the order in which traversed.
This paper was prepared in part with the financial assistance of the U.S. Department of Transportation and the New York State Department of Transportation: this paper represents only the views of the author and does not necessarily reflect the review or approval of the u.s. DOT or the NFTC member agencies.