trip chaining behavior - illinois center for transportation
TRANSCRIPT

SENIOR TRAVELERS’ TRIP CHAINING
BEHAVIOR: SURVEY RESULTS AND DATA ANALYSIS
Prepared By
Kouros Mohammadian Martina Frignani
Joshua Auld
University of Illinois at Chicago
Research Report ICT-11-086
A report of the findings of ICT-R27-50
Trip Chaining Behavior of Senior Travelers & Applications to Public Transportation Planning
Illinois Center for Transportation
August 2011
CIVIL ENGINEERING STUDIES Illinois Center for Transportation Series No. 11-086
UILU-ENG-2011-2012 ISSN: 0197-9191

Technical Report Documentation Page
1. Report No. FHWA-ICT-11-086
2. Government Accession No. 3. Recipient's Catalog No.
4. Title and Subtitle Senior Travelers’ Trip Chaining Behavior: Survey Results and Data Analysis
5. Report Date
August 2011 6. Performing Organization Code
8. Performing Organization Report N o. 7. Author(s) Kouros Mohammadian, Martina Frignani, Joshua Auld
ICT-11-086 UILU-ENG-2011-2012 9. Performing Organization Name and Address
Illinois Center for Transportation Department of Civil and Environmental Engineering University of Illinois at Urbana-Champaign 205 N. Mathews Ave, MC 250 Urbana, IL 61801
10. Work Unit ( TRAIS)
11. Contract or Grant No. ICT R27-50 13. Type of Report and Period Covered
12. Sponsoring Agency Name and Address
Illinois Department of Transportation Bureau of Materials and Physical Research 126 E. Ash Street Springfield, IL 62704
14. Sponsoring Agency Code
15. Supplementary Notes
16. Abstract The research team conducted a survey of travel and activity scheduling behavior to better understand senior citizens’ trip chaining behavior in the Chicago metropolitan area’s most populous counties. The team used an internet-based, prompted recall activity-travel survey using Global Positioning System (GPS) devices to collect activity-travel diaries and other necessary information. This survey was conducted with 112 people living in 101 households in Northeastern Illinois’ Cook, DuPage, Lake, and Will Counties. Because aging is a growing concern among transportation planners, this survey focused especially on the elderly population, with approximately half of the survey sample consisting of elderly households and the remainder of non-elderly households. Each respondent within these households was asked to carry a portable GPS device ideally for 14 consecutive days and upload the collected data to a website at the end of each day to fill in their activity-travel survey questionnaires. The results suggest that GPS surveys have an improved ability to capture trips that are frequently under-reported; the use of prompted recall provides valuable data about the activity planning and scheduling process itself, which is not found in traditional surveys. Analysis of the decision-making process from the collected data reveals that some aspects of elderly travel behavior are intrinsically distinct from those of the younger population. Results indicate that while age does not affect some aspects of activity-travel behavior, it does affect such aspects as planning horizons, trip flexibility, and trip chaining practices. This study’s results can therefore be used to plan more efficient transit services targeting senior travelers and may help change their attitudes toward public transportation.
17. Key Words
Travel and activity scheduling behavior, GPS surveying, seniors, public transportation, trip chaining
18. Distribution Statement No restrictions. This document is available to the public through the National Technical Information Service, Springfield, Virginia 22161.
19. Security Classif. (of this report) Unclassified
20. Security Classif. (of this page) Unclassified
21. No. of Pages
100
22. Price
Form DOT F 1700.7 (8-72) Reproduction of completed page authorized

i
ACKNOWLEDGEMENT/ DISCLAIMER This publication is based on the results of ICT-R50, Senior Travelers’ Trip Chaining Behavior. ICT-R50 was conducted in cooperation with the Illinois Center for Transportation; the Illinois Department of Transportation; and the U.S. Department of Transportation, Federal Highway Administration. The Technical Review Panel members are: Chuck Abraham (Chair) Patty Broers Piushimita (Vonu) Thakuriah. The contents of this report reflect the view of the authors, who are responsible for the facts and the accuracy of the data presented herein. The contents do not necessarily reflect the official views or policies of the Illinois Center for Transportation, the Illinois Department of Transportation, or the Federal Highway Administration. This report does not constitute a standard, specification, or regulation.

ii
EXECUTIVE SUMMARY The research team for this study conducted a survey of travel and activity scheduling behavior to better understand senior citizens’ trip chaining behavior in the Chicago metropolitan area’s most populous counties. The team used an internet-based, prompted recall activity-travel survey using Global Positioning System (GPS) devices to collect activity-travel diaries and other necessary information. This study explains how and why the research team chose these particular methods for collecting the data and presents their findings. This survey was conducted with 112 people living in 101 households in Northeastern Illinois’ Cook, DuPage, Lake, and Will Counties. Because aging is a growing concern among transportation planners, this survey focused especially on the elderly population, with approximately half of the survey sample consisting of elderly households and the remainder of non-elderly households. Each respondent within these households was asked to carry a portable GPS device ideally for 14 consecutive days and upload the collected data to a website at the end of each day to fill in their activity-travel survey questionnaires. Respondents who could not do this on their own received help from the research team. The results suggest that GPS surveys have an improved ability to capture trips that are frequently under-reported; the use of prompted recall provides valuable data about the activity planning and scheduling process itself, which is not found in traditional surveys. An assessment of the collected data’s variability has revealed that a two-week survey duration implies significant gains in data variability when compared to a one-week or shorter survey duration. Respondents’ feedback about their participation experience and a fatigue and conditioning analysis reveal that this survey type has great potential for data collection efforts that last longer than two weeks. Analysis of the decision-making process from the collected data reveals that some aspects of elderly travel behavior are intrinsically distinct from those of the younger population. On average, elderly people tend to plan their decisions about activity-travel attributes ahead of time, make more multiple stop tours, and have a higher number of stops on their tours than younger people, possibly since they dedicate more planning to travel and activities. This tendency to plan ahead favors public transportation use since elderly people usually know their trip start times and destinations ahead of time. However, elderly people are less flexible with activity start times and trip duration because they often do more with their family and other individuals and thus more often need to consider other peoples’ schedules than younger people. Still, some decision-making characteristics are similar across age. Both age groups make their decisions about activity-travel attributes, such as timing, people involved, and travel mode, while planning for the activities themselves. This suggests a deep association between activity-travel attributes and activity engagements. Also, the number of activity locations that both age groups actually consider when making their travel choices is limited, and routine choices still usually guide their final decisions. Although some challenges were faced, implementation of this innovative internet-based, prompted recall survey method proved that this survey type is effective for travel surveying. Data quality is satisfactory and its analysis sheds light on elderly activity-travel behavior and decision-making processes. Results indicate that while age does not affect some aspects of activity-travel behavior, it does affect such aspects as planning horizons, trip flexibility, and trip chaining practices. This study’s results can therefore be used to plan more efficient transit services targeting senior travelers and may help change their attitudes toward public transportation.

iii
TABLE OF CONTENTS
ACKNOWLEDGEMENT/ DISCLAIMER ............................................................................ i
EXECUTIVE SUMMARY .................................................................................................. ii
CHAPTER 1 INTRODUCTION ........................................................................................ 1
CHAPTER 2 LITERATURE REVIEW .............................................................................. 2
CHAPTER 3 METHODOLOGY ...................................................................................... 13
CHAPTER 4 SURVEY IMPLEMENTATION ................................................................... 16
CHAPTER 5 DATA QUALITY ASSESSMENT ............................................................. 20
CHAPTER 6 PRELIMINARY DATA ANALYSIS ........................................................... 32
CHAPTER 7 CONCLUSIONS ....................................................................................... 73
REFERENCES ................................................................................................................ 77
APPENDIX A: ADVANCE MATERIAL ........................................................................... 86
APPENDIX B: DETAILED DECISION-MAKING ANALYSIS TABLES ......................... 91

1
CHAPTER 1 INTRODUCTION As travel demand modeling techniques evolve from trip-based to activity-based models,
researchers will need more detailed and accurate data to calibrate and validate these new models. The lack of data on decision making processes associated with trips and activities that are not typically collected in activity- and trip-based surveys becomes a critical issue when developing micro simulation models.
To meet these needs, travel survey methods have evolved from mail-in trip diaries to computer assisted telephone interview (CATI) activity and trip surveys. These surveys are the latest trend in developing improved survey methods, given the popularization of personal computers and broadband internet. The development of Global Positioning System (GPS) technology, meanwhile, has allowed researchers to passively collect a considerable part of the traditionally acquired activity and travel attributes, thus creating opportunities for collecting additional travel attributes and information on activity pattern formation.
At the same time as computers and GPS technology have evolved, the world's population has grown older, especially in developed countries. In 2007, the United States had 37.8 million people 65 years old and older. From 2000 to 2030, the number of elderly Americans is expected to increase 104.2%, while the total population is expected to increase 29.2% (U.S. Census Bureau, 2004). Elderly people typically have different lifestyles than the rest of the population because they are often retired and have very different activity-travel patterns than the basic home-work-home pattern. They may also have mobility constraints that make their travel needs unique. All these facts make aging an important concern for transportation planners.
To better understand the connections between aging and public transit planning, the next section contains a literature review on GPS use in travel surveys, the current status of activity-travel process data collection, the characteristics of the tour formation process, the characteristics of America’s elderly population, and an aging society’s implications for the transportation system.
2
CHAPTER 2 LITERATURE REVIEW
According to the Federal Highway Administration (FHWA, 2007), one of the tasks related to transportation planning is “identifying future transportation problems and needs and analyzing, through detailed planning studies, various transportation improvement strategies to address those needs.” To identify future problems, transportation planners need to create models to forecast the transportation system’s future condition. The first models approached this problem by aggregately forecasting the number of trips from one zone in the study area to another (CATS, 1962). Models evolved – maybe not as much in practice as in academia – to more sophisticated, disaggregate models; one characteristic remains in common, however: no model can produce an output better than its input. Just as important as the development of more accurate and process oriented models is the improvement and diversification in data collection since the quality of any forecast depends on the data from which it is estimated (Stopher and Greaves, 2007).
The first travel surveys were conducted face-to-face, usually in interviews about trips that respondents performed during their previous day. Because respondents often could not accurately provide their locations and their trip start and end times, the diary format was created in Germany in the late 1970s (Brög et al., 1983). The trip diary was delivered to respondents before their travel so that respondents could take note of their trips as they occurred to increase reporting accuracy. The diary format was broadly accepted and is still extensively used. These diaries could be mailed in to the agency conducting the survey or they could be recovered over the telephone to avoid the increasing costs of face-to-face interviews. However, the trip diary was not able to resolve accuracy and trip under-reporting problems, thereby presenting high numbers of missing trips (usually short trips) and rounding up of start and end times (Stopher and Greaves, 2007).
In the early 1990s, the travel diary was modified into an activity diary (Stopher, 1992), shifting the focus of the questions from trips to activities. Interestingly, this new format yielded up to 20% higher trip rates than those diaries that focused their questions on trips (Stopher and Greaves, 2007). In 1995, the time-use diary was introduced for surveying travel, whereby trips are viewed as activities. Also in the mid-1990's, global positioning system (GPS) technology was first used for travel surveys. Now, one decade later, efforts have shifted from building on this to increasing the sophistication of GPS travel surveys. 2.1 OVERVIEW OF TRAVEL SURVEYS USING THE GLOBAL POSITIONING SYSTEM
Travel and activity surveys using GPS devices started in the mid-1990s, when the Federal Highway Administration (FHWA) supported a proof-of-concept study in Lexington, Kentucky (Batelle, 1997). In this study, respondents had GPS devices and personal digital assistants (PDAs) installed in their vehicles to respectively track vehicle trips and record additional travel information that respondents were asked to input, such as trip purpose and names of people traveling. This study had several important findings, among them, that traditional surveys had systematic trip under-reporting and overestimation of travel time and distance, which the GPS-assisted surveys eliminated or minimized.
Since then, more than ten studies in the U.S. have used GPS devices in conjunction with traditional household travel surveys to investigate trip under-reporting and develop correction factors. Examples of these studies are found in Austin (Casas and Arce, 1999), California (NuStats, 2002a), Pittsburgh (NuStats, 2002b), St. Louis (NuStats, 2003), Ohio (Pierce et al., 2003), Tyler/Longview (Texas DOT, 2004), Los Angeles (NuStats, 2004a), Kansas City (NuStats, 2004b), Laredo (Forrest and Pearson, 2005), and Seattle (Cambridge Systematics, 2007). In all of these short-term surveys, GPS devices were only installed in vehicles so that their conclusions were restricted to vehicle trips.

3
The use of GPS for person-based multi-mode surveys was made possible with the removal of Selective Availability (SA) from the GPS system in May 2000. For military purposes, SA added random errors to GPS signals, resulting in an imprecision of up to 100 meters (300 feet). This imprecision made the tracking of slow modes such as walking and biking impossible. However, even after the removal of SA, decreases in the size and weight of GPS devices and increases in equipment reliability were critical for feasibly of conducting person-based GPS surveys.
One of the first attempts of person-based GPS surveying was made in the Netherlands in 1997 by Draijer et al. (2000). This study used GPS for passive tracking, PDAs for active data entry, and a paper-based diary used for trips when the GPS was not used. In Japan, a personal handheld device tracked ten people online. These people recorded their travel in an activity-travel diary for two weeks (Asakura et al., 1999; Hato and Asakura, 2001). Another attempt using a wearable GPS device and a PDA was made in Atlanta, focusing on non-motorized travel (Guensler and Wolf, 1999). In 2002, a passive GPS study in London showed that GPS “loggers performed effectively in collecting data across all modes of travel” (Wolf, 2006).
GPS-based studies combined with active data collection using a PDA led to improved travel data quality. Besides capturing overlooked trips, GPS surveys have provided more accurate information on trip start and end times and activity locations, as well as high quality route choice information, which is impossible to retrieve using other survey modes (Murakami et al., 2003). However, the active portion of data collection still imposed a significant survey burden (Wolf et al., 2001) so the following trend on survey methods development was the exploration of completely passive GPS surveys which could be used to replace the traditional activity diary. Wolf et al. (2001) demonstrated that it is possible to derive trip purposes from GPS data in conjunction with a “spatially-accurate and comprehensive geographical information system (GIS).” However, the same authors state that “there may always be a need for certain follow up questions regarding the derived travel data.” The derived data not only requires follow-up questions, but also some valuable trip and activity attributes, such as accompanying persons, which cannot be derived and have to be asked to respondents directly. In this context, prompted recall travel surveys using GPS devices started to be developed. This type of survey uses GPS data to generate maps with the observed activity-travel pattern, which is later shown to respondents together with the survey questionnaire. In a proof-of-concept study, Bachu, et al. (2001) demonstrated that maps with the travel patterns shown can effectively prompt respondents’ memory about past events, resulting in no information loss after a few days elapsed between traveling and answering the survey questionnaires. After that, other studies have aligned the prompted recall concept with GPS surveying (Marca, 2002; Stopher and Collins, 2005; Clark and Doherty, 2009). Marca (2002) undertook a small pilot study of an online GPS prompted recall survey using wireless data transmission. In this study, volunteers placed the equipment in their vehicles and took notes of their activities and destinations so that the passively collected GPS data could be compared against it later. This study concluded that the wireless data transmission was not always reliable, often causing gaps in travel records or missing very short trips entirely. Although annotating activities and trips caused survey fatigue in a short period of time, Marca stated that his volunteers agreed to use the survey equipment for a much longer period, which demonstrated that GPS surveys have potential long term application. In a larger scale study, Stopher and Collins (2005) proposed an online GPS prompted recall survey as an improvement to paper and pencil prompted recall surveys. In this case, participants used in-vehicle and wearable devices for one day. The data collected was processed electronically and manually to generate a map displaying the observed travel pattern. Given the difficulty of processing part of the data manually, generating these maps was time consuming, adding about two weeks to the overall survey completion time and consequent data retrieval. After this time lapsed, respondents were sent the prompted recall survey with a map

4
containing their travel patterns and a questionnaire. Participants were given the option of taking this survey through the internet, mail, phone, or face-to-face interview. Respondents confirmed their travel patterns or corrected any errors that satellite signal acquisition delays and interruptions may have caused. After these travel patterns were confirmed, this study’s researchers asked respondents about their trip purposes, out-of-pocket costs, number and purpose of accompanying persons, and whether they were driving. Technical problems likely caused low response rates for this study’s online component, which occurred on respondents’ computers and required Java to run. Out of the 12 households that received prompted recall surveys through the internet, only six households returned it. Although the deployment cost per respondent was high, this study’s research team argued that the reusable survey software partly justified this. Nevertheless, they concluded that the internet is the best media for prompted recall travel surveys where travel patterns might need to be edited, because questions are regenerated accordingly to changes in travel patterns, helping keep respondents from becoming confused when answering the questions. Although the need for follow up questions still constitutes a burden when compared to totally passive GPS data collection, the prompted recall method alleviates respondents from dealing with an extra piece of equipment on top of the GPS device, when compared to PDA-assisted GPS surveys. Nevertheless, all GPS surveys represent a great advance when compared to self-reported travel-activity diaries (Stopher and Collins, 2005) because they passively collect data on locations visited, routes taken, distances traveled, and time, duration, and speed of travel. Since these travel characteristics can be obtained with minimal respondent burden, the use of GPS devices combined with some type of follow up questions allows surveys to get more information from travelers than traditional travel diaries do. It creates the space for expanding survey periods and for questioning less explored facets of travel behavior without imposing an excessive burden on respondents. The ease with which other travel attributes such as travel modes can be surmised (Tsui and Shalaby, 2006) further reduces the number of questions that need to be asked on traditional travel attributes. In terms of expanding the survey period, longer term vehicle-based surveys using GPS have been used for diverse purposes, such as traffic safety effects of in-vehicle information systems in Sweden (Hjälmdahl and Dukic, 2007) and behavioral effects of different road pricing schemes in Copenhagen (Schonfelder et al., 2007). Although the GPS survey's sample size might be reduced, the longer participation period for each respondent may provide greater value than large-sample one-day surveys (Murakami et al., 2003). In terms of exploring less understood facets of travel behavior such as activity-travel decision making, the use of GPS surveys is still limited but promising, vis-à-vis the growing interest for data concerning decision processes (Bradley, 2006; Pendyala and Bricka, 2006). 2.2 ACTIVITY-TRAVEL DECISION PROCESS DATA
In the travel behavior context, process data describes the sequence and procedures by which people make decisions about their activities and travel, by focusing on how people collect, absorb, assimilate, interpret, and use information to make these decisions. This type of data intends “to reveal the cognitive process underlying the decision-making behavior” (Pendyala and Bricka, 2006).
The growth of travel demand management (TDM) policies, such as congestion pricing and encouragement of telework, makes travel demand models’ sensitivity to changes in travel behavior, especially scheduling behavior, imperative if one wishes to evaluate these policies’ results. Contrasting with common practice, travel demand models that better represent the decision making process increase forecast confidence levels and possibly increase model transferability (Pendyala and Bricka, 2006). These improved models also allow for the evaluation of impacts of travel behavior changes. However, all currently operational models simplify decision-making behavior. Many scheduling models, for example, simplify the priority

5
order of activities, unrealistically assuming a fixed sequence for planning attributes (Auld and Mohammadian, 2009). The need to test this and other assumptions in travel behavior modeling led to efforts in process data collection as early as HATS (Jones, 1979). Later efforts include MAGIC (Ettema et al., 1993), CHASE (Doherty and Miller, 2000; Doherty et al., 2004), REACT! (Lee et al., 2001; Lee and McNally, 2003), EX-ACT (Rindsfuser et al., 2003), and Clark and Doherty, 2009, among others. The data collected by some of these projects made the development of scheduling models possible, such as SMASH (Ettema et al., 1996) and TASHA (Roorda et al., 2007), and the activity duration and execution model, COMRADE (Ettema et al., 1995). The HATS (Household Activity and Travel Simulator) survey was an innovative data collection method that used traditional travel diary data to create a timeline with participants' trips and activities. This timeline was shown to participants, who were then asked if and how they would change their schedules in reaction to changes in parking costs, work hours, transit service, etc. HATS inspired a range of later stated preference surveys like ATAQ (Jones et al., 1987), a computerized survey much like HATS, and CATS, which focused on allocation of cars within the household (Lee-Gosselin, 1990). MAGIC (Method of Activity Guided Information Collection) was a computerized survey designed to collect data for later development of scheduling models. Respondents completed an activity-travel diary on MAGIC and then completed another activity-travel diary that occurred after a new policy was enacted, such as extended shopping hours. MAGIC kept track of all of the adjustments. The CHASE© (Computerized Household Activity Scheduling) survey (Doherty et al., 2004) recorded schedules of 271 households for one week each in Toronto, Canada using computer software over 14 months in 2002 and 2003. Survey participants went through upfront interviews, consisting of socio-demographic questions and entry of their known schedules for the week. The researchers asked these participants to update their schedules daily and register the actual outcome of their activities. The CHASE survey recorded all of the schedule modifications, additions, and deletions, which let these researchers analyze activity planning horizons and rescheduling behavior. When these participants changed their schedules, the CHASE survey asked them why and when they decided to change their routine. All of the data was self-reported, including the activity locations, which were reported in terms of census tracts.
Despite the misrepresentation of some age and housing type groups, the CHASE sample’s overall representativeness was satisfactory (Doherty et al., 2004). The response rate was 16.6%. The researchers offered each of the participants a $20 Canadian gift card, but after survey completion, 94% of them said that they would have joined the survey even if there was no financial incentive involved. More than half of the participants stated that they enjoyed participating in the CHASE survey, even though almost a half of them considered it too long (an average of 20 minutes per day). Some of the survey participants also mentioned that the survey was too intrusive, tedious and repetitive. Besides providing a successful instrument for decision process data collection, the CHASE survey mainly showed that the scheduling process was much more complex than the sequential approach used by activity-based travel demand models up to that date. The CHASE survey data was considered so good that it was used to inform the development of parts of the activity scheduling micro simulation model, TASHA. The CHASE survey, however, had two great operational drawbacks. Researchers had to conduct the upfront surveys and manually enter survey data into the software’s database, which was expensive and time consuming. They also had to provide a laptop computer containing survey software to each participating household for one week.
Aiming to overcome this and other inefficiencies, REACT! (Lee et al., 2001) was developed as a fully self-assisted survey software that could be taken from participants’ personal computers. REACT! let the researchers connect to the Internet and transmit collected data to a remote server. This survey used the thick client (client-side processing) paradigm,
6
where the greatest part of data processing occurred with the client, minimizing slowness caused by intensive data transmission over the Internet. However, this approach required software installation and de-installation after the surveys were over, so the researchers sent a package with an installation CD and administrative material to people who responded to advertisements about the survey.
REACT! eliminated the timeline and reformulated the weekly calendar display when compared to CHASE (Lee et al., 2001) to minimize potential survey bias caused by showing respondents gaps in their schedules. REACT! also allowed participants to register partial plans, i.e., plans that do not have all travel attributes identified at the beginning of the planning process, such as start and end times, accompanying people, and known locations. REACT!’s data showed that people fit activities into their schedules in a more opportunistic way than by trying to maximize utility. They usually insert shorter duration activities around longer activities that anchor their schedules. Significant parts of their trip-chains were also planned during execution of the chain, not beforehand. Changing the focus from building on the CHASE survey type to collecting more in-depth activity-travel behavior information, Clark and Doherty (2008) and Clark and Doherty (2009) presented a survey method using open-ended questions to capture "the content and attributes of people's preplanned schedules" (Clark and Doherty, 2008) and to analyze scheduling and rescheduling decisions (Clark and Doherty, 2009). These researchers interviewed participants about their activities and travel plans for the following two days and then tracked them using a GPS device and a smartphone. After GPS data processing, these participants confirmed or corrected their activity-travel patterns through the Internet. The actual patterns were then manually compared to the schedules described in the interviews to identify changes between their plans and the observed outcomes. With this information, researchers interviewed these participants again to understand their processes, motivations, and consequences, which resulted from their schedule changes. This project was the first attempt to apply GPS surveying on process data collection known by this report’s authors. The GPS records of actual travel patterns fundamentally allowed researchers to identify a higher frequency on scheduling changes than that observed in previous studies. However, Clark and Doherty (2009) stated that the difference could be even larger if computer software was used to identify these changes. These results have indicated that GPS surveys are well suited for activity-travel behavior process data and that survey automation is important for facilitating data analysis and increasing quality. 2.3 TOUR FORMATION CHARACTERISTICS
The collection of detailed, GPS-enabled activity travel patterns and process data allows for analysis of tour formation characteristics. An individual’s observed activity-travel pattern is the ultimate outcome of his activity-travel decision-making process. Therefore, shedding a light on this process’s components (e.g. schedule formation) is an important step towards understanding the underlying motivations that lead to that ultimate outcome. Understanding how a person decides on what activities to engage in and when to perform them is not enough.
Understanding how trips are organized to accomplish all desired activities is as relevant as understanding how a schedule is put together. It is therefore interesting to look at previous research on tour formation.
A tour generally refers to a sequence of trips that starts and ends at the same location. In the context of travel demand analysis, this initial and final location is usually considered the individual’s home. During a tour, an individual may make one or more stops, or even no stops at all. Trip chaining consists of combining multiple stops into a single tour; for example, when an individual goes from home to work, from work to shopping, and then back home. Despite the importance of the trip chain concept, there is no consensus in the literature on its definition and different authors define different typologies in their studies. Some authors consider a tour with a
7
single stop, for example, a trip from home to a certain location and then back home as a trip chain. In this case, this type of chain is referred to as simple trip chain. Others only consider trip chains for those tours that have more than one stop. This is the definition which will be adopted in the context of this report. The traditional four-step travel demand models do not address this more complex travel type, the trip chain. However, given their relevance in daily travel, researchers incorporate the tour concept into their advanced models and some of them take the tour, instead of single trips, as the basis for modeling (tour-based models). Tour formation also plays an active role in activity-based models. Nevertheless, because of the numerous factors influencing tour formation and their complex interactions, researchers still do not fully understand this matter. The next paragraphs describe some of the work and findings on the tour formation process done up to date. Given the close relationship between schedule and tour formation, Lee and McNally (2004) used scheduling data from a REACT! pilot project to analyze the dynamics of the tour formation process. Using ordered logit models, the authors found that the probability of observing impulsive stops increases as stop sequences increase, suggesting that the first stops in a tour tend to be planned and the decision for making the following stops are made as the tour develops. As expected, the authors find that individuals are more likely to make an impulsive stop as the travel time to the stop location decreases. Using data from the Metropolitan Adelaide (Australia) Household Travel Survey, Primerano, et al. (2008) found that some activities are more likely to be included in trip chains than others. For example, in Adelaide’s data set, they found that 75% of employers’ business (work related) activities were performed during trip chains. More than half of the personal business trips and those serving passengers were also chained. On the other hand, only 6% of trips involving educational activities were chained with trips for other purposes. Seventy percent of the work trips and 60% of health care trips did not involve any additional stops. These findings are in line with those of Al-Jammal and Collura (2007), who investigated how much the type, sequence duration, and timing of fixed activities influenced trip chaining. Primerano et al. (2008) showed that most tours with multiple stops occurred on week days rather than weekends. Trip chaining behavior was also shown to be related to household type and structure. In a more profound analysis of the relationship among household type and structure, time-use patterns, and trip-chaining behavior, Lee et al. (2007) found that the number of household heads and working status are the main determinants of trip chaining behavior and activity time allocation. For example, households with children tend to spend more time in chained activities and couple two-worker households are more likely to spend time in subsistence activities in their trip chains rather than maintenance or discretionary activities. Most studies indicate that complex trip chaining is more common when driving than when using transit (Hensher and Reyes, 2000; Ye et al., 2006; Noland et al., 2008). However, not all studies confirm this. In the Adelaide study, Primerano et al. (2008) find, on average, a higher number of activities on tours taken with public transportation. The authors argue that the nature of transit and car drive trip chaining are inherently different. While a car driver has a broader choice of stops, a transit user may visit destinations where a variety of activities can be pursued in close proximity to each other, thus allowing for non-motorized travel in the middle of the tour. Primerano et al. (2008) determined that the type of activity rather than time of day helps determine when activities are most likely to be chained. Personal and employer’s business and health care trips, for example, are undertaken mainly during off-peak hours (9 a.m. to 5 p.m.). The only trip purpose that truly demonstrated any association with peak hours was that which involved serving the passenger (e.g., picking-up, dropping-off, or accompanying someone). A trip’s departure time does not affect the duration of the trip chains either, particularly those chains that include inflexible activities (Al-Jammal and Collura, 2007). In the case of

8
chains which include inflexible activities (i.e., those which are fixed in time and space), being a man negatively influences the chance of performing such a chain. A woman, however, is 27% more likely than a man to perform this type of chain. Being married or having children also decreases the chance of chaining another activity after an inflexible one; what might be associated with the commitments relative to marriage and parenthood (Al-Jammal and Collura, 2007). The effect of urban form on trip chaining behavior still remains very unclear. While some researchers have found that households living in areas with higher density of service facilities make more tours but less stops per tour (Krizek, 2003), others found that a higher number of tours is associated with medium density areas, such as suburbs (Noland and Thomas, 2007). Some studies have focused on the tour formation process among the elderly and suggest that trip chaining is higher among this age group (Golob and Hensher, 2007). Considering this suggestion and the fact that this study also focuses on the elderly, it is particularly interesting to look at previous findings regarding this cohort’s trip chaining behavior. Using data from the 2001 National Household Travel Survey (NHTS), Noland et al. (2009) made several conclusions. First, they found that elderly males are less likely to trip chain than elderly females, although this disparity is smaller among seniors than among younger people. Second, they concluded that income did not have a significant statistical effect on trip chaining behavior, even though Noland and Thomas (2007) earlier found that income level affected the general population’s trip chaining behavior using the same data source. Third, they learned that medium population density ranges positively affected elderly trip chaining, similar to that for the whole population (Noland and Thomas, 2007). Finally, they concluded that elderly people made the most of their complex trip chains earlier in the week, with Monday presenting the highest number of chains for this age group. This observation contrasts with the previous analysis which revealed that the general population increased their level of trip chaining complexity towards the end of the week, peaking on Fridays (Noland and Thomas, 2007). Like most previous studies, Noland et al. (2009) found that elderly public transit users frequently engaged in complex tours (i.e. those that have more than one stop) and showed no conclusive effects of stated medical conditions on trip complexities. For some age groups (e.g. 66-70 year-olds), medical conditions decreased trip complexity, while for others (e.g. 81-84 year-olds), they increased trip complexity. Medical conditions that required driving cessation also did not seem to affect elderly trip chaining behavior. To better situate the reader to a discussion of elderly people and their relationship with transportation, the research team will describe the aging process and its implications for transportation, other relevant characteristics of elderly activity-travel behavior, and more insights on the peculiarities of elderly trip-chaining behavior. 2.4 THE ELDERLY POPULATION AND ITS IMPLICATIONS ON TRANSPORTATION PLANNING
Population aging is a process occurring throughout the globe. Increases in life expectancy and decreases in birth rates are the main factors inducing this process. As gains in life expectancy and decreases in birth rates have been accelerating in the last decades, the aging process has accelerated in the last two or three decades. The developed countries have been experiencing this phenomenon much faster than other parts of the world, especially in Japan, followed by the European Union, and the United States (U.S.) (Turner et al., 1998). In the U.S., the aging of the post-war “baby boom” generation is another important factor that is increasing the senior population (U.S. Census Bureau, 2009). In 2007, there were 37.8 million people age 65 and older in this country, representing 12.4% of the population (U.S. Census Bureau, 2007). While the total U.S. population is expected to increase 29.2% from 2000 to 2030, the U.S. elderly population is expected to increase 104.2%, which means that the U.S. will have 36 million more seniors than in 2007 (U.S. Census Bureau, 2004). Because of the

9
potential social and economic impacts due to aging, this fast change in the population’s composition has made aging a major issue. An aging population’s implications go well beyond macro economic impacts as the change in the age pyramid is going to influence the whole social system. In Japan, where the aging process is most advanced, family structures, social networks, gender roles, employment patterns, immigration policy, cultural reactions, consumer and voting behavior are already impacted (Coulmas, 2008). Like other socio-economic systems, this new population structure will affect the transportation system. Therefore, it becomes very important to understand how seniors' activity-travel behavior differs from that of younger people in order to identify their transportation needs and find the best ways to fulfill them. Researchers have studied the relationship between elderly people and transportation since the aging phenomenon became the serious concern it is now (Bell and Olsen, 1974; Hanson, 1977; Stirner, 1978). In the beginning of the 21st century, this relationship became highly visible among transportation professionals, when the Transportation Research Board (TRB) of the National Academies listed it as a critical issue in 2002 (Pisarki, 2003). Since then, many more studies have investigated the elderly population’s characteristics, life styles, and activity-travel behavior. The issue of elderly drivers is one of the first topics to arise. In 2006, elderly drivers comprised 15% of licensed drivers in the U.S. (NHTSA, 2007). Individuals’ tendency to maintain their modal choice when they enter retirement, the increasing number of older licensed drivers, the increased ease of driving due to technological advances, a healthier older population and more disposable income are factors that contribute to more elderly drivers (Alsnih and Hensher, 2003). Concerns over the impacts of age on the ability to drive led to several studies regarding traffic safety and older drivers. Conditions most frequently present among them, such as increased reaction times, visual and hearing impairments, declined ability to move freely, declined cognitive capacity, and increased use of certain medications were found to negatively impact driving ability (McGwin et al., 2000; Lyman et al., 2001; Dobbs, 2005). Elderly drivers are more likely than others to be involved in intersection, side-impact and angle crashes, as well as crashes when turning, particularly when turning left (Robertson and Vanlaar, 2008). However, more important is the fact that the road fatality rate among seniors tends to be higher than average. Besides the higher crash risk per mile driven that is associated with senior drivers (Rosenbloom, 2003), physical frailty plays an important role in fatality statistics because an older person has a smaller chance of surviving than a younger one in a crash with the same severity level. According to the U.S. National Highway’s Traffic Safety Administration (NHTSA, 2007), “in 2007, older people accounted for 14 percent of all traffic fatalities and 19 percent of all pedestrian fatalities.” As age increases among the elderly, especially after they reach their 80s, the risk of being involved in a crash and fatality rates become even higher (CDC, 2009; Dellinger et al., 2004). Differently than younger drivers, who pose a threat to themselves as well as others, elderly drivers threaten themselves much more than they threaten others, since they are more likely to be injured or killed in a crash (Evans, 2000; Dellinger et al., 2004). Nevertheless, driving restrictions on elderly people raises intense discussion since there are concerns that these restrictions would isolate and significantly and adversely affect their quality of life (Bricker, 2009). The relationship between mobility and quality of life is not yet totally understood (Spinney et al., 2009), but a study focusing on elderly people’s definition of quality of life suggests that “family relationships, social contacts, and activities are as valued components of a good quality of life as general health and functional status” (Farquhar, 1995). Both social contacts and activities are positively associated with mobility; therefore, any mobility loss caused by driving cessation would diminish elderly people’s quality of life.

10
Driving accounts for approximately three quarters of American seniors’ travel (Collia et al., 2003). In fact, elderly people drive for more of their trips than younger people do (Rosenbloom, 2003) and represent only 2% of all transit use (Collia et al., 2003). Seventy-nine percent of them live in low density suburban or rural areas (Rosenbloom, 2003), which are not well suited for traditional public transit services or short walking distances to amenities. As people tend to retire “in place” (Alsnih and Hensher, 2003), the choice for living in these lower density areas was usually made years before reaching old-age, when driving ability and walking were not problems. Even though elderly people travel shorter distances and drive less frequently than others (Collia et al., 2003; Mercado and Páez, 2009), their driving characteristics may cause disproportionate air pollution (Rosenbloom, 2001). Using data from the 2001 NHTS, Collia et al. (2003) estimate that adults 65 years-old and older average 3.4 trips per day, while 19 to 64 year-olds average 4.4 trips per day. They also stated that older men travel an average of 27 miles per day while younger men travel an average of 42 miles per day. The proportional difference is even greater for women: older women travel an average of 10 miles per day versus 25 miles per day for younger women. These shorter trips lead to more “cold starts” when the car engine is started at a low temperature (ambient temperature, for example) and when the engine is not subsequently hot enough for the catalyst to adequately perform. Cold starts release more pollutants than any other part of the driving cycle; therefore, a small number of short trips may pollute much more than one longer trip. An important factor in elderly peoples’ travel behavior is the sometimes profound gender differences which are generally observed. Adult women typically travel less than adult men at all ages and are also more likely to use public transportation than adult men (Collia et al., 2003). Among the elderly, men more frequently have a driver’s license than women: for those 85 years-old and over, 72% of men had a license versus 41% of women (FHWA, 2006), although this disparity is being reduced. The increase in the number of elderly female licensed drivers is expected to shift trips from transit to car driving (Golob and Hensher, 2007). Among the younger elderly, aged between 65 and 69 years-old, the drivers licensing rate is 94.5% for men and 84.3% for women (FHWA, 2006). However, it is not known if men and women will give up renewing their licenses as they get older at the same rate. Men represent 42% of the elderly American population (U.S. Census Bureau, 2008), and 71% of them have a present spouse (He et al., 2005). On the other hand, women account for 58% of the elderly in the U.S. (U.S. Census Bureau, 2008), but only 41% have a spouse present (He et al., 2005). The fact that less women count on a spouse to help them overcome mobility restrictions makes women more susceptible to requiring help from other family members, who might not be available. Golob and Hensher (2007) demonstrate how having a spouse, both for men and women, is positively associated with higher mobility. The higher chance of not having a drivers license, one of the most powerful mobility tools along with vehicle availability (Mercado and Páez, 2009), further limits elderly women’s mobility. These characteristics and others make women more vulnerable to major losses in mobility, what motivated several studies on this topic, both from the perspective of public health and transportation planning (Wallace and Franc, 2009; Rosenbloom and Herbel, 2009). For both genders, however, not only the distance traveled but also the number of tours decreases linearly from ages 65-69 to 80-85. After reaching 85 years-old, the decrease in both trip distance and number of tours is drastic (Golob and Hensher, 2007, Mercado and Páez, 2009). Despite the “general decline of distance traveled as age advances” (Mercado and Páez, 2009), this decline is significant only for the auto-drive mode, not for auto-passenger or bus. Golob and Hensher (2007) find a similar result in terms of the proportion of tours: car driving tours suffer greater decreases with age than car passenger or transit tours. The number of car driving tours peaks at ages 40-44, and rapidly declines as individuals get older, leading to an increase in the proportion of car passenger and transit tours. These results indicate that the

11
decrease in travel associated with aging is likely caused more by the loss of driving ability rather than the decrease in the need or desire for reaching destinations. Mercado and Páez (2009) stated that seniors prefer the independence transit affords rather than depending on family or friends for rides. Considering these findings and all other social, safety, and possibly environmental implications associated with an increased number of elderly, it becomes very important to provide seniors with attractive alternative forms of transportation. Walking is a desirable transportation mode for all ages since it promotes health benefits (Yaffe et al., 2001), does not contribute to air pollution, and demands minimal energy consumption. Yet mobility restrictions rule out walking as an option for a larger part of the elderly population rather than the general population. Elderly people also have the highest rates of pedestrian death and injury among all age groups when adjustment is made for exposure (Langlois et al., 1997), which might make walking even less desirable for the elderly, including those in good health condition. Traditional fixed-route transit services may not serve many destinations that elderly people seek. Most elderly people are retired and therefore do not have work trips, which public transit best serves. They tend to more frequently make social, recreational, shopping, and health care trips (Collia et al., 2003), usually within the suburbs (Mohammadian et al., 2007), where transit is frequently not available or competitive with the car. Public transit’s vehicle or service characteristics may also be currently inappropriate for their needs. Many seniors perceive personal safety in a public vehicle as a problem, for example (Mohammadian et al., 2007), even though driving is in fact much more dangerous. They prefer buses with lower height floors, which are not always available, and high-tech improvements, such as real-time expected wait information displayed in the station and real-time transit information available by cell phone. They also would like increased service frequencies and printed transit schedules, especially since data collected from Chicago area seniors reveals that longer transit travel times are a major deterrent that keeps them from using public transportation (Mohammadian et al., 2007). Paratransit may be an attractive alternative, if regular public transportation does not currently fit elderly needs. Unfortunately, paratransit has very high operational costs and is therefore usually restricted to severely disabled people, who represent a diminishing part of the elderly population (Rosenbloom, 2001). Therefore, seniors whose disabilities are not severe enough to warrant paratransit use, but are not healthy enough to walk and wait for public transportation, have no alternatives to driving. This same situation applies to those who live in areas without public transportation. Only 12% of all seniors who reported medical conditions which affected their travel on the 2001 NHTS stated that they use special transportation services. The “service route” or “community bus” is an alternative form of transportation that has more successfully served elderly people. This type of service started in Sweden (Ståhl, 1992), as an alternative to costly paratransit. These routes use small, low-floor buses, which run on fixed routes designed to serve origins and destinations sought by elderly people, but are available to everyone. Drivers help passengers who need help boarding or leaving the buses and leave only when all passengers are seated. The stops are located as close as possible to the door of destinations to minimize walking distances. In Sweden, these service routes have shown higher passenger occupancy per mile and higher cost recovery than traditional bus services (McLary et al, 1993). The first attempt to implement service routes in the U.S. was made in Madison, WI in 1992 (McLary et al, 1993). The Swedish example inspired these service routes, with adaptations to local conditions. Interestingly these services were designed for shopping and health care trips, which accounted for more than 90% of all trips. Although the overall service quality was evaluated as good or very good for 90% of these users, ridership neither grew at the expected rate nor derived from demand for paratransit use after six months of implementation.

12
This may have resulted from their limited service areas, which did not cover a satisfactory number of destinations, given Madison’s dispersed land use (McLary et al, 1993). Since that time, Madison’s Metro Transit has added to and modified these routes to effectively attract elderly people who did not use alternative transit modes before (Rosenbloom, 2001). But even if transportation was not so much of a problem for many seniors nowadays, nothing ensures that elderly in the future will have the same behavior and needs as elderly today. Historical trends indicate that today’s seniors behave differently than their past counterparts since they are “living longer and healthier lives than ever before” (U.S. Census Bureau, 2005). Their more active lifestyles have led to an increased number of out-of-home activities when compared to previous generations of elderly people. Seniors in 1995 made 77% more vehicle trips, spent 40% more time driving, and drove 98% more miles than those in 1983 (Rosenbloom, 2001). Transit ridership among elderly is falling, and expectations are that it will continue to fall (Rosenbloom, 2001). Driving among elderly women is increasing and disability rates among all elderly cohorts are decreasing (He et al, 2005). Elderly participation in the labor force is also expected to increase. With these changes in mind, Arentze et al. (2008) used the micro-simulation ALBATROSS (Arentze and Timmermans, 2003) to explore an aging population’s mobility effects and the expected changes in future seniors’ activity-travel behavior. The baseline condition assumes no change in elderly activity-travel behavior. The other scenarios are based on ongoing trends of behavioral change among the older population in the Netherlands. They assume that elderly people in the future will (1) work longer, (2) have increased number of out-of-home activities, notably in the social/leisure category, (3) try to avoid morning peak hours and (4) increasingly live in suburban areas. Findings indicate a growth in mobility in terms of passenger kilometers traveled, increased automobile travel, and more traffic in already congested areas and peak hours. Arentze concluded that elderly people in the future will use transit more than elderly people currently do, at least in the Netherlands, although overall use will remain small. Even though the chance of being involved in an accident in the Netherlands is expected to decrease, the number of fatalities among elderly people will most likely increase because of their vulnerability. Other recent studies regarding the relationship of older people with transportation have focused on elderly modal choice (Mercado and Newbold, 2009), factors influencing elderly travel demand (Hibino et al, 2007; Roorda et al, 2009), costs associated with elderly mobility (Rye and Mykura, 2007; Venter, 2009), and the influences of urban design on elderly mobility (Xinyu et al., 2008; Hough et al., 2008). To the authors’ best knowledge, no study has previously addressed seniors’ activity-travel decision-making behavior. This work is therefore expected to increase the reader’s understanding of elderly activity-travel behavior by collecting data that gives insights behind the decision-making process and how this process differs among older and younger people. The rest of this report describes the survey methodology used to collect activity-travel and decision-making process data and the strategies used to implement this survey. This report also assesses the quality of the data collected and makes a comparative analysis of elderly and non-elderly individuals’ activity-travel patterns and decision-making processes. Finally, conclusions are derived from the implementation experience, data quality assessment, and comparative analysis.

13
CHAPTER 3 METHODOLOGY
The research team conducted this survey using an automated GPS-based, prompted
recall approach with learning algorithms over the internet, combining passive and active data collection. The instrumental part of this survey (e.g. survey software and equipment) is similar to several other GPS surveys, such as an Australian project conducted by Stopher and Collins (2005), and the work by Li and Shalaby (2008) and Tsui and Shalaby (2006). The type of data collected in this study; however, is more comprehensive and the data processing algorithms more innovative. These algorithms immediately used uploaded data to automatically generate the prompted recall survey without manual input. Besides collecting traditional activity-travel diary data, such as activity purposes, travel modes, times, and distances, this survey also collected decision process data by asking participants about how and when they planned their activity and travel attributes and the perceived constraints on those decisions. Details of the survey design and information about this survey’s pilot study are presented by Auld et al. (2009), the authors who developed this survey instrument. Each respondent was asked to participate in the survey for 14 consecutive days. This survey asked about respondents’ data on activity-travel patterns, planning horizons, flexibilities, people involved, and travel costs. It also collected this data daily, registered their schedule evolutions, and observed outcomes for a set day during the survey period. 3.1 SURVEY METHODOLOGY
The data collection had three phases. Respondents completed the first phase of data collection when they registered for the survey and provided socio-demographic information and data about their routine activities and frequently visited locations. The research team used this latter data to allow their survey software to automatically identify activity and travel attributes to avoid repetitive queries and reduce respondents’ data entry burden. This was implemented in response to pilot feedback. For routine activities, the survey displayed a table where users could input activity type, location, people involved, start time, end time, trip variability, and days of the week when that activity was routinely performed. For frequently visited locations, the survey software displayed a Google map for respondents to identify location addresses or nearby intersections. Respondents could also drag a pointer to identify exact locations within a block or large building.
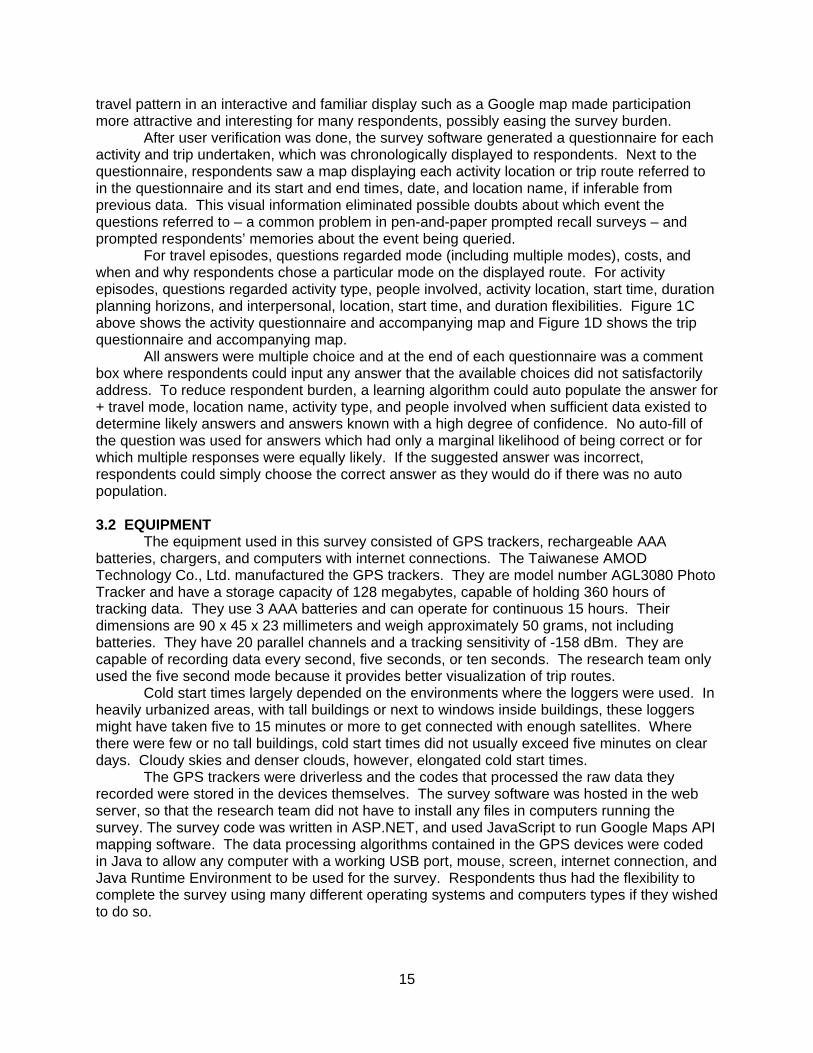
The second phase of data collection consisted of a periodic activity planning survey, which asked respondents about their preplanned activities and associated activity types, locations, start and end times, travel modes, and people involved for a fixed day, which was set to be eight days after the user registration date. The planning survey page is shown in Figure 1A. This survey was repeated three days and one day before the “pre-planning day.” Because different attributes of an activity or trip have different planning horizons (Doherty and Miller, 2000; Clark and Doherty, 2008), this survey only let respondents enter attributes which were known for the pre-planning day as well as for routine activities. If respondents planned an activity, but did not know all of the people involved or the location of the activity by the pre-planning day, they would only enter the activity type on the planning survey page since that was all they knew at that time.
In the final phase of data collection, respondents carried a cell-phone-sized personal GPS logger with them for approximately two weeks to record the planning day’s outcomes. At the end of each day, respondents connected the logger to the computer with an USB cable and clicked ok on an auto play window to upload their logs onto the survey website. This allowed the computer software to run codes to process the GPS data. The survey website’s login page

was alsoresponde
Figure
T
timeline aRespondtimeline nand trips and trip ninterpretivisualize log assoclocation fof all actiRespondand locatdisplayedin and ou
o automaticaents only had
e 1. Survey w
Qu
The data in thand a map d
dents visualiznext to the mand through
numbers in tng maps or their observ
ciated with sfinding algorivities (97%
dents could ations modified to respondut, scroll, and
lly loaded ond to enter th
A
C website: A. Puestionnaire
he log file wadisplaying thzed their act
map, which wh a set of nuthe timeline. interpreting
ved patternssignal acquisrithm. Testssensitivity) wadd or deleteed. After eadents. This wd visualize th
nto respondeheir passwor
Planning day about activ
as transferree automatictivity-travel pwere connecumbered icon
This allowetimeline form
s. Respondesition delay, s demonstratwith an 87%e activities ach modificat
website pageheir trips as
14
ents’ web brrd.
y survey; B. ities; D. Que
ed to the weally detected
patterns on acted throughns on the maed respondemat data to ents were thebad satelliteted that the positive pre
and trips andtion, a new me is shown insatellite ima
rowsers with
Activity-trav
estionnaire a
b server andd activities aa Google ma
h the use of sap which co
ents who wehave an alteen promptede fixes, or ocprocessed G
edictive valud/or have themap incorpon Figure 1B.ages. The p
h the userna
B
D vel pattern coabout trips.
d processedand trips fouap as well asseparate col
orresponded re less skilleernate data sd to correct accasional faiGPS data cae (Auld et aeir start timeorating the ch Responde
presentation
me pre-filled
onfirmation;
to produce nd in the logs a simple lors for activto the activi
ed at either source to any errors inlures of the
aptured overl., 2009).
es, end timeshanges wasnts could zoof the activi
d, so
C.
a g.
vities ty
n the
r 97%
s, s oom ty-
15
travel pattern in an interactive and familiar display such as a Google map made participation more attractive and interesting for many respondents, possibly easing the survey burden. After user verification was done, the survey software generated a questionnaire for each activity and trip undertaken, which was chronologically displayed to respondents. Next to the questionnaire, respondents saw a map displaying each activity location or trip route referred to in the questionnaire and its start and end times, date, and location name, if inferable from previous data. This visual information eliminated possible doubts about which event the questions referred to – a common problem in pen-and-paper prompted recall surveys – and prompted respondents’ memories about the event being queried. For travel episodes, questions regarded mode (including multiple modes), costs, and when and why respondents chose a particular mode on the displayed route. For activity episodes, questions regarded activity type, people involved, activity location, start time, duration planning horizons, and interpersonal, location, start time, and duration flexibilities. Figure 1C above shows the activity questionnaire and accompanying map and Figure 1D shows the trip questionnaire and accompanying map. All answers were multiple choice and at the end of each questionnaire was a comment box where respondents could input any answer that the available choices did not satisfactorily address. To reduce respondent burden, a learning algorithm could auto populate the answer for + travel mode, location name, activity type, and people involved when sufficient data existed to determine likely answers and answers known with a high degree of confidence. No auto-fill of the question was used for answers which had only a marginal likelihood of being correct or for which multiple responses were equally likely. If the suggested answer was incorrect, respondents could simply choose the correct answer as they would do if there was no auto population. 3.2 EQUIPMENT
The equipment used in this survey consisted of GPS trackers, rechargeable AAA batteries, chargers, and computers with internet connections. The Taiwanese AMOD Technology Co., Ltd. manufactured the GPS trackers. They are model number AGL3080 Photo Tracker and have a storage capacity of 128 megabytes, capable of holding 360 hours of tracking data. They use 3 AAA batteries and can operate for continuous 15 hours. Their dimensions are 90 x 45 x 23 millimeters and weigh approximately 50 grams, not including batteries. They have 20 parallel channels and a tracking sensitivity of -158 dBm. They are capable of recording data every second, five seconds, or ten seconds. The research team only used the five second mode because it provides better visualization of trip routes. Cold start times largely depended on the environments where the loggers were used. In heavily urbanized areas, with tall buildings or next to windows inside buildings, these loggers might have taken five to 15 minutes or more to get connected with enough satellites. Where there were few or no tall buildings, cold start times did not usually exceed five minutes on clear days. Cloudy skies and denser clouds, however, elongated cold start times. The GPS trackers were driverless and the codes that processed the raw data they recorded were stored in the devices themselves. The survey software was hosted in the web server, so that the research team did not have to install any files in computers running the survey. The survey code was written in ASP.NET, and used JavaScript to run Google Maps API mapping software. The data processing algorithms contained in the GPS devices were coded in Java to allow any computer with a working USB port, mouse, screen, internet connection, and Java Runtime Environment to be used for the survey. Respondents thus had the flexibility to complete the survey using many different operating systems and computers types if they wished to do so.

16
CHAPTER 4 SURVEY IMPLEMENTATION The research team started implementing this survey in February 2009 when they
purchased GPS data loggers, rechargeable batteries, and chargers, and began recruiting and training survey assistants. The research team recruited respondents from March 2009 through January 2010. They surveyed 101 Chicago area households, of which approximately half were elderly and the remainder non-elderly.
GPS and internet surveys were largely experimental at the time (NCHRP, 2008), so no standardized procedures, such as guidelines for sample sizes and methods for drawing samples, deploying equipment, and retrieving data were available for these types of surveys. The research team therefore tried to have their survey methodology and implementation procedures follow as closely as possible those procedures recommended in the literature for traditional travel surveys, which could be applied to GPS and internet surveys.
The Institutional Review Board of the University of Illinois at Chicago approved the survey protocol and declared it exempt from federal regulations for the protection of human subjects. 4.1 SELECTION OF SURVEY ASSISTANTS, TRAINING AND ASSIGNMENT
The survey assistants were the contact links between survey respondents and the University of Illinois at Chicago (UIC). They were responsible for recruiting respondents over the phone, delivering survey equipment to the respondents and training them on it, helping them with their data collection problems, and collecting the survey equipment and performing exit interviews.
Because of the close interaction between survey assistants and respondents (including face-to-face meetings usually held at the respondents’ residence), the research team adopted a strategy that was similar to that of the tailored interviewer. In this strategy, only one person contacted each respondent through all of the survey’s phases. These survey assistants, however, were not interviewers since respondents read and answered all questions directly on the survey website. This strategy was designed to increase rapport between the survey workers and respondents, thus facilitating the survey process and ensuring higher cooperation rates (Bricka, 2006). This implied that the survey assistants were knowledgeable on all aspects and steps of the survey, which gave them a steeper learning curve. All assistants who worked on this implementation were UIC students with backgrounds in communications or psychology. Over the entire survey period, this project employed six survey assistants, with up to five of them working simultaneously. These assistants were selected based on their interpersonal skills, communication and teaching capabilities, and familiarity with computers. They were instructed about general travel surveying practices, the history of GPS use in this area, and this survey’s goals. Assistants received detailed training about how to use the survey equipment and the meaning and purpose of each part of the survey, including detailed instructions on how data is processed and transferred over the internet from the GPS logger to the web server. Finally, assistants took the survey for approximately one week to become familiar with the experience of being a respondent and the possible difficulties which may be encountered when taking the survey. Biweekly or more frequent work team meetings allowed survey assistants to exchange experiences and discuss how to improve survey implementation. 4.2 RECRUITMENT OF RESPONDENTS
Respondents were recruited from a random stratified sample of people from Cook, DuPage, Lake, and Will Counties. These counties together cover 2,565 square miles and have over 6,600,000 inhabitants. People 65 years old and older constituted half of this sample and

17
people between 16 and 64 years old constituted the remainder. This sample was stratified by county and four income categories and followed the geographic population distribution existing in the 2000 Census. However, because of past experiences with lower response rates among lower income and lower education households (Kurth et al., 2001), the research team oversampled these types of households in an attempt to yield a final income distribution similar to that of the 2000 Census. People 16 years old and older were eligible to participate in this survey because they typically have full control over their schedules and do not depend on others to pick them up and drop them off at activity locations, especially in the suburban areas, where travel options other than driving are limited. People who were able to leave home, who were healthy enough to complete this survey, and who knew English were also eligible for this survey. The language restriction applied because the questionnaire was only available in English; however, this limitation applied only to a minute number of potential respondents. However, respondents were required to have basic computer knowledge since the research team thoroughly provided training and assistance. For those households that did not have a working computer and internet connection, the research team provided laptops with dial-up or wireless broadband. Assistants either left the laptops and internet data cards for household use during the survey period or brought the equipment with them to these households every two or three days. In the first case, having a computer and an internet connection for two weeks was an extra incentive to participation. In the second case, even if respondents answered the survey a couple of days after the trips and activities occurred, the prompted recall method of displaying the events on a map likely resulted in very low information loss (Bachu et al., 2001). The GPS tracker storage capacity was also not a concern since it could hold 360 hours of data. The incentives for participation were a $25 debit card for each respondent in the household, and entry into a drawing to win one grand prize of $500 or one of two first prizes of $250, also in the form of debit cards. Respondents were entitled to the $25 debit card after completing the upfront surveys and two survey days. These drawings sought to increase continued participation throughout the 14-day survey period. Respondents got one entry for each day they uploaded data and completed the associated questionnaires. Respondent recruitment and their participation in the survey had the following life cycle: Sending of invitational material, invitational phone call, initial visit for equipment delivery and training, assistance during the course of the survey, and final visit for equipment retrieval and incentive delivery. 4.2.1 Advance Material
The research team mailed packages with advance letters from UIC, the institution conducting the survey, and the Illinois Department of Transportation (IDOT), the governmental agency sponsoring the survey, along with an illustrated explanatory brochure to potential respondents. This advance material is presented in Figures 33 to 36 in Appendix A.
The letter from UIC explained the survey’s purpose and nature and the incentives for participation. The brochure provided information about the steps involved in completing the survey and sought to attract peoples’ interest with images of the survey equipment and website. Both of these items displayed the UIC Transportation Research Laboratory’s (TransLab) address and phone number, so potential respondents could dispel any of their doubts surrounding this survey’s legitimacy. The research team also included the advance letter from IDOT to increase this survey’s credibility in the general public’s eyes since IDOT can act upon survey results. A previous study showed that this letter significantly and positively affects response rates (Mohammadian et al., 2007).

18
4.2.2 Phone Call
A survey assistant called possible respondents two to seven days after the packages’ expected receipt date to assess their and other household members’ interest in participating in the survey. Following the NCHRP (2008) guidelines, a survey assistant called six times and left messages, if possible, before classifying a household as non-responsive. Messages were rarely returned. When the household was reached and one or more people in the household decided to participate, the survey assistant scheduled an initial visit for equipment delivery and training at the participant’s choice of time and location. The survey assistant who made this first contact remained the respondent’s contact person for the rest of the survey. Most participants, especially elderly people, chose to have these meetings at their residence. However, some preferred to meet their survey assistant at public libraries, at their offices during lunch break, or at coffee shops. The survey assistant assessed the availability of a working computer and internet connection and the operating system in use to verify their compatibility with the GPS device and ensure that laptops were provided when needed before visiting. Though the survey itself works independently of the computer operating system, additional steps were needed to complete the uploading of the survey data for Macintosh computers, which required additional training. 4.2.3 Equipment Set Up, Respondents Training and Assistance
The first meeting would typically take 40 minutes, depending on the respondents’ familiarity with computers and to some extent, familiarity with maps. For those less familiar with computers, this meeting would last up to two hours. Survey assistants trained respondents; registered users; helped respondents complete the socio-demographic, routine activity, and frequently visited location data; and helped perform data entry for the scheduled planning day at this meeting.
The socio-demographic survey was the quickest part to be completed. For elderly respondents, the routine activities survey was also fast because many of them were retired and had little or no routine activities to be entered. The duration of the frequently visited locations survey varied according to respondents’ knowledge regarding addresses, intersections, general spatial distribution, and number of locations visited. The planning day schedule took about the same time to be completed as the routine activities survey. The most time consuming part of the first meeting was training. With the survey assistants’ help, respondents completed an example log, practiced uploading a log, and corrected errors on the automatically detected activity-travel pattern. The assistants also answered any questions their respondents had. For respondents who were used to computers, training took 15 to 25 minutes; for those who were not, training was longer than an hour. The survey assistants gave their respondents detailed, printed, step-by-step instructions needed to daily complete the survey. These instructions featured many pictures and screen shots to aid respondents’ memory. According to respondents’ suggestions during the initial training, the survey assistants let their respondents do everything, from simple actions such as turning the GPS device on and off to handling the mouse during training with the exercise log. This hands-on approach and the accompanying instructions positively impacted respondents’ experience with the survey and reduced the number of requests for help after the first meeting. Making online videos with detailed tutorials on survey steps and the resolution of possible problems may improve this process in the future. These videos might decrease the need for assistance visits and consequently decrease associated costs. For those who could not successfully complete this survey for the first time on their own, the survey assistants called or regularly visited their respondents until they were able to take the survey by themselves. Most of them had difficulties after the first training because they did not regularly use computers, indicating that their unfamiliarity with computers caused most of these

19
difficulties, rather than the survey itself. Notice that half of these respondents were elderly people that were not predisposed to computers. As computers become less of a novelty among older people, this type of problem, however, is expected to decrease in significance in future surveys. In some cases where respondents tried their logs in computers other than those used during the training session, compatibility issues between the survey software and the computer occurred, causing the need for extra meetings between respondents and survey assistants. An unforeseen compatibility problem was that some computers did not have up-to-date versions of the Java Runtime Environment installed, or did not have it at all, which prevented execution of the codes responsible for processing the GPS trackers’ recorded raw data. Another common compatibility problem regarded different computers’ security settings, which sometimes also prevented proper survey execution. Respondents got highly frustrated when any problem occurred during the survey demonstration and caused a few of them to change their minds about joining the study. Therefore, it was very important that the survey assistants were prepared to handle incompatibility issues either by updating respondents' computers or by having a laptop that could be used for demonstrations. The survey database was checked daily to ensure that respondents were completing the survey accordingly. When it was identified that respondents did not complete the survey for more than two consecutive days, the survey assistants would call or e-mail them to remind them about the survey and ensure that they did not have any technical problems. It was important to ensure that respondents did not accumulate more than three days of activities and trips before submitting their answered questionnaires to ensure proper recall of their activity-travel attributes. Online data transmission enabled identification of respondents who were not regularly completing the survey and enabled consequent actions to avoid further problems. These actions would not be impossible if this survey was computer-based but not over the internet. The development of an automated system for recognition of failures in survey completion and generation of reminders/checkers is a potential future step in this survey. This capability would provide additional benefits for internet-based surveys and would reduce implementation costs. In 12 months, the efforts described in this section led to data collection on over 11,000 trips and activities performed by 112 respondents in the greater Chicago area. At this point, it becomes imperative to assess the quality of the data collected in order to evaluate the effectiveness of this study’s survey methodology and implementation strategies. This assessment on data quality is presented in the next section.

CHAPT T
demand travel sureliable dthereforefollowingrespondecollected
Tthese res65 years2,938 tripactivitiesshowing
F
TER 5 DA
The data collemodels. Bervey ultimatedemand mode designed to indicators:
ent burden, ad. The researchspondents w-old. They cps and 3,419. Figure 2 shgood covera
igure 2. Geo
ATA QUA
ected in a trecause a moely seeks to del. This proo ensure thetrip rate, no
and respond
h team survewere seniors collected det9 activities frhows the geage of the C
ographic dist
ALITY AS
avel survey odel’s quality
produce higoject’s survee highest daton-mobility radent fatigue
eyed 112 res- 65 years-o
tails about 2rom the younographic dis
Chicago metr
tribution of tr
20
SESSME
is primarily y is largely limgh quality daey instrumenta quality poate, responsand conditio
spondents livold or over -2,401 trips annger responstribution of tropolitan are
rips over cou
ENT
used to calibmited by theata that can bnt and implemossible. Thisse rate, samponing to asse
ving in 101 hand the oth
nd 2,622 actdents, totalitrips for whic
ea.
unty borders
brate and vae quality of itbe used to ementation prs section thuple bias, misess the qual
households. er 58 were btivities from ng 5,339 tripch data was
s in the Chic
alidate travelts input dataestimate a rocedures wus looks at thssing valueslity of the da
Fifty-four obetween 18 the seniors ps and 5,771 collected,
cago area.
l , any
were he s, ata
of and and 1

21
5.1 RESPONSE RATE Although a dataset’s overall quality cannot generally be assessed using only a single statistic, response rate is probably the first number looked at when analyzing survey quality. Despite the broad use of response rate as a quality indicator and term of comparison between data collection efforts, different studies have used different methodologies for computing this number. In this study, the response rate was calculated in conformity with the NCHRP (2008) recommendations. The formula adopted was that of the American Association of Public Opinion Research (AAPOR):
NCUOUHeORBPISR
SRARR
A 3
where RR3A = response rate SR = complete interview/questionnaire PI = partial interview/questionnaire RB = refusal and break-off NC = non-contact O = other UH = unknown if household occupied UO = unknown other eA = estimated proportion of cases of unknown eligibility that are eligible Table I shows how the survey team classified each response type to survey recruitment in order to enter into the above response rate calculation:
Table 1. Categorization of Labels for Response Rate Calculation Categories in RR3A formula
Label of cases
Elderly respondents
Non-elderly respondents
SR
One or more days of survey completed
54
58
PI Only upfront surveys completed 19 20RB Refusals and drop-outs 670 369NC No answers and answering machines 259 289O Multiple requests for call back, individual never
available after call back request 25 15
UH Fax lines 3 4UO Busy signal
1 2
The proportion of unknown eligibility cases which were eligible was estimated as the rate
of ineligible individuals to all contacted individuals. The research team attempted to call 1,996 households; 215 of which were considered ineligible because potential respondents in these households had poor health that did not allow travel or survey completion, were moving out of the study area, did not speak English, or could not be contacted because of wrong contact information. This proportion yields an estimated eA of 0.8923. The overall response rate, in terms of persons, was 6.48%, and in terms of households, 5.88%. This response rate is low when compared to traditional one or two-day pen-and-paper travel surveys, but is satisfactory for a more complex two-week GPS-based internet survey that requires a greater commitment from respondents. The cooperation rate, however, which is the

22
ratio of respondents to eligible persons contacted, was 10.66%. The response rate for elderly people was 5.37%, lower than that for non-elderly people, which was 8.04%. The cooperation rates were 7.91% and 15.76% for elderly and non-elderly people, respectively. This result is consistent with (Kurth et al., 2001), who found that households with elderly people have a higher refusal rate. The lower survey acceptance among older people is probably due to the survey being internet-based. In fact, the most common reason why elderly individuals refused to participate in this survey was the need to use a computer, even though a laptop with mobile broadband internet connection was offered to those without computer or internet access. Some elderly people are not familiar with computer technology and do not want to use it even if assisted. However, as years go by this problem should become less of an issue since the aging population will likely yield a higher proportion of elderly people that are computer literate. On the other hand, most of the younger individuals justified their refusal with lack of available time, though some elderly individuals also mentioned this reason for not participating in the survey. This problem affects all types of surveys and survey modes. The best improvement that can be made to avoid this reason for refusal is to reduce the survey burden, which is discussed later in this report. A few individuals, both elderly and non-elderly, refused to participate in the survey because they felt that full tracking of their activity-travel patterns was too invasive, even though they were informed that data is kept strictly confidential and unidentifiable. However, overall refusals for this reason were low. Some individuals accepted to participate in the survey but changed their mind when the assistants demonstrated the survey website and equipment, after having completed the upfront surveys. This happened in three cases. Other potential participants went through the whole equipment set up and training process, completed upfront surveys, stayed several days with the GPS logger but never completed an active survey day. Thirty-five of these cases occurred, out of which:
Ten cases were due to individuals getting frustrated with difficulties regarding the use of computers.
Five cases were due to individuals getting frustrated about technical problems with their computers (incompatibilities with the survey).
Fourteen cases were due to individuals changing their minds about participation on the survey, either for a personal reasons, such as lack of time or worsening health conditions, or observing the experience of another household member with the survey.
Six cases were drop outs due to unknown reasons, since the survey team was never able to contact these individuals since equipment delivery. These cases resulted in equipment loss.
All these cases were classified as partial participations, yielding a rate of 26% of partial participations. 5.2 DURATION OF PARTICIPATION IN THE SURVEY AND EARLY TERMINATIONS
The research team wanted each respondent to participate for 14 days. However, this number of days was fewer if respondents stayed at home for one or more days during the survey period. In some of these cases, respondents agreed to take the survey longer until they reached 14 days of collected travel data. In other cases, respondents did not wish to extend their participation. However, as in all surveys involving human subjects, respondents could opt of this survey at any time.
Some participants did not complete the survey (uploading activity-travel data and answering questionnaires) for 14 days for personal reasons since the daily amount of time necessary to complete the survey overwhelmed them; others had to leave the study area before the 14 days ended, particularly during the summer months. However, some respondents who demonstrated interest completed the survey for more than the originally proposed 14 days.
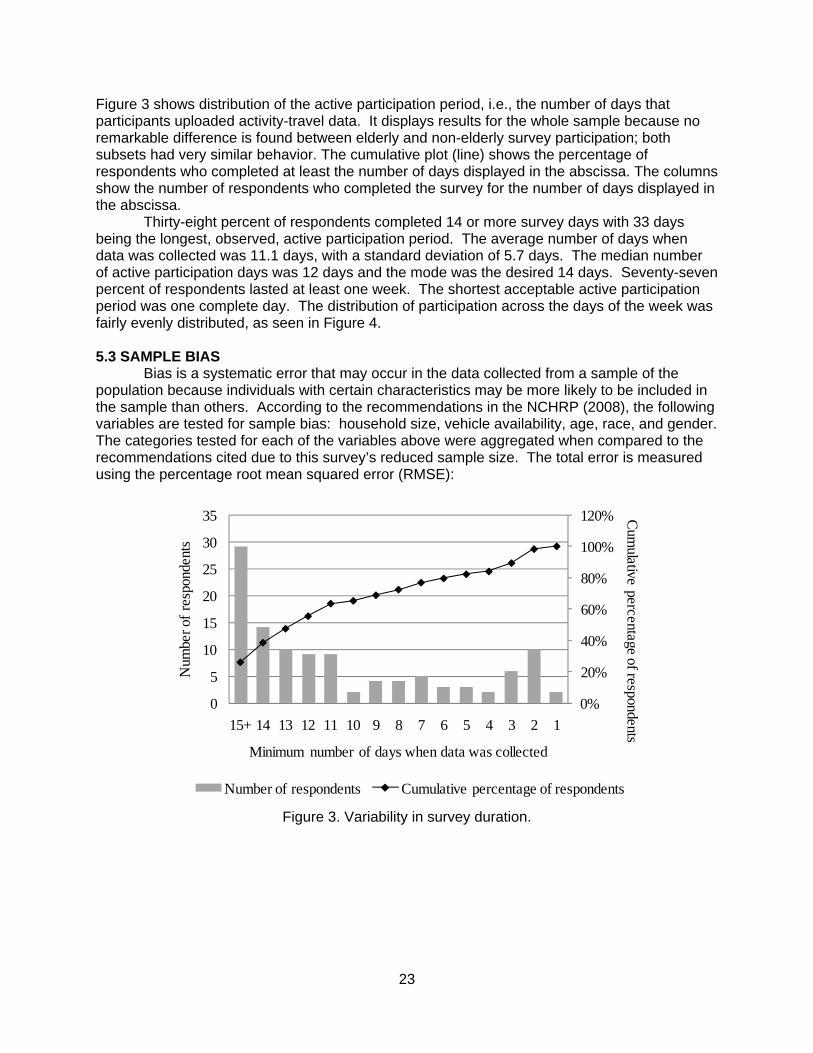
23
Figure 3 shows distribution of the active participation period, i.e., the number of days that participants uploaded activity-travel data. It displays results for the whole sample because no remarkable difference is found between elderly and non-elderly survey participation; both subsets had very similar behavior. The cumulative plot (line) shows the percentage of respondents who completed at least the number of days displayed in the abscissa. The columns show the number of respondents who completed the survey for the number of days displayed in the abscissa.
Thirty-eight percent of respondents completed 14 or more survey days with 33 days being the longest, observed, active participation period. The average number of days when data was collected was 11.1 days, with a standard deviation of 5.7 days. The median number of active participation days was 12 days and the mode was the desired 14 days. Seventy-seven percent of respondents lasted at least one week. The shortest acceptable active participation period was one complete day. The distribution of participation across the days of the week was fairly evenly distributed, as seen in Figure 4. 5.3 SAMPLE BIAS
Bias is a systematic error that may occur in the data collected from a sample of the population because individuals with certain characteristics may be more likely to be included in the sample than others. According to the recommendations in the NCHRP (2008), the following variables are tested for sample bias: household size, vehicle availability, age, race, and gender. The categories tested for each of the variables above were aggregated when compared to the recommendations cited due to this survey’s reduced sample size. The total error is measured using the percentage root mean squared error (RMSE):
Figure 3. Variability in survey duration.
0%
20%
40%
60%
80%
100%
120%
0
5
10
15
20
25
30
35
15+ 14 13 12 11 10 9 8 7 6 5 4 3 2 1
Cum
ulative percentage of respondentsN
umbe
r of
resp
onde
nts
Minimum number of days when data was collected
Number of respondents Cumulative percentage of respondents
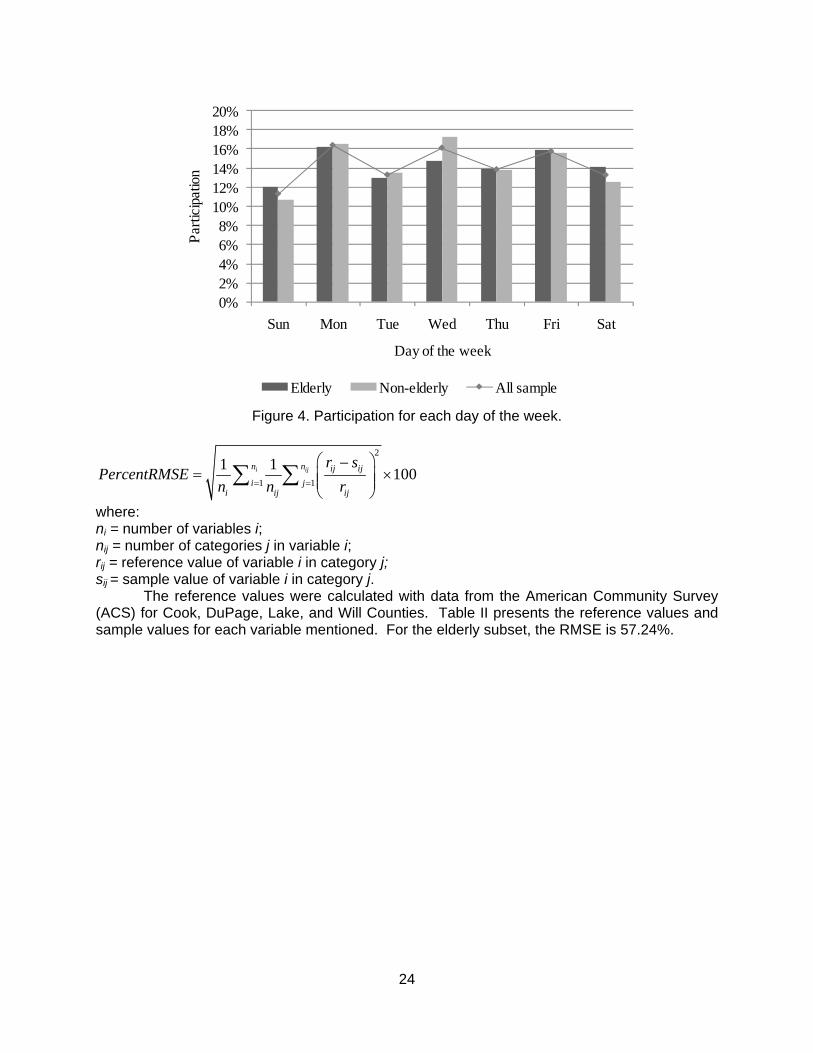
24
Figure 4. Participation for each day of the week.
2
1 1
1 1100i ijn n ij ij
i ji ij ij
r sPercentRMSE
n n r
where: ni = number of variables i; nij = number of categories j in variable i; rij = reference value of variable i in category j; sij = sample value of variable i in category j.
The reference values were calculated with data from the American Community Survey (ACS) for Cook, DuPage, Lake, and Will Counties. Table II presents the reference values and sample values for each variable mentioned. For the elderly subset, the RMSE is 57.24%.
0%2%4%6%8%
10%12%14%16%18%20%
Sun Mon Tue Wed Thu Fri Sat
Par
ticip
atio
n
Day of the week
Elderly Non-elderly All sample
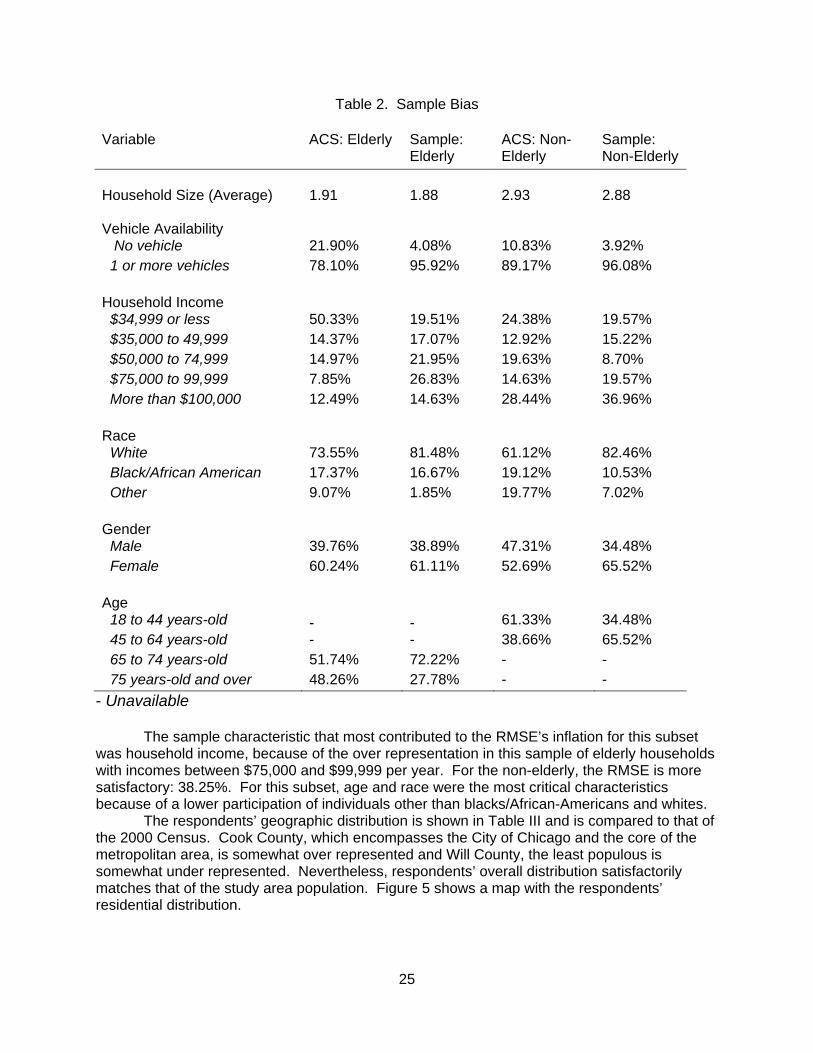
25
Table 2. Sample Bias
Variable ACS: Elderly Sample: Elderly
ACS: Non-Elderly
Sample: Non-Elderly
Household Size (Average) 1.91 1.88 2.93 2.88 Vehicle Availability No vehicle 21.90% 4.08% 10.83% 3.92% 1 or more vehicles 78.10% 95.92% 89.17% 96.08% Household Income $34,999 or less 50.33% 19.51% 24.38% 19.57% $35,000 to 49,999 14.37% 17.07% 12.92% 15.22% $50,000 to 74,999 14.97% 21.95% 19.63% 8.70% $75,000 to 99,999 7.85% 26.83% 14.63% 19.57% More than $100,000 12.49% 14.63% 28.44% 36.96% Race White 73.55% 81.48% 61.12% 82.46% Black/African American 17.37% 16.67% 19.12% 10.53% Other 9.07% 1.85% 19.77% 7.02% Gender Male 39.76% 38.89% 47.31% 34.48% Female 60.24% 61.11% 52.69% 65.52% Age 18 to 44 years-old - - 61.33% 34.48% 45 to 64 years-old - - 38.66% 65.52% 65 to 74 years-old 51.74% 72.22% - - 75 years-old and over 48.26% 27.78% - -
- Unavailable The sample characteristic that most contributed to the RMSE’s inflation for this subset
was household income, because of the over representation in this sample of elderly households with incomes between $75,000 and $99,999 per year. For the non-elderly, the RMSE is more satisfactory: 38.25%. For this subset, age and race were the most critical characteristics because of a lower participation of individuals other than blacks/African-Americans and whites.
The respondents’ geographic distribution is shown in Table III and is compared to that of the 2000 Census. Cook County, which encompasses the City of Chicago and the core of the metropolitan area, is somewhat over represented and Will County, the least populous is somewhat under represented. Nevertheless, respondents’ overall distribution satisfactorily matches that of the study area population. Figure 5 shows a map with the respondents’ residential distribution.

County Cook DuPage Lake Will Total
5.3.1 Mis
TThe activ
McH
Number oElderly Respondes: Survey
43
7
3
1
54
Figure
ssing ValueThe socio-devity question
Henry
Du
W
Table 3.
of
ent
Distribof EldeRespos: Surv
79.63%
12.96%
5.56%
1.85%
100.00
5. Geogra
es mographic pnaire had a
Lake
uPage Coo
Will
Geographic
bution erly ondentvey
Disn oEldPon: C
% 72
% 12
% 8.6
% 6.7
0% 100
phical distr
part of this sminimum of
ok
Po
26
c Distribution
stributioof derly opulatioCensus
NNRs:
.39% 46
.17% 7
68% 4
76% 1
0.00% 58
ibution of re
urvey contaf six question
M
orter, IN
n of Respond
umber of on-Elderly
Respondent: Survey
6
8
espondents
ined 25 quens and a ma
Lake
Michigan
dents
Distributioof Non-Elderly Respondes: Survey
79.31%
12.07%
6.90%
1.72%
100.00%
s' househol
stions for eaaximum of 13
on
ent
Distribn of NoElderlyPopulan: Cen 72.39%
12.17%
8.68%
6.76%
100.00
lds.
ach respond3. The actu
butioon-y ationsus
%
%
%
%
0%
ent. al

27
number of questions varied depending on the answers chosen. For example, if the person chose activity type “working at home,” the questions about location and people involved were hidden because the location is already known from the previous answer (home) and the details of in-home activities are beyond this study’s scope. The trip questionnaire had a minimum of six questions and a maximum of 11. In the same manner as the activity questionnaire, the number of questions varied depending on the answers. If one answered bus as the travel mode, for example, a question regarding fares would appear, while if the answer was walk, no further questions were asked.
The possibility of showing respondents only the questions that were pertinent to their previous answers made completing the questionnaire simpler, thus reducing the number of non-answered questions because respondents did not see them. Also, the use of pop-up windows warned respondents about blank answers, which likely resulted in a significant reduction of missing values in the survey. However, the survey team could not assess missing values for routine activities and the planning day parts of this survey because they could not distinguish missing values from cases where respondents had not fully elaborated plans or routine activities. These parts were therefore excluded from the missing value index calculation. Out of a total of 80,587 applicable questions, the survey had 3,707 refusals and 404 "Do not know" answers. Calculating the missing value index (MVI) accordingly to the recommendations in NCHRP (2008), the MVI for this survey is 0.0510. Questions about the decision making process had the highest non-response rates, including when decisions were made regarding activity duration and start time and the flexibility of those decisions. This likely shows that questions about the decision-making process are somewhat more difficult for respondents to answer than those which refer to more explicit aspects of travel and activity patterns, such as travel modes, activity type, and accompanying persons. Since individuals are not accustomed to thinking about their decision making process, answering questions such as "When did you decide on the activity duration?" or "How flexible was the activity start time?" requires more mental effort than stating which travel mode was used on a trip. As respondents became accustomed to thinking about their decision-making processes, answering these questions became easier. As one respondent stated during the exit interview: "The longer I used it (the survey), the easier it got." 5.3.2 Trip Rate Trip rate is one of the most commonly used indicators for data quality. The overall trip rate found in the collected data was 3.92 trips per person per day. The suggested reference trip rate for personal travel in NCHRP (2008) is 3.4 trips per person per day, therefore an above average number of trips were reported when compared to the reference. This result is consistent with the finding of previous studies which demonstrate that GPS surveys have improved ability to capture trips which are frequently under-reported in other survey types. It also suggests satisfactory data quality. Within the elderly subset, the trip rate was 3.77 trips per person per day, and within the younger respondents, the trip rate was 4.06. This difference is expected, but not nearly as large as the difference of 1.0 trip per day found by Collia et al., 2003 in the NHTS 2001. 5.3.3 Non-Mobility Rate
In any travel survey, it is possible that respondents do not travel for a whole day, and this is important information for transportation planners. However, it is also possible that respondents used non-mobility as a form of alleviating survey burden, because it is always faster to declare no travel than the actual activities/trips. Therefore, the proper reporting of non-mobility is crucial for data quality.
In this survey, respondents were asked to distinguish their non-mobility days from those days when the survey was not completed for other reasons. The research team did not ask

28
them why they did not complete the survey because it might make them feel uncomfortable or push them into reporting false non-mobility. In this way, the research team could achieve a more accurate estimation of non-mobility, since days reported as "not completed for a reason different than staying at home all day" were not erroneously added into the non-mobility rate calculations. The overall non-mobility rate observed in the data was 11.10%, lower than the typical rate found in past studies (NCHRP, 2008), despite the large amount of elderly in the sample, who tend to have higher non-mobility rates. The non-mobility rate for this survey’s elderly respondents was 13.67% and 8.84% for the younger respondents. The latter result falls in the range suggested as accurate in Madre et al., 2007, 8% to 12%. This result is similar to other long duration surveys, such as the seven-day German Mobility Panel (Kuhnimhof et al., 2006) and the six-week Mobidrive (Axhausen et al., 2004), which are considered to have accurate non-mobility levels (Madre et al., 2007), suggesting overall good data quality. The non-mobility rate for the elderly respondents falls a small amount above the range proposed by Madre et al., 2007; however, this range was conceived for the general population, not for a specific age group. The difference in non-mobility rates between the older and younger subsets is considerable, and expected, since older individuals are frequently less active than younger individuals. 5.3.4 Evaluation of Respondent Burden
The average time respondents spent to confirm and correct their estimated activity-travel patterns was 4 minutes 35 seconds per day, with a standard deviation of 2 minutes 36 seconds. Besides reflecting the natural variability on the number of trips and activities that could possibly be corrected from one log to another, GPS recordings demanded more or less corrections depending on the density of the area where the activities occurred. The average time spent to answer a questionnaire page for one activity was 1 minute 49 seconds and for one trip, 1 minute 18 seconds. Standard deviations were 44 and 36 seconds for activities and trip pages, respectively. Because respondents could perform other activities while filling in the survey, only the values belonging to the 85th percentile were used to calculate these averages. Considering a day with an average number of trips and activities, survey completion took between 10 and 27 minutes. This considerable variation is most likely due to differences in internet connection speeds and respondent’s agility with computers. The research team also estimates that respondents spent several minutes each day connecting the device to the computer, uploading the log, and changing device batteries. At the end of the survey, respondents were asked to fill out a short evaluation about their overall experience with the survey. This form contained seven Likert-type questions relating to the survey’s difficulty and two yes or no questions. The scale for the Likert-items had five values, ranging from strongly disagree to strongly agree. It also had a space for comments about the survey. In this evaluation, about 42% of the respondents classified the survey as difficult to complete. For the elderly subset, however, 46% of respondents disagreed that the survey was difficult, and for the non-elderly, 60% shared the same opinion. About 66% of respondents considered that the daily time required to complete the survey was too long, while 23% considered it not too long. Among the non-elderly, the feeling that the survey required a long time was stronger than among the elderly. This is consistent with the fact that many of the elderly participants are retired and therefore did not have as much time pressure as full-time workers and students. On the other hand, 59% of the respondents did not believe that the participation period of 14 days was too long and only 17% of respondents thought it was. The remaining 24% were neutral about this topic. This result indicates that GPS-based prompted recall surveys over the internet have a tremendous potential for long-term applications. Since the daily time necessary to complete this survey was one of the largest sources of respondent dissatisfaction,

29
respondent burden can be significantly reduced by shortening the daily length of the survey and thus keeping the survey period at two weeks. Data mining techniques such as sequential associative mining can help to decrease the questionnaires’ length without losing important data through both auto-populating likely answers and selectively removing questions that can be inferred with a high degree of confidence (Auld et al., 2009). While many attributes can be populated with reasonable confidence based on patterns commonly observed across all travelers, one of the advantages of a long-term survey is the opportunity to tailor the predictions to the individual. Thanks to the lengthier observation period, as the survey progresses a model can be built that better reflects the patterns of that individual. A more specialized model is likely to result in higher confidence in predictions and better coverage of the number of fields that can be auto-populated. In a long-term survey with sufficient time to build a reliable model of the individual, machine learning can provide significant reductions in respondent burden (Williams et al., 2009). 5.3.5 Assessment of Survey Fatigue and Conditioning
Key concerns for extended duration surveys are fatigue and conditioning. Survey fatigue occurs when respondents get saturated with survey burden and stop completing the survey tasks with the necessary commitment. Indicators of the presence of survey fatigue in a data set are activity and trip rate decline, inconsistent answers and increase in item non-response over the course of the survey. The biases introduced in the data due to survey fatigue have raised concerns among researchers as early as the 1970’s (Szalai, 1972). At that time, when travel surveys were conducted through the use of a pen-and-paper diary, the main evidences of survey fatigue were decreased reporting of short walk trips and increased reporting of immobile days through the course of the survey (Golob and Meurs, 1986). These problems, though, should be overcome, if not entirely, then mostly, with the use of GPS surveying. The second issue, survey conditioning, is related to the influence that the survey itself may have on respondents’ behavior. For example, respondents may find opportunities to optimize their schedule by reflecting about their activity-travel patterns while answering the survey questions or may change their scheduling behavior upon realizing the amount of unplanned activities performed daily. In the same manner, seeing trips on a map might induce respondents to reroute their travel to shorter paths. The assessment of both of these issues is usually made by examining the trip/activity rates over the survey duration (Doherty et al., 2000; Axhausen et al., 2007). Figure 6A shows the average activity participation rate over the duration of all respondents’ survey participation. In this same figure, one can see the average time spent to answer one activity questionnaire page. Figure 6B shows the same information for trip episodes.

30
A B
C D
E F Figure 6. Analysis of survey fatigue and conditioning: A. Activity responses characteristics; B.
Trip responses characteristics; C. Missing value index; D. Activity type; E. Activity planning horizon; F. Travel time and distance.
y = -0.0276x + 2.0223
y = -0.0062x + 4.665
0
1
2
3
4
5
6
1.5
1.7
1.9
2.1
2.3
2.5
2.7
2.9
1 2 3 4 5 6 7 8 9 10 11 12 13 14
number of activities per person
min
utes
Survey Day
Activity Response Characteristics over Duration of Survey
Avg. Answer Duration per Event (min)Avg. Number of Activities per Person
y = -0.0174x + 1.3923
y = -0.0056x + 4.713
0
1
2
3
4
5
6
1.1
1.2
1.3
1.4
1.5
1 2 3 4 5 6 7 8 9 10 11 12 13 14
number of trips per person
min
utes
Survey Day
Trip Response Characteristics over Duration of Survey
Avg. Answer Duration per Event (min)Avg. Number of Trips per Person
y = -0.0022x + 0.0686
0%
2%
4%
6%
8%
10%
1 2 3 4 5 6 7 8 9 10 11 12 13 14
Survey Day
Missing Value Index over Duration of Survey
Missing Value Index
y = 0.0021x + 0.2911
y = 0.0005x + 0.5857
y = -0.0026x + 0.1231
0%
10%
20%
30%
40%
50%
60%
70%
1 2 3 4 5 6 7 8 9 10 11 12 13 14Survey Day
Activity Type over Duration of Survey
Home Other Work/School
y = -0.005x + 0.2467
y = -0.0006x + 0.3209
y = 0.0056x + 0.4324
10%
20%
30%
40%
50%
60%
1 2 3 4 5 6 7 8 9 10 11 12 13 14Survey Day
Activity Planning Horizon over Duration of Survey
Preplanned Routine Same Day
y = -0.0055x + 15.148
y = -0.0462x + 11.19
0246810121416
12
14
16
18
20
1 2 3 4 5 6 7 8 9 10 11 12 13 14
kilometers
min
utes
Survey Day
Travel Time and Distance over Duration of Survey
Avg. Travel Time Avg. Travel Distance

31
The average time spent answering each activity questionnaire page decreased 2.8 seconds per day, while the average number of activities reported per person decreased only by 0.06 per day (a result skewed somewhat by an inordinately high average number of activities completed on the third day across all respondents). The average number of trips over the duration of the survey decreased at approximately the same rate as the average number of activities, however, the time spent answering trip questionnaires decreased at a slower rate, 1.7 seconds per day. Figure 6C shows that the missing value index for each day declined an average of 2.2% over the course of the survey, which reveals that the reduction in time spent answering the survey was not due to skipping questions. Figures 6D and 6E present the evolution of activity type and activity planning horizon distributions over the participation duration of the survey, which had an average change of less than 0.6% per day, indicating that answers remained consistent throughout the 14 days. Figure 6F shows the evolution of travel time and distance, which also remained fairly stable over the duration of the survey. These results show that the effects of fatigue and conditioning were likely minimal in this survey since no additional questions were skipped and no obvious changes occurred in the activity-travel pattern variable distributions over the duration of the survey. After assessing the quality of data, and determining that the data is of high quality with no obvious biases or fatigue and conditioning issues, the data was used to evaluate the activity-travel behavior of elderly and non-elderly individuals, as shown in the following section.
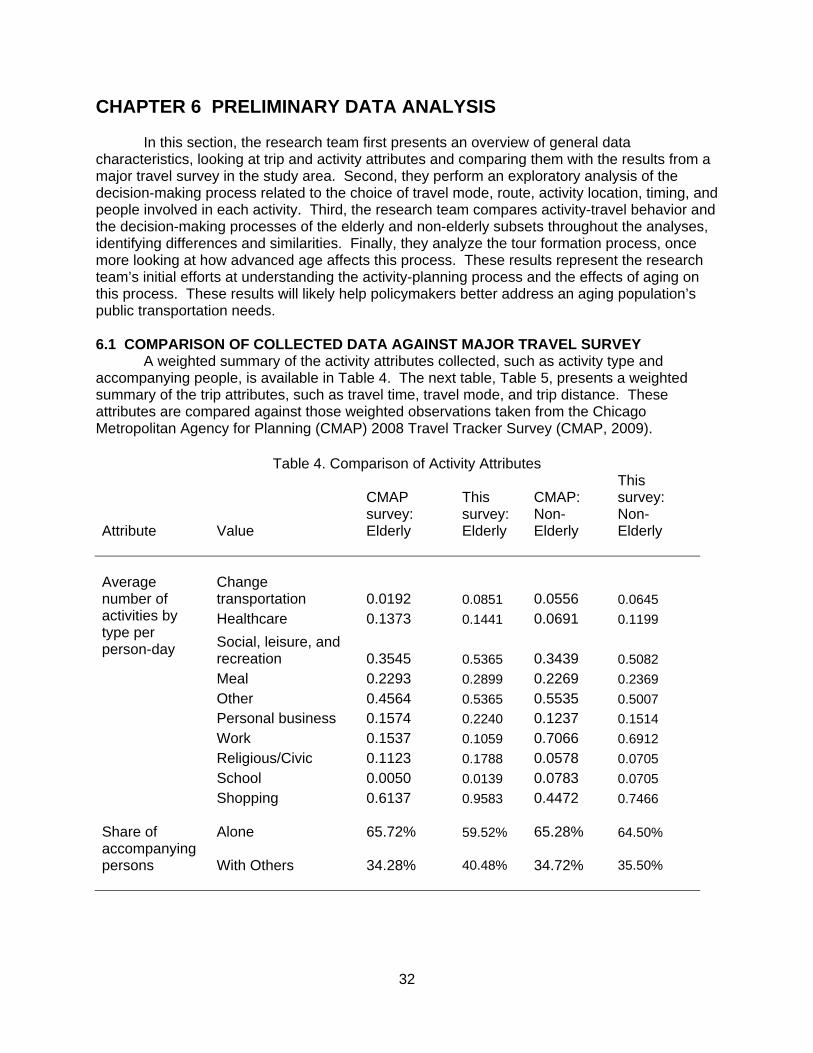
32
CHAPTER 6 PRELIMINARY DATA ANALYSIS In this section, the research team first presents an overview of general data
characteristics, looking at trip and activity attributes and comparing them with the results from a major travel survey in the study area. Second, they perform an exploratory analysis of the decision-making process related to the choice of travel mode, route, activity location, timing, and people involved in each activity. Third, the research team compares activity-travel behavior and the decision-making processes of the elderly and non-elderly subsets throughout the analyses, identifying differences and similarities. Finally, they analyze the tour formation process, once more looking at how advanced age affects this process. These results represent the research team’s initial efforts at understanding the activity-planning process and the effects of aging on this process. These results will likely help policymakers better address an aging population’s public transportation needs. 6.1 COMPARISON OF COLLECTED DATA AGAINST MAJOR TRAVEL SURVEY
A weighted summary of the activity attributes collected, such as activity type and accompanying people, is available in Table 4. The next table, Table 5, presents a weighted summary of the trip attributes, such as travel time, travel mode, and trip distance. These attributes are compared against those weighted observations taken from the Chicago Metropolitan Agency for Planning (CMAP) 2008 Travel Tracker Survey (CMAP, 2009).
Table 4. Comparison of Activity Attributes
Attribute
Value
CMAP survey: Elderly
This survey: Elderly
CMAP: Non-Elderly
This survey: Non-Elderly
Average number of activities by type per person-day
Change transportation 0.0192 0.0851 0.0556 0.0645Healthcare 0.1373 0.1441 0.0691 0.1199
Social, leisure, and recreation 0.3545 0.5365 0.3439 0.5082Meal 0.2293 0.2899 0.2269 0.2369Other 0.4564 0.5365 0.5535 0.5007Personal business 0.1574 0.2240 0.1237 0.1514Work 0.1537 0.1059 0.7066 0.6912Religious/Civic 0.1123 0.1788 0.0578 0.0705School 0.0050 0.0139 0.0783 0.0705Shopping 0.6137 0.9583 0.4472 0.7466
Share of accompanying persons
Alone 65.72% 59.52% 65.28% 64.50%
With Others 34.28% 40.48% 34.72% 35.50%

33
Table 5. Comparison of Trip Attributes
Attribute
Value
CMAP: Elderly
This survey: Elderly
CMAP: Non-Elderly
This survey: Non-Elderly
Share of Travel Mode
Auto drive 71.38% 75.97% 72.21% 81.01%Auto passenger 16.91% 12.45% 10.32% 9.63%Bicycle 0.41% 0.33% 1.03% 0.34%Bus 1.89% 4.37% 1.93% 1.33%Commuter rail 0.38% 0.62% 1.80% 0.88%Light rail 0.29% 0.67% 1.57% 0.71%Walk 7.29% 5.29% 9.47% 5.24%Other
1.46%
0.29%
1.66%
0.85%
Share of Trip Duration
1 to 15 minutes 64.21% 71.62% 59.66% 67.09%15 to 30 minutes 22.30% 17.89% 22.07% 21.05%30 to 45 minutes 6.35% 6.70% 8.24% 7.83%45 to 60 minutes 3.36% 1.78% 4.88% 2.05%More than 60 minutes
3.78%
2.01% 5.15%
1.98%
Share of Daily Travel Time
0 to 30 minutes 37.37% 40.80% 20.03% 32.92%30 to 60 minutes 19.57% 26.78% 18.53% 29.00%60 to 120 minutes 25.09% 23.13% 33.88% 27.12%More than 120 minutes
17.97%
9.29% 27.56%
10.97%
Share of Trip Distance
0 to 5 kilometers 56.92% 50.86% 48.59% 44.44%5 to 10 kilometers 20.46% 21.57% 18.40% 21.70%10 to 20 kilometers 13.31% 16.27% 15.92% 17.39%20 to 30 kilometers 4.48% 5.59% 6.94% 6.88%30 to 50 kilometers 2.88% 3.88% 6.69% 6.26%More than 50 kilometers
1.94% 1.84%
3.45% 3.32%
Share of Average Speed for Automobile Trips
0 to 30 km/h 64.42% 11.83% 56.14% 12.00%30 to 60 km/h 29.66% 72.03% 35.73% 66.94%60 to 90 km/h 4.58% 13.91% 6.38% 18.11%
More than 90 km/h
1.34%2.24%
1.75%2.95%
Share of Average Speed for Bus Trips
0 to 30 km/h 73.69% 60.76% 84.10% 30.00%
30 to 60 km/h 21.44% 39.24% 14.27% 70.00%
CMAP’s Travel Tracker Survey was a multimode, one or two day household travel and activity survey conducted on 10,552 households in the Chicago metropolitan area. CMAP used
34
a computer assisted telephone interview (CATI) as the primary data collection mode for this survey. They also had 50 households take a prompted recall survey using GPS devices as part of this larger project. Thirty-three of them took this survey using in-vehicle GPS devices and 17 used GPS personal devices (NuStats and GeoStats, 2008). Accounting for all survey modes, over 23,000 individuals participated in Travel Tracker, out of which 4,315 were ages 65 and over.
The Travel Tracker data was weighted using household-based weights provided in CMAP’s public dataset (CMAP, 2009). For the dataset presented in this report, weights were calculated with iterative proportional fitting (IPF) for binary classifications of gender (male or female), age (65 and older, or younger), household income (greater or lesser than $60,000 per year) and household size (1 and 2 persons, or more). These calculations were based on the Census Public Use Microdata Sample (PUMS) weighted data for the Chicago region.
Table 4 displays the daily average number of activities by type per person and the percentages of activities which were performed alone or with others. Table V displays the shares of travel mode, trip duration, average daily travel time, trip distance, and average speed for automobile and bus trips. Both tables show results for the elderly and non-elderly subsets. The trip distance available on the Travel Tracker Survey is the straight line distance from one activity to the next, while the trip distance recorded at the GPS survey is the real distance traveled. To account for this difference, the reference values for trip distance displayed in Table V were increased by 20% to estimate the real distance travelled (Newell, 1980). Average speeds were calculated as trip distance (estimated real trip for CMAP survey) divided by travel time. Table 4 shows that respondents reported a higher activity rate per person-day for almost all activity types. Noticeably, at least 50% more shopping activities were reported in this survey than in the reference. The automated recording and detection of activities made possible the inclusion of more minor shopping activities, such as stopping on the way and buying a drink at a convenience store, for example, which are frequently underreported in diary-type surveys. Similarly, this same effect occurred for “change transportation” activities which are usually short activities that people tend to think are unimportant. The automated recording and detection of activities allowed them to be recorded more frequently. The automated survey mode thus yielded a much higher rate for these types of activities than those observed in the Travel Tracker Survey. Social/leisure/recreation and, specifically for the elderly, civic and religious activities were also observed at a much higher rate here. Work activities, however, were observed at a lower rate for elderly people in this survey. This may be partially caused by this survey’s continuous data collection throughout the week and weekend, compared to that of the Travel Tracker survey, which focused more on weekday data collection, although weekend data was also collected. This survey captured a higher frequency of activities performed with other individuals than the Travel Tracker and a higher proportion of auto-drive trips. This survey also registered slightly more short duration trips and a comparable share of short distance trips. Even though the trip rate obtained here is higher, the total daily travel time is lower overall, especially for younger travelers. This corroborates the finding of (Batelle, 1997) that traditional surveys overestimate travel time. Since the CMAP survey’s average speed calculations were based on self-reported travel times, the distribution of average automobile and bus speeds are significantly higher in this survey. These results corroborate suspicions that self-reported surveys overstate travel time and provide another indication of the improved activity/trip reporting achieved with the use of GPS technology. Non-weighted versions of Tables IV and V yield very similar results and the same conclusions.

35
6.2 DECISION-MAKING PROCESS ANALYSIS
The decision-making process data collected in this survey is preliminarily analyzed in this section. The questions in this survey were designed with a special interest in scheduling process data. The research team asked respondents when they started planning their activities, trips, and respective attributes. This time period between the first consideration of activities, trips and their attributes, and execution of the final decision is referred to as a planning horizon. The research team asked respondents how flexible they were on activity locations, start times, durations, and people involved. Flexibilities and planning horizons will be later used for calibrating and validating the ADAPTS scheduling model (Auld and Mohammadian, 2009). 6.2.1 Activities
Routine, impulsive, and same day decisions dominated decisions to engage in activities made relative to their actual start. These decisions are also called activity planning horizons. For the non-elderly group, routine decisions were the most common, accounting for 35.8% of all decisions to engage in an activity. Following routine activities were the impulsive activities, those decided less than one hour before the start of the activity, accounting for 24.6% of all activities. In third place came the activities which were decided upon the same day as they were performed. Around 46% of all activities conducted had planning horizons shorter than one full day, that is, their execution was first conceived the same day they occurred.
Figure 7 shows that elderly peoples’ activity planning horizons are somewhat different than those of their younger counterparts. Among the elderly, routine, impulsive, and same day decisions were still the top three, but the order in which they appear were different. The most common planning horizon for elderly people was still routine (26.9%), closely followed, however, by same day (25.5%). The lower share of routine activities among elderly people demonstrates that since many elderly are retired, they have less of a routine to follow, although routine activities are still a significant proportion of activities performed. The proportion of routine activities among elderly people is about 25% less than among non-elderly people, and the types of activities that are routine for elderly people are intrinsically different. While work represents 52.8% of all out-of-home routine activities for non-elderly people, routine activities for elderly people are much more diverse. Work has a small share of 12.8%, and approximately 48.0% of routine activities are civic/religious, recreational, leisure/entertainment, or other types not contemplated on the multiple choice answer. This shows that in the absence of activities which constitute traditional “mandatory” daily activities, i.e. work, school, etc., new routines develop which include a more diverse set of activities.
Impulsive decisions were the third most common for older individuals; however, at 21.4% of all decisions, they were about 15% less frequent among elderly people than among non-elderly people. On the other hand, elderly people showed a greater tendency to plan their activities than their younger counterparts. Elderly people planned approximately 51.7% of their activities, while non-elderly people planned only 39.6% of their activities. For longer term planning, the difference is even more notable; while seniors planned 9.1% of their activities more than one week in advance, and non-seniors planned only 6.0% of their activities that far in advance.

36
Figure 7. Activity planning horizon.
These results show that elderly people are less prone to spur of the moment decisions
and much more likely to plan their activities, especially when it comes to longer term planning. This characteristic of elderly travel behavior favors public transportation use because it lets these people coordinate their activity schedules ahead of time and travel. It also indicates that on demand services where users have to schedule services ahead of time would fit more than half of the respondents’ out-of-home activities. Transportation planners may thus take advantage of this characteristic when thinking of using transit strategies to better serve older individuals. It is interesting to analyze how different activity types have different planning horizons and how differences in age affect decision making behavior. Figure 8 shows the type of decisions the elderly and non-elderly subgroups took regarding each activity type. All the preplanned decisions (i.e. not routine or impulsive) are aggregated for ease of visualization. Table XIV, Appendix B presents a detailed table with disaggregated preplanned decisions (same day, previous day, same week, or more than one week before) and the absolute number of activities in each category.
0%5%
10%15%20%25%30%35%40%
More than 1 week
Same week
One day before
Same day Less than 1 hr
before
Routine Dont know
Elderly Non-elderly

37
0%
10%
20%
30%
40%
50%
60%
70%
80%
90%
100%
Eld
erly
Non
-eld
erly
Eld
erly
Non
-eld
erl y
Eld
erly
Non
-eld
erly
Eld
erl y
Non
-eld
erly
Eld
erly
Non
-eld
erl y
Eld
erly
Non
-eld
erly
Eld
erl y
Non
-eld
erly
Eld
erly
Non
-eld
erl y
Eld
erly
Non
-eld
erly
Eld
erly
Non
-eld
erly
Eld
erly
Non
-eld
erly
Eld
erly
Non
-eld
erl y
Eld
erly
Non
-eld
erly
Eld
erl y
Non
-eld
erly
Eld
erly
Non
-eld
erl y
Eld
erly
Non
-eld
erly
Eld
erl y
Non
-eld
erly
Eld
erly
Non
-eld
erl y
Eld
erly
Non
-eld
erly
Eld
erly
Non
-eld
erly
1 2 3 4 5 6 7 8 9 10 11 12 13 14 15 16 17 18 19 20
Routine Impulsive Preplanned
Figure 8. Planning horizon by activity type.
1 Changing
Transportation
2 Healthcare
3 Household
Errands
4 Leisure/
Entertainment
5 Meal
6 Other
7 Personal Business
8 Pick‐up/Drop‐off
9 Primary Work
10 Recreation
11 Religious/Civic

38
Both cohorts have similar behavior about work and educational activities when they made their decisions, with regular work and school activities being largely routine and work-business activities (i.e. meeting clients, work related errands, etc.) almost entirely preplanned since they are usually coordinated with others. The same applies to health care activities, where most activities were planned more than one week before execution was observed. However, leisure/entertainment activities and eating meals outside of the home were more routine, but mostly preplanned for elderly people than for non-elderly people. Twenty-seven percent of all elderly leisure/entertainment activities were planned more than one week before the event, while only 17% of these activities for non-elderly people had such a long planning horizon. Elderly people also tend to pre-plan volunteer work, household errands, and pick-up/drop-off activities, while their younger counterparts often routinely or impulsively perform them. For non-elderly people, shopping is largely impulsive, but for elderly people, shopping was more frequently planned at least earlier in the day. However, contrary to all other types of shopping, non-elderly people planned major item shopping more often than their elderly counterparts, possibly because of financial constraints. Elderly people, who do not often financially support others, might face fewer financial constraints. 6.2.1.1 Location
Besides studying planning horizons, the research team also analyzed planning horizons for various attributes and the perceived flexibilities constraining those decisions, starting with location choice. Elderly and younger people have similar flexibilities when considering location choices. Both elderly and younger people stated that their activities occurred over 80% of the time at the only location they considered (see Figure 9 below).
Figure 9. Number of activity locations considered.
Between 10% and 15% of the time, respondents’ activities could have occurred in two to three different locations. Only about 2% of these activities could have been performed in more than three different locations, which indicates that individuals, regardless of age, perceive themselves to be very inflexible when choosing their activity locations and often do not consider alternatives for conducting their activities. This finding is confirmed by the fact that over 45% of activity location decisions were routine and approximately 25%-30% were made along with decisions whether to engage in the activity (see Figure 10). Therefore, individuals often strongly linked the execution of an activity to a specific location, indicating that the thought “I need to buy groceries” might frequently mean the same as “I need to go to grocery store X.” Notice,
0%
20%
40%
60%
80%
100%
One Several Many
Elderly Non-elderly

39
however that this result only represents “perceived” flexibility of location choice decisions, since it could also indicate the result of sub-conscious preplanning processes or after the fact rationalizations (e.g. “it fit in my schedule and was on my way, so it was the only available location”) regardless of whether feasible alternatives actually existed. The length of this survey fortunately allowed the research team to directly observe actual flexibilities that were considered for different locations for the same activity class to correct this.
Elderly and non-elderly people show approximately the same trend concerning the length of their decision-making processes about location choice. However, non-elderly people make fewer same day decisions, are slightly more inflexible about location choice, and more routinely and impulsively choose their activity locations than elderly people (see Figure 10). It is instructive to look at location flexibility by activity type as seen in Figure 11. Table XV, Appendix B also graphically provides more detailed information, including the absolute number of activities by type and location flexibility. The types of activities that were most flexible on location choice were similar for both age groups. Shopping activities in general, recreational activities, and eating meals outside of the home were the most flexible for younger and older respondents. Household errands and healthcare, however, were considerably less flexible for the younger respondents. Work and school (as expected), activities requiring pick-up/drop-off, healthcare, volunteer work, and social activities were the least flexible.
A
0%
10%
20%
30%
40%
50%
60%
More than 1 week before
Same week One day before
Same day Less than 1 hr before
Routine Do not know
Elderly
Same planning horizon as activity
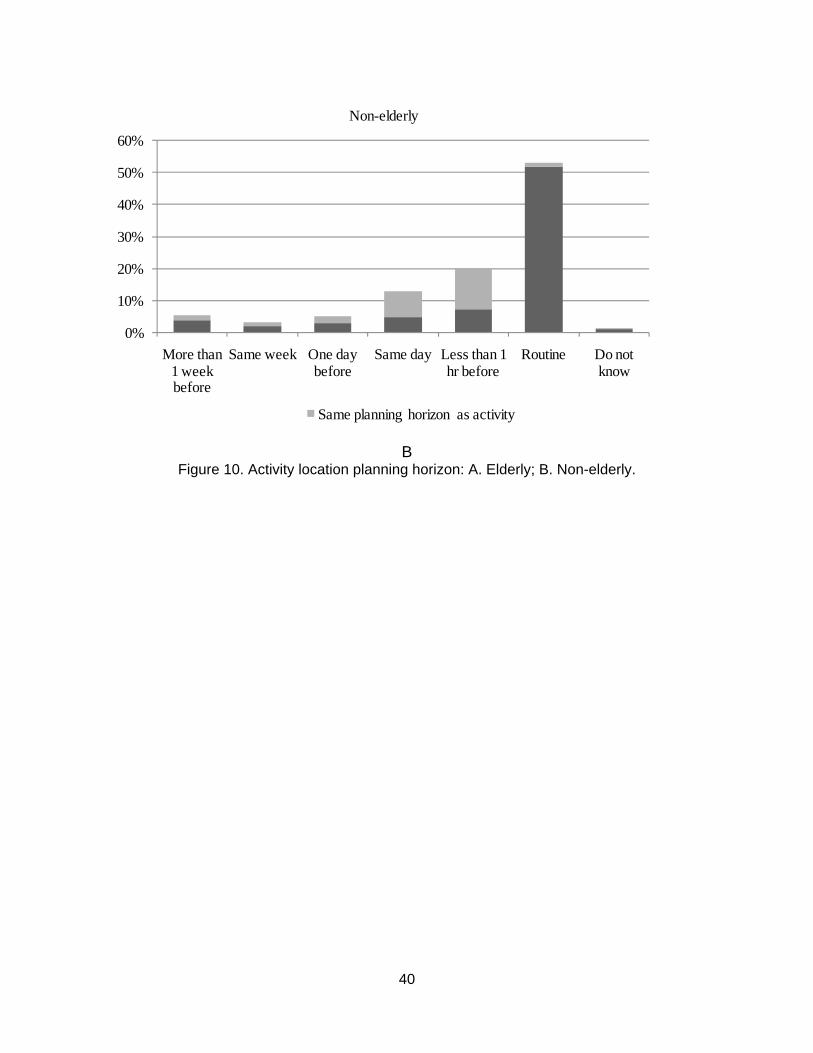
40
B
Figure 10. Activity location planning horizon: A. Elderly; B. Non-elderly.
0%
10%
20%
30%
40%
50%
60%
More than 1 week before
Same week One day before
Same day Less than 1 hr before
Routine Do not know
Non-elderly
Same planning horizon as activity

41
41
Figure 11. Location flexibility by activity type.
0%
10%
20%
30%
40%
50%
60%
70%
80%
90%
100%
Eld
erly
Non
-eld
erly
Eld
erl y
Non
-eld
erly
Eld
erl y
Non
-eld
erly
Eld
erly
Non
-eld
erly
Eld
erly
Non
-eld
erl y
Eld
erly
Non
-eld
erly
Eld
erly
Non
-eld
erly
Eld
erl y
Non
-eld
erly
Eld
erly
Non
-eld
erly
Eld
erly
Non
-eld
erl y
Eld
erly
Non
-eld
erly
Eld
erly
Non
-eld
erly
Eld
erl y
Non
-eld
erly
Eld
erly
Non
-eld
erly
Eld
erly
Non
-eld
erl y
Eld
erly
Non
-eld
erly
Eld
erly
Non
-eld
erly
Eld
erl y
Non
-eld
erly
Eld
erl y
Non
-eld
erly
Eld
erly
Non
-eld
erl y
1 2 3 4 5 6 7 8 9 10 11 12 13 14 15 16 17 18 19 20
Only Several Many
1 Changing
Transportation
2 Healthcare
3 Household
Errands
4 Leisure/
Entertainment
5 Meal
6 Other
7 Personal Business
8 Pick‐up/Drop‐off
9 Primary Work
10 Recreation
/

42
6.2.1.2 Timing
The research team examined activity start times and duration after analyzing location choice planning horizons and flexibilities. Contrasting with what was observed for activity location flexibility, the non-elderly respondents appeared to be slightly more flexible about activity start times than their older counterparts. Figure 12 presents the levels of flexibility assessed and their frequencies. The frequency of very flexible activities (i.e. those that could be changed at virtually any time), was slightly higher for the elderly respondents, but their younger counterparts more frequently reported the next level of (in) flexibility. The frequency of those activities that could start within a few hours of the actual start times was analogous for both age cohorts, but the most inflexible activities, which had to start at a specific time, were about 10% more common among the elderly.
Figure 12. Start time flexibility.
Looking at the planning horizon of activity start times (Figure 13), the research team has
observed that routine, impulsive, and same day decisions are once again most prevalent, with a fairly low degree of advanced preplanning and a high degree of impulsivity. In contrast to activity location planning, joint planning with activity engagement is dominant, and impulsive and same day decisions play a significant role. Elderly people make 14% less impulsive decisions than younger people. They make their activity start time decisions on the same day, but not on the verge of the event, 17% more frequently than younger people. The fact that elderly people generally have longer planning horizons for activity start times and less flexibility on their start times once set indicates that they are more prone to sticking to their plans regarding activity start times.
0%
10%
20%
30%
40%
50%
Could start any time
Could start within a range
of time
Could start within a few
hours of actual start time
Had to start when it did
Elderly Non-elderly

43
A
B
Figure 13. Start time planning horizon: A. Elderly; B. Non-elderly. For activity duration planning, the non-elderly respondents appear once again to be more flexible. Nevertheless, the overall result is that 40%-45% of the activity durations had to last as long as they did, but the remaining 55%-60% had some or plenty of room for accommodating schedule adjustments (see Figure 14). About one fifth of all activities could have had a very different duration than they actually did.
0%
5%
10%
15%
20%
25%
30%
35%
40%
More than 1 week before
Same week One day before
Same day Less than 1 hr before
Routine Do not know
Elderly
Same planning horizon as activity
0%
5%
10%
15%
20%
25%
30%
35%
40%
More than 1 week before
Same week One day before
Same day Less than 1 hr before
Routine Do not know
Non-elderly
Same planning horizon as activity

44
Figure 14. Activity duration flexibility.
Figure 15 shows that most of the activity durations were decided during the activity.
That would be the case, for example, when one goes on a social activity and decides upon the duration of the activity depending on its progress. In fact, for most activity types, duration was decided during the activity. More than half of work at home, volunteer work, shopping, eating meals away from home, service, and social activities had their duration decided while respondents performed them. Only work and school related, religious/civic and at home activities (not working) had a substantial amount of preplanning. As expected, the duration of these activities was most frequently decided based on routine. Table XVI, Appendix B, presents activity duration planning horizons for each activity type.
Routine was the second most frequent type of decision relative to activity duration, followed by plans made together to carry out the activity. Other planning horizons encompassed a tiny part of activities, demonstrating that individuals typically do not actively plan for activity duration. Once more older people preferred to make their decisions earlier in the day rather than act impulsively. Routine also seemed somewhat more important for elderly people when considering activity duration.
0%
10%
20%
30%
40%
50%
Inflexible Somewhat flexible Very flexible
Elderly Non-elderly

45
A
B
Figure 15. Activity duration planning horizon: A. Elderly; B. Non-elderly. 6.2.1.3 Persons Involved
Figure 16 shows the distribution of accompanying persons for the elderly and non-elderly groups. When other persons were present during the activity, the requirement of involvement for these persons is shown through different shades in the columns. Elderly individuals less frequently perform activities alone, partly because they spend significantly less
0%5%
10%15%20%25%30%35%40%45%50%
More than 1 week before
Same week
One day before
Same dayLess than 1 hr
before
During activity
Routine Do not know
Elderly
Same planning horizon as activity
0%5%
10%15%20%25%30%35%40%45%50%
More than 1 week before
Same week
One day before
Same dayLess than 1 hr
before
During activity
Routine Do not know
Non-elderly
Same planning horizon as activity

46
time in activities which are usually performed alone such as work or school. For elderly people, this disparity is compensated with more activities performed with family and friends or only family members.
The activity types, which are usually engaged with family members, differ for elderly and non-elderly people. Family members usually accompany elderly people on their healthcare visits, meals away from home, and some of their shopping trips. They run 71% of their household errands and have 63% of their service activities alone. Younger people have more of their religious/civic, pick-up/drop-off, household errands, service, and social activities with family members. Non-elderly people usually travel alone more often than their elderly counterparts to get their own meals and find their own leisure/entertainment and recreational activities. See Table XVII, Appendix B, for detailed information on the persons involved in each type of activity.
Figure 16. Persons involved in the activity episodes and flexibilities.
Non-elderly people have more activities with coworkers, which is highly expected since 72% of elderly respondents in this survey were retired. The flexibility level for both groups is comparable, with the elderly respondents having an overall greater flexibility.
Out of all the activity attributes analyzed (location, start time, and duration), the planning horizon for persons involved is most frequently associated with the planning horizon for conducting the activity. Figure 17 shows that more than 40% of all activities involving other persons were planned at the same time that they were first thought of. The planning for these people also involved starts more than one week before the event, which was more frequent than any other plan, except that for the activity itself. Impulsive decisions encompassed only 5%-6% of all decisions for both age groups, making persons involved the least impulsive activity attribute. These characteristics indicate that having persons involved in an activity requires far
59% 64%
13% 9%2% 1% 4% 3% 3% 2%
1%
9%10%
1% 1% 3% 3% 4% 5%
0%
10%
20%
30%
40%
50%
60%
70%
Eld
erly
Non
-eld
erly
Eld
erly
Non
-eld
erly
Eld
erly
Non
-eld
erly
Eld
erly
Non
-eld
erly
Eld
erly
Non
-eld
erly
Eld
erly
Non
-eld
erly
Alone With Coworkers
With Family With Family-Friends
With Friends With Others General
Alone Optional Required

47
more planning than executing an activity alone because of the high level of effort necessary to conciliate schedules of multiple individuals.
Figure 17. Planning horizon for persons involved in activities.
Elderly and non-elderly people demonstrated a similar trend on the planning horizon for persons involved in the activity, with elderly people once more revealing stronger preferences for planning earlier in the day than in the last hour. Following simultaneous plans with activity execution, once again routine shows up as an important factor for persons involved. Routine plays a major role among non-elderly people. 6.2.2 Trips
The trip related decision-making process captured in this survey regards travel mode and route choices. For travel mode, the research team asked respondents about planning horizons and reasons for mode choice. This second question, about travel mode, allows the inference of mode flexibility. The exploration of results regarding mode and route choice is presented in the two following subsections.
2% 3% 4% 1% 2% 3% 5% 5% 3% 4%
28%19%
14%8%
1%5% 7% 2%
2% 2% 2%6% 3% 2% 2%
16%
21%
9% 18%
1%1%
0%5%
10%15%20%25%30%35%40%45%50%
Eld
erly
Non
-eld
erly
Eld
erly
Non
-eld
erly
Eld
erly
Non
-eld
erly
Eld
erly
Non
-eld
erly
Eld
erly
Non
-eld
erly
Eld
erly
Non
-eld
erly
Eld
erly
Non
-eld
erly
Eld
erly
Non
-eld
erly
More than 1 week before
Same week One day before
Same day Less than 1 hr before
Same as activity
Routine Do not know
Optional Required

48
6.2.2.1 Mode The single most important factor affecting mode choice on a trip is whether a mode was
already in use during a previous trip in the same tour. This factor determined the mode of approximately 65% of the trips because of the auto drive mode’s predominance (see Table V, Section 5). If an individual drives his or her vehicle, it is very unlikely that he or she will consider going back home with another mode and leave the vehicle in a parking lot. Therefore, for the trip back home, there is no mode choice; he or she made this choice for the whole tour, not this individual trip. Respondents used the auto drive mode for 79% of trips where mode was determined based upon what was already in use. In the other 12% of trips, the mode already in use was auto passenger, resulting in only 9% of trips being constrained when the mode in use was not the automobile.
Excluding trips that were constrained by previous use of a specific mode, convenience was the most important factor on mode choice, being decisive in more than half of the cases. This is one factor frequently used to explain why the automobile mode was so popular. After convenience, the lack of alternatives was the second most frequent reason for mode choice, accounting for almost one third of the decisions. Looking at Figure 18, which shows the motivations for mode choice, safety and cost were minor concerns in mode choice for both elderly and non-elderly respondents. Overall, travel time was not as major a concern as might be expected, being decisive for less than 15% of non-elderly trips. For the elderly, speed was even less important; only 7% of mode choices were made based on travel time. On the other hand, elderly people valued convenience to a higher degree than younger individuals. Convenience determined 58% of elderly choices for driving, 21% more than for non-elderly respondents. Least travel time motivated approximately 7% of elderly choices for driving, while this factor motivated 17% of non-elderly choices for driving. It is clear that a number of these choice factors are related, especially speed, traffic, and convenience. This likely explains the high prevalence of the convenience choice since cost, speed, and time, may all be considered subsets of convenience.
Figure 18. Motivation for mode choice.
Another interesting point regarding the reasons why individuals chose a specific travel
mode is how the motivation for using auto passenger mode differs between elderly and non-elderly respondents. For the first group, lack of options were responsible for 42% of auto-passenger choices. For the second group, lack of options was the reason for only 36% of
0%
10%
20%
30%
40%
50%
60%
Most convenient
Only available
Fastest Other Cheapest Safest
Elderly Non-elderly

49
choices for auto-passenger mode, 15% less than for elderly respondents. When the elderly respondents chose transit, 63% of times it was because transit was the most convenient mode. For non-elderly respondents, however, convenience was decisive for more frequently choosing transit, 87% of times. Being the fastest or the cheapest mode motivated older individuals to take transit far more than it motivated the younger respondents. Detailed information on the reasons for choosing different travel modes, excluding cases when the mode choice was related to a previous trip, are shown in Table XVIII, Appendix B. The most frequently cited reason for cases where the motivation for mode choice was classified as "other" was recreation or exercise. Sixteen walking, biking, motorcycling, and animal riding trips were reported as recreational/exercise. Figure 19 shows that approximately 40% of travel mode choices were made in conjunction with activity execution decisions and more than one third were based on routine. Like location choice and persons involved, this result indicates travel mode choice is strongly related to activity execution. In many cases, when an individual thinks about performing an activity, he already knows where he will go, how, and with whom. Routine is also an important factor influencing travel mode. It is 35% more decisive for younger people than for elderly ones. Instead, elderly people often decide upon the activity, mode, and location together earlier the same day or one day before traveling. Impulsive decisions are minor in mode choice when compared to activity attributes.
A
0%
10%
20%
30%
40%
50%
More than 1 week before
Same week
One day before
Same day Less than 1 hr
before
Routine Do not know
Elderly
Same planning horizon as activity Same planning horizon as location

50
B
Figure 19. Mode choice planning horizon. 6.2.2.1 Route
Travelers decide what route they will take once a travel mode is selected. Figure 20 shows that travel time was the primary deciding factor for route choice, selected in nearly 60% of decisions. Routine was the second most frequent decision factor, selected in around one quarter of decisions.
Cost was more influential on elderly respondents’ decisions than traffic, while it was the opposite for non-elderly respondents. This was unexpected since the literature suggests the opposite. Despite its low power to ultimately influence a choice in daily travel, aesthetical qualities appear to be far more appealing to the elderly than the non-elderly. Scenery was three times more of a factor for older people. Safety and quantity of traffic control devices, such as lights and stop signs, did not play a major role in route choice.
Figure 20. Motivation for route choice.
0%
10%
20%
30%
40%
50%
More than 1 week before
Same week
One day before
Same day Less than 1 hr
before
Routine Do not know
Non-elderly
Same planning horizon as activity Same planning horizon as location
0%10%20%30%40%50%60%70%
Elderly Non-elderly

51
6.3 COMPLEX AND SIMPLE TOUR FORMATION ANALYSIS
In the context of this study, a tour is considered a trip sequence that starts and finishes at respondents’ residences. Simple tours are those where only one activity occurs, which in this study’s context always implies a stop. Complex tours are those where more than one activity or stop takes place. The loggers may not have captured all of these tours because of technical difficulties, such as satellite connection delays, respondents’ delays in turning on their loggers, and logger batteries dying out before the tour ended. Many of these problems were corrected in this survey’s verification phase. In uncorrected cases, the research team has assumed that the missing parts of these tours were to or from respondents’ residences. 6.3.1 Quantity of Tours and Stops within Tours
Using the concepts mentioned above, 1682 tours were identified in the data set, from which 744 tours were performed by the elderly and 938 were performed by the non-elderly. The average number of stops per tour, that is, all the activities executed in the middle of the tour, was 2.41 for the elderly and 2.25 for the non-elderly subset. This 7% difference in the average number of stops per tour supports the theory that elderly people do more trip chaining than younger people. The columns in Figure 21 show stops per tour distributions for this study’s elderly and non-elderly respondents, while the line shows the cumulative distribution of stops per tour. As expected, the elderly respondents had fewer tours per day than their non-elderly counterparts, with the elderly respondents averaging 1.29 tours per day and the non-elderly respondents averaging 1.38 tours per day. The non-elderly respondents had more simple tours, which had only one stop. Simple tours represented 40% to 45% of all tours in both age groups. When it came to complex tours, i.e., tours with more than one stop, the elderly respondents displayed slightly more complexity in tours on average than their non-elderly counterparts. The elderly respondents went on 12% more tours with three stops and 8% more tours with four stops compared to their non-elderly counterparts. Approximately 90% of all tours had four stops or less. Table VI shows the average number of stops per tour and the average number of tours per day by age group and gender. Without considering gender, the elderly make more complex tours, which have a slightly higher number of stops on average. Also, the proportion of complex tours in relation to all tours is higher for the elderly (60% versus 55%).
Considering gender, the elderly male respondents made less complex tours with a higher number of stops on average than the younger males. On the other hand, the elderly females made more complex tours, but their complex tours had a slightly lower number of stops on average than their younger counterparts.

52
Figure 21. Distribution of number of stops within tours.
Table 6. Characteristics of Complex Tours by Age Group and Gender
Subset
Average number of stops per complex tour
Average number of complex tours per person per day
Elderly
Male
3.42
0.77
Female
3.29 0.78
Total 3.34 0.78
Non-elderly Male
3.45 0.72
Female
3.13 0.79
Total
3.23 0.77
Table 7 displays how frequently each activity type occurred in simple or complex tours for this study’s elderly and non-elderly respondents. This table also shows whether these activities occurred first, second, third, fourth, etc. in the tours since these respondents tended to perform some activity types more frequently in simple tours or earlier in complex tours than
0%
10%
20%
30%
40%
50%
60%
70%
80%
90%
100%
0%
5%
10%
15%
20%
25%
30%
35%
40%
45%
50%
1 2 3 4 5 6 7 8 9 10 11 12 13 14
Cum
ulative percentagePer
cent
age
of to
urs
Number of stops within tour
Elderly Non-elderly
Cumulative number of tours: elderly Cumulative number of tours: non-elderly

53
others. Most of these respondents performed religious/civic activities, recreational activities, and primary work in simple tours or as the first stop in complex tours. Nevertheless, it was more common to find a previous stop before going to work than before going to church, for example.
In contrast, some other types of activities were unlikely to occur in simple tours, or in other words, were very likely to be chained with others. For both age groups, less than 11% of household errands were conducted as the sole activity in the tour. Pick-ups and drop-offs were also seldom seen as a tour’s single activity.
Although it was not uncommon to find shopping activities in simple tours, respondents from both groups, especially the elderly, consistently chained all variants of this activity type with other activities. The greatest disparity is found when this study’s respondents shopped for major items. While younger people made specific tours to shop for major items in 33.3% of the cases, the elderly did likewise only 7.7% of the time. Along with an observation that this study’s elderly respondents made more impulsive decisions than their non-elderly counterparts only for major item shopping (see Figure 8), this finding indicates that major item shopping is intrinsically different than other types of shopping, and elderly behavior towards it is different than that of their younger counterparts.

54
Table 7. Type of Tour and Stop Number by Activity Type
Simple tours Complex tours
Stop 1 Stop 2
Stop 3
Stop 4 or more Total
Activity type
Age (%) (%) (%) (%) (%) Act. (%)
Changing Transportation >=65 0.0 20.8 16.7 18.8 43.8 48
100.0
<65 4.8 50.0 16.7 11.9 16.7 40 95.2Healthcare >=65 32.5 35.0 22.5 3.8 6.3 54 67.5
<65 36.7 30.4 17.7 7.6 7.6 50 63.3Household Errands
>=65 10.6 46.8 25.5 10.6 6.4 42 89.4<65 8.6 25.9 32.8 10.3 22.4 53 91.4
Leisure/ Entertainment
>=65 18.4 21.9 21.1 17.5 21.1 93 81.6<65 20.0 26.7 22.7 17.3 13.3 60 80.0
Meal >=65 12.7 21.8 37.0 12.1 16.4 144 87.3<65 10.2 19.1 33.8 17.2 19.7 141 89.8
Other >=65 12.9 17.7 23.4 16.9 29.0 108 87.1<65 14.6 25.2 27.6 15.4 17.1 105 85.4
Personal Business
>=65 12.2 27.6 25.2 13.0 22.0 108 87.8<65 16.8 26.7 26.7 9.9 19.8 84 83.2
Pick-up/Drop-off >=65 7.0 27.9 25.6 16.3 23.3 40 93.0<65 14.8 34.6 12.3 12.3 25.9 69 85.2
Primary Work >=65 41.1 26.8 16.1 7.1 8.9 33 58.9<65 26.5 30.0 20.4 11.4 11.7 252 73.5
Recreation >=65 27.1 34.3 15.7 11.4 11.4 51 72.9<65 35.9 30.4 19.6 6.5 7.6 59 64.1
Religious/Civic >=65 37.0 42.0 10.0 6.0 5.0 63 63.0<65 34.0 46.8 14.9 2.1 2.1 31 66.0
School >=65 0.0 12.5 12.5 50.0 25.0 8
100.0
<65 50.0 26.1 15.2 4.3 4.3 23 50.0Services >=65 9.7 37.1 29.0 8.1 16.1 56 90.3
<65 18.5 27.8 27.8 13.0 13.0 44 81.5Shopping Grocery
>=65 17.1 16.1 31.7 18.6 16.6 165 82.9<65 22.1 15.5 29.8 14.4 18.2 141 77.9
Shopping Household
>=65 13.6 32.2 28.8 13.6 11.9 51 86.4<65 20.0 16.4 27.3 20.0 16.4 44 80.0
Shopping Major Item
>=65 7.7 23.1 19.2 30.8 19.2 24 92.3<65 33.3 16.7 27.8 5.6 16.7 12 66.7
Shopping Other >=65 11.5 21.8 26.8 18.8 21.1 231 88.5<65 10.8 22.0 31.5 18.3 17.4 215 89.2

55
Simple tours Complex tours
Stop 1 Stop 2
Stop 3
Stop 4 or more Total
Activity type
Age (%) (%) (%) (%) (%) Act. (%)
Social >=65 13.2 23.1 25.6 9.9 28.1 105 86.8<65 17.9 20.0 24.8 17.9 19.3 119 82.1
Volunteer Work >=65 31.3 31.3 18.8 18.8 0.0 11 68.8<65 37.5 12.5 25.0 12.5 12.5 5 62.5
Work/ Business >=65 0.0 33.3 33.3 0.0 33.3 3
100.0
<65 10.1 16.2 27.3 10.1 36.4 89 89.9
6.3.2 Temporal Distribution of Tours Besides differences in quantity and average number of stops, elderly tours also differed
in temporal distribution. Figure 22 shows tour distribution by day of the week. Part A relates to simple tours, those with only one stop, and part B relates to complex tours. The line indicates a uniform distribution in which the tours would be equally distributed across the week. Overall, the non-elderly respondents performed more complex tours during the week (Monday through Friday) and their elderly counterparts performed more of them on weekends. Looking at simple tours, an opposite trend is observed: the non-elderly respondents concentrated their simple tours at the beginning of the week (Monday, Tuesday and Wednesday) and Saturdays and the elderly respondents concentrated their simple tours at the end of the week (Thursday and Friday).
Another distinctive characteristic is that the peak of complex tours occurred on Wednesdays and Fridays for the younger respondents and the peak of complex tours occurred on Mondays and Fridays for the elderly respondents. These results contrast somewhat with a previous study (Noland and Thomas, 2007) where elderly complex tours peaked on Mondays and tours for the general population peaked on Fridays.
Nevertheless, the peak pattern for simple tours in this study is the opposite: the elderly respondents had their peak on Thursdays and the non-elderly respondents had their peak on Mondays. The discrepancy between the relative number of simple tours performed by elderly and non-elderly on these peak days is very large: the elderly respondents had 42% more simple tours on Thursdays than the younger respondents and the younger respondents had 10% more simple tours on Mondays than their older counterparts. Tuesdays presented an above average number of simple tours among the non-elderly respondents, but this day presented the lowest level of weekday simple tours for the elderly respondents. Overall, simple and complex tours showed a complementary pattern, suggesting that these two travel types are intrinsically different. Also, the behavior of elderly and non-elderly in both instances of tours was diverse, showing that advanced age played a noteworthy role in tour formation.

56
A
B
Figure 22. Distribution of tours by day of the week: A. Simple tours, B. Complex tours.
The distribution of simple and complex tours within the day also suggests that these two tour types have different natures, and that elderly behavior is fundamentally different from that of younger people. Figure 23 shows the distribution of tour start times; part A shows simple tours and part B, complex tours. The distributions are very dissimilar, for both age groups. While simple tours had their start times relatively spread out over the day with peaks occurring in the morning and evening, especially for the elderly, complex tours had a more defined peak in the morning since they were longer and required more time during the day to accomplish.
For the non-elderly, both tour types started occurring at 5 a.m. and start times for complex tours peaked at 8 a.m. But for the elderly, both tour types started occurring at 6 a.m. and start times for complex tours peaked at 10 a.m. After 12 p.m., the start times for complex tours followed a similar distribution for both age groups. However, in a similar fashion as simple tours, the curve for the non-elderly respondents’ complex tours stretched further to the right,
Average
0%2%4%6%8%
10%12%14%16%18%20%
Sun Mon Tue Wed Thu Fri Sat
Sim
ple
tour
s
Day of the week
Elderly Non-elderly Average
Average
0%2%4%6%8%
10%12%14%16%18%20%
Sun Mon Tue Wed Thu Fri Sat
Com
plex
tour
s
Day of the week
Elderly Non-elderly Average

57
meaning that they were starting tours while their elderly counterparts were already settled in for the night at home. These results show that the elderly respondents generally engaged in more mid-day tours and avoided peak periods to a larger degree than their non-elderly counterparts.
A
B
Figure 23. Distribution of tours start time by time of the day: A. Simple tours, B. Complex tours.
This was especially clear for complex tours, in which the non-elderly sample was closely aligned with the a.m. peak period, as would be expected with chained work/school tours, while the elderly sample peaked in the early afternoon, possibly scheduled around peak period traffic. The elderly respondents, however, still started more simple tours between 8 a.m. and 9 a.m. than in any other period, thus contributing to congestion in the a.m. peak rush hours. The decision making process regarding activity start times within complex tours has different planning horizons depending on the position of the activity in the tour. Table VIII shows the distribution of different planning horizons and strategies for each tour stop. Routine activity start times peaked at the first stop of the tour. Meanwhile, the chance of finding start times
0%2%4%6%8%
10%12%14%16%
12:0
0 A
M1:
00 A
M2:
00 A
M3:
00 A
M4:
00 A
M5:
00 A
M6:
00 A
M7:
00 A
M8:
00 A
M9:
00 A
M10
:00
AM
11:0
0 A
M12
:00
PM
1:00
PM
2:00
PM
3:00
PM
4:00
PM
5:00
PM
6:00
PM
7:00
PM
8:00
PM
9:00
PM
10:0
0 P
M11
:00
PM
Sim
ple
tour
s
Time of day
Elderly Non-elderly
0%2%4%6%8%
10%12%14%16%
12:0
0 A
M1:
00 A
M2:
00 A
M3:
00 A
M4:
00 A
M5:
00 A
M6:
00 A
M7:
00 A
M8:
00 A
M9:
00 A
M10
:00
AM
11:0
0 A
M12
:00
PM
1:00
PM
2:00
PM
3:00
PM
4:00
PM
5:00
PM
6:00
PM
7:00
PM
8:00
PM
9:00
PM
10:0
0 P
M11
:00
PM
Com
plex
tour
s
Time of day
Elderly Non-elderly
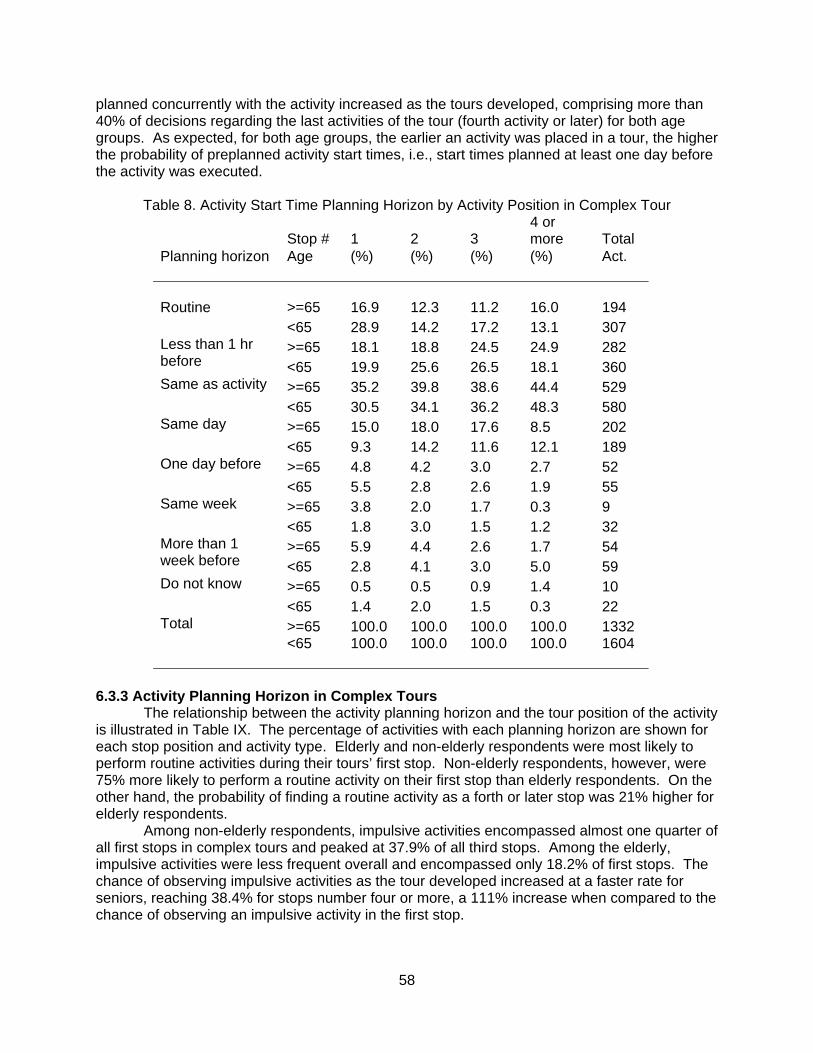
58
planned concurrently with the activity increased as the tours developed, comprising more than 40% of decisions regarding the last activities of the tour (fourth activity or later) for both age groups. As expected, for both age groups, the earlier an activity was placed in a tour, the higher the probability of preplanned activity start times, i.e., start times planned at least one day before the activity was executed.
Table 8. Activity Start Time Planning Horizon by Activity Position in Complex Tour
Planning horizon
Stop # 1 2 3 4 or more Total
Age
(%) (%) (%) (%) Act.
Routine
>=65 16.9 12.3 11.2 16.0 194<65 28.9 14.2 17.2 13.1 307
Less than 1 hr before
>=65 18.1 18.8 24.5 24.9 282<65 19.9 25.6 26.5 18.1 360
Same as activity >=65 35.2 39.8 38.6 44.4 529<65 30.5 34.1 36.2 48.3 580
Same day >=65 15.0 18.0 17.6 8.5 202<65 9.3 14.2 11.6 12.1 189
One day before >=65 4.8 4.2 3.0 2.7 52<65 5.5 2.8 2.6 1.9 55
Same week >=65 3.8 2.0 1.7 0.3 9<65 1.8 3.0 1.5 1.2 32
More than 1 week before
>=65 5.9 4.4 2.6 1.7 54<65 2.8 4.1 3.0 5.0 59
Do not know >=65 0.5 0.5 0.9 1.4 10<65 1.4 2.0 1.5 0.3 22
Total
>=65 100.0 100.0 100.0 100.0 1332<65
100.0 100.0 100.0 100.0 1604
6.3.3 Activity Planning Horizon in Complex Tours
The relationship between the activity planning horizon and the tour position of the activity is illustrated in Table IX. The percentage of activities with each planning horizon are shown for each stop position and activity type. Elderly and non-elderly respondents were most likely to perform routine activities during their tours’ first stop. Non-elderly respondents, however, were 75% more likely to perform a routine activity on their first stop than elderly respondents. On the other hand, the probability of finding a routine activity as a forth or later stop was 21% higher for elderly respondents.
Among non-elderly respondents, impulsive activities encompassed almost one quarter of all first stops in complex tours and peaked at 37.9% of all third stops. Among the elderly, impulsive activities were less frequent overall and encompassed only 18.2% of first stops. The chance of observing impulsive activities as the tour developed increased at a faster rate for seniors, reaching 38.4% for stops number four or more, a 111% increase when compared to the chance of observing an impulsive activity in the first stop.

59
Activities planned in the same day as they were conducted comprised a significant part of all stops in the tours, but were usually later in the tour. Both respondent groups behaved similarly.
Table 9. Activity Planning Horizon by Order of Stop within Tour
Planning horizon
Stop # 1 2 3 4 or more Total
Age
(%)
(%)
(%)
(%)
Act.
Routine
>=65 17.5 9.9 8.3 13.9 182<65 30.5 17.3 21.2 16.8 356
Less than 1 hr before
>=65 18.2 22.6 32.8 38.4 374<65 23.3 31.7 37.9 34.5 494
Same day >=65 23.0 31.8 29.0 23.5 379<65 19.5 23.8 22.7 29.5 377
One day before
>=65 16.1 16.0 10.8 8.4 191<65 9.9 13.0 7.4 8.1 163
Same week >=65 9.8 7.1 7.5 7.7 115<65 6.2 4.9 2.6 4.7 79
More than 1 week before
>=65 14.8 11.8 10.0 7.4 162<65 9.9 7.5 6.7 6.5 128
Do not know >=65 0.7 0.7 1.7 0.6 12<65 0.6 1.8 1.5 0.0 16
Total
>=65 100.0 100.0 100.0 100.0 1415<65 100.0 100.0 100.0 100.0 1613
The research team most frequently observed activities with planning horizons of one day
or more as first stops among younger and older individuals. The above figures also show that elderly people sought to perform their preplanned activities as early as possible in their tours, leaving impulsive actions, if any, until after they honored their previous commitments. 6.3.4 Travel Mode and Trip Chaining
Table X compares travel mode in simple and complex tours by age group. An analysis of this table reveals that transit use is more often associated with complex tours than simple tours in this data set. All rail trips, but one, and more bus trips were undertaken in complex tours. This result is somewhat related to the manner in which trips and activities were reported in this survey. Because of automated activity detection, most multimodal trips, which typically involved transit, were reported as a trip followed by a change in transportation activity, followed by another trip. Therefore, a trip involving changes in transportation mode made to a single destination was more likely to be reported as a complex tour with one change in transportation activity than a simple tour with a multimodal trip. Walking, however, was as expected, a more common choice in simple tours, since a smaller range of destinations can be reached with this mode.

60
Table 10. Travel Mode Choice in Trip Chaining
Simple tours Complex tours
Travel mode
Elderly
Non-elderly
Elderly
Non-elderly
Auto-drive 83.8% 81.5% 73.4% 81.0%Auto-passenger 7.6% 10.7% 14.0% 9.3%Bike 0.0% 0.4% 0.4% 0.3%Bus 2.5% 0.7% 5.0% 1.6%Commuter rail 0.0% 0.0% 0.8% 1.2%Light rail 0.0% 0.1% 0.9% 0.9%Multimodal 0.0% 0.0% 0.0% 0.5%Other 0.4% 0.1% 0.3% 0.5%Taxi 0.0% 0.1% 0.0% 0.0%Walk
5.8% 6.4% 5.2% 4.6%
Advanced age seems to affect mode choice in complex and simple tours. The auto-
drive mode share remained nearly stable from simple to complex tours for non-elderly respondents, but dropped 12.4% for their elderly counterparts. The auto-passenger mode share decreased 13.2% from simple to complex tours for non-elderly respondents, but increased 85.2% for their elderly counterparts.
The relative stability of mode share for simple and complex tours among non-elderly respondents and the relative instability of these shares among elderly respondents indicates that the occurrence of tours with multiple stops follows different characteristics for older individuals. They tend to make more complex tours when traveling as auto-passengers and less complex tours when driving, while for younger individuals, travel mode does not appear to be closely related to tour complexity, providing important results when planning transit for elderly users, especially paratransit and dial-a-ride. Tour complexity more often affected elderly respondents’ travel mode planning horizons than their younger counterparts. Table XI shows the planning horizons for simple and complex tours for both age groups. As in Figure 19, the numbers shown in Table XI do not include cases where the mode in use had been chosen in a previous trip. While the importance of routine mode choices and plans made concurrently with the activity itself varied less from simple to complex tours among non-elderly respondents, these planning strategies varied significantly among elderly respondents. Routine mode choice was 34.2% more common in elderly simple tours than complex tours, whereas mode choice planning concurrent with activity planning accounted for nearly half of elderly complex tour mode planning.

61
Table 11. Travel Mode Planning Horizon and Tour Complexity Travel mode planning horizon
Simple tours Complex tours Elderly
Non-elderly
Elderly
Non-elderly
Routine 34.1% 46.9% 25.4% 42.1%Same as activity 34.1% 38.0% 46.3% 39.6%Same as location 11.4% 5.0% 8.1% 4.0%Less than 1 hr before 6.5% 3.1% 4.8% 4.8%Same day 7.7% 2.1% 7.7% 4.5%One day before 2.4% 1.4% 3.3% 2.1%Same week 0.4% 1.2% 1.1% 0.5%More than 1 week 0.8% 1.7% 3.1% 1.6%Do not know
2.7% 0.7% 0.2% 1.0%
6.3.5 Tour Complexity and Persons Involved
Table 12 shows that activities performed with others comprised more complex tours overall than simple ones. This is especially true for the non-elderly respondents. In both types of tours, the elderly respondents had more activities with other people than their younger counterparts since they were more flexible about having other people join in their activities.
Table 12. Persons Involved in Activities in Complex and Simple Tours
Type of tour Age group Alone With others
Optional
Required
Total
Simple tours Elderly %73.6 %14.3 %11.3 %25.6 Non-elderly %74.3 %9.2 %15.9 %25.1Complex tours Elderly %54.8 %25.2 %18.0
%43.2
Non-elderly %60.3 %16.9 %21.8 %38.7
The analysis of other people involved in activities, considering their order in the tour did not yield many conclusive findings. Figure 24 shows the percentage of activities performed with other individuals by stop number in a complex tour. No clear trend was observable and a linear regression of the curves did not indicate at a 90% confidence level whether the slopes were positive or negative for both age groups.

62
Figure 24. Others involved in activity by activity order in a complex tour.
6.3.6 Activity Duration
Regardless of tour complexity, the distribution of activity duration for all out-of-home activities is shown for elderly and non-elderly respondents in Figure 25. The columns show the percentage of activities that had a maximum duration equal to the value in the abscissa and a minimum duration equal to the prior value in the axis. The lines show the cumulative distribution of activity duration. It is noticeable that elderly activities had, in general, shorter durations than non-elderly activities. Ninety-five percent of elderly activities lasted less than four hours, while this same percentile for non-elderly activities lasted more than eight hours. Among the longer activities - those lasting more than four or five hours - it is interesting to note that activities between eight and nine hours are more prevalent than others. This is largely due to work activities, since eight to nine hours is typically the time a full-time employee spends at work. Around 65% of activities lasting from eight to nine hours had their purpose classified as primary work. Analyzing out-of-home activity duration versus tour complexity reveals that all activities lasting up to 15 minutes are approximately twice as common in complex tours as in simple tours for both age groups. The only activities more likely to be found in simple tours are those lasting eight to nine hours. This is true for non-elderly respondents; the low number of observations of such activities - only one – does not allow any affirmation for elderly respondents. Table 13 shows the probabilities of finding activities of specified durations in simple or complex tours, and for complex tours, the position of activities within the tour. For elderly respondents, the most common activity duration in simple tours was one to two hours. In fact, as seen in Figure 25, a significant part of elderly activity had this duration; 44% more activities than when compared to their non-elderly counterparts. These elderly activities mostly comprised simple tours and first stops in complex tours. For non-elderly respondents, the most common activity duration in simple tours were the shortest ones, lasting a maximum of 15 minutes, followed by activities lasting from 15 minutes to two hours.
40.0%
45.0%
50.0%
55.0%
60.0%
65.0%
1 2 3 4 or more
Elderly Non-elderly

63
Figure 25. Distribution of activity duration.
0%10%20%30%40%50%60%70%80%90%100%
0%5%
10%15%20%25%30%35%40%C
umulative %
% o
f act
iviti
es
Activity duration (hours)
Elderly Non-elderly Cumulative % - elderly Cumulative % - non-elderly

64
Table 13. Activity Duration by Order of Activity within Tour
Simple tours Complex tours
Stop 1 Stop 2 Stop 3 Stop 4 or more
Activity duration
Age
Act.
(%)
Act.
(%)
Act.
(%)
Act.
(%)
Act.
(%)
1 to 15 minutes
>=65 55 20.9 171 39.2 142 33.4 105 43.9 155 49.8 <65 93 23.6 217 42.5 197 38.9 97 36.1 162 48.1
15 to 30 minutes
>=65 42 16.0 60 13.8 80 18.8 50 20.9 52 16.7 <65 51 12.9 60 11.7 77 15.2 42 15.6 50 14.8
30 to 60 minutes
>=65 43 16.3 61 14.0 82 19.3 36 15.1 43 13.8 <65 52 13.2 52 10.2 79 15.6 50 18.6 50 14.8
1 to 2 hours
>=65 66 25.1 93 21.3 76 17.9 21 8.8 33 10.6 <65 55 14.0 72 14.1 61 12.0 26 9.7 30 8.9
2 to 3 hours
>=65 25 9.5 28 6.4 27 6.4 14 5.9 9 2.9 <65 27 6.9 29 5.7 23 4.5 18 6.7 18 5.3
3 to 4 hours
>=65 11 4.2 9 2.1 8 1.9 7 2.9 10 3.2 <65 23 5.8 25 4.9 16 3.2 13 4.8 8 2.4
4 to 6 hours
>=65 13 4.9 9 2.1 3 0.7 4 1.7 4 1.3 <65 26 6.6 15 2.9 18 3.6 13 4.8 13 3.9
6 to 8 hours
>=65 6 2.3 2 0.5 4 0.9 0 0.0 0 0.0 <65 17 4.3 8 1.6 15 3.0 3 1.1 4 1.2
8 to 9 hours
>=65 0 0.0 3 0.7 0 0.0 0 0.0 0 0.0 <65 39 9.9 16 3.1 11 2.2 5 1.9 1 0.3
9 hours or more
>=65 2 0.8 0 0.0 3 0.7 2 0.8 5 1.6 <65 11 2.8 17 3.3 10 2.0 2 0.7 1 0.3
Total >=65 263 100.0 436 100.0 425 100.0 239 100.0 311 100.0 <65
394 100.0 511 100.0 507 100.0 269 100.0 337 100.0
In complex tours, elderly activities lasting more than one hour were generally more likely
to be completed earlier in the tour. This declining trend is not clear for the non-elderly until activity duration reaches eight hours. In contrast, activities lasting 15 minutes to one hour, for both age groups, have the opposite behavior: they would likely occur if they were positioned first or fourth or more in the complex tour. For younger respondents, shorter activities with a maximum duration of 15 minutes, are most likely the first activity or the fourth or more activity in the tour than second or third, indicating planning around existing higher priority activities, i.e. impulsive stops along a preplanned tour. Contrastingly, shorter activities were more common for elderly respondents from the third stop of the tour onward. Along with the finding that 31% of these short activities were planned less an hour before their execution and another 23% were planned the same day, these findings confirm the expectation that short, impulsive activities are more likely to be

65
performed either when the individual leaves home or when he or she returns. In the case of the elderly, they are more likely to be performed on the way home.
The analysis of the tour formation process conducted in this section revealed that this process presents both similarities and disparities depending on the individuals' age group. For example, age seems to considerably affect trip chaining behavior, with the research team finding differences between younger and older people’s temporal distribution of complex tours, complex tour mode choices, and activity duration. The presence of other individuals involved in activities conducted in trip chains, though did not appear related to position of activities within the chain for both age groups under examination. So far, however, no analysis regarding the spatial distribution of trips and activities has been conducted; thus, the next section presents a brief geographic analysis of activities and trips. 6.3.7 Spatial Analysis of Activities and Trips Using Geographic Information System
One of the GPS surveys’ most attractive advantages is the precision with which GPS devices can capture activity locations and travel routes. This fully geo-referenced dataset can allow analysts to plot trips and activity locations on digital maps with the precision of meters using Geographic Information System (GIS) software. Given the spatial nature of activity-travel analysis, this capability can allow execution of a variety of investigations on how spatial location relates to event characteristics and traveler behavior. If an accurate GIS map for the local road network and transit system is available, a rich and supplemental investigation on mode and route choice can be conducted.
In this survey, the GPS devices recorded each respondent’s location every five seconds by longitude and latitude. This section therefore presents a preliminary spatial analysis by looking at the distribution of activities and travel mode usage by age group, and at the concentration of activity and travel by retired and non-retired seniors. Figure 26 shows the geographical activity distribution, focusing on the four surveyed counties. Following respondents’ residential distribution and urban density, most activities took place in Cook County and especially in the City of Chicago. In DuPage County, activities occurred more frequently in the central area. Will County had concentrated activity in the central Joliet-area, while in Lake County, most activities occurred in the southeast quadrant near Cook County. Figure 26A shows elderly respondents’ activities and Figure 26B shows non-elderly respondents’ activities. There is no remarkable distinction between the dispersion patterns observed in the two age groups, other than that due to respondents’ residential locations. Both younger and older individuals performed a comparable proportion of their activities in the central area of the City of Chicago and in the suburbs. Trip routes by travel mode for all ages are displayed in Figures 27, 28, and 29. The predominance of auto-drive trips was evident (Figure 28), followed distantly by auto-passenger trips, particularly in the suburban areas (Figure 28, part A). In these peripheral areas, the use of other travel modes was rare.

Figure
26. Geograp
Figure 27. N
A phic distribut
A Non-motoriz
tion of activit
zed travel: A
66
ties over cou
. Metropolita
unty borders
Ban area; B. D
B s: A. elderly;
B Downtown C
; B. non-elde
Chicago.
erly.

Oappearedbus, walk
Figure 28
Figure 2
On the contrad to have making, and in
A 8. Automobile
A 29. Transit t
ary, in downtade most of some cases
e travel: A. M
ravel: A. Me
town Chicagtheir trips by
s, cycling, we
67
Metropolitan
etropolitan ar
go (Part B ofy modes othere observed
B area; B. Do
Brea; B. Dow
f Figures 27,her than autod in the Loo
B owntown Ch
B ntown Chica
, 28 and 29)omobile. A sp area, whe
icago.
ago.
), respondenstrong mix ore automobi
nts of rail, ile

trips were41, S. La
Ttrips and 31 show represen(workersmore tripmost of tto mealscompatibtypes of arespondedowntow
Figu
e rare. The ake Shore DThe retired re
activities in the spatial d
nting the retir, unemploye
ps and activithe activities, leisure and
ble with the factivities thaents, moreov
wn Chicago.
A ure 30. Activ
automobile r., I-290, I-55
espondents (downtown C
distribution ored responded, studentsties in downt that the eld
d entertainmfact that the an those whover, were alm
ity-travel pat
trips downto5), and were(at any age)Chicago wheof trips and aents and Fig, home-maktown Chicagerly respondent, recreatiretired eldero still had jomost entirely
ttern for retirlo
68
own concente seldom obs generally aen comparedactivities by egure 31 repreers, etc). Thgo than thosdents performon, and persrly respondebs. The wory located in t
B red elderly: Aocations.
trated on theserved on loppeared to hd to other reelderly indiv
resenting thehe retired eld
se who weremed in downsonal busine
ents had mork places of the suburbs
A. Trips; B. A
e major highocal streets. have a simil
espondents. viduals, with e non-retiredderly responstill paid to
ntown Chicaess. This rere time to dethe elderly w, keeping the
Activities; C
hways (I-90,
ar amount o Figures 30 Figure 30
d respondenndents had fwork. In fac
ago were relaesult is edicate to thworking em from
C . Residentia
US-
of and
ts far ct, ated
ese
al

Figure
T
choices odemonsthorizons and examchaining the spatiadowntow Sobservattravel su 6.3.8 Ass
Trespondebeing lespersonal differencdistributiosample s Tduration days in Uand lasteresearchday dataon how lothis in miand surv
A e 31. Activity-
The researchof travel modrating that, ewhen comp
mined how ahabit was mal distributio
wn Chicago aSo far, the re
ion period forvey develop
sessment oThe vast majoent was givess burdensom
variation in es in weekdon of the occsize to ensurTo overcome
surveys. ThUppsala, Swed from two ders have shsets (Hansoong data shind, this sectey duration.
-travel patte
h team in thisde, route, acelderly indivipared to younadvanced agmore frequenon of activitieand more oftsearch teamor each resppment, the r
of the Two-Wority of trave
en only one dme for respotravel behavay versus wcurrence of re enough ob
e these survehe first long eden. Sincedays to six wown that day
on and Huff, hould be colltion assesse
rn for non-relo
s section expctivity locatioiduals overanger individu
ge affected thnt and more es also reveaten used alte
m has not dispondent in thesearch tea
Week Surveel surveys usday of obserondents. Hovior, such as
weekend pattevents. It observations eys’ downsidduration sure then, long weeks. Anay-to-day var1988; Pas aected to cap
es the relatio
69
B etired elderlyocations.
plored the deon, timing, anll have a strouals. They ahis process.complex amaled that retiernative modscussed the his report. Sm will asses
ey Durationsed one-dayrvation. Thisowever, this s cycling patterns, nor donly providesfor valid sta
des, experimrvey was conduration surlyzing the da
riability is enand Sundar, pture most oonship betwe
y: A. Trips; B
ecision-maknd persons ironger tendealso analyze The resear
mong the eldired elderly pdes to the auimplicationsince this is a
ss it in the ne
y data collecs data collecdoes not alltterns over toes it provides mean valueatistical analyments have bnducted in 1rveys were cata collectedormously sig1995). The
or enough beeen activity-
B. Activities;
king processinvolved in e
ency for longed the tour forch team fouerly. Their bpeople frequutomobile tos of the proloa relevant isext section o
ction, meaninction has theow for an anhe course oe any informes and requiyses or modbeen made w971 on indiv
conducted ind in these sugnificant as
ere is no set ehavioral var-travel behav
C C. Residen
ses related toeach activityger planning ormation pround that the brief analysiuently visitedo get there. onged sue for futur
of this report
ng that eache advantage nalysis of intf a week or
mation on theires a very laeling effortswith longer viduals for 3n every decaurveys, found in mulimit, howevriability. Witvior variabilit
tial
o the y,
ocess trip s of d
re t.
of
tra-
e arge s.
5 ade
ulti-ver, th ty

70
Pendyala (2003), inspired by Pas and Sundar (1995) provided a framework to assess the relationship between survey duration and the level of day-to-day variability that the survey captured. This variability in activity travel behavior is divided into inter-personal and intra-personal variabilities. Inter-personal variability refers to differences in behavior between different individuals on the same day of travel or on different days. This variability is partially due to differences in an individual’s characteristics, such as socio-economic characteristics, residential and work place locations, or personal preferences. Intra-personal variability refers to the different behaviors observed within the same individual on different days. This variability is attributable to the effect of routine cycles such as day of the week patterns and to the overall context in which the individual finds himself or herself on different days. The total sum of squared errors can express the total variability of an activity-travel characteristic as follows:
2
i jij ttTSS
where TSS = total sum of squares, representing total variability
ijt = number of trips made by person i on day j t = overall sample mean number of trips made per person per day
The following sum of squares can represent inter-personal variability:
2
j
ii ttJBPSS
where BPSS = between-person sum of squares, representing inter-personal variability
iJ = the number of days for which individual i reported travel information it = mean number of trips made per day by person i
The following sum of squares can represent intra-personal variability as follows:
2
i j
iij ttWPSS
where WPSS = within-person sum of squares, representing intra-personal variability Note that TSS = BPSS + WPSS , Therefore
1 TSS
WPSSTSS
BPSS.
The ratio BPSS/TSS represents the percentage of variability that can be attributable to intra-personal effects and the ratio WPSS/TSS represents the percentage of variability attributable to inter-personal effects. Following this methodology, this study’s research team calculated the proportion of variability caused by intra-personal effects for number of trips and number of activity types per respondent per day for samples with different survey durations. The first sample contained 14 days of observation per respondent. The second sample contained the observations of only the first seven days in which these respondents participated in the survey. The third sample contained the first three days of participation for each respondent, and finally, the fourth sample contained the first three weekday observations for each of these respondents. Figure 32

71
presents the levels of intra-personal variability found in each of these datasets for number of trips and number of activity types per respondent per day.
Figure 32. Intra-personal variability in different survey durations.
The first finding of this variability analysis is the very high level of intra-personal
variability observed in all datasets. Figure 32 shows that, except for the number of activity types in the three-day dataset, the part of variability due to differences in behavior within the same individual is larger than that due to differences among distinct individuals. Looking at the levels of intra-personal variability that the different datasets captured, it is seen that these levels increase as the number of data collection days increases, that is, the longer the dataset, in terms of number of days, the more intra-personal variability captured. Within the two datasets which contain three days of data, the weekday only and the weekday or weekend, Figure 32 reveals that the weekday dataset presents a higher degree of intra-personal variability, especially regarding number of activity types per day.
In fact, the decrease in survey duration affected the number of activity types captured per person per day to a larger extent than the trip rate. This result reveals that day-to-day variations and personal preferences or contexts affected the types of activities an individual performed more than the number of trips. Even though the trip rate is more stable over the duration of the survey, its largest intra-personal variability loss is witnessed in the shift from the 14-day to the 7-day dataset. This indicates that a considerable degree of day-to-day variability cannot be attributed to day of the week effects.
In the analysis here presented, number of trips and number of activity types are used as general indicators of activity-travel attributes, and considering these two measures, significant gains in behavioral variability are achieved with a two-week survey period when compared to a one-week or less survey period. The analysis of other activity-travel attributes such as travel time, travel distance, departure time and arrival times, route and destination choices would provide a closer insight of the effects of multi-day surveys in capturing behavioral variability. However, it is not only in terms of variability that a longer survey duration is advantageous. Stopher et al. (2008) demonstrated that smaller multi-day samples may be used to achieve the same level of precision in parameter estimates as larger one-day samples. For example, those authors estimated that a "7-day survey using GPS would reduce the sample size to 35% of a one-day survey, and that a 15-day GPS survey would reduce the needed sample to 28% of the one-day survey sample size." Therefore, the need for a smaller sample size can offset the extra costs associated with multi-day surveys, such as potential lower
0%
10%
20%
30%
40%
50%
60%
70%
80%
90%
100%
Number of trips per person per day
Number of activity types per person per day
Intr
a-pe
rson
al v
aria
bilit
y
14-Day
7-Day
3-Weekday
3-Day
Sample:

72
response rates and frequent use of financial incentives for participation. This is especially true for GPS surveys like the one here presented, where the cost of equipment deployment and respondent training and assistance are significantly higher than that found in pen-and-paper surveys. For this reason, in the case of GPS surveys similar to this one, it is likely that a one-day duration would be extremely inefficient in terms of cost. Aside from the potential cost savings, multi-day surveys may provide other types of efficiency gains. In this study, the number of refusals to answer survey questions, evaluated through the missing value index, decreased over the duration of this survey, denoting that the more complete activity-travel data was collected as the survey progressed (note that the activity and trip rates remained stable). Simultaneously, the time respondents spent answering the questionnaires also diminished as the days on the survey progressed (refer to Figure 6, Section 5), revealing that respondents became more efficient answering the survey; they went through approximately the same number of questionnaires and skipped less questions, in less time. This assessment does not provide an ideal duration for an activity-travel survey, but it does indicate that a two-week duration generates significant gains in variability within the data collected and the respondents’ performance in taking the survey. The research team did not analytically evaluate cost efficiency, but believes that cost efficiency is likely achieved from a smaller sample size, especially given costs of equipment deployment and respondent training and assistance. It is likely that a one-day strategy for this survey would have been cost prohibitive. For all of these reasons, multi-day surveys appear to be an effective strategy for collecting activity-travel data. The next section summarizes this study’s findings on elderly activity-travel behavior and decision-making processes as well as implementation of prompted recall online GPS surveys and its implications for travel survey methods and transportation planning for the elderly.

73
CHAPTER 7 CONCLUSIONS
This study’s research team implemented a two-week prompted recall GPS activity-travel survey over the internet in the most populous parts of Northeastern Illinois. Through this survey, they collected traditional activity-travel diary data such as activity type, location, people involved, travel time, travel mode, and decision-making processes on activity and travel planning. One hundred and one households participated in this survey; 50 households had respondents that were 65 years-old and older and 51 households had respondents that were younger than 65 years-old. Out of these households, 54 elderly people and 58 non-elderly people participated in this study. The research team then presented an assessment of the quality of the data collected from these people and preliminarily analyzed the results.
Implementation of this innovative internet-based, prompted recall survey method using GPS technology proved that, although some challenges were faced, this type of survey is an effective mode for travel surveying. Online prompted recall surveys offered respondents the flexibility to answer the survey at the time and location of their convenience. The display of clear and organized maps linked to activity pattern timelines provided an intuitive means to prompt individuals about details of their activity-travel patterns. Online GPS surveys also made data processing and analysis very expeditious. On the other hand, the required extra equipment and the added complexities associated with manipulating this equipment was a downside that adversely impacted response rates, particularly among the elderly.
Respondent recruitment was conducted by sending invitations and informational materials followed by phone calls. A recruiter assignment similar to that of the tailored interviewer was adopted, with the purpose of increasing rapport between survey worker and respondent, thus facilitating the survey process. In this strategy, only one person contacted each respondent through all the phases of this survey, which included recruitment, training, and assistance. Given the need to manipulate survey equipment, this person personally trained respondents on the steps required for survey completion, and, in many cases, further in-person assistance was needed, especially among individuals less familiar with computers. The necessity for these meetings was a factor that increased survey burden and implementation costs. Experimenting with different methods for respondent training and assistance to possibly reduce implementation costs and increase respondent convenience, therefore, is an appealing item for future work. Online demonstration videos might effectively serve this purpose. The assessment on the quality of the collected data reveals that this implementation effort was advantageous. Besides the challenge posed by a low overall average response of 6.48% with a cooperation rate of 10.66%, which may well be considered satisfactory given the commitment level associated with participation, all other data quality indicators yielded unquestionably satisfactory results. The average number of active days in the survey, i.e., those days when activity-travel data was collected (not including immobile days), was 11.1 days, with a standard deviation of 5.7 days. Sample bias was measured regarding gender, sex, age, household size, income, and vehicle availability. The RMSE was 57.24% for the elderly subset and 38.25% for the non-elderly subset. The characteristic that most contributed to the RMSE’s inflation was income distribution among the elderly and age and race distributions among the non-elderly. The respondents’ geographic distribution satisfactorily matched that of Census 2000. The survey capability of warning respondents about unanswered questions before survey submission contributed to the achievement of a missing value index of 5.10%. Together with below average non-mobility rates and above average trip rates, these results likely indicate good data quality. An assessment of respondents' feedback about their survey experience reveals that this type of survey has great potential for survey periods longer than two weeks. Since the daily

74
time necessary to complete this survey was one of the largest sources of respondent dissatisfaction, respondent burden can be significantly reduced by shortening daily survey length and thus potentially allowing the survey period to be extended over two weeks. Data mining techniques such as sequential associative mining are a powerful tool that can be used for this purpose. The survey fatigue and conditioning analysis moreover demonstrates that these are minimal effects and do not pose a threat to the quality of this type of longer duration survey, thus warranting application of similar methodologies to future endeavors. An assessment of the collected data’s variability, considering subsets with different survey durations, reveals that the two-week duration implied that the dataset captured significant gains on intra-personal variability. When compared to a one-week survey duration, the two-week duration captured 10% more intra-personal variability in the daily number of trips and 14% more variability concerning number of activity types performed per day. Besides the gains in data variability, the longer survey duration also provided cost efficiency gains because it required a decreased sample when compared to one-day surveys. Consequently, costs with equipment deployment and retrieval and respondents' training and assistance also decreased. The analysis of activity and trip attributes reveals that this survey’s results were consistent with previous findings which demonstrated that GPS surveys have improved ability to capture trips that are frequently under-reported in other survey types. Comparing results with those obtained in the CMAP Travel Tracker Survey 2008 (CMAP, 2009), a major activity-travel survey in the study area, shows that almost all types of activities were found at a higher rate in this study. Average automobile and bus speeds were significantly higher and more short duration trips were observed, leading to overall lower average total daily travel times. This result corroborates previous studies, which indicated that self-reported surveys overstate travel times (Batelle, 1997). The preliminary analysis of the decision-making process data reveals that planning horizons and flexibilities presented both similarities and disparities depending on the individual’s age group. Overall, elderly individuals tended to make less routine and more pre-planned decisions regarding activity-travel attributes, while younger individuals were more prone to routine and impulsive decisions. Nevertheless, same day, routine, and impulsive decisions collectively represented the majority of decisions for both age groups. Decisions regarding activity-travel attributes, such as timing, people involved, and travel mode were made in many cases with planning for the activity itself, which shows that these activity-travel attributes and activity engagements are often deeply intertwined. In considering decisions about engaging in an activity, the elderly are less prone to make spur of the moment decisions and much more likely to plan their activities, especially when it comes to longer term planning. However, activity type plays an important role in planning horizons. For example, leisure/entertainment activities and eating meals outside the home were more routine for the elderly than for the non-elderly population. On the other hand, for the elderly, most shopping was planned at least earlier in the day, but for the non-elderly, shopping is in most part an impulsive activity. Regarding activity location, both age groups demonstrated high inflexibility in their choices: respondents considered that they had only one choice for activity location over 80% of the time, primarily based on routine. This reveals that in most cases individuals associate a specific location with an activity and if they are going to perform this activity, it will be at that location. It is important to notice that the flexibility revealed here is related to individual’s actual consideration of location choices, not the universe of locations available. Activity start time and duration were more flexible than location, with start time being less flexible than duration. While many decisions on activity start time were made with activity engagement, duration is mostly decided during activity execution. Elderly individuals are less flexible when it comes to activity start time and duration. Elderly individuals remarkably perform

75
activities alone less frequently. This disparity is compensated with more activities performed with family - and to a lesser extent with friends - from the part of the elderly. Because of the prevalence of auto-drive trips, the single most important factor affecting mode choice on a trip is whether a mode was already in use in a previous trip in the same tour. Excluding trips that were constrained by previous use of a specific mode, overall convenience was the most important factor on mode choice, accounting for more than half of the cases. After convenience, the lack of alternatives was the second most frequent reason for mode choice, accounting for almost one third of decisions. This result reveals that, for both age groups, the level of flexibility regarding mode choice is low because of the unavailability of alternatives known to travelers. Once again, as in the analysis of location choice, this flexibility is related to the actually considered alternative travel modes. An individual may have had other modes to choose from but was unaware of it or unwilling to consider it. When only one mode choice was available or known, it was either driving or riding in an automobile in 95% of these cases. Auto-passenger mode was more frequently chosen for being the only option available for the elderly than for younger individuals, reflecting a certain level of dependency by the elderly on others to fulfill their mobility needs. Along with the finding on the low level of flexibility on mode choice, this result brings up the need to provide and inform people about public transit services that they may consider as an alternative for automobile use. This study’s findings suggest that overall convenience – a balance between cost, travel time, ubiquity, etc. – is more important for mode choice than any isolated factor (e.g. cost or travel time) by itself. Therefore, transit services should consider a balance of these attributes to attract more travelers. For the elderly, important factors to be added to convenience are ease of boarding and access and service to locations where most of their activities are performed (e.g. shopping areas, restaurants, and areas for recreation, entertainment and social gatherings.) For route choice, travel time was the primary decision factor, supporting nearly 60% of decisions. The analysis of tour formation characteristics reveals that, as expected, younger individuals performed more tours overall than older ones (1.38 versus 1.29 tours per person per day). However, similarly to the findings of Golob and Hensher (2007), this study found that when it comes to tours involving multiple stops, the elderly generally engaged in complex tours with more stops. Elderly men had a higher average number of complex tours per day than their younger counterparts, reinforcing the theory that the elderly are more prone to trip chaining. For women, a different result was found. The number of stops per complex tour was 5% higher for elderly women, but the number of complex tours per day was slightly lower (less than -1%) than for their younger counterparts. Nonetheless, this study shows that activity type was a vital factor for trip chaining regardless of age. For example, most religious/civic and work activities occurred in simple tours or as first stops in complex tours for both age groups. On the other hand, household errands and pick-ups/drop-offs were rarely performed as the single activity in a tour. Beyond differing in quantity and average number of stops, elderly tours also differed in temporal distribution. The elderly generally started their tours later in the day than the non-elderly and ended them earlier. Similarly to Noland and Thomas (2007), this study found that elderly complex tours were more concentrated on Mondays, while non-elderly tours peaked at the end of the week. However, this study found a similar peak in the quantity of elderly complex tours on Fridays. Exclusively considering tours with multiple stops, this study reinforces previous findings that impulsive activities were more likely to be seen later in the tour (Lee and McNally, 2004). This is especially true for the elderly, who preferred to perform their preplanned activities as early as possible in the tour, leaving impulsive actions until after they honored their previous commitments. For the non-elderly, impulsive activities still represented a significant part of first

76
stops in complex tours. Concerning people involved in activities, complex tours comprised more activities performed with other individuals than simple tours. This is true for both age groups; however, the disparity was greater among the elderly. Advanced age also seemed to affect mode choice in complex and simple tours. The elderly tended to make more complex tours when traveling as auto-passengers and less when driving, while for younger individuals, travel mode did not appear to be closely related to tour complexity. Similarly, tour complexity affected the planning horizon for travel mode more for the elderly than their younger peers. While the importance of routine mode choices and plans made concurrently with the activity itself varied little from simple to complex tours among the non-elderly, among the elderly these planning strategies varied significantly. Routine mode choice was approximately 35% more common in elderly simple tours than complex tours, whereas mode choice planning concurrently with activity planning accounted for almost a half of elderly complex tour mode planning. Elderly activities generally had shorter durations than those for the non-elderly. For both age groups, though, activities lasting up to 15 minutes were more than twice as common in complex tours than in simple tours. These short and frequently impulsive activities were more likely performed either when the individual left home or returned. In the case of the elderly, it was more likely performed in the trip back home. A brief look at the spatial distribution of trips and activities revealed no remarkable distinction between the dispersion patterns observed in the two age groups, besides that due to the respondents’ residential location. The predominance of auto-drive trips was evident, particularly in the suburban areas. Contrastingly, in downtown Chicago, a significant amount of trips appeared to have been made by other modes than automobile. Surprisingly, retired individuals generally appeared to have made a similar amount of trips and activities in downtown Chicago when compared to all other individuals. More in-depth analysis of the data collected, especially data about the activity planning process, will increase understanding of activity-travel formation, planning processes, and the differences in travel behavior between the older and younger populations. The data collected may also be used to develop and calibrate activity/travel scheduling models, or for further GIS analysis, looking at mode swift potential (vehicle trips that could be conducted by transit) or analyzing perceived shortest routes versus actual shortest routes. Nevertheless, the results presented here will hopefully shed some light on the differences and similarities of elderly activity-travel behavior in relation to the rest of the population, as well as document the implementation strategies adopted in this innovative and yet experimental survey type.

77
REFERENCES Al-Jammal, R. and J. Collura (2007). For how long and how quickly do different groups chain their fixed activities? Proceedings of the 86th Annual Meeting of the Transportation Research Board, January, 2007. Alsnih, R., D.A. Hensher (2003). The mobility and accessibility expectations of seniors in an aging population. Transportation Research Part A, Vol.37, Elsevier, Oxford, pp.903-916. Arentze, T., H. Timmermans (2003). A learning-based transportation oriented simulation system. Transportation Research Part B: Methodological, Vol.38, Elsevier, Oxford, pp.613-633. Arentze, T., H. Timmermans, D. Janssens and G. Wets (2006). Modeling Short-term Dynamics in Activity-Travel Patterns: from Aurora to Feathers. Paper presented at the Innovations Travel Modeling Conference Austin, TX, May 2006. Arentze, T., H. Timmermans, P. Jorritsma, M.J.O. Kalter, A. Schoemakers (2008). More grey hair – but for whom? Scenario-based simulations of elderly activity-travel patterns in 2020. Transportation, 35, Springer Netherlands, Dordrecht, pp.613-627. Asakura, Y., E. Hato, Y. Nishibe, T. Daito, J. Tanabe and H. Koshima (1999). Monitoring travel behavior using PHS based location positioning service system. 6th ITS World Congress, Toronto. Auld, J., C. Williams, A.K. Mohammadian and P. Nelson (2009). An automated GPS-based prompted recall survey with learning algorithms. Transportation Letters: the International Journal of Transportation Research, No.1, Ross Publishing, New York, pp.59-79. Auld, J., A.K. Mohammadian (2009). ADAPTS: Agent-based Dynamic Activity Planning and Travel Scheduling Model – a Framework. Proceedings of the 88th Annual Meeting of the Transportation Research Board, January 11-15, 2009. Axhausen, K.W., Zimmermann, A., Schönfelder, S., Rindsfüser, G. Haupt, T. (2002). Observing the rhythms of daily life: a six-week travel diary. Transportation, 29, Springer Netherlands, Dordrecht, pp.95-124. Axhausen, K.W., M. Lochel, R. Schulich, T. Buhl and P. Widmer (2007). Fatigue in long-duration travel diaries. Transportation, Vol.34, Springer Netherlands, pp.143-160. Bachu, P.K., T. Dudala, S. Kothuri (2001). Prompted Recall in Global Positioning System Survey. In Transportation Research Record: Journal of the Transportation Research Board, No. 1768, Transportation Research Board of the National Academies, Washington, D.C., pp.106-113. Battelle Transport Division (1997). Lexington Area Travel Data Collection Test. Final report prepared for the Federal Highway Administration. Bell, W., W. Olsen (1974). An Overview of Public Transportation and the Elderly: New Directions for Social Policy. The Gerontologist, Vol.14, No.4, Oxford Journals, Oxford, pp.324-330.

78
Bradley, M. (2006). Process data for understanding and modeling travel behaviour. In: Travel Survey Methods – Quality and Future Directions (P.R. Stopher and C.C. Stecher, eds), 491-510, Elsevier, Oxford. Bricka, S. (2006). Scheduling considerations in household travel surveys. In: Travel Survey Methods – Quality and Future Directions (P. R. Stopher and C. C. Stecher, eds), 175-200, Elsevier, Oxford. Bricker, L. (2009). A driving need: elderly face limited options to get around. Boston Herald, <http://www.bostonherald.com/news/national/northeast/view/20090816a_driving_need_elderly_face_limited_options_to_get_around/srvc=home&position=recent >. Last modified Aug. 16, 2009. Accessed on Aug. 18, 2009. Brög, W., A.H. Meyburg, P.R. Stopher, M.J. Wermuth (1983). Collection of household travel and activity data: development of a survey instrument. In: Ampt, E.S., Richardson, A.J., Bro¨ g, W. (Eds.), New Survey Methods in Transport. VNU Science Press, pp. 151–172. Cambridge Systematics (2007). PSRC 2006 household activity survey analysis report: final report. Puget Sound Regional Council, April 2007. Casas, J. and C. Arce (1999). Trip reporting in household travel diaries: a comparison to GPS collected data. Proceedings of the 78th Annual Meeting of the Transportation Research Board, January, 1999. Washington, D.C. CATS (1962). Chicago Area Transportation Study. Final Report Vol.III: Transportation Plan. Study director: J.D. Carroll Jr., April, 1962. Chicago. Centers for Disease Control and Prevention (CDC) (2009). Older adult drivers: fact sheet. <http://www.cdc.gov/MotorVehicleSafety/Older_Adult_Drivers/adult-drivers_factsheet.html>. Last modified on Jan. 26, 2009. Accessed on Aug. 19, 2009. Collia, D.V., Sharp, J., Giesbrecht, L. (2003). The 2001 national household travel survey: a look in the travel patterns of older Americans. Journal of Safety Research, 34, National Safety Council, Washington, D.C., pp.461-470. Coulmas, F. (2008). Population decline and aging in Japan – the social consequences. Routledge, New York. Clark, A.F. and S.T. Doherty (2008). Examining the Nature and Extent of the Activity-travel Preplanning Decision Process. Proceedings of the 87th Annual Meeting of the Transportation Research Board, January 13-17, 2008. Washington, D.C. Clark, A.F. and S.T. Doherty (2009). Activity rescheduling strategies and decision processes in day-to-day life. Proceedings of the 88th Annual Meeting of the Transportation Research Board, January 11-15, 2009. Washington, D.C. CMAP (2009). Household travel and activity inventory: Travel Tracker Survey. Chicago Metropolitan Agency for Planning. <http://www.cmap.illinois.gov/TravelTrackerData.aspx?ekmensel=c580fa7b_8_16_8798_6>. Accessed Dec. 7, 2009.

79
Cutler, S., R. Coward (1992). Availability of Personal Transportation in Households of Elders: Age, Gender, and Residence Differences. The Gerontologist, Vol.32, No.1, Oxford journals, Oxford, pp.77-81. Dobbs, B.M. (2005). Medical conditions and driving: a review of the literature (1960-2000). National Highway Safety Administration, Washington, D.C. Dellinger AM, Kresnow Mj, White DD, Sehgal M. Risk to self versus risk to others: How do older drivers compare to others on the road? American Journal of Preventive Medicine 2004, 26 (3), pp. 217–21. Doherty, S.T. and E.J. Miller (2000). A Computerized Household Activity Scheduling Survey. Transportation, 27, Springer Netherlands, Dordrecht, pp. 75-97. Doherty, S.T., E. Nemeth, M. Roorda and E. Miller (2004). Design and Assessment of the Toronto Area Computerized Household Activity Scheduling Survey. Transportation Research Record: Journal of the Transportation Research Board, No.1926, Transportation Research Board of the National Academies, Washington, D.C., pp.140-149. Draijer, G., N. Kalfs and J. Perdok (2000). Global positioning system as data collection method for travel research. Transportation Research Record: Journal of the Transportation Research Board, No.1719, Transportation Research Board of the National Academies, Washington, D.C., pp.147-153. Ettema, D., A. Borgers, H. Timmermans (1993). Using interactive computer experiments for investigating activity scheduling behaviour. Proceedings of PTRC 21st Summer Annual Meeting, University of Manchester,Vol. P366, pp.267-282. Ettema, D., A. Borgers, and H. Timmermans (1995). Competing risk hazard model of activity choice, timing, sequencing, and duration. Transportation Research Record: Journal of the Transportation Research Board, No.1493, Transportation Research Board of the National Academies, Washington, D.C., pp.1–11. Ettema, D., A. Borgers, H. Timmermans (1996). SMASH (Simulation Model of Activity Scheduling Heuristics): some simulations. Transportation Research Record: Journal of the Transportation Research Board, No.1551, Transportation Research Board of the National Academies, Washington, D.C., pp.88-94. Evans, L. (2000). Risks older drivers face themselves and threats they pose to other road users. International Journal of Epidemiology, 29, Oxford Journals, Oxford, pp.315-322. Faquhar, M. (1995). Elderly people’s definition of quality of life. Social Science & Medicine, Vol.41, No.10, Elsevier, Oxford, pp.1439-1446 FHWA (2006). Highway Statistics 2006; Section III: Drivers Licensing. Table: Licensed drivers, by sex and percentage in each age group. Federal Highway Administration, Washington, D.C. <http://www.fhwa.dot.gov/policy/ohim/hs06/driver_licensing.htm>. Accessed on Aug. 18, 2009. FHWA (2007). The transportation planning process: key issues. Report FHWA-HEP-07-039. Federal Highway Administration and Federal Transit Administration, Washington, D.C

80
Forrest, T. and D. Pearson (2005). Comparison of trip determination methods in household travel surveys enhanced by GPS. Transportation Research Record: Journal of the Transportation Research Board, No.1917, Transportation Research Board of the National Academies, Washington, D.C., pp.63-71. Golob, T.F. and H. Meurs (1986). Biases in response over time in a seven-day travel diary. Transportaiton, 13, Martinus Nijhoff Publishers, Dordrecht, pp.163-181. Golob, T.F., and D.A. Hensher (2007). The trip chaining activity of Sydney residents: a cross-section assessment by age group with a focus on seniors. Journal of Transport Geography, 15, Elsevier, Oxford, pp.298-312. Guensler, R. and J. Wolf (1999). Development of a handheld electronic travel diary for monitoring individual tripmaking behavior. Proceedings of the 78th Annual Meeting of the Transportation Research Board, January, 1999. Washington, D.C. Hanson, P. (1977) The activity patterns of elderly households. Geografiska Annaler, Series B, Human Geography, Vol.59, No.2, Swedish Society for Anthropology and Geography, Stockholm, pp.109-124. Hanson, S. and J.O. Huff (1988). Systematic variability in repetitious travel. Transportation, 15, Springer Netherlands, Dordrecht, pp. 111-135. Hato, E. and Y. Asakura (2001). New approaches for collecting time-space activity data. Proceedings of the 80th Annual Meeting of the Transportation Research Board, January, 2001. Washington, D.C. He, W., M. Sengupta, V.A. Velkoff and K.A. DeBarros (2005). 65+ in the United States: 2005. Current Population Reports, P23-209, U.S. Census Bureau, Washington D.C. Hensher, D. and A. Reyes (2000). Trip chaining as a barrier to the propensity to use public transportation. Transportation, Vol.27, No.4, Springer Netherlands, Dordrecht, pp.341-361. Hibino, N., A. Okada, K. Ohno (2007). Urban Transportation Demand Based on Travel Behavior of Elderly People in Japan. Proceedings of the 11th World Conference on Transport Research, June, 2007, Berkeley. Hjälmdahl, M. and T. Dukic (2007). ITS to improve speed behaviour for truck drivers: short term effects of a speed support system. Proceedings of the Road Safety on Four Continents: 14th International Conference, November, 2007. Bangkok, Thailand. Hough, J.A., C. Xinyu, S.L. Handy (2008). Exploring Travel Behavior of Elderly Women in Rural and Small Urban North Dakota: An Ecological Modeling Approach. Transportation Research Record: Journal of the Transportation Research Board, No.2082, Transportation Research Board of the National Academies, Washington, D.C., pp.125-131. Jones, P.M. (1979). HATS: A technique for investigating household decisions. Environment and Planning A, 11 (1), Pion, London, pp. 59-70. Jones, P.M., M. Bradley and E. Ampt (1987). Forecasting household response to policy measures using computerised acitivity-based stated preference techniques. Proceedings of the 1987 Conference on Travel Behaviour, Aix-en-Provence.

81
Krizek, K. (2003). Neighborhood services, trip purpose, and tour-based travel. Transportation, Vol.30, No.4, Springer Netherlands, Dordrecht, pp.387-410. Kuhnimhof, T.G., B., Chlond, Zumkeller, D. (2006). Nonresponse, Selectivity, and Data Quality in Travel Surveys: Experiences from Analyzing Recruitment for the German Mobility Panel. In Transportation Research Record: Journal of the Transportation Research Board, No. 1972, Transportation Research Board of the National Academies, Washington, D.C., pp.29-37. Kurth, L.D., J.L. Coin and M.J. Brown (2001). Assessment of Quick-Refusal and No-contact Nonresponse in Household Travel Surveys. In Transportation Research Record: Journal of the Transportation Research Board, No. 1768, Transportation Research Board of the National Academies, Washington, D.C., pp.114-124. Langlois, J., P.M. Keyl, J.M. Guralnik, D.J. Foley, R.A. Marottoli and R.B. Wallace (1997). Characteristics of older pedestrians who have difficulty crossing the street. American Journal of Public Health, Vol.87, No.3, American Public Health Association, Washington, D.C., pp.393-397. Lee, M.S., R. Sabetiashraf, S.T. Doherty, C.R. Rindt and M.G. McNally (2001). Conducting an interactive survey of household weekly activities via internet: preliminary results from a pilot study. Center for Activity System Analysis. Paper UCI-ITS-AS-WP-01-1. <http://repositories.cdlib.org/itsirvine/casa/UCI-ITS-AS-WP-01-1/>. Lee, M.S., M.G. McNally (2003). On the structure of weekly activity/travel patterns. Transportation Research Part A: Policy and Practice, 37, Elsevier, Oxford, pp.823-839. Lee, Y., M. Hickman and S. Washington (2007). Household type and structure, time-use pattern and trip-chaining behavior. Transportation Research Part A: Policy and Practice, 41, Elsevier, Oxford, pp.1004-1020. Lee-Gosselin, M. (1990). The dynamics of car use patterns under different scenarios: a gaming approach. In: Developments in Dynamic and Activity-based Approaches to Travel Analysis (P.M. Jones, ed.), Gower Press, Aldershot, pp. 251-271. Li, Z.J. and A.S. Shalaby (2008). Web-based GIS system for prompted recall of GPS-assisted personal travel surveys: system development and experimental study. Proceedings of the 87th Annual Meeting of the Transportation Research Board, January, 2008, Washington, D.C. Lyman, J.M., G. McGwin, R.V. Sims (2001). Factors related to driving difficulty and habits in older drivers: high-risk conditions and locations. Accident Analysis and Prevention, 33, Elsevier, Oxford, pp.413-421. Madre, J.-L., K.W. Axhausen and W. Brög (2007). Immobility in travel diary surveys. In Transportation, Vol.34, Springer, Netherlands, pp.107-128. Marca, J. E. (2002). The design and implementation of an on-line travel and activity survey. Center for Activity System Analysis. Paper UCI-ITS-AS-WP-02-1. <http://repositories.cdlib.org/itsirvine/casa/UCI-ITS-AS-WP-02-1>. Mercado, R., A. Páez (2009). Determinants of distance traveled with a focus on the elderly: a multilevel analysis in Hamilton CMA, Canada. Journal of Transport Geography, 17, Elsevier, Oxford, pp.65-76.

82
Mercado, R., B.K. Newbold (2009). Car Driving and Public Transit Use in Canadian Metropolitan Areas: Focus on Elderly and Role of Health and Social Network Factors. Proceedings of the 88th Annual Meeting of the Transportation Research Board, January, 2009, Washington, D.C. McGwin, G., R. Sims, L. Pulley, J.M.Roseman (2000). Relations among chronic medical conditions, medications, and automobile crashes in the elderly: a population-based case-control study. American Journal of Epidemiology, 152 (5), Oxford Journals, Oxford, pp.424-431. McLarry, J.J., A. Ståhl and S. Persich (1993). Implementation of service routes in the United States. Transportation Research Record, No.1378, Transportation Research Board of the National Academies, Washington, D.C., pp.21-27. Mohammadian, K., Rashidi, T., Takuriah, P. (2007) Effectiveness of Transit Strategies Targeting Elderly People: Survey Results and Preliminary Data Analysis. Report prepared for Illinois Center for Transportation (ICT), Illinois Department of Transportation (IDOT), ICT project R27. Chicago: University of Illinois at Chicago. Murakami, E., J. Morris and C. Arce (2003). Using technology to improve transport survey quality. In: Transport Survey Quality and Innovation (P.R. Stopher and P.M. Jones, eds), Pergamon, Oxford, pp. 499-506. Newell, G.F. (1980). Traffic flow on transportation networks. The MIT Press, Cambridge. NHTSA (2007) Traffic Safety Facts: Older Population. Traffic Safety Fact Sheet DOT HS 810 992. National Highway’s Traffic Safety Administration, Washington, D.C. NCHRP (2008). Standardized Procedures for Personal Travel Surveys. National Cooperative Highway Research Program Report 571. Transportation Research Board of the National Academies, Washington, D.C. Noland, R.B, J.V. Thomas (2007). Multivariate analysis of trip-chaining behavior. Environment and Planning B: Planning and Design, Vol.34, Pion, London, pp.953-970. Noland, R.B., J.D Schmöcker and M.G.H. Bell (2008). Trip chaining behaviour of older people: effects of medical conditions and urban form. Proceedings of the 87th Annual Meeting of the Transportation Research Board, January, 2008, Washington, D.C. NuStats (2002a). 2000-2001 California Statewide Household Travel Survey: Final Report. California Department of Transportation. June, 2002. NuStats (2002b). Pittsburgh Travel View Household Travel Survey. Southwestern Pennsylvania Corporation, Pittsburgh. NuStats (2003). Household Travel Survey Final Report of Results. East-West Coordinating Council, St. Louis. NuStats (2004a). Year 2000 post-census regional travel study, GPS study final report. Southern California Association of Governments, Los Angels. NuStats (2004b). Kansas City regional household travel survey: GPS study final report. Mid-America Regional Council, June 2004.

83
NuStats and GeoStats (2008). Chicago Regional Household Travel Inventory: Draft GPS Final Report. Prepared the Chicago Metropolitan Agency for Planning. Pas, E.I. and S. Sundar (1995). Intra-personal variability in daily urban travel behavior: Some additional evidence. Transportation, 22, Springer Netherlands, Dordrecht, pp. 135-150. Pendyala, R. (2003). Measuring day-to-day variability in travel behavior using GPS data. Final report to the Federal Highway Administration. <http://www.fhwa.dot.gov/ohim/gps/index.html>. Last modified on Jan. 31, 2003. Accessed on Dec. 13, 2009. Pendyala, R., S. Bricka (2006). Collection and analysis of behavioural process data: challenges and opportunities. In: Travel Survey Methods – Quality and Future Directions (P. R. Stopher and C. C. Stecher, eds), 511-530, Elsevier, Oxford. Pierce, B., J. Casas, G. Giaimo (2003). Estimating trip rate under-reporting: preliminary results from the Ohio household travel survey. Proceedings of the 82th Annual Meeting of the Transportation Research Board, January, 2003. Washington, D.C. Pisarki, A.E. (2003). Prescription for research: reviewing the history of TRB’s critical issues in transportation. TR News, No.226, Transportation Research Board of the National Academies, Washington, D.C., pp.31-35. Rindsfüser, G., H. Mühlhans, S.T. Doherty, K.J. Beckmann (2003). Tracing the planning and execution of activities and their attributes - design and application of a hand-held scheduling process survey. Paper presented at the 10th International Conference on Travel Behaviour Research, Lucerne. Robertson, R., W. Vanlaar (2008). Elderly drivers: future challenges? Accident Analysis and Prevention, 40, Elsevier, Oxford, pp.1982-1986. Roorda, M.J., E.J. Miller, K.M.N. Habib (2008). Validation of TASHA: a 24-h activity scheduling microsimulation model. Transportation Research Part A: Policy and Practice, 42 (2), 360-375, Elsevier, Oxford. Roorda, M., A. Páez, C. Morency, R. Mercado and S. Farber (2009). Trip Generation of Vulnerable Populations in Three Canadian Cities: Spatial Ordered Probit Approach. Proceedings of the 88th Annual Meeting of the Transportation Research Board, January, 2009, Washington, D.C. Rosenbloom, S. (2001). Sustainability and automobility among the elderly: an international assessment. Transportation, 28, Springer Netherlands, Dordrecht, pp.375-408. Rosenbloom, S. (2003). The mobility needs of older Americans: implications for transportation reauthorization. The Brookings Institution, Washington, D.C. Rosenbloom, S., S. Herbel (2009) The Safety and Mobility Patterns of Older Women. Public Works Management and Policy, Vol.13, No.4, Sage, Thousand Oaks, pp.338-353. Rye, T., W. Mykura (2007) Concessionary Bus Fares for Older People in Scotland ? Are They Achieving Their Objectives? Proceedings of the 11th World Conference on Transport Research, June, 2007, Berkeley.

84
Schonfelder, S., J. Rich, O.A. Nielsen, C.J. Wurtz, K.W. Axhausen (2007). Road Pricing and its Consequences for Individual Travel Patterns. Mobilities, Vol.2, No.1, Routledge, London, pp.75-98. Spinney, J.E.L., D.M. Scott and K.B. Newbold (2009). Transport mobility benefits and quality of life: a time-use perspective of elderly Canadians. Transport Policy, Vol.16, Elsevier, Oxford, pp.1-11. Ståhl, A. (1992). Mobility and accessibility for elderly and disabled people in Sweden. IATSS Research, Vol.16, No.2, International Association of Traffic and Safety Sciences, Suzuka, pp.96-97. Stirner, F. (1978). Transportation: The Transportation Needs of the Elderly In a Large Urban Environment. The Gerontologist, Vol.18, No.2, Oxford Journals, Oxford, pp.207-211. Stopher, P.R. and A. Collins (2005). Conducting a GPS prompted recall survey over the internet. Proceedings of the 84th Annual Meeting of the Transportation Research Board, January, 2005. Washington, D.C. Stopher, P.R and S.P. Greaves (2007). Household travel surveys: where are we going? Transportation Research Part A, 41, Elsevier, Oxford, pp.367-381. Stopher, P.R., Kockelman, K., Stephen, G.P. and Clifford, E. (2008). Reducing burden and sample sizes in multi-day household travel surveys. In Transportation Research Record: Journal of the Transportation Research Board, No. 2064, Transportation Research Board of the National Academies, Washington, D.C., pp.12-18. Szalai, A. (1972). Design specifications for the surveys. In The Time Use, A. Szalai, Ed. Mouton Press, The Hague. Texas Department of Transportation (2003). Tyler/Longview household travel survey documentation. Texas Department of Transportation, Austin. Tsui, S.Y.A. and A.S. Shalaby (2006). Enhanced system for link and mode identification for personal travel surveys based on Global Positioning Systems. In Transportation Research Record: Journal of the Transportation Research Board, No. 1972, Transportation Research Board of the National Academies, Washington, D.C., pp.38-45. Turner, D., C. Giorno, A. De Serres, A. Vourc'h and P. Richardson (1998), The Macroeconomic Implications of Ageing in a Global Context, OECD Economics Department Working Papers, No. 193, OECD publishing, Paris. U.S. Census Bureau (2004). State interim population projections by age and sex: 2004 – 2030. Table 4: Interim Projections: Change in Total Population and Population 65 and Older, by State: 2000 to 2030. U.S. Census Bureau, Washington D.C. U.S. Census Bureau (2007) Annual Estimates of the Population by Sex and Selected Age Groups for the United States: April 1, 2000 to July 1, 2007. Report NC-EST2007-02. U.S. Census Bureau, Washington, D.C.

85
U.S. Census Bureau (2008) Annual Estimates of the Resident Population by Sex and Selected Age Groups for the United States: April 1, 2000 to July 1, 2008. Report NC-EST2008-02. U.S. Census Bureau, Washington, D.C. U.S. Census Bureau (2009) Aging in the United States – Present, Past, and Future. Wallchart. U.S. Census Bureau, Washington, D.C. <http://www.census.gov/ipc/prod/97agewc.pdf>. Accessed on Aug. 17, 2009. Venter, C. (2009). Transport Expenditure of Elderly, Disabled, and Poor Travelers: The Cost of Being Mobile. Proceedings of the 88th Annual Meeting of the Transportation Research Board, January, 2009, Washington, D.C. Wallace, R., D. Frank (2009). Literature review of the status of research on the transportation and mobility needs of older women. Report prepared for the National Safety Council and the National Highway Traffic Safety Administration. University of Iowa, Iowa City. Williams, C.A., Nelson, P.C. and Mohammadian, A.K. (2009). Attribute constrained rules for partially labeled sequence completion, In: Perner, P. (Ed.), Advances in Data Mining – Applications and Theoretical Aspects, LNAI 5633, Springer Verlag, Heidelberg, pp.338-352. Wolf, J., R. Guensler and W. Bachman (2001). Elimination of the travel diary: an experiment to derive trip purpose from GPS travel data. Proceedings of the 80th Annual Meeting of the Transportation Research Board, January, 2001. Washington, D.C Wolf, J. (2006). Applications of new technologies in travel surveys. In: Travel Survey Methods – Quality and Future Directions (P. R. Stopher and C. C. Stecher, eds), 531-544, Elsevier, Oxford. Xinyu, C., P.L. Mokhtarian, S.L. Handy (2008). Neighborhood Design and the Accessibility of the Elderly: Empirical Analysis in Northern California. Proceedings of the 87th Annual Meeting of the Transportation Research Board, January, 2008, Washington, D.C. Yaffe, K., D. Barnes, M. Nevitt, L.Y. Lui, K. Covinsky (2001). A prospective study of physical activity and cognitive decline in elderly women. Archives of Internal Medicine, Vol.161, No.14, American Medical Association, Chicago, pp.1703-1708. Ye, X., R.M. Pendyala and G. Gottardi (2006). An exploration of the relationship between mode choice and complexity of trip chaining patterns. Transportation Research Part B: Methodological, Vol.41, No.1, Elsevier, Oxford, pp.96-113.

86
APPENDIX A: ADVANCE MATERIAL

Figure 333. Invitational letter from
87
the Illinois D
Department oof Transporttation.

Figure 34. Invitatioonal letter fro
88
om the Unive
ersity of Illinoois at Chicag
go.

89
Figu
re35
Fron
tsid
eof
the
info
rmat
ive
Figu
re 3
5. F
ront
sid
e of
the
info
rmat
ive.

90
Figu
re 3
6. B
ack
side
of t
he in
form
ativ
e g

91
APPENDIX B: DETAILED DECISION-MAKING ANALYSIS TABLES

92
92
Table 14. Planning Horizon by Activity Type
Routine Impulsive Same day One day before Same week
More than 1 week before
Activity type Age Activi-ties Share
Activi-ties Share
Activi-ties Share
Activi-ties Share
Activi-ties Share
Activi-ties Share
Changing Transportation
>=65 7 14% 13 27% 16 33% 6 12% 3 6% 4 8% <65 19 44% 9 21% 8 19% 4 9% 3 7% 0 0%
Healthcare >=65 21 26% 6 7% 16 20% 4 5% 7 9% 27 33% <65 26 33% 6 8% 16 20% 7 9% 3 4% 22 28%
Household Errands
>=65 0 0% 17 33% 18 35% 10 19% 3 6% 4 8% <65 1 2% 31 53% 14 24% 9 15% 3 5% 0 0%
Leisure/ Entertainment
>=65 28 25% 16 14% 18 16% 11 10% 9 8% 31 27% <65 15 17% 21 24% 25 28% 10 11% 3 3% 15 17%
Meal >=65 20 12% 45 27% 44 27% 14 9% 19 12% 21 13% <65 9 6% 79 52% 37 24% 13 8% 8 5% 7 5%
Other >=65 28 24% 21 18% 27 23% 9 8% 7 6% 14 12% <65 9 7% 56 45% 20 16% 8 6% 3 2% 17 14%
Personal Business
>=65 9 7% 41 32% 31 24% 26 20% 5 4% 15 12% <65 4 4% 34 34% 32 32% 21 21% 6 6% 4 4%
Pick-up/Drop-off
>=65 15 33% 5 11% 11 24% 2 4% 8 17% 4 9% <65 28 33% 19 22% 16 19% 8 9% 7 8% 8 9%
Primary Work >=65 32 62% 10 19% 3 6% 0 0% 3 6% 3 6% <65 279 78% 20 6% 17 5% 5 1% 21 6% 12 3%
Recreation >=65 21 30% 8 11% 10 14% 10 14% 5 7% 17 24% <65 36 37% 14 14% 15 15% 10 10% 8 8% 13 13%
Religious/Civic >=65 43 42% 7 7% 15 15% 8 8% 16 16% 12 12% <65 21 45% 0 0% 4 9% 5 11% 7 15% 10 21%
Routine Impulsive Same day One day before Same week
More than 1 week before

93
Activity type Age Activi-ties Share
Activi-ties Share
Activi-ties Share
Activi-ties Share
Activi-ties Share
Activi-ties Share
School >=65 6 75% 0 0% 1 13% 0 0% 0 0% 1 13% <65 35 74% 3 6% 0 0% 1 2% 1 2% 7 15%
Services >=65 1 2% 18 28% 17 26% 12 18% 6 9% 11 17% <65 3 5% 18 33% 16 29% 11 20% 2 4% 5 9%
Shopping Grocery
>=65 5 3% 77 39% 70 35% 24 12% 17 9% 7 4% <65 12 7% 76 42% 61 33% 29 16% 4 2% 0 0%
Shopping Household
>=65 0 0% 21 36% 24 41% 9 15% 4 7% 1 2% <65 2 4% 26 46% 17 30% 7 13% 4 7% 0 0%
Shopping Major Item
>=65 0 0% 8 32% 5 20% 10 40% 1 4% 1 4% <65 0 0% 5 28% 8 44% 3 17% 1 6% 1 6%
Shopping Other >=65 7 3% 105 40% 96 37% 44 17% 7 3% 4 2% <65 3 1% 131 56% 72 31% 22 9% 3 1% 5 2%
Social >=65 7 6% 24 20% 29 24% 13 11% 19 16% 30 25% <65 18 12% 28 19% 38 26% 16 11% 14 9% 33 22%
Volunteer Work >=65 0 0% 1 6% 2 13% 5 31% 5 31% 3 19% <65 5 71% 1 14% 0 0% 0 0% 0 0% 1 14%
Work/Business >=65 0 0% 0 0% 1 33% 1 33% 1 33% 0 0% <65 3 3% 22 23% 42 44% 9 9% 4 4% 15 16%

94
Table 15. Activity Location Flexibility by Activity Type
One location Several locations Many locations
Activity type Age Activities Share Activities Share Activities ShareChanging Transportation
>=65 40 82% 9 18% 0 0% <65 37 86% 6 14% 0 0%
Healthcare >=65 67 89% 7 9% 1 1% <65 74 94% 5 6% 0 0%
Household Errands
>=65 37 71% 12 23% 3 6% <65 47 82% 10 18% 0 0%
Leisure/ Entertainment
>=65 96 86% 13 12% 2 2% <65 76 85% 13 15% 0 0%
Meal >=65 91 57% 57 36% 11 7% <65 86 57% 54 36% 12 8%
Other >=65 96 84% 16 14% 2 2% <65 101 82% 15 12% 7 6%
Personal Business
>=65 104 81% 22 17% 2 2% <65 73 73% 24 24% 3 3%
Pick-up/Drop-off
>=65 44 98% 1 2% 0 0% <65 85 99% 1 1% 0 0%
Primary Work >=65 50 100% 0 0% 0 0% <65 337 95% 15 4% 1 0%
Recreation >=65 56 80% 9 13% 5 7% <65 84 87% 8 8% 5 5%
Religious/Civic >=65 93 91% 9 9% 0 0% <65 44 94% 3 6% 0 0%
School >=65 7 88% 1 13% 0 0% <65 45 98% 1 2% 0 0%
Services >=65 52 81% 11 17% 1 2% <65 44 80% 8 15% 3 5%
Shopping Grocery
>=65 134 68% 55 28% 8 4% <65 105 58% 68 37% 9 5%
Shopping Household
>=65 35 59% 20 34% 4 7% <65 35 63% 19 34% 2 4%
Shopping Major Item
>=65 17 68% 6 24% 2 8% <65 11 61% 6 33% 1 6%
Shopping Other
>=65 160 62% 75 29% 24 9% <65 123 52% 91 38% 23 10%
Social >=65 116 96% 1 1% 4 3% <65 144 97% 4 3% 0 0%
One location Several locations Many locations

95
Activity type Age Activities Share Activities Share Activities ShareVolunteer Work
>=65 14 88% 2 13% 0 0% <65 7 100% 0 0% 0 0%
Work/ Business
>=65 3 100% 0 0% 0 0% <65 88 94% 2 2% 4 4%

96
Table 16. Activity Duration Planning Horizon by Activity Type Same planning horizon as activity
More than 1 week before
Same week
One day before
Same day
Less than 1 hr before
During the activity Routine
Do not know
Activity type Age Act.
(%)
Act.
(%)
Act. (%) Act.
(%) Act. (%) Act. (%) Act. (%)
Act. (%) Act.
(%)
Change Transportation
>=65 7 15 0 0 1 2 5 0 6 0 3 0 17 0 9 0 0 0
<65 8 19 0 0 0 0 0 0 1 0 0 0 16 0 17 0 0 0 Healthcare >=65 12 16 9 12 1 1 1 0 6 0 0 0 25 0 17 0 2 0
<65 9 12 3 4 0 0 1 1 0 0 0 0 44 56 20 26 1 1 Household Errands
>=65 14 29 1 2 0 0 0 0 2 4 1 2 24 49 7 14 0 0 <65 15 26 0 0 0 0 0 0 0 0 0 0 37 65 5 9 0 0
Leisure/ Entertainment
>=65 25 24 3 3 2 2 1 1 6 6 0 0 38 37 28 27 0 0
<65 18 20 4 4 0 0 1 1 4 4 2 2 47 53 11 12 2 2 Meal >=65 22 14 2 1 6 4 1 1 5 3 2 1 87 56 28 18 3 2
<65 37 24 1 1 0 0 0 0 4 3 6 4 94 62 7 5 3 2 Other >=65 16 14 2 2 1 1 4 4 5 4 2 2 35 31 41 37 6 5
<65 32 26 0 0 1 1 0 0 0 0 2 2 64 52 12 10 12 10 Personal Business
>=65 37 31 2 2 0 0 3 3 2 2 1 1 51 43 21 18 3 3 <65 34 34 1 1 0 0 1 1 5 5 3 3 44 44 9 9 3 3
Pick-up/Drop-off
>=65 12 27 0 0 0 0 0 0 5 11 0 0 15 33 13 29 0 0 <65 15 17 3 3 2 2 0 0 0 0 0 0 54 63 11 13 1 1
Primary Work
>=65 5 10 3 6 0 0 0 0 3 6 0 0 12 24 25 51 1 2 <65 44 13 2 1 1 0 3 1 6 2 0 0 104 30 191 54 0 0
Recreation >=65 10 16 4 6 1 2 0 0 5 8 0 0 27 42 17 27 0 0 <65 8 8 4 4 0 0 2 2 1 1 1 1 50 52 27 28 3 3

97
Same planning horizon as activity
More than 1 week before
Same week
One day before
Same day
Less than 1 hr before
During the activity Routine
Do not know
Activity type Age Act.
(%)
Act.
(%)
Act. (%) Act.
(%) Act. (%) Act. (%) Act. (%)
Act. (%) Act.
(%)
Religious/ Civic
>=65 16 16 3 3 0 0 1 1 7 7 0 0 25 26 44 45 2 2 <65 4 9 4 9 0 0 0 0 2 4 0 0 15 32 22 47 0 0
School >=65 0 0 0 0 0 0 0 0 0 0 0 0 1 13 7 88 0 0 <65 5 11 1 2 0 0 0 0 0 0 0 0 15 32 26 55 0 0
Services >=65 10 16 0 0 0 0 2 3 7 11 0 0 33 53 9 15 1 2 <65 7 13 1 2 0 0 1 2 4 7 0 0 32 58 10 18 0 0
Shopping Grocery
>=65 23 12 0 0 7 4 2 1 7 4 4 2 134 69 15 8 2 1 <65 33 18 0 0 0 0 2 1 6 3 3 2 117 65 19 10 1 1
Shopping Household
>=65 17 30 0 0 0 0 1 2 6 11 0 0 26 46 7 12 0 0 <65 12 21 0 0 0 0 0 0 0 0 3 5 39 70 2 4 0 0
Shopping Major Item
>=65 7 28 0 0 0 0 0 0 0 0 0 0 14 56 4 16 0 0 <65 3 17 0 0 0 0 1 6 1 6 1 6 12 67 0 0 0 0
Shopping Other
>=65 45 18 0 0 1 0 4 2 12 5 5 2 160 64 22 9 1 0 <65 75 32 0 0 0 0 0 0 2 1 6 3 143 61 7 3 2 1
Social >=65 21 18 4 3 2 2 1 1 13 11 1 1 67 56 10 8 0 0 <65 18 12 6 4 1 1 1 1 5 3 4 3 97 66 14 10 1 1
Volunteer Work
>=65 3 20 0 0 0 0 0 0 1 7 0 0 10 67 1 7 0 0 <65 0 0 0 0 0 0 0 0 0 0 0 0 3 50 3 50 0 0
Work/ Business
>=65 1 50 0 0 0 0 0 0 0 0 0 0 0 0 1 50 0 0 <65 65 68 6 6 1 1 0 0 0 0 0 0 16 17 7 7 0 0

98
Table 17. Persons Involved by Activity Type
Alone With Coworkers With Family
With Family-Friends With Friends
With Others General
Activity type Age Activities (%) Activities (%) Activities (%) Activities (%) Activities (%) Activities (%) Changing Transportation
>=65 27 55 0 0 16 33 0 0 2 4 4 8 <65 30 70 1 2 3 7 2 5 6 14 1 2
Healthcare >=65 41 51 0 0 23 29 0 0 6 8 10 13 <65 43 54 0 0 16 20 1 1 12 15 7 9
Household Errands
>=65 36 71 0 0 11 22 0 0 3 6 1 2 <65 33 57 0 0 19 33 0 0 1 2 5 9
Leisure/ Entertainment
>=65 16 14 0 0 31 27 11 10 26 23 29 26 <65 29 33 0 0 26 30 5 6 24 27 4 5
Meal >=65 20 12 1 1 88 54 7 4 39 24 7 4 <65 58 38 7 5 55 36 19 12 14 9 0 0
Other >=65 62 53 0 0 26 22 1 1 17 14 12 10 <65 67 54 2 2 28 23 5 4 14 11 8 6
Personal Business
>=65 69 54 2 2 50 39 1 1 2 2 4 3 <65 69 68 2 2 21 21 1 1 5 5 3 3
Pick-up/Drop-off
>=65 2 4 0 0 24 52 6 13 7 15 7 15 <65 14 16 0 0 62 73 5 6 3 4 1 1
Primary Work >=65 42 81 1 2 1 2 0 0 1 2 7 13 <65 205 58 8 2 29 8 0 0 2 1 111 31
Recreation >=65 15 21 0 0 20 28 2 3 18 25 16 23 <65 37 39 0 0 24 25 9 9 19 20 7 7
Religious/Civic >=65 5 5 1 1 28 28 8 8 10 10 48 48 <65 2 4 1 2 20 43 7 15 10 21 7 15
School >=65 2 25 0 0 0 0 0 0 0 0 6 75 <65 9 19 0 0 21 45 1 2 0 0 16 34
Alone With Coworkers With Family
With Family-Friends With Friends
With Others General

99
Activity type Age Activities (%)
Activities (%)
Activities
(%) Activities (%)
Activities (%)
Activities (%)
Services >=65 41 63 0 0 11 17 3 5 3 5 7 11 <65 26 47 0 0 13 24 0 0 10 18 6 11
Shopping Grocery
>=65 111 55 0 0 75 37 7 3 7 3 1 0 <65 125 69 0 0 46 25 0 0 9 5 1 1
Shopping Household
>=65 31 53 0 0 22 37 0 0 5 8 1 2 <65 31 55 0 0 24 43 0 0 1 2 0 0
Shopping Major Item
>=65 10 40 0 0 13 52 0 0 0 0 2 8 <65 8 44 0 0 7 39 1 6 0 0 2 11
Shopping Other
>=65 157 59 0 0 97 37 2 1 7 3 1 0 <65 142 61 2 1 70 30 4 2 12 5 4 2
Social >=65 13 11 1 1 49 40 19 16 33 27 6 5 <65 19 13 1 1 71 48 13 9 41 28 2 1
Volunteer Work
>=65 6 35 1 6 1 6 0 0 1 6 8 47 <65 3 43 0 0 0 0 1 14 1 14 2 29
Work/ Business
>=65 3 100 0 0 0 0 0 0 0 0 0 0 <65 38 40 13 14 10 11 0 0 1 1 33 35

100
Table 18. Motivation for Travel Mode Choice Most convenient
Only mode available Fastest Cheapest Safest Other
Travel mode Age Number of trips (%)
Number of trips (%)
Number of trips (%)
Number of trips (%)
Number of trips (%)
Number of trips (%)
Auto-drive >=65 322 57.8 187 33.6 40 7.2 2 0.4 1 0.2 5 0.9 <65 393 47.6 279 33.8 144 17.5 4 0.5 1 0.1 4 0.5
Auto-passenger >=65 41 47.7 36 41.9 4 4.7 0 0.0 1 1.2 4 4.7 <65 51 52.0 35 35.7 3 3.1 1 1.0 0 0.0 8 8.2
Bus >=65 17 63.0 1 3.7 5 18.5 4 14.8 0 0.0 0 0.0 <65 14 73.7 3 15.8 0 0.0 0 0.0 0 0.0 2 10.5
Light rail >=65 2 66.7 0 0.0 1 33.3 0 0.0 0 0.0 0 0.0 <65 11 91.7 0 0.0 0 0.0 1 8.3 0 0.0 0 0.0
Commuter rail >=65 0 0.0 0 0.0 0 0.0 0 0.0 0 0.0 0 0.0 <65 14 100.0 0 0.0 0 0.0 0 0.0 0 0.0 0 0.0
Multimodal >=65 0 0.0 0 0.0 0 0.0 0 0.0 0 0.0 0 0.0 <65 2 100.0 0 0.0 0 0.0 0 0.0 0 0.0 0 0.0
Taxi >=65 0 0.0 0 0.0 0 0.0 1 50.0 0 0.0 1 50.0 <65 0 0.0 2 40.0 0 0.0 0 0.0 0 0.0 3 60.0
Bicycle >=65 24 45.3 8 15.1 2 3.8 4 7.5 3 5.7 12 22.6 <65 43 54.4 14 17.7 7 8.9 5 6.3 2 2.5 8 10.1
Walk >=65 1 33.3 0 0.0 0 0.0 0 0.0 0 0.0 2 66.7 <65 0 0.0 0 0.0 0 0.0 0 0.0 0 0.0 6 100.0
Other >=65 2 100.0 0 0.0 0 0.0 0 0.0 0 0.0 0 0.0 <65 0 0.0 0 0.0 0 0.0 1 50.0 0 0.0 1 50.0