trip b-1: quantitative paleoecology of hamilton group
TRANSCRIPT
TRIP B-1 : QUANTITATIVE PALEOECOLOGY OF HAMILTON GROUP LOCALITIES IN CENTRAL NEW YORK
Trip Leaders: Willis B. Newman, James C. Brower, and Cathryn R. Newton, Syracuse University, Syracuse, NY 13244-1070.
INTRODUCTION
The Middle Devonian Hamilton Group has in recent years attracted much interest, including studies published in two volumes edited by Brett (1986) and Landing and Brett (1991). Transgressive and regressive cycles are a prominent feature of the marine sediments (e.g., Brett and Baird, 1985; Brett, Baird and Miller, 1986). The thin cycles in western New York consist of shale, calcareous shale, and limestone and are roughly symmetrical (Miller, 1986; Savarese, Gray and Brett, 1986). Approaching the source area in eastern New York, the cycles become thicker and are dominated by a regressive phase of mostly fme and coarse clastics.
This paper reviews the paleoecology of six typical regressive cycles in central New York based on quantitative multivariate techniques. The work is preliminary and more detailed studies are in preparation. Although Hamilton communities and paleoecology have been the subject of a legion of papers, most of these are qualitative. Examples can be found in the Hamilton volumes mentioned above. Papers emphasizing quantitative methods in the study of Hamilton communities include Brower (1987), Brower and Kile (1988), Brower, Thomson and Kile (1988), and Brower and Nye (1991). Other works using quantitative techniques, mostly cluster analysis, are Miller (1986), Savarese, Gray and Brett (1986) and McCollum (1991). Our analytical strategy operates in a series of steps. In the flrst stage, communities and gradients are characterized by means of various clustering and ordination algorithms. Both types of techniques are necessary because they are subject to different forms of distortion and they show different structures in the data set The communities and gradients are tested for statistical significance through a variety of approaches. Both communities and gradients are then analyzed in terms of parameters such as diversity, equitability, and trophic structure. Finally, the causal factors that generated the sequence of communities and gradients are detennined.
STATISTICAL METHODS
The data were analyzed with multivariate statistics. Several lucid textbooks dealing with this subject in ecology include Clifford and Stephenson (1975), Gauch (1982), Legendre and Legendre (1983), Pielou (1984) and Ludwig and Reynolds (1988). The basic analytical strategy follows that of Brower (1987), Brower, Thomson and Kile (1988), and Brower and Nye (1991) . First, clustering and ordination are used to identify and characterize the communities and gradients present in the data. These are tested subsequently to ascertain their statistical significance. In the fmal step, plotting the communities and gradients against geographic and stratigraphic position leads to the construction of a paleoecological model.
The data treated represent the percentages of species in samples. This results in communities that reflect a combination of fidelity and dominance. Some analyses are based on the original percents or proportions of the species in the samples. In other cases, the percentages were transformed to loge of (percent+ 1). The type of data selected depends on which follows the most linear distribution.
Both ordination and clustering methods are necessary for the recognition of faunal communities
1 70
and gradients because they are subject to different types of distortion. Ordination methods preserve the main patterns in the data, but the relationships between similar species and samples are often shown incorrectly. Clustering retains the distances between similar items, but at the cost of large-scale deformation. Computational details of the algorithms are available in the text-books listed above. Clusters were calculated by the unweighted-pair-group-method (UPGM) on matrices of various types of correlation and distance coefficients. In our study, ordination and cluster techniques yield conclusions that are similar and complementary.
Several methods were selected to test the significance of the clustering and correlations. Calculated correlations can easily be compared with a population or parametric value of zero (e.g. Legendre and Legendre, 1983). Cumulative frequency plots of correlation coefficients show patterns of correlations within clusters and within the entire data set If the linkages on a dendrogram formed purely by chance, one would expect that the correlations between species or samples within the clusters would equal those for the same items between or among clusters. This hypothesis can be treated with numerous nonparametric statistics such as the Mann-Whitney U-test
. The groups of samples recognized in the clusters and ordinations should be tested for statistical significance. We elected to employ significance tests for clusters rather than discriminant analysis because they are largely independent of the number of variables (taxa in this case) and they are less sensitive to statistical assumptions. We will briefly discuss the cluster significance hypothesis tested for the communities (see Sneath, 1977, 1979 for details). The conventional hypothesis for univariate or multivariate means ascertains whether or not the differences between them are statistically significant subject to a predetermined risk level. This is obviously trivial for groups which have been previously identified by cluster analysis; one almost invariably rejects the null hypotheses even if the two groups overlap greatly. It is much more informative to query whether the samples were drawn from two populations which overlap more or less than some specified amount. We regard communities as consistent associations of organisms which may intergrade. The communities studied here have mostly changed in response to paleoecological gradients caused by regressions. Consequently, a rectangular distribution of the data provides a reasonable null hypothesis (Sneath, 1977). The null hypothesis specifies that the two clusters are drawn from overlapping rectangular distributions. The alternate hypothesis is that the distributions of the two clusters are disjunct (see Sneath, 1979, fig. 2 for critical values).
STOP 1, ROADCUT ON SWAMP ROAD
Introduction
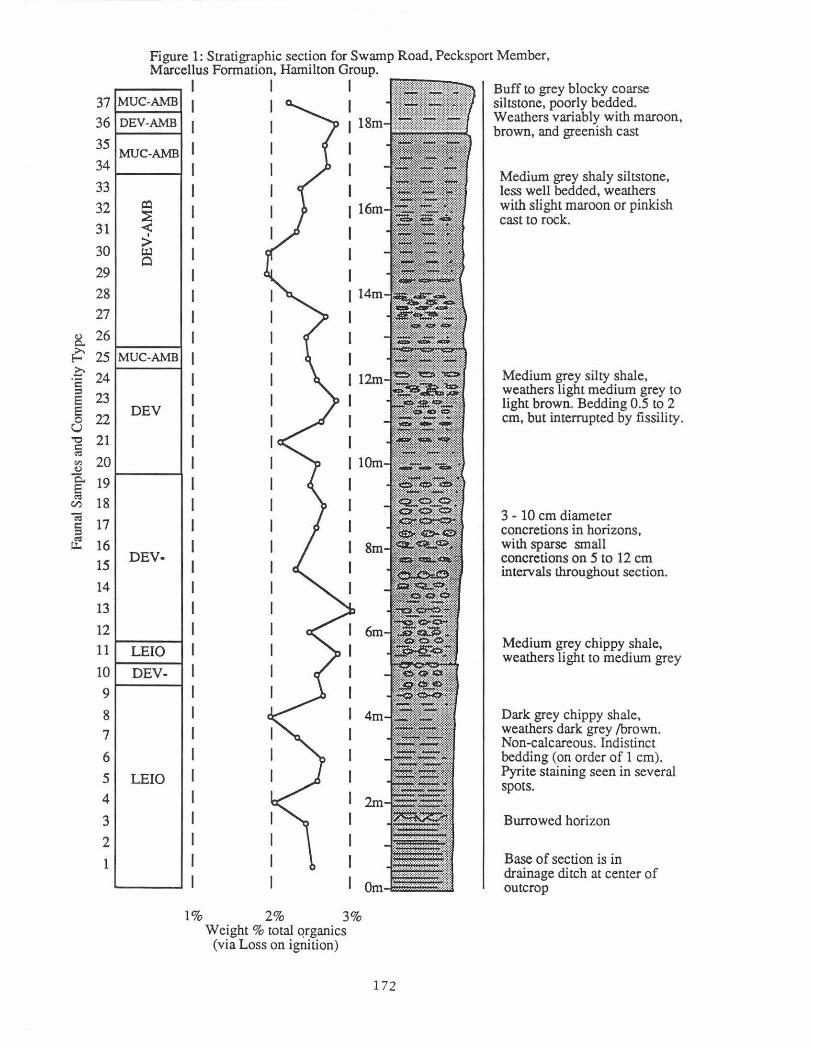
This outcrop exposes about 20m of the upper part of the Pecksport Member of the Marcellus Formation (Grasso, Brett, and Baird, 1985). The dark grey shales at the base grade into fine grey to brown coarse siltstones at the top (Fig. 1 ). Moving upwards, there is a gradual increase in species richness, adult size of the different species, proportion of epifaunal taxa, and a decrease in the abundance of deeper water taxa like Leiorhynchus and Pterochaenia.
The exceptional preservation of calcite and aragonite shells at this locality has been the focus of many studies, for example Bailey (1983) on bivalves, Rollins, Eldredge and Spiller (1971) on gastropods and monoplacophorans, Cameron (1967) on a uniquely preserved annelid worm, and Carter and Tevesz ( 1978) on the shell microstructure of various groups.
On initial qualitative examination, we recognized a Leiorhynchus-nuculid dominated community at the base, grading into a Mucrospirifer dominated assemblage in the middle which was capped by a large clam fauna at the top. Selleck and Linsley (1989) reported that "the fauna is
171
37 36 35 34 33 32
31
30 29 28 27
& 26 ~ 25 0 24 ·a ;:I
E 23 E 8 22 "'0 21 § (ll 20 ~ c. 19 E ~ 18 Cl)
-..; 17 = ;:I
£ 16 15 14 13 12 11
10 9 8 7 6 5 4 3 2
1
Figure 1: Stratigraphic section for Swamp Road, Pecksport Member, Marcellus Formation, Hamilton Group.
MUC-AMB
DEV-AMB
MUC-AMB
~ ::E < I
> l.1l 0
MUC-AMB
DEY
DEY-
LEIO
DEY-
LEIO
I I I
1% 2% 3% Weight % total qrganics
(via Loss on ignition)
172
Buff to grey blocky coarse siltstone, poorly bedded. Weathers variably with maroon, brown, and greenish cast
Medium grey shaly siltstone, less well bedded, weathers with slight maroon or pinkish cast to rock.
Medium grey silty shale, weathers light medium grey to light brown. Bedding 0.5 to 2 em, but interrupted by fissility.
3 - 10 em diameter concretions in horizons, with sparse small concretions on 5 to 12 em intervals throughout section.
Medium grey chippy shale, weathers light to medium grey
Dark grey chippy shale, weathers dark grey /brown. Non-calcareous. Indistinct bedding (on order of 1 em). Pyrite staining seen in several spots.
Burrowed horizon
Base of section is in drainage ditch at center of outcrop
dominated by the brachiopods Spinocyrtia in the upper sandier facies, and Mucrospirifer in the middle siltier layers. along with the bivalves Ptvchopteria flabellum, Gosseletia triquetra and a variety of nuculids, gastropods including Bembexia sulcomar~nata and Palaeozygopleura harniltoniae plus a variety of orthoconic cephalopods", which is also a fair qualitative statement. The preservation is deceiving. Many of the taxa possess well preserved intact or nearly intact shells composed of black calcite; these weather out and attract much attention as one searches for fossils.
More detailed sampling and quantitative analysis produces different results. The study examined 37 samples, spaced at 0.5 m intervals, consisting of 300 specimens each for a total of 11,100 individual fossils and found a very different picture. Mucrowirifer mucronatus ranges from 0 to 30 percent in any sample and does not dominate a single sample. Gosseletia triquetra yielded only 26 specimens and comprised less than 2 percent of any sample in which it was present Spinocyrtia mnulosa ranged from 0 to 4 percent of the samples. Leiorhynchus multicostum does dominate many of the lower samples found in dark shales, but Devonochonetes scitulus and Ambocoelia umbonata are more common in the higher samples.
Cluster analysis
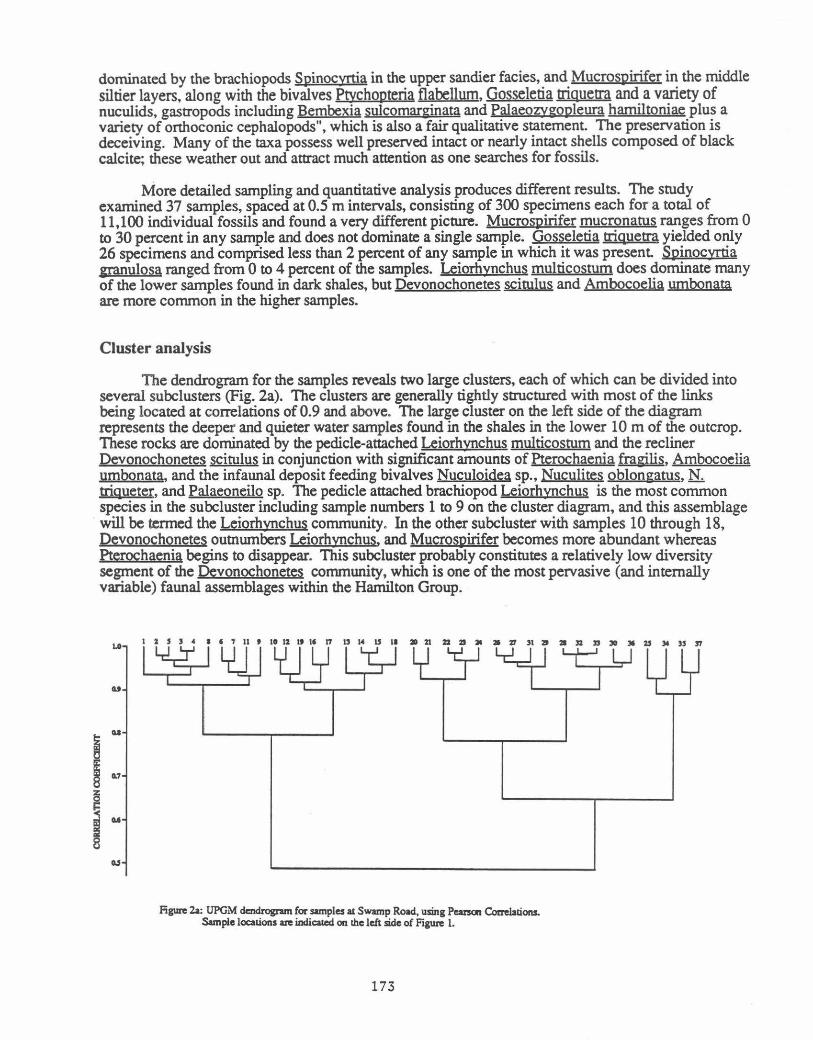
The dendrogram for the samples reveals two large clusters, each of which can be divided into several subclusters (Fig. 2a). The clusters are generally tightly structured with most of the links being located at correlations of 0.9 and above. The large cluster on the left side of the diagram represents the deeper and quieter water samples found in the shales in the lower 10m of the outcrop. These rocks are dominated by the pedicle-attached Leiorhynchus multicostum and the recliner Devonochonetes scitulus in conjunction with significant amounts of Pterochaenia fragilis, Ambocoelia umbonata. and the infaunal deposit feeding bivalves Nuculoidea sp., Nuculites oblongatus, N. triqyeter, and Palaeoneilo sp. The pedicle attached brachiopod Leiorhynchus is the most common species in the subcluster including sample numbers 1 to 9 on the cluster diagram, and this assemblage will be termed the Leiorhynchus community. In the other subcluster with samples 10 through 18, Devonochonetes outnumbers Leiorhynchus, and Mygowirifer becomes more abundant whereas Pterochaenia begins to disappear. This subcluster probably constitutes a relatively low diversity segment of the Devonochonetes community, which is one of the most pervasive (and internally variable) faunal assemblages within the Hamilton Group.
1.0 1 2 s s 4 • ' ' 11 ' It 12 It " 11 JJ 14 JJ " a 21 22 :zs ,. a 71 " a a n 11 30 :11 zs ,. , 17
.Figure 2a: UPGM dendrognm for samples at Swamp Road, using Pearson Co!relations. Sample locations an: indicau:d on the left side of Fig.= 1.
173

The large cluster on the right of the dendrogram, ranging from samples 20 to 37, is consistently high in Devonochonetes; significant amounts of Ambocoelia and/or Mucro5l'irifer are also always present. The deeper water taxa, Leiorhynchus and Pterochaenia, are not quantitatively important. For the present, we will also refer to this community as that of Devonochonetes. The variance within this community is extremely high, and we may subdivide it after further study. The typical lithology is silty shale. Returning to the dendrogram, the oldest subset, samples 20 to 24, still retains a significant component of infaunal bivalves which were present in the shales below; in addition a number of the serni-infaunal brachiopod Spinulicosta spinulicosta have been found. The next subcluster with samples 26 to 36 suggests a more agitated environment. Devonochonetes and Ambocoelia are co-dominant and there are increases in the brachiopods Mucrospirifer, Tropidoleptus carinatus, Protoleptostrophia perplana. and Spinocyrtia granulosa, the serni-infaunal bivalves Modiomorpha sp. and Grammysia bisulcata, and the epibyssate bivalve Gosseletia triquetra. The last subcluster, samples 25 to 37, is separated by the dominance of Ambocoelia and Mucrospirifer, along with much variation in the numbers of Cornellites flabellum, Leiopteria sp. and Goniophora harniltonensis. This assemblage is consistently found in the coarsest sediments which were probably deposited in the shallowest water environment within this cycle.
A dendrogram was also computed for the taxa (Fig 2b). The structure is loose and only about 10 percent of the links take place at correlations over 0.7. Despite the rather nebulous nature of the clusters, the species found in the coarser rocks are generally separated from those in the finer sediments.
Figure 2b: UPGM cleadrogum for spec;iel• Swamp R.oed, using Peanoa ConeiadOUL
Correspondence analysis
. Figure 3 contains ~e first ~o ~es of the correspondence analysis for the samples, and they explam ~8 pe!Cent of the informanon m the data set Axis 1 arrays the Leiorhynchus community, the low spec1es-nchness segment of the Devonochonetes community, and the more typical samples of the Devonochonetes community from right to left 1ltis is apparently associated with the major th~m~ of change from sh~es_ to siltstones, which reflects decreasing depth and increasing amounts of a~tatton. The second axis dissects the three subclusters within the Devonochonetes community. Listed from top to bottom, these subclusters are those with the infaunal bivalves, Devonochonetes
174
;
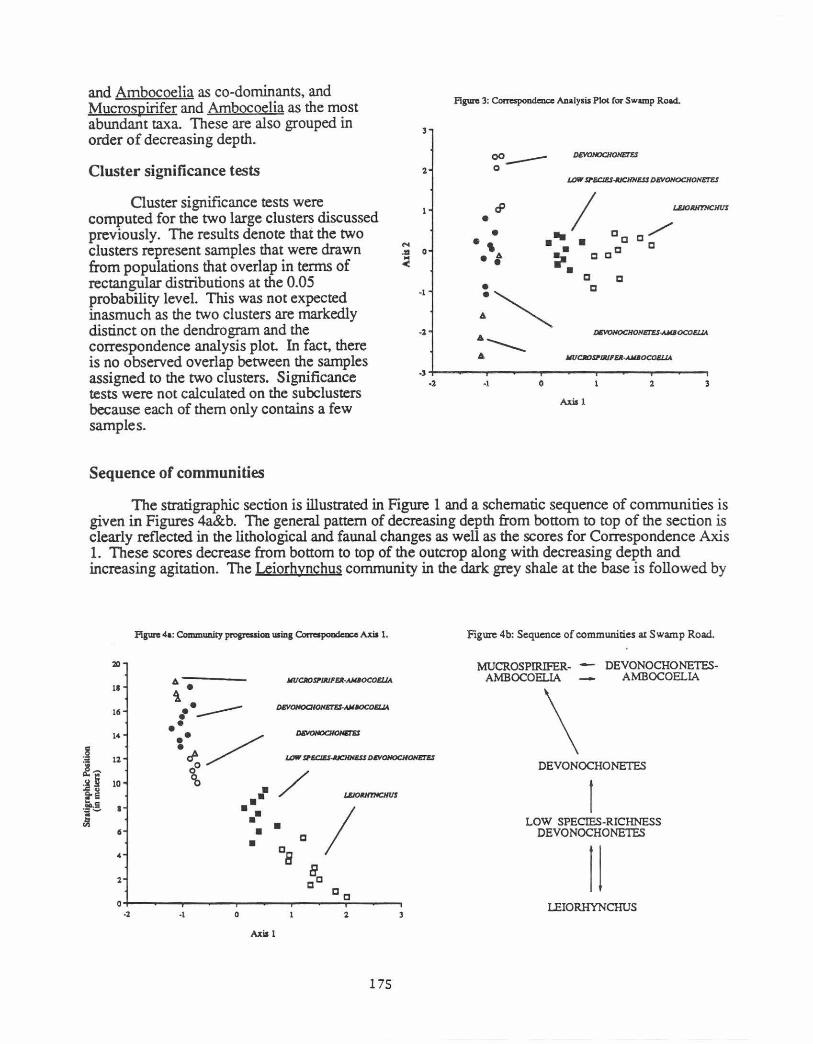
and Ambocoelia as co-dominants, and Mucrospirifer and Ambocoelia as the most abundant taxa. These are also grouped in order of decreasing depth.
Cluster significance tests
N .II 0
<
Figure 3: CorrespondeDce Analysis Plot Cor Swamp Road.
•
00--0
• . ' • I
LOW SI'BCW·AICHH£SS D£VONOCHONETES
a a
:~ c
·--"'
Cluster significance tests were computed for the two large clusters discussed previously. The results denote that the two clusters represent samples that were drawn from populations that overlap in terms of rectangular distributions at the 0.05 probability level. This was not expected inasmuch as the two clusters are markedly distinct on the dendrogram and the correspondence analysis plot. In fact, there is no observed overlap between the samples assigned to the two clusters. Significance tests were not calculated on the subclusters because each of them only contains a few samples.
·3 +----r---~----~---,--....---, ·l 0 l 3
Axill
Sequence of communities
The stratigraphic section is illustrated in Figure 1 and a schematic sequence of communities is given in Figures 4a&b. The general pattern of decreasing depth from bottom to top of the section is clearly reflected in the lithological and faunal changes as well as the scores for Correspondence Axis 1. These scores decrease from bottom to top of the outcrop along with decreasing depth and increasing agitation. The Leiorhynchus community in the dark grey shale at the base is followed by
II
16
14
6
4
l
Figure 4a: Community prograsi011 using CorreapoadeDco Axil 1.
"' . IIUCIIDSI'WFEA·AJUOCOEUA
i .··----·:. / e J1 ./ LOWSI'~D6VONOCHONET1IS ( ./ •• • • • • • a •
lJ a a
I a a
o+-----r---~----~---~--........ ~ ·l ·I 0 l
Axis 1
175
Figure 4b: Sequence of communities at Swamp Road.
MUCROSPIRIFER- - DEVONOCHONETES-AMBOCOELIA AMBOCOELIA
\ DEVONOCHONETES
LOW SPECIES-RICHNESS DEVONOCHONETF.S
LEIORHYNCHUS
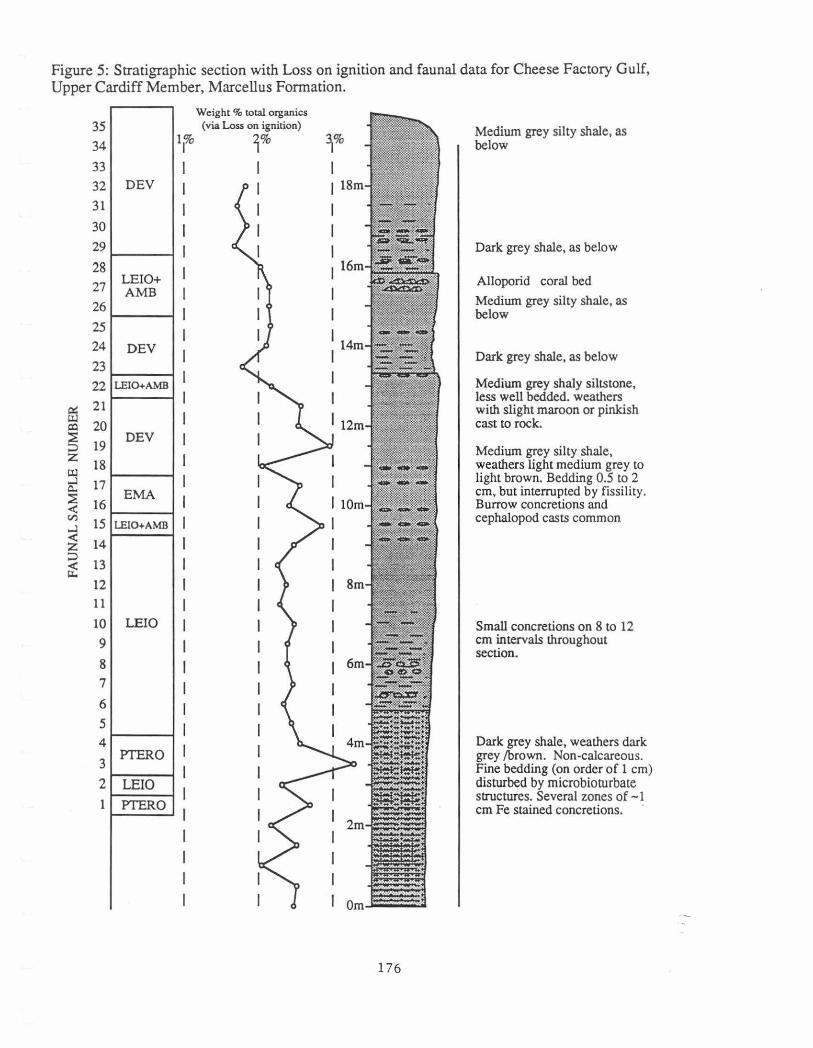
Figure 5: Stratigraphic section with Loss on ignition and faunal data for Cheese Factory Gulf, Upper Cardiff Member, Marcellus Formation.
35
34
33
32
31
30
29
28
27
26
25
24
23
22
0:: 21 t.I.l
20 a:l ::E ;:::l 19 z
18 t.I.l ....l 17 0..
~ 16 en
15 ~ z 14 ;:::l
13 ~ 12
11
10
9
8
7
6
5
4
3
2 1
DEV
LEIO+ AMB
DEV
LEIO+AMB
DEV
EMA
LEIO+AMB
LEIO
PTERO
LEIO PTERO
Weight % total organics (via Loss on ignition)
1j!o 1%
176
Medium grey silty shale, as below
Dark grey shale, as below
Alloporid coral bed
Medium grey silty shale, as below
Dark grey shale, as below
Medium grey shaly siltstone, less well bedded. weathers with slight maroon or pinkish cast to rock.
Medium grey silty shale, weathers light medium grey to light brown. Bedding 0.5 to 2 ern, but interrupted by fissility. Burrow concretions and cephalopod casts common
Small concretions on 8 to 12 ern intervals throughout section.
Dark grey shale, weathers dark grey /brown. Non-calcareous. Fine bedding (on order of 1 ern) disturbed by rnicrobioturbate structures. Several zones of -1 ern Fe stained concretions. ·
G.l
~
= ~ ·u IS 0..7 ~ 0 u .§ 'ail 0,6
] 8
the low diversity segment of the Devonochonetes community after a short transitional interval where the two assemblages alternate. The Devonochonetes fauna with the infaunal bivalves is next in the sequence. The uppermost part of the section is characterized by silty shale and siltstone. Here, the community composition fluctuates between the Mucrospirifer-Ambocoelia and DevonochonetesAmbocoelia assemblages.
STOP 2, ROCKSLIDE AND GULLY IN CHEESE FACTORY GULF
Introduction
The dark grey and silty shales at this outcrop are assigned to the upper part of the Cardiff Member of the Marcellus Formation (Fig. 5). In general, it represents a more distal equivalent to the upwardly-coarsening sequence seen at Swamp Road. The most interesting aspect about this sequence is that it records the establishment of a stable benthic fauna in an area previously dominated by sparse pelagic taxa such as orthocones and Pterochaenia frawis. As noted by Brower and Nye (1991), some individuals of Pterocbaenia were probably epiplanktonic whereas others were most likely byssally attached to the substrate.
This part of the section is not generally well exposed because the soft shales weather rapidly and are quickly overgrown. The two exposures here allow comparison of weathered and fresh outcrops. The slide section dates from the early 1970's whereas the ravine developed during the summer of 1990.
The study was conducted on 35 samples taken from the ravine at 0.5 meter intervals (Fig. 5). Approximately 10,500 fossils were counted Five depauperate samples at the base of the ravine were omitted from the analysis because it was not possible to count 300 specimens.
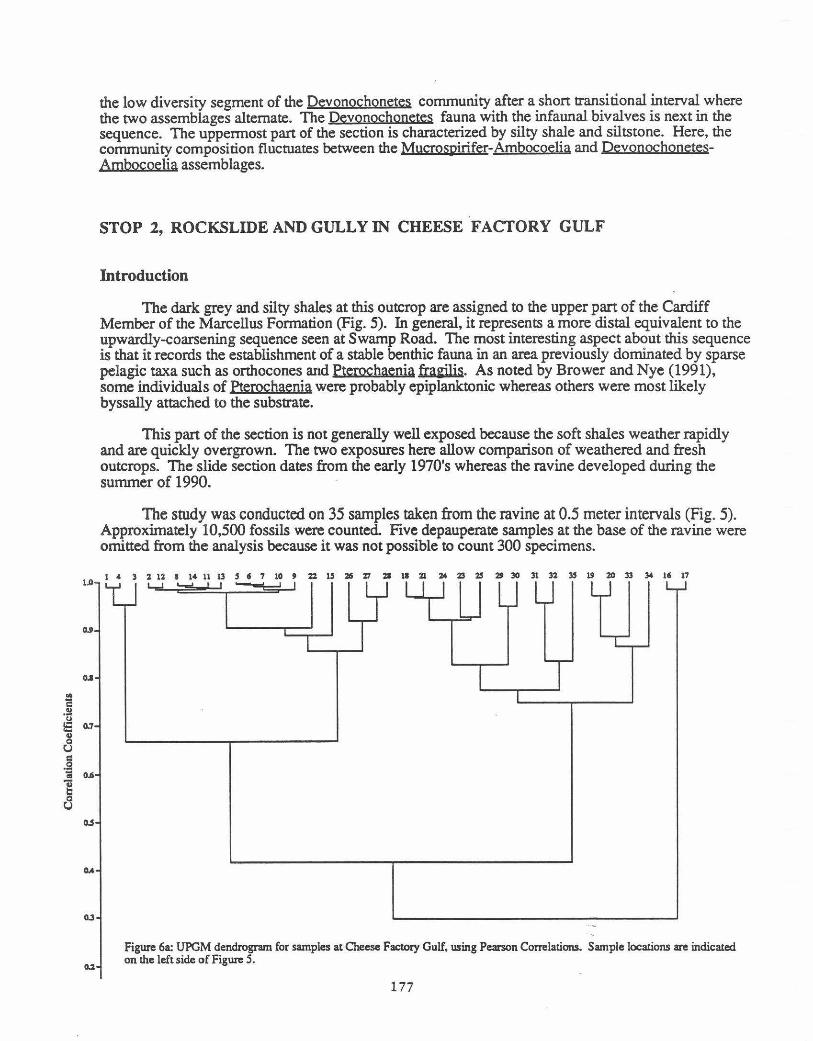
Figure 6a: UPGM dendrogram for samples at Cheese Factory Gulf, using Pearson Correlations. Sample locations are indicated on the left side of Figure 5.
177
Cluster analysis
Figure 6a illustrates the dendrogram for the samples. The data are tightly structured and four distinct clusters can be seen. All samples within the four clusters join at correlation coefficients that are larger than 0.7. Samples dominated by Pterochaenia fragilis form the group of three samples with numbers 1, 3 and 4 (Pterochaenia community). In the large series of samples ranging from numbers 2 to 28 on the cluster diagram, Leiorhynchus multicostum is always the most common species. Pterochaenia and Emanuella subumbona are also frequent, along with smaller amounts of Spinulicosta spinulicosta and Nuculoidea sp. These samples belong to the Leiorhynchus community. Most samples in this cluster join at high similarities where the correlation coefficients are 0.96 or higher. Samples 22 to 28 group at lower levels ranging from 0.85 to 0.95. These latter samples differ from the more typical samples, numbers 2 through 9, in having more Ambocoelia umbonata and somewhat higher faunal diversity. The large block of samples from number 18 to number 34 represent those where Devonochonetes scituh.1s, Leiorhynchus and Nuculoidea sp. are all common. In addition significant numbers of Ambocoelia umbonata, Mucrospirifer mucronatus, Nuculites oblongatus and gastropods are encountered. This cluster falls into a relatively low diversity segment of the highly heterogeneous Devonochonetes community. Samples 16 and 17 differ greatly from all others because they contain 50 percent or more of the small brachiopod Emanuella subumbona. This assemblage is termed the Emanuella community.
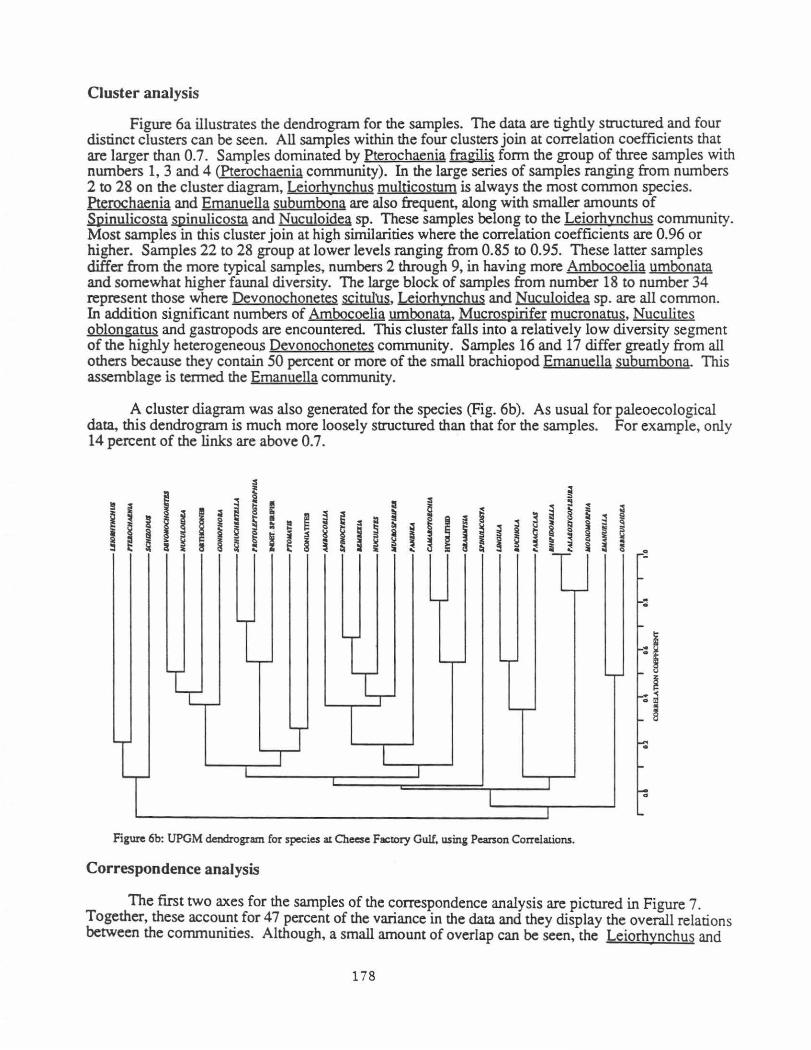
A cluster diagram was also generated for the species (Fig. 6b). As usual for paleoecological data, this dendrogram is much more loosely structured than that for the samples. For example, only 14 percent of the links are above 0.7.
I HI HI
'--r- 1d_ '-r-
!2_ -r-
1 I I r-
l I J
I I
Figure 6b: UPGM dendrogram for species at Cheese Factory Gulf, using Pearson Correlations.
Correspondence analysis
The first two axes for the samples of the correspondence analysis are pictured in Figure 7. Together, these accou.n~ for 47 percent of the variance in the data and they display the overall relations between the commurunes. Although, a small amount of overlap can be seen, the Leiorhynchus and
178
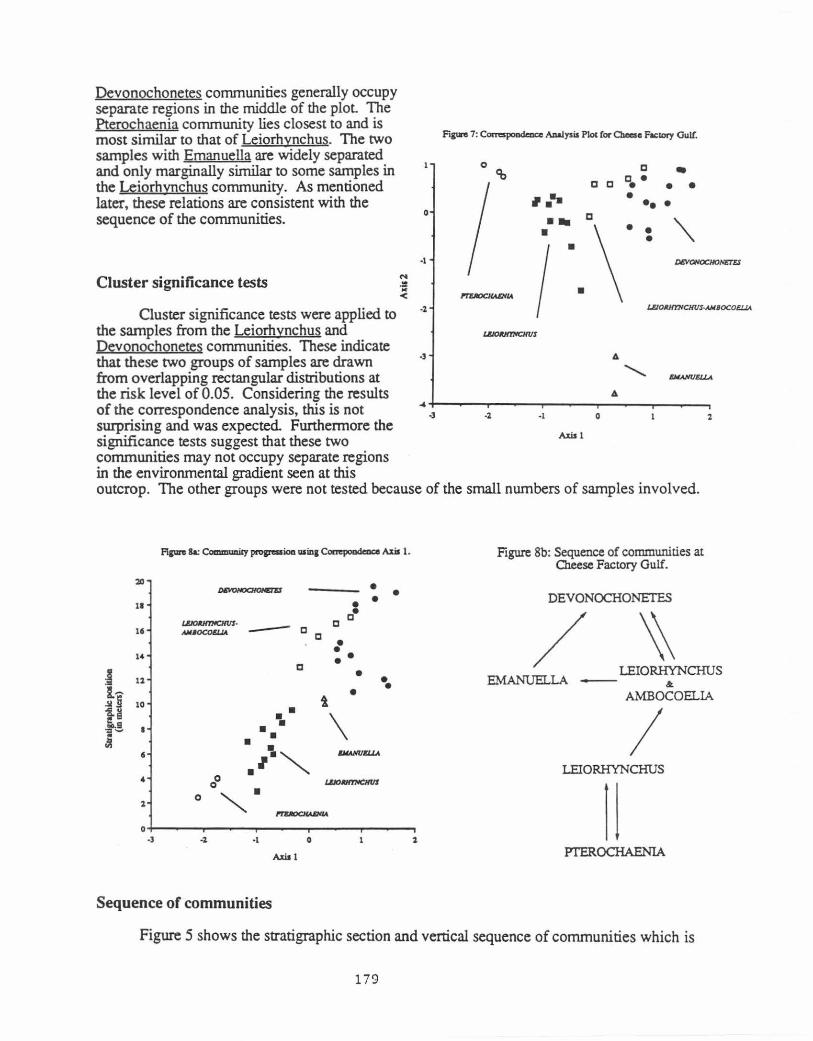
Devonochonetes communities generally occupy separate regions in the middle of the plot The Pterochaenia community lies closest to and is most similar to that of Leiorhynchus. The two samples with Emanuella are widely separated and only marginally similar to some samples in the Leiorhynchus community. As mentioned later, these relations are consistent with the sequence of the communities.
Cluster significance tests
0
·1
FtgW~~7: Correspoodence Analysis Plot for Cheese Factory Qui(.
0 • • • .... •• •
• .. a '\.
Cluster significance tests were applied to ·l
i ·.\·~=~ the samples from the Leiorhynchus and Devonochonetes communities. These indicate that these two groups of samples are drawn from overlapping rectangular distributions at the risk level of 0.05. Considering the results of the correspondence analysis, this is not surprising and was expected. Furthermore the significance tests suggest that these two communities may not occupy separate regions in the environmental gradient seen at this
.)
A •+-~---r--~~------~~---r----~
.) ·l · 1 0
Axis 1
outcrop. The other groups were not tested because of the small numbers of samples involved.
20
11
1e
14
! 1l
l--~B 10
l~ .,._ ~
' 4
l 0
0 . )
-- aa
a
• \ ••
t
• i'~
0 • 0 ""'. l"f'UUICHASNN.
0
Axis 1
Sequence of communities
• • • • a a
• • • • • •
\
•
••
Figure 8b: Sequence of communities at Oleese Factory Gulf.
DEVONOCHONETES
/ EMANUEL LA
LEIORHYNCHUS &
AMBOCOELIA
I LEIORHYNCHUS
PI'EROCHAENIA
Figure 5 shows the stratigraphic section and vertical sequence of communities which is
179
summarized in Figure 8. Overall, there is a reasonable correlation between stratigraphic level, rock type, organic content, and community composition. The oldest community, Pterochaenia, is generally in the finest sediments with the highest organic content We interpret these specimens of Pterochaenia as being byssally attached to the seafloor. As water depth decreased, the Pterochaenia community was eventually replaced by a Leiorhynchus community after a short interval of fluctuation between these two assemblages. The Emanuella community follows that of a sample in the Leiorhynchus community with many Ambocoelia. Both Leiorhynchus and Emanuella are pedicle-attached brachiopods although they exhibit few other common features. The environmental changes involved here are not certain and are currently under study. The lithology and organic content of the two samples placed in the Emanuella community resemble those of many samples in the Leiorhynchus community. The Devonochonetes community predominates in the upper half of the section although there are several intervals with the Leiorhynchus community. These two segments of the latter community are characterized by higher diversity, more Ambocoelia, lower organic content, and slightly coarser lithology than the typical members of the Leiorhynchus community lower in the outcrop. Most of the more diverse samples in the Devonochonetes community are found in the siltier sediments with the lowest amounts of organic matter. The most frequent ecological groups in the Devonochonetes community are reclining and pedicle-attached brachiopods. The lithological changes imply that this community lived in the shallowest water. The most obvious environmental change in the section is decreasing water depth. Note that Correspondence Axis 1 provides a reasonable measure of relative depth. Low values are associated with deep water samples and vice versa. However, changes in oxygen content and substrate properties may also have taken place. In general, conditions improved sufficiently to allow colonization by a more diverse benthic fauna.
STOP 3, ROADCUT ON ROUTE 20 NEAR POMPEY CENTER
Introduction
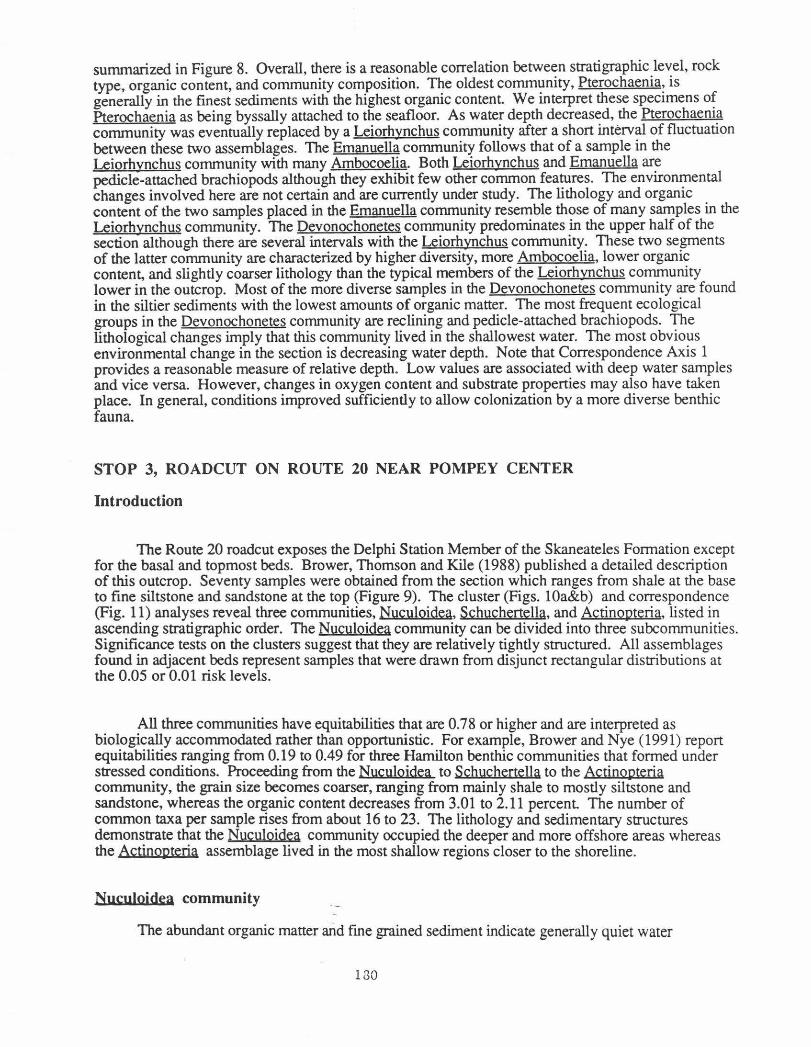
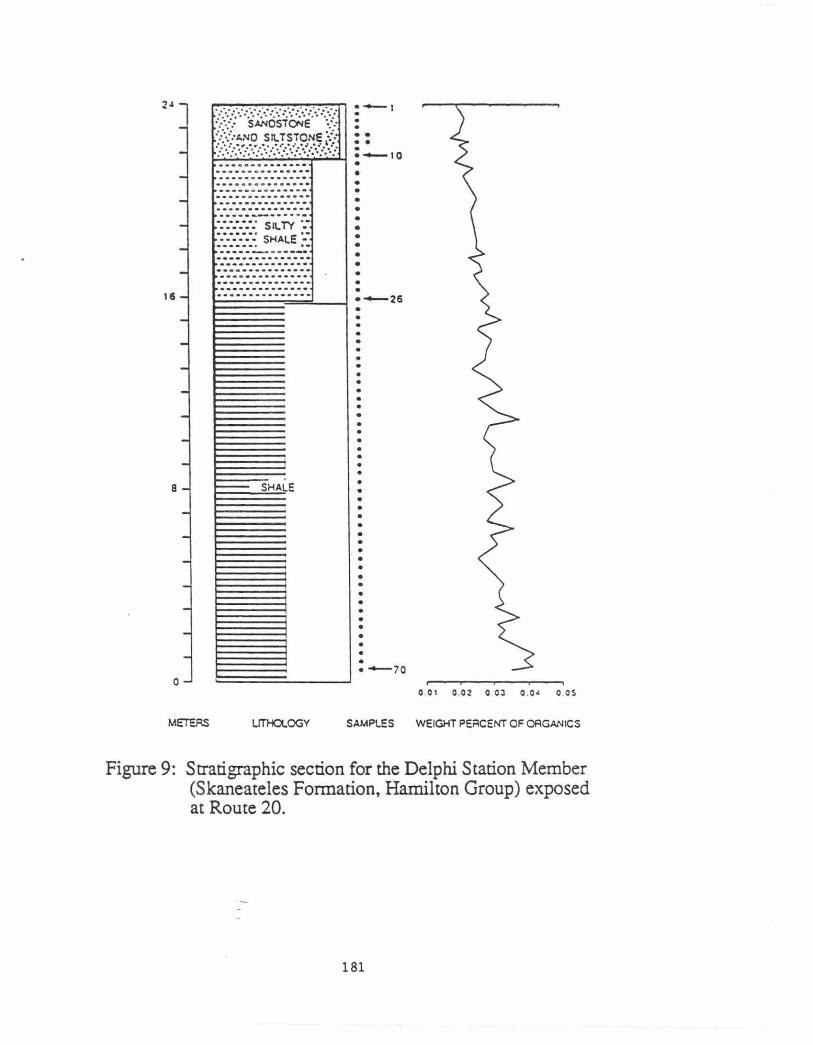
The Route 20 roadcut exposes the Delphi Station Member of the Skaneateles Formation except for the basal and topmost beds. Brower, Thomson and Kile (1988) published a detailed description of this outcrop. Seventy samples were obtained from the section which ranges from shale at the base to fine siltstone and sandstone at the top (Figure 9). The cluster (Figs. 10a&b) and correspondence (Fig. 11) analyses reveal three communities, Nuculoidea, Schuchenella, and Actinopteria, listed in ascending stratigraphic order. The Nuculoidea community can be divided into three subcommunities. Significance tests on the clusters suggest that they are relatively tightly structured. All assemblages found in adjacent beds represent samples that were drawn from disjunct rectangular distributions at the 0.05 or 0.01 risk levels.
All three communities have equitabilities that are 0.78 or higher and are interpreted as bio1.ogi~~y acco~odated rather than opportunistic. For example, Brower and Nye (1991) report eqmtabtlittes rangmg from 0.19 to 0.49 for three Hamilton benthic communities that formed under stressed conditions. Proceeding from the Nuculoidea to Schuchertella to the Actinopteria community, the grain size becomes coarser, ranging from mainly shale to mostly siltstone and sandstone, whereas the organic content decreases from 3.01 to 2.11 percent The number of common taxa per sample rises from about 16 to 23. The lithology and sedimentary structures demonstrate that the Nuculoidea community occupied the deeper and more offshore areas whereas the Actinopteria assemblage lived in the most shallow regions closer to the shoreline.
Nuculojdea community
The abundant organic matter and fme grained sediment indicate generally quiet water
130
METERS
··· ··-········ ............... ········ -····· ---· ··-· ······· ·····-······ ·· --·- --········· ·········----·· ·· ·········-· ···----------·:::::: Sll. TY ·;
:-:-:·:·:·:~ SHALE :: . -----------·•••····• ·••··• ·------------..•............ ---------····· ..... ..........
~ SHALE
LITHOLOGY
__ , • . • • • • . ·-to • • • • • • • • • • • • • • • ·-26 • • • . • • • • • • • • • • . • • • • • • • • • • • • • • • • • • • • • • • • • ·-70
SAMPLES
O.Ot 0 .0 2 0 OJ 0 .0• O.OS
WEIGHT PERCENT OF ORGANICS
Figure 9: Stratigraphic section for the Delphi Station Member (Skaneateles Formation, Hamilton Group) exposed at Route 20.
181
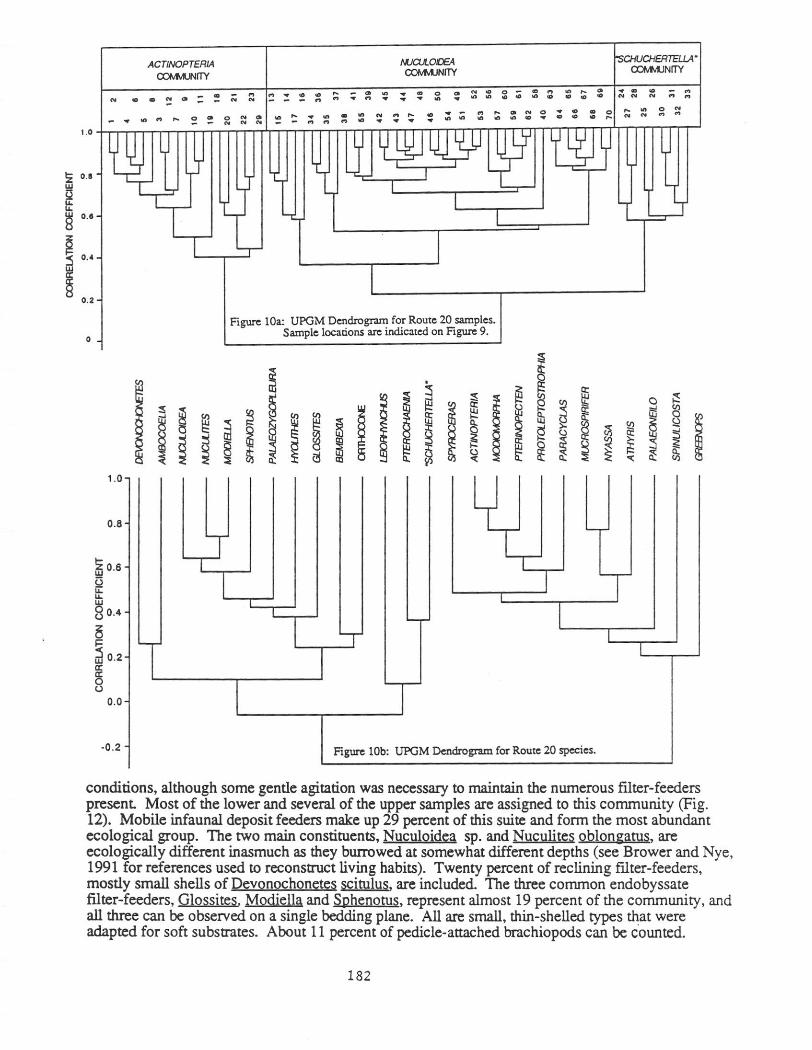
Leiorhynchus and Ambocoelia are most common, but they prob~bly did ~ot com~te becau.se of differences in size and orientation on the seafloor. The larger le10rhynchtds explmted the h1gher levels. Hyolithes and Greenops account for nearly 10 percent of the individuals, and these crawled along or ploughed through the mud, eating organic detritus, micro-organisms and small soft-bodied creatures. Gastropods comprise five percent, and their feeding habits are conjectural. The most frequent taxa, Bembexia and Palaeozygopleurn, are obviously surface dwellers and they typically occur together in dark shales. Recent archaeogastropods of shallow waters are algal grazers, but those living in deep water are deposit feeders. We tentatively classify Bembexia and Palaeozygopleura as herbivores because lithologic and stratigraphic considerations show that these sediments were deposited at moderate depths within the reach of storm waves.
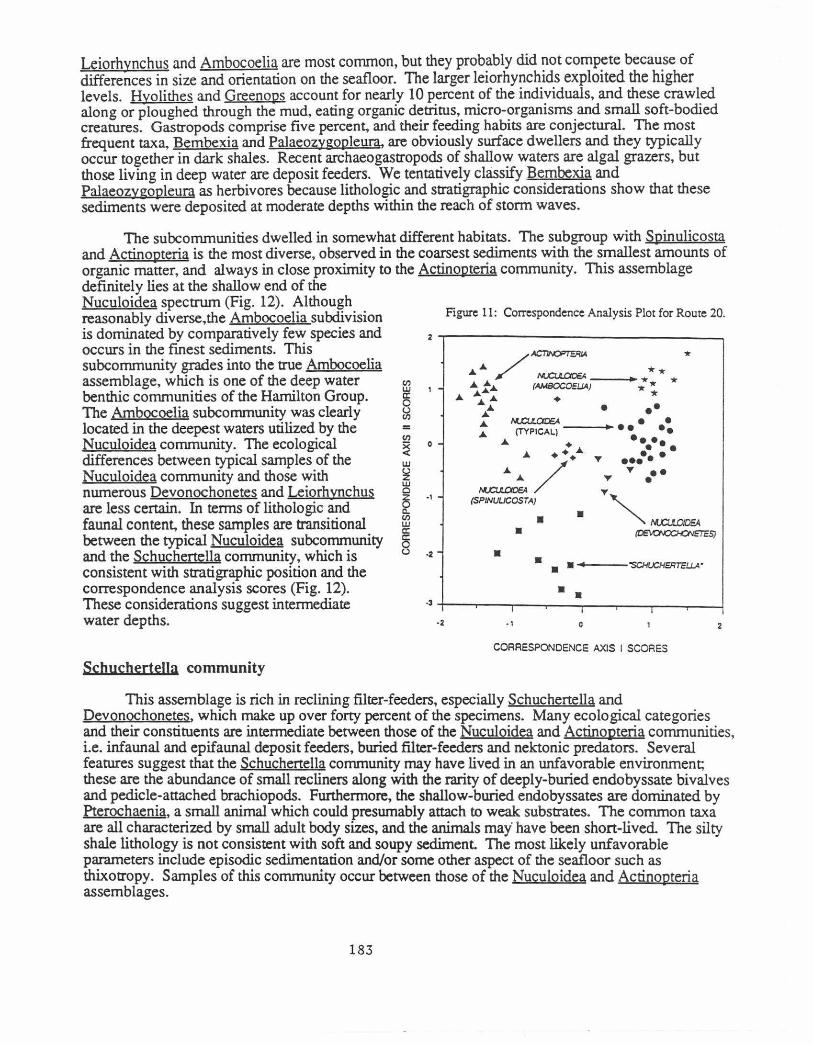
The subcommunities dwelled in somewhat different habitats. The subgroup with Spinulicosta and Actinopteria is the most diverse, observed in the coarsest sediments with the smallest amounts of organic matter, and always in close proximity to the Actinopteria community. This assemblage definitely lies at the shallow end of the Nuculoidea spectrum (Fig. 12). Although reasonably diverse,the Ambocoelia subdivision is dominated by comparatively few species and occurs in the finest sediments. This subcommunity grades into the true Ambocoelia assemblage, which is one of the deep water benthic communities of the Hamilton Group. The Ambocoelia subcommunity was clearly located in the deepest waters utilized by the Nuculoidea community. The ecological differences between typical samples of the Nuculoidea community and those with numerous Devonochonetes and Leiorhynchus are less certain. In terms of lithologic and faunal content, these samples are transitional between the typical Nuculoidea subcommunity and the Schuchenella community, which is consistent with stratigraphic position and the correspondence analysis scores (Fig. 12). These considerations suggest intermediate water depths.
ScbucberteiJa community
(/) w
§ =
Figure 11: Correspondence Analysis Plot for Route 20.
2~------------------------------~
• • •
• • • • ----"SCHUCHE:RTE!..J.A•
• • ·2 • I 0 2
CORRESPONDENCE AXIS I SCORES
This assemblage is rich in reclining filter-feeders, especially Schuchertella and Devonochonetes, which make up over forty percent of the specimens. Many ecological categories and their constituents are intermediate between those of the Nuculoidea and Actinopteria communities, i.e. infaunal and epifaunal deposit feeders, buried filter-feeders and nektonic predators. Several features suggest that the Schuchertella community may have lived in an unfavorable environment; these are the abundance of small recliners along with the rarity of deeply-buried endobyssate bivalves and pedicle-attached brachiopods. Furthermore, the shallow-buried endobyssates are dominated by Pterochaenia, a small animal which could presumably attach to weak substrates. The common taxa are all characterized by small adult body sizes, and the animals may· have been short-lived. The silty shale lithology is not consistent with soft and soupy sediment. The most likely unfavorable parameters include episodic sedimentation and/or some other aspect of the seafloor such as thixotropy. Samples of this community occur between those of the Nuculoidea and Actinopteria assemblages.
183
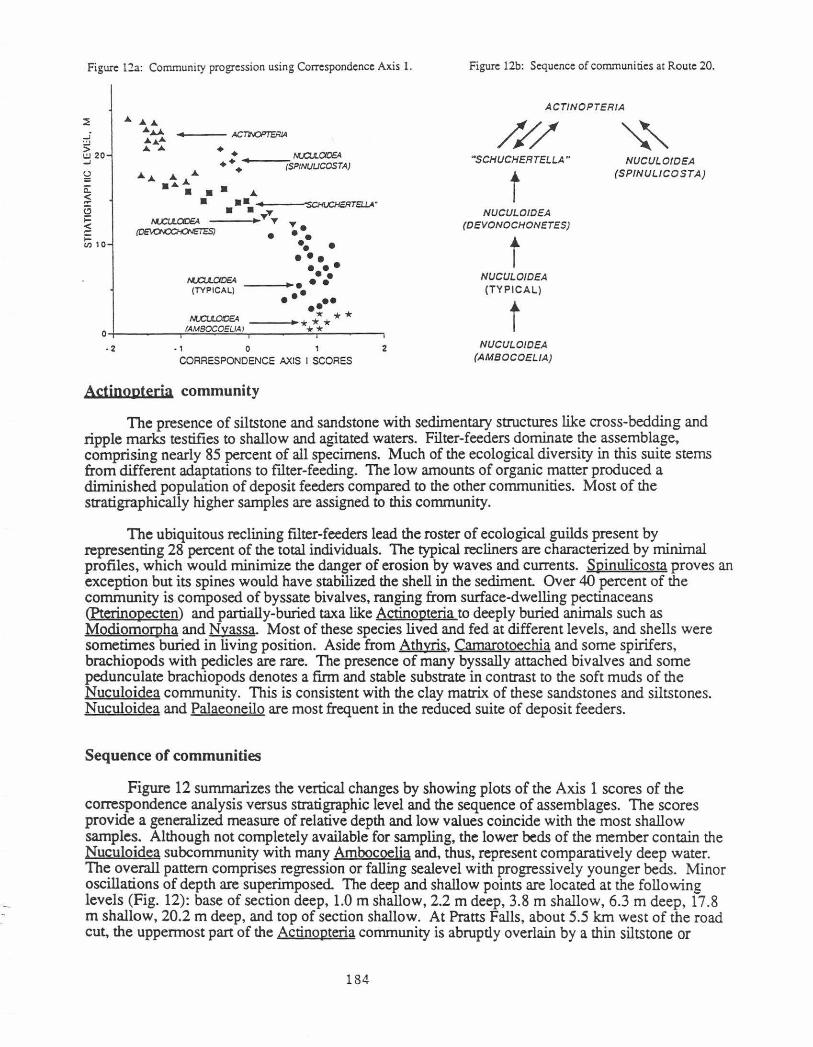
Figure l2a: Community progression using Correspondence Axis 1.
--- ACTN::JPTERJA
A.A. .A.. .A. ........ •
+ + MJCU.OIDEA + + .--~(SPtNUUCOSTA)
• ...... • • •• • ••• • • • •• MX:U.CIDEA __ _.. e e e
(TYP ICAL) e • • •• ••
M.X:I.JI..OIDEA ~ * * o+-------~~M~B~OC~O~E~L~~~~--~--~·-*~**+*-*--~-. • 2 . 1 0 1 2
CORRESPONDENCE AXIS I SCORES
Actinopterja community
Figure l2b: Sequence of communities at Route 20.
ACTINOPTERIA
#/ MSCHUCHERTELLA ..
t NUCULOIDEA
(DEVONOCHONETES)
t NUCULOIDEA (TYPICAL)
t NUCULOIDEA
{AMBOCOELIA)
NUCULOIOEA (SPINULICOSTA)
The presence of siltstone and sandstone with sedimentary structures like cross-bedding and ripple marks testifies to shallow and agitated waters. Filter-feeders dominate the assemblage, comprising nearly 85 percent of all specimens. Much of the ecological diversity in this suite stems from different adaptations to ftlter-feeding. The low amounts of organic matter produced a diminished population of deposit feeders compared to the other communities. Most of the stratigraphically higher samples are assigned to this community.
The ubiquitous reclining filter-feeders lead the roster of ecological guilds present by representing 28 percent of the total individuals. The typical recliners are characterized by minimal profiles, which would minimize the danger of erosion by waves and currents. Spinulicosta proves an exception but its spines would have stabilized the shell in the sediment Over 40 percent of the community is composed of byssate bivalves, ranging from surface-dwelling pectinaceans <Pterinopecten) and partially-buried taxa like Actinopteria to deeply buried animals such as Modiomorpha and Nyassa. Most of these species lived and fed at different levels, and shells were sometimes buried in living position. Aside from Athyris, Camarotoechia and some spirifers, brachiopods with pedicles are rare. The presence of many byssally attached bivalves and some pedunculate brachiopods denotes a firm and stable substrate in contrast to the soft muds of the Nuculoidea community. This is consistent with the clay matrix of these sandstones and siltstones. Nuculoidea and Palaeoneilo are most frequent in the reduced suite of deposit feeders.
Sequence of communities
Figure 12 summarizes the vertical changes by showing plots of the Axis 1 scores of the correspondence analysis versus stratigraphic level and the sequence of assemblages. The scores provide a generalized measure of relative depth and low values coincide with the most shallow samples. Although not completely available for sampling, the lower beds of the member contain the Nuculoidea subcommunity with many Ambocoelia and, thus, represent comparatively deep water. The overall pattern comprises regression or falling sealevel with progressively younger beds. Minor oscillations of depth are superimposed. The deep and shallow points are located at the following levels (Fig. 12): base of section deep, 1.0 m shallow, 2.2 m deep, 3.8 m shallow, 6.3 m deep, 17.8 m shallow, 20.2 m deep, and top of section shallow. At Pratts Falls, about 5.5 km west of the road cut, the uppermost part of the Actinopteria community is abruptly overlain by a thin siltstone or
184

sandstone bed with phosphate pebbles which probably marks the transgression at the beginning of the next sedimentary cycle (see Brett and Baird, 1985; Brett, Baird and Miller, 1986 for discussion of these cycles). The pebble bed is not exposed at the road cut
Variable sequences of communities are observed in the stratigraphic section. Each arrow denotes a change in fauna from older to younger (Fig. 12). For example, the typical Nuculoidea subcommunity can grade into two of the other Nuculoidea subcommunities. Similarly, the Actinopteria community can follow or precede the Schuchertella or the Spinulicosta brachiopod assemblage of the Nuculoidea community. The Schuchertella community is linked to both the Actinopteria community and the Nuculoidea subcommunity with many brachiopods like Devonochonetes and Leiorhynchus.
Although some assemblages can be followed by a deeper or shallower water envirorunent, the general trend is towards more shallow conditions. It is important to note that the vertical changes are not biologically produced but are caused by physical changes in depth, agitation, substrate type, and possibly dissolved oxygen content
Although relative depths can be inferred with confidence, absolute figures are less certain. Brett, Baird and Miller (1986) and Vogel, Golubic and Brett (1987) postulate depths of less than 20 m and approximately 50 m for communities that are similar to those of Actinopteria and Nuculoidea herein. Their estimates rest on a variety of faunal and lithologic criteria. The Niger delta most likely forms a reasonable sedimentological analog for the clastic Hamilton in the eastern part of New York (Mazzullo, 1973). The lithofacies suggest similar water depths of 10 to 20 m and 40 m for the Actinopteria and Nuculoidea communities, respectively (Allen, 1970). Assuming a linear relationship between depth and the Axis 1 scores for the correspondence analysis, the following depths were derived on a scale ranging from 10 to 50 m: Actinopteria community 10-31 m but mostly less than 21 m, Schuchertella community 17-31.5 m; subcommunities of the Nuculoidea community, samples with many Spinulicosta 27-30 m, Devonochonetes assemblage 34-40 m, typical type 35.5-47.5 m and beds with many Ambocoelia 42-50 m.
STOP 4, PRIVATE QUARRY ON ROAD NUMBER 4 EAST
Introduction
About 12.5 m of the lowermost part of the Otisco Member of the Ludlowville Formation is present at this stop (Fig. 13). The lithologies range from shale to fme-grained sandstone and the organic matter content varies from 3.0 percent in some of the shales to 1.2 percent in the uppermost sandstone. Examination of the lithology indicates that three upwardly-coarsening cycles can be seen; the tops of these cycles are at roughly 4 m, 7 m and 12.5 m. Each cycle begins with shale; the two lower cycles are capped by a siltstone that contains abundant Zoophycos cauda~alli trace fossils, whereas the upper one ends in sandstone containing a large brachiopod and bivalve fauna.
Three faunal associations were initially apparent in qualitative field studies: 1) A Devonochonetes association characterized by infaunal, deposit-feeding bivalves, gastropods, and abundant Devonochonetes scitulus. 2) A Mucrospirifer association containing a higher diversity fauna of serni-infaunal and epifaunal brachiopods and bivalves. 3) A Protoleptostrophia association dominated by large reclining brachiopods and bivalves. However, this is rather misleading. As in the case of the Swamp Road, the multivariate analyses based on clustering and correspondence analysis reveals a slightly different paleoecological structure.
Large samples were taken -each sample consists of 1000 individuals in order to study the effects of sample size on faunal diversity and proportions. These results suggest that a sample size of 300.individuals is adequate to characterize these parameters for most diverse Hamilton Group communities. The 54 samples are distributed throughout the stratigraphic section (Fig. 13).
185
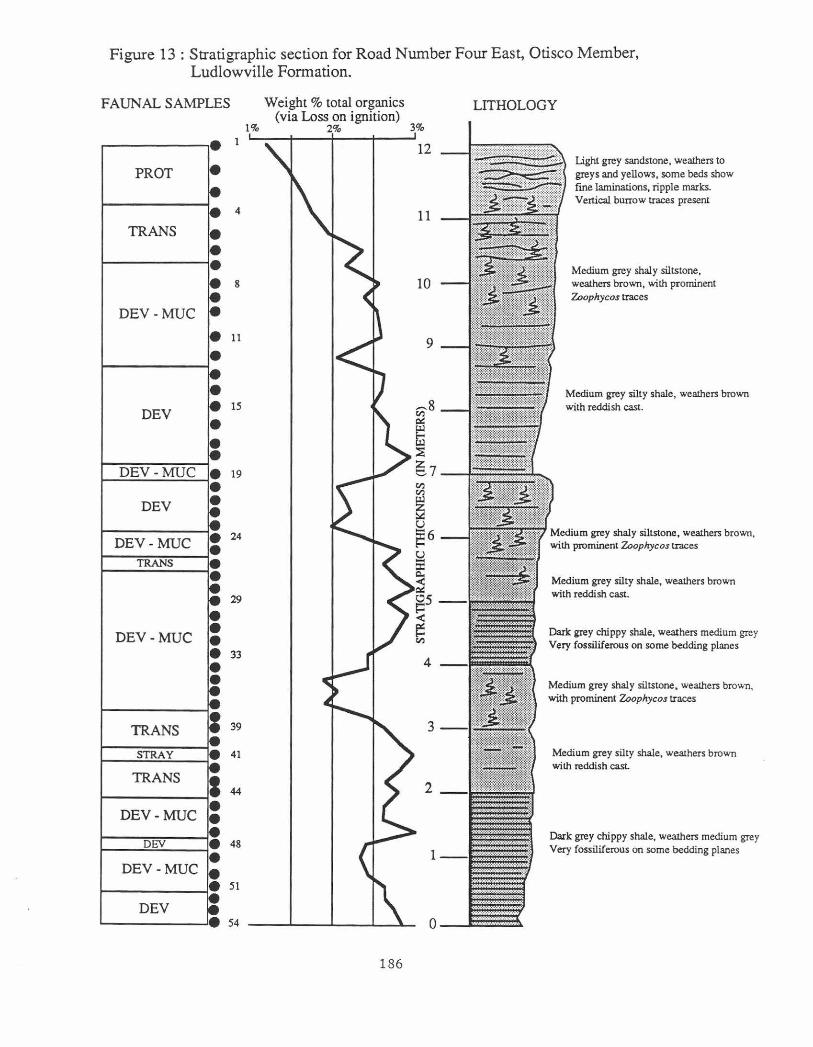
Figure 13: Stratigraphic section for Road Number Four East, Otisco Member, Ludlowville Formation.
FAUNAL SAMPLES
1%
,--------,· PROT
4
TRANS
8
DEV -MUC
11
DEV 15
DEV-MUC 19
DEV
DEV-MUC 24
TRANS
29
DEV-MUC 33
TRANS 39
STRAY 41
TRANS 44
DEV-MUC
DEY 48
DEV-MUC 51
DEV 54
Weight% total organics (via Loss on ignition)
2% 3%
12
11
10
9
---8 Cl)
c.::
~ ::E 81 Cl) Cl)
~ u ~6 u 5: ~ c.:: ~5-< != Cl)
4
3
2
1
0
186
LITHOLOGY
Light grey sandstone, weathers to greys and yellows, some beds show flne laminations, ripple marks. Vertical burrow traces present
Medium grey shaly siltstone, weathers brown, with prominent Zoophycos traces
Medium grey silty shale, weathers brown with reddish cast.
Medium grey shaly siltstone, weathers brown. with prominent Zoophycos traces
Medium grey silty shale, weathers brown with reddish cast.
Dark grey chippy shale, weathers medium grey Very fossiliferous on some bedding planes
Medium grey shaly siltstone, weathers brown, with prominent Zoophycos traces
Medium grey silty shale, weathers brown with reddish cast
Dark grey drippy shale, weathers medium grey Very fossiliferous on some bedding planes
Ul 1 1 , • , l' , .., e1 ., .. :11 " 1 11 :u "' n :ra %l 11 • 1t lO n " ., ,. 10 ' <~ 'D :J n " " .. cs u u 11 u 11 21 2l 1• u n lO n " so .. •1
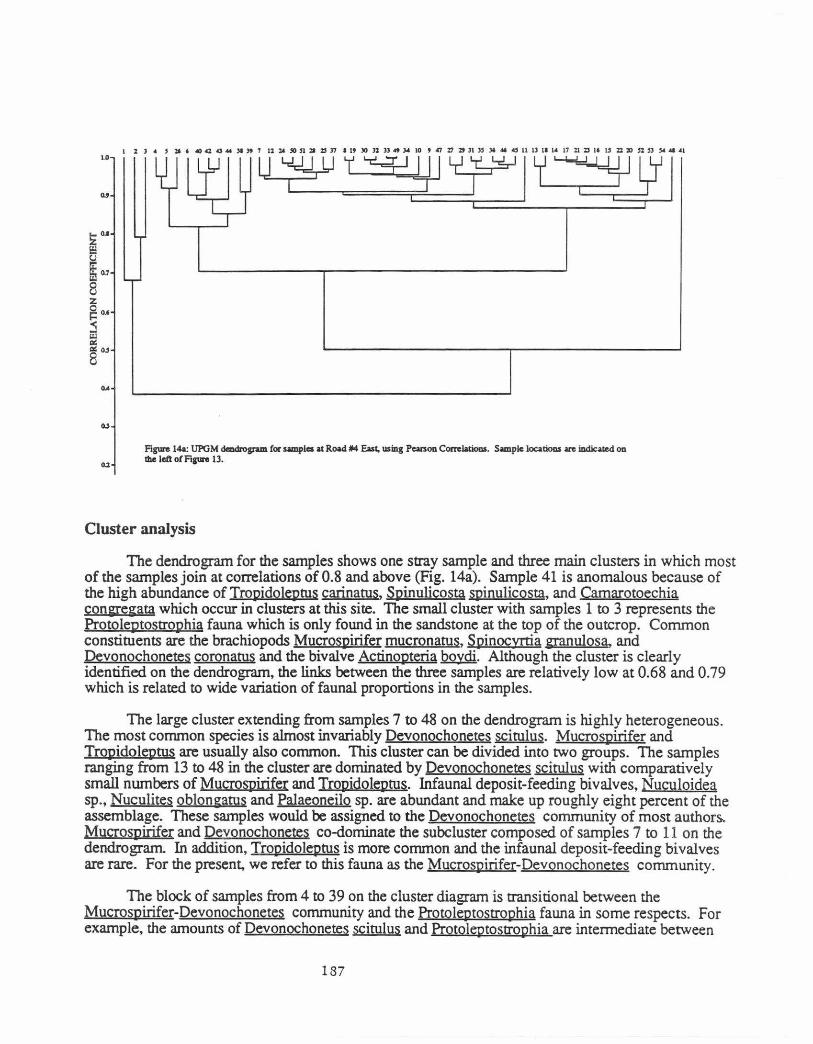
Figure 14&: UPGM daldrogn.m !CK samples at Road~ East, using Peanoo CorTelatioos. Smlple locatioas are indica£ed oo lbe left oCFigure 13.
Cluster analysis
The dendrogram for the samples shows one stray sample and three main clusters in which most of the samples join at correlations of 0.8 and above (Fig. 14a). Sample 41 is anomalous because of the high abundance of Tropidoleptus carinatus, Spinulicosta 511inulicosta, and Camarotoechia congregata which occur in clusters at this site. The small cluster with samples 1 to 3 represents the Protoleptostrophia fauna which is only found in the sandstone at the top of the outcrop. Common constituents are the brachiopods Mucrospirifer mucronatus, Spinocyrtia granulosa. and Devonochonetes coronatus and the bivalve Actinopteria ~· Although the cluster is clearly identified on the dendrogram, the links between the three samples are relatively low at 0.68 and 0.79 which is related to wide variation of faunal proportions in the samples.
The large cluster extending from samples 7 to 48 on the dendrogram is highly heterogeneous. The most common species is almost invariably Devonochonetes scitulus. Mucrospirifer and Iropidole.ptus are usually also common. This cluster can be divided into two groups. The samples ranging from 13 to 48 in the cluster are dominated by Devonochonetes scitulus with comparatively small nwnbers of Mucro511irifer and Iropidole.ptus. lnfaunal deposit-feeding bivalves, Nuculoidea sp., Nuculites oblongatus and Palaeoneilo sp. are abundant and make up roughly eight percent of the assemblage. These samples would be assigned to the Devonochonetes community of most authors.. Mucrospirifer and Devonochonetes co-dominate the subcluster composed of samples 7 to 11 on the dendrogram. In addition, Tropidoleptus is more common and the infaunal deposit-feeding bivalves are rare. For the present, we refer to this fauna as the Mugospirifer-Devonochonetes community.
The block of samples from 4 to 39 on the cluster diagram is transitional between the Mucrospirifer-Devonochonetes community and th.e Protoleptostrophia fauna in some respects. For example, the amounts of Devonochonetes scitulus and Protoleptostrophia are intermediate between
187
those of the previous two clusters whereas Mucrospirifer is about equally common in all three groups of samples. However, Tropidoleptus is most frequent in the transitional samples.
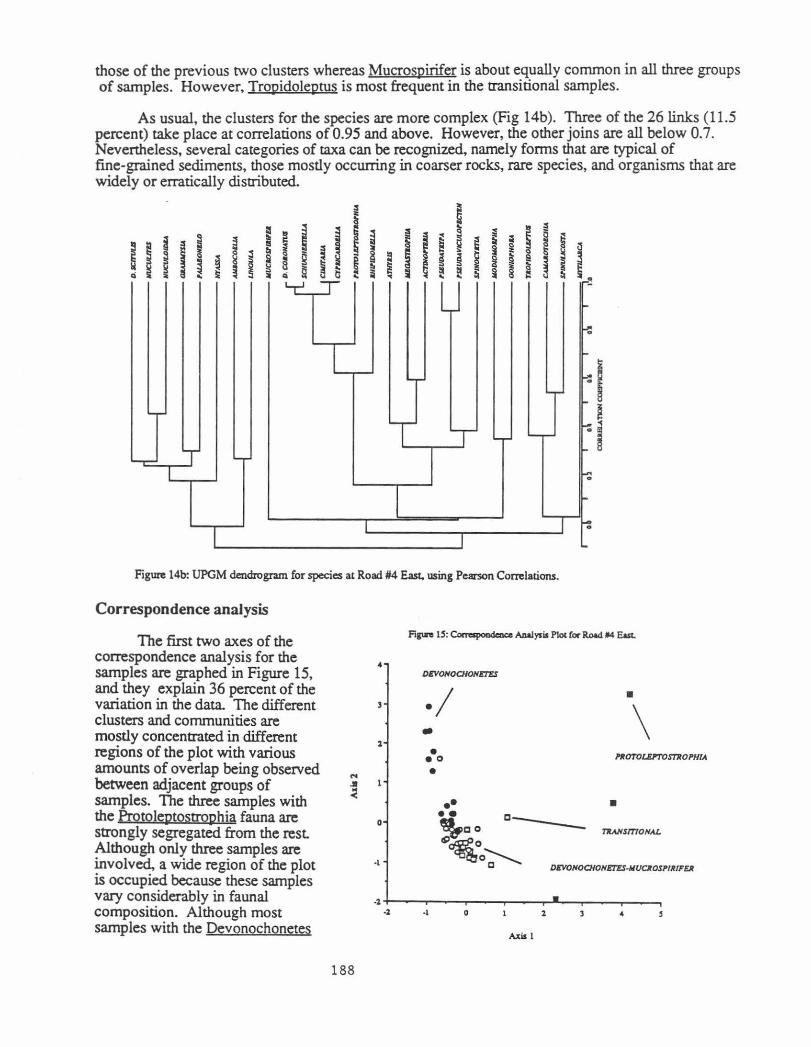
As usual, the clusters for the species are more complex (Fig 14b ). Three of the 26 links ( 11.5 percent) take place at correlations of 0.95 and above. However, the other joins are all below 0. 7. Nevertheless, several categories of taxa can be recognized, namely forms that are typical of fine-grained sediments, those mostly occurring in coarser rocks, rare species, and organisms that are widely or erratically distributed.
" §
~ § ~ ~ ~
I L..r-
I T ~ T
I
I I
I
I ~ ~ ~ I "' ~ 9
~ Q
~ ~ ~ =
'--r-
~ ~ ~
...
.-;;
~
~
-:
~
1-:: f.
~ I..
I I
Figure 14b: UPGM dendrogram for species at Road #4 East. using Pearson Correlations.
Correspondence analysis
The first two axes of the correspondence analysis for the samples are graphed in Figure 15, and they explain 36 percent of the variation in the data. The different clusters and communities are mostly concentrated in different regions of the plot with various amounts of overlap being observed between adjacent groups of samples. The three samples with the ProtolelJtostrophia fauna are strongly segregated from the rest Although only three samples are involved, a wide region of the plot is occupied because these samples vary considerably in faunal composition. Although most samples with the Devonochonetes
... ..
.(
188
4
3
1
0
·I
Figwe 15: Correspoodence Analysis Plot (or Road 114 East.
DEVO/VOCHO/VETES
·I • • eo •
•• •• c !c,co -~O'iieo ~0~ c
Axis 1
• \
l'ROTOLEPTOSTROI'HlA.
• TV.NsmoiVA.L
DEVOIVOCHOiiETES·IIUOOSI'fRfFER
community fall in the upper left part of the plot, these samples exhibit considerable overlap with those of the Devonochonetes - Mucrospirifer community in the lower left Likewise, much intergradation takes place between the Devonochonetes- Mucrospirifer community and the transitional group. The correspondence analysis plot arranges the communities in the following order: Devonochonetes community, Devonochonetes- Mucrospirifer community, transitional group, Protoleptostrophia fauna. As mentioned later, this order is closely related to the stratigraphic sequence of communities.
Cluster significance tests
The cluster significance tests on the adjacent pairs of communities denote that all clusters comprise samples that represent samples that have overlapping rectangular distributions at the 0.05 alpha level. At least some of the communities or clusters intergrade widely and the parent populations may overlap as much as 50 percent if tested for Gaussian distributions at a probability of 0.05. These Hamilton communities are clearly not discrete.
Sequence of communities
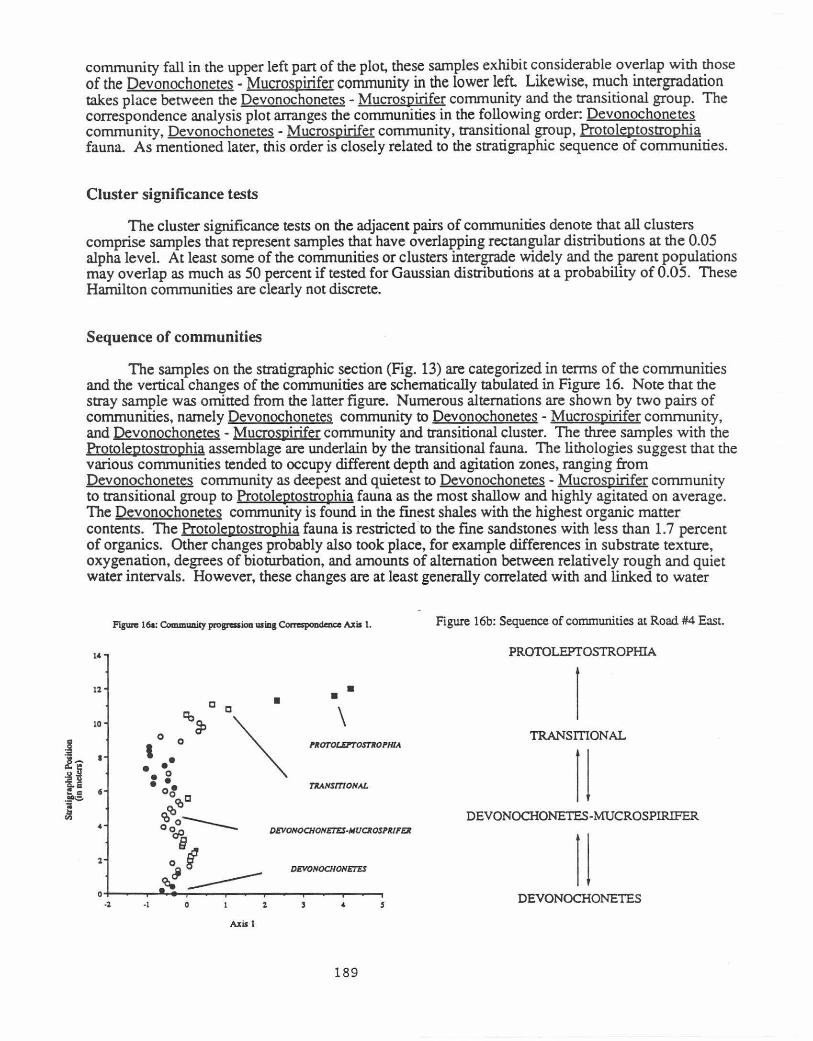
The samples on the stratigraphic section (Fig. 13) are categorized in terms of the communities and the vertical changes of the communities are schematically tabulated in Figure 16. Note that the stray sample was omitted from the latter figure. Numerous alternations are shown by two pairs of communities, namely Devonochonetes community to Devonochonetes- Mucrospirifer community, and Devonochonetes - Mucrospirifer community and transitional cluster. The three samples with the Protoleptostrophia assemblage are underlain by the transitional fauna The lithologies suggest that the various communities tended to occupy different depth and agitation zones, ranging from Devonochonetes community as deepest and quietest to Devonochonetes - Mucrospirifer community to transitional group to Protoleptostrophia fauna as the most shallow and highly agitated on average. The Devonochonetes community is found in the finest shales with the highest organic matter contents. The Protoleptostrophia fauna is restricted·to the fine sandstones with less than 1.7 percent of organics. Other changes probably also took place, for example differences in substrate texture, oxygenation, degrees of bioturbation, and amounts of alternation between relatively rough and quiet water intervals. However, these changes are at least generally correlated with and linked to water
Figuze 16&: Community progreuioo using c~ Axis 1. Figure 16b: Sequence of communities at Road #4 East.
14 PROTOLEPTOSTROPH1A
1l • • • 10 \
TRANSITIONAL
I J DEVONOCHONETES-MUCROSPIRIFER
DEVONOCHOHETE.S·MUCROSI'IUFER
DEVOHOCHOHETE.S I J l
·1 0 l DEVONOCHONETES
Axis I
189
depth and agitation. As with the other exposures, the scores for Correspondence Axis 1 appear to provide a surrogate measure for relative depth. The high scores are grouped with the most shallow samples whereas low values are observed for the samples from deeper water (Fig. 16). The major pattern noted for the entire outcrop is generally deep water followed by a marked interval of regression. Here, the asymmetery is quite striking. The correspondence axis scores imply that the Protoleptostrophia fauna lived in much more shallow water than the other communities. Two comparatively symmetrical sequences of regression and transgression are superimposed on the samples from the deeper water. The change of symmetry is notable. The communities are variably developed in different parts of the outcrop. In the two lower regressive and transgressive cycles, the main changes, omitting minor oscillations, are Devonochonetes community to Devonochonetes -Mucros.pirifer community to transitional assemblage to Devonochonetes - Mucros:pirifer community for the lower cycle and Devonochonetes - Mucrospirifer community to transitional cluster to Devonochonetes - Mucrospirifer community to Devonochonetes community in the second cycle. The full sequence of Devonochonetes community to Devonochonetes - Mucrospirifer community to transitional group to Protoleptostrophia fauna is only present in the uppermost regressive part of the outcrop.
An interesting side note is that our initial qualitative and quantitative analyses on the Road Number 4 outcrop yield communities that are quite similar; here, the style of preservation does not introduce a large amount of bias during collecting. The situation at Swamp Road is greatly different Our qualitative and quantitative "communities" were not the same because of the collecting bias which leads one to preferentially find the well-preserved calcitic specimens and ignore the comparatively drab molds and casts.
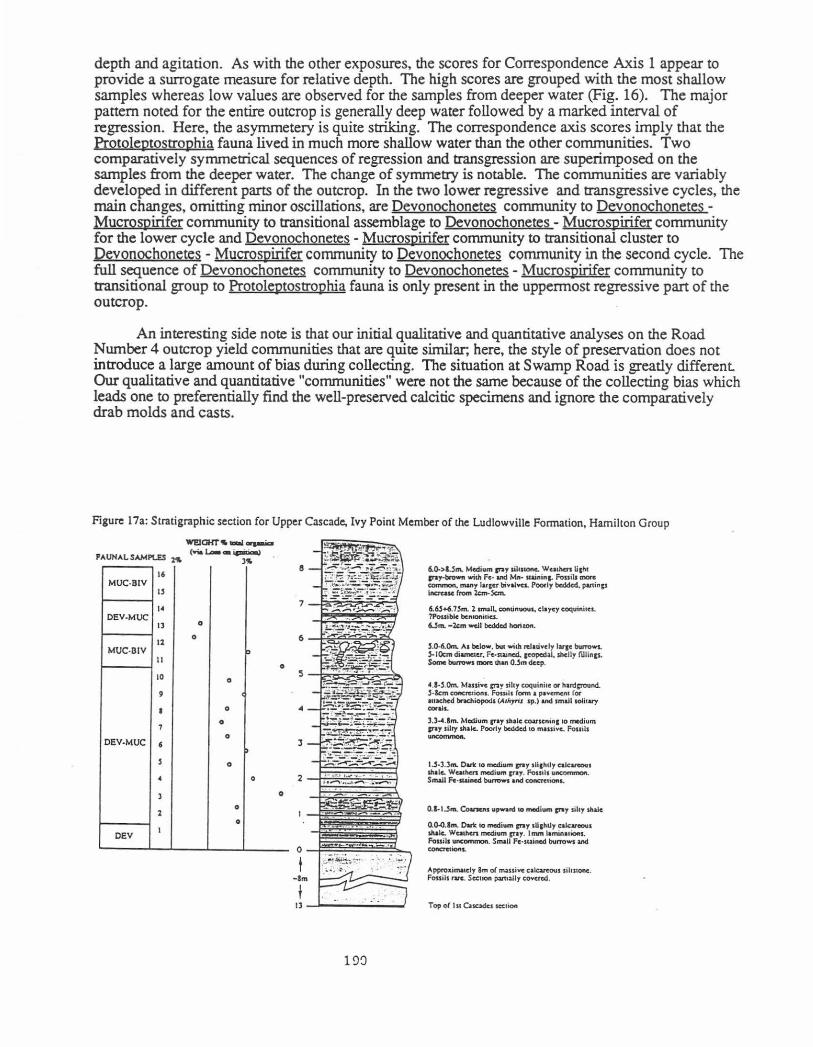
Figure 17a: Stratigraphic section for Upper Cascade, Ivy Point Member of the Ludlowville Formation, Hamilton Group
16 MUC·BIV .,
14 DEV·MUC
13 0
11 0
MUC-BIV II
10 0
9
• 0
7 0
OEV-MUC 6 0
' 0
• J
1
OEV I
p 0
~
0
0
0
0
190
6.G->&.~m. Medium cr>J siiUIOfiC. Wu&hen ~&ht cr>y-brown ,.;111 fc. and Mft. uainin1- Fouill tnere common, many lorcer bival¥CS. Poo.ly bedded, paninp iftcrcasc r,_ 2cm-x.n. 6.6.$+6.1$m. 1 srmll .. c:onc.inuout.. clayey coquinitcs. 79ouibk: bcn~enitlc.s.
~m. -:z..m well bc40cd hori --
3.G-6.0m. AJ below. but w;llt rdoliv<ly luc< bunows. $-I Clem diamcler. F<·twncd. c<Op<dal, sh<lly fulin &L Some bunows ._.,than 0.3m de<p.
4.1-3.0m. Massi .. cr>r silty coquini&< or hudC""'nd. .S ·km c:oncmions. Fomls (onn a pavcmc.nc (Of' onoch<d bnclliopod• (Arhyns l p.) and JmoJilOii&ory coralL
l .J .... Im. Medium ITIY shale c~senin1 10 medium 1717 Jilry Jhllc. Poorly bodd<d 10 mouiv<. Fouill unconvnooo.
1-'·J.Jm. Oari< IO medium I"J sli&hlly <IIC.,_I shale.. Weathc:n mcdi"'" cnr. Fosnlt UftQOmrnOft.
Small Fc-aain<d butmws and conct<'""''·
0.1-1 -'m. Coatxn• upwanl10 medium cr>Y lihy slW<
a.G-O.Im. Ovlt 10 medium cr>J sUch~y cote.,_. Wk. Weathc.n medium cur. lnvft laminatio.'IS. Fouill uncommon. Smoll fc·u•in<d INtTOwl and c:.oftCTt1ions.
A9P")a.im.atclr 8m of musivc calcareous sihr~onc. Fouils rvc.. Secuon pam~lly covered.
Top of In Cnc.adcs section
STOP 5, ROADCUT ON ROUTE 38 AT CASCADE
Introduction
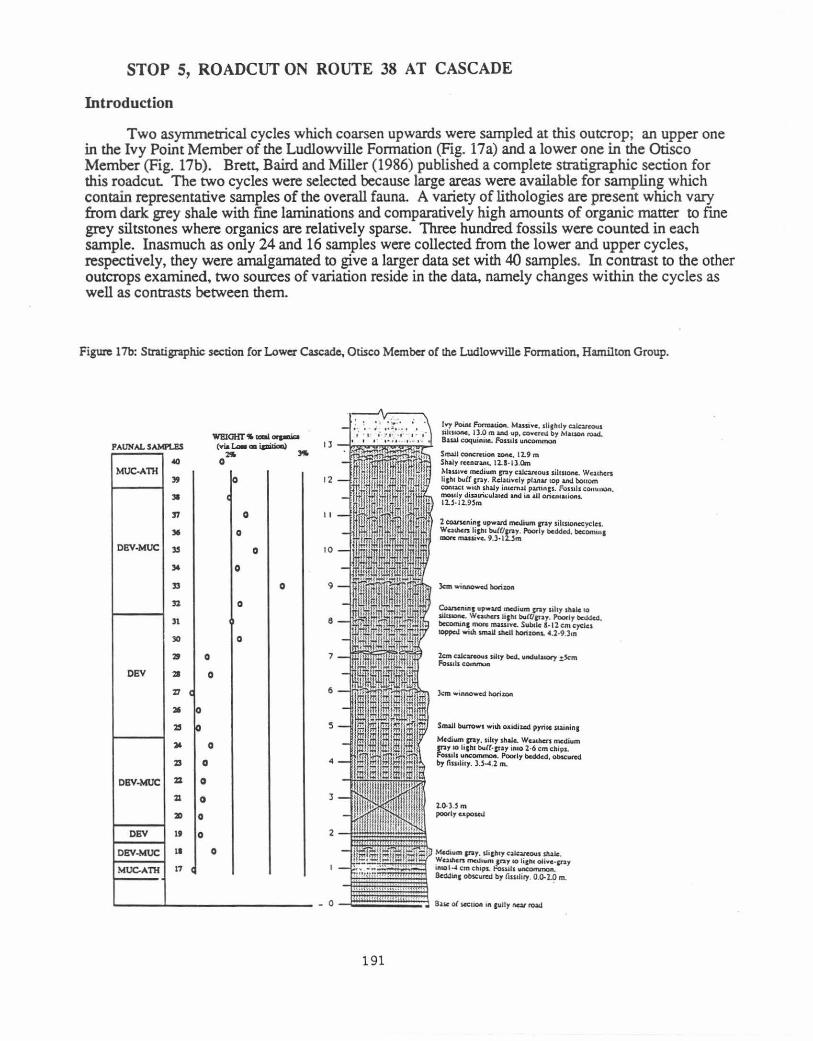
Two asymmetrical cycles which coarsen upwards were sampled at this outcrop; an upper one in the Ivy Point Member of the Ludlowville Formation (Fig. 17a) and a lower one in the Otisco Member (Fig. 17b). Brett. Baird and Miller (1986) published a complete stratigraphic section for this roadcut The two cycles were selected because large areas were available for sampling which contain representative samples of the overall fauna A variety of lithologies are present which vary from dark grey shale with fine laminations and comparatively high amounts of organic matter to fme grey siltstones where organics are relatively sparse. Three hundred fossils were counted in each sample. Inasmuch as only 24 and 16 samples were collected from the lower and upper cycles, respectively, they were amalgamated to give a larger data set with 40 samples. In contrast to the other outcrops examined, two sources of variation reside in the data, namely changes within the cycles as well as contrasts between them.
Figure 17b: Stratigraphic section for Lower Cascade, Otisco Member of the Ludlowville Formation. Hamilton Group.
PAUNAL SAMPU!S
40 MUC-Anl
39
31
'11
" OEV..MUC lS
34
33
n 31
30
3 0
DEY 21 0
71 (
» ~ 15 ~ )4 0
:zs 0
OEV.MtJC :t:l 0
21 0
» 0
OBV 1f 0
OBV-MUC II 0
MUC-Anl 17
211. l1lo 0
0
c
0
0
0
0
0
0
0
12
II
10
9
8
6
4
3
191
Ivy Point Formation. M&Uivc. slicholy C>bcous SJJ u conc. I ) .0 m and up. coverN by Mauon road. SaW coquinicc.. Fossils ~.ancommon
Small coo.:.WO.. zone. 12.9 m Shaly rccoa>A~ ll.S·Il.Om A-iusa"• mcdi~o~m cr.ay ca1an:ous siltstone. Wu,hers li1h1 bu{( t n y. Rd>tivcly pl>n&r iOp and bocoom contxl 'Nicl\ s.h~y intcmU p~ln&s. Foss1ls comuiOft, C'nOIIIy di~tri&.:~o~b.1c.d and ia aU orictltat iont. l l.$-12.95m
lcm winnowed borizon
~ni.ftJ upwvd medium , n y sihy 1h.alc ro silwonc. WcoU>cn ~Jh• buff/cny. "-ly bclklcd. bccomtnc more nuwve. S..bde 4· 12 em cycles roppe.l with .....U shell borizons. 4.2-9.Jon
2cm c.aku cous silly bed. undulatOty • Scm Fowbcommuoo -
Small bunowt with oxidiud pyrioe suininJ
McditMn p-ay. silty sJ\a1c.. Weathers medium P"Y "' lich• burt-cuy iouo 2·6 em chips. Fou1l1 ~ftCOII'V'nOft. Poorly bedded, obteu.rcd by fissahoy. l .S-4.2 m.
0.9
!-z E!:! CJ
ff t1l 0 CJ
Q.8
z 0.7
g !-< .J t1l Q.6 ~
8 0.5
Cluster analysis
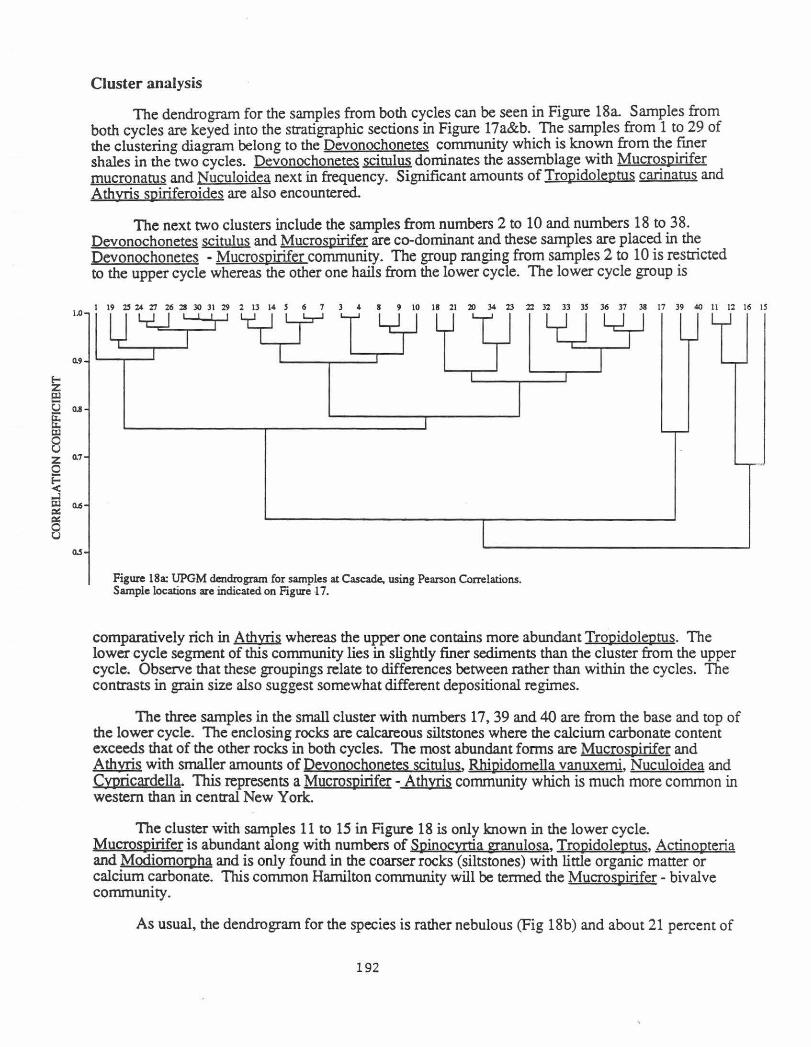
The dendrogram for the samples from both cycles can be seen in Figure 18a. Samples from both cycles are keyed into the stratigraphic sections in Figure 1?a&b .. Th7 samples from 1 to 29 of the clustering diagram belong to the Devon~honetes c?mmuruty which IS kno:vn from the [i?er shales in the two cycles. Devonochonetes sCitulus dominates the assemblage With Mucrospmfer mucronatus and Nuculoidea next in frequency. Significant amounts of Tropidoleptus carinatus and Athyris spiriferoides are also encountered.
The next two clusters include the samples from numbers 2 to 10 and numbers 18 to 38. Devonochonetes scitulus and Mucrospirifer are co-dominant and these samples are placed in the Devonochonetes -Mucrospirifer community. The group ranging from samples 2 to 10 is restricted to the upper cycle whereas the other one hails from the lower cycle. The lower cycle group is
Figure 18a: UPGM dendrogram for samples at Cascade, using Pearson Correlations. Sample locations are indicated on Figure 17.
comparatively rich in Athyris whereas the upper one contains more abundant Tropidoleptus. The lower cycle segment of this community lies in slightly finer sediments than the cluster from the upper cycle. Observe that these groupings relate to differences between rather than within the cycles. The contrasts in grain size also suggest somewhat different depositional regimes.
The three samples in the small cluster with numbers 17, 39 and 40 are from the base and top of the lower cycle. The enclosing rocks are calcareous siltstones where the calcium carbonate content exceeds that of the other rocks in both cycles. The most abundant forms are Mucrospirifer and Athyris with smaller amounts of Devonochonetes scitulus, Rhipidomella vanuxemi, Nuculoidea and Cypricardella. This represents a Mucrospirifer - Athyris community which is much more common in western than in central New York.
The cluster with samples 11 to 15 in Figure 18 is only known in the lower cycle. Mucrospirifer is abundant along with numbers of Spinocyrtia granulosa, Tropidolc:mtus, Actinopteria and Modiomorpha and is only found in the coarser rocks (siltstones) with little organic matter or calcium carbonate. This common Hamilton community will be termed the Mucrospirifer- bivalve community.
As usual, the dendrogram for the species is rather nebulous (Fig 18b) and about 21 percent of
192
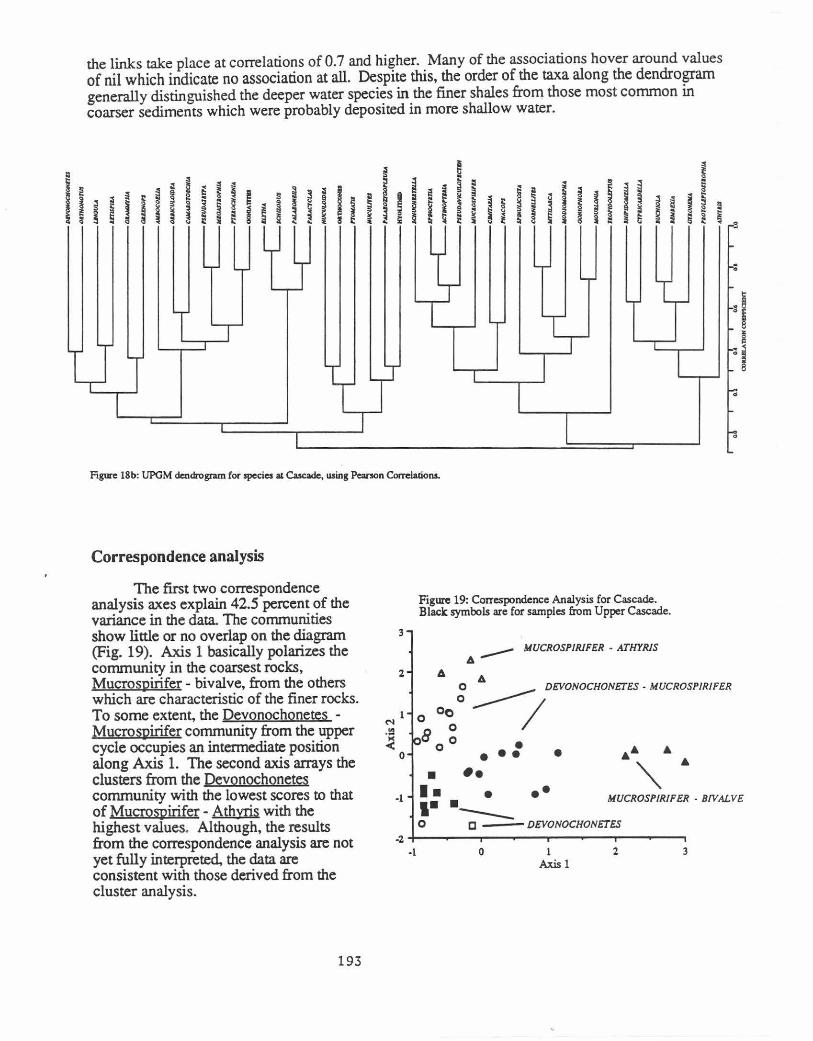
the links take place at correlations of 0.7 and higher. Many of the associations hover around values of nil which indicate no association at all. Despite this, the order of the taxa along the dendrogram generally distinguished the deeper water species in the finer shales from those most common in coarser sediments which were probably deposited in more shallow water.
~
~ ij a ~ i i §
~ e s ~
Figure 18b: UPGM dendrogram for species at Cascade, using Pearson Correlations.
Correspondence analysis
3
2
1 N -~ .'(
0
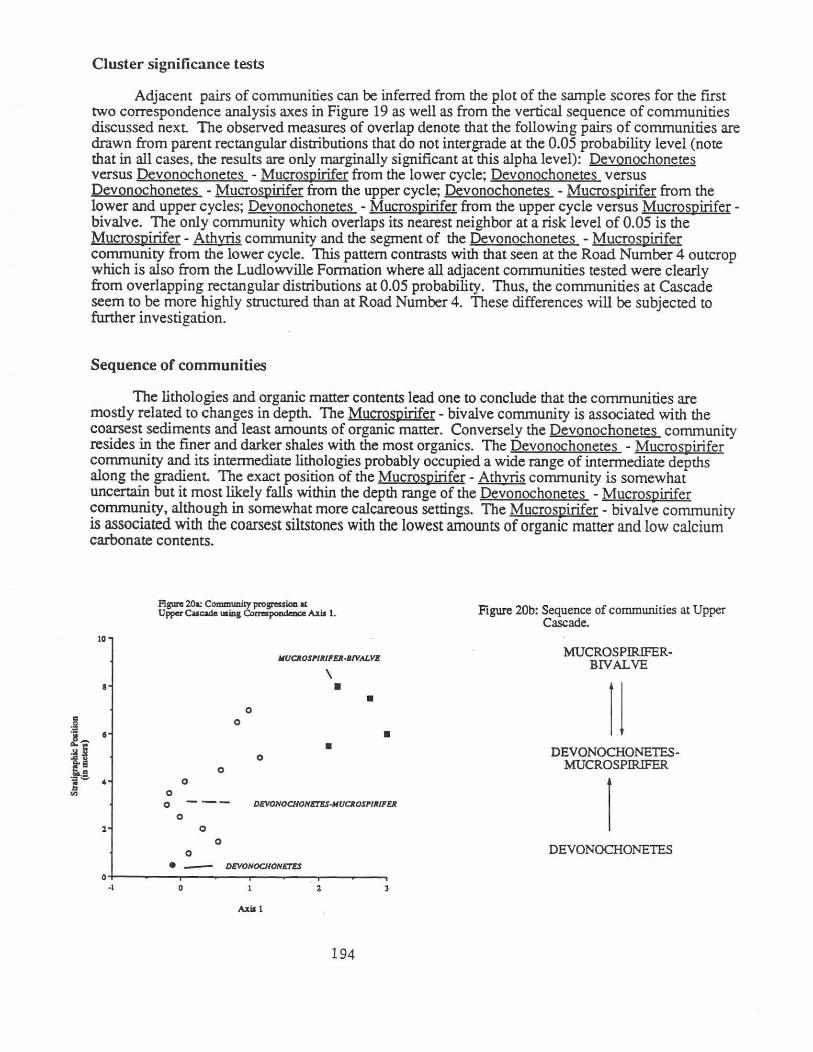
Figure 19: Correspondence Analysis for Cascade. Black symbols are for samples from Upper Cascade.
_...- MUCROSPIRiFER • ATHYRIS A
A g _,.----- DEVONOCHONETES • MUCROSPIRIFER
0 oo I 8 0
00
• • • • • ••
•
3
The first two correspondence analysis axes explain 42.5 percent of the variance in the data. The communities show little or no overlap on the diagram (Fig. 19). Axis 1 basically polarizes the community in the coarsest rocks, Mucrospirifer - bivalve, from the others which are characteristic of the finer rocks. To some extent. the Devonochonetes -Mucrospirifer community from the upper cycle occupies an intermediate position along Axis 1. The second axis arrays the clusters from the Devonochonetes community with the lowest scores to that of Mucros.pirifer- Athyris with the highest values. Although, the results from the correspondence analysis are not yet fully interpreted. the data are consistent with those derived from the cluster analysis.
·1 •• ,. • • --- •• MUCROSPIRIFER • BNALVE
0
-2 ·1
193
c --- DEYONOCHONETES
0 1 Axis 1
2 3
Cluster significance tests
Adjacent pairs of communities can be inferred from the plot of the sample scores for the first two correspondence analysis axes in Figure 19 as well as from the vertical sequence of communities discussed next The observed measures of overlap denote that the following pairs of communities are drawn from parent rectangular distributions that do not intergrade at the 0.05 probability level (note that in all cases, the results are only marginally significant at this alpha level): Devonochonetes versus Devonochonetes - Mucrospirifer from the lower cycle; Devonochonetes versus Devonochonetes - Mucrospirifer from the upper cycle; Devonochonetes - Mucrospirifer from the lower and upper cycles; Devonochonetes -Mucrospirifer from the upper cycle versus Mucrospiriferbivalve. The only community which overlaps its nearest neighbor at a risk level of 0.05 is the Mucro51'irifer- Athyris community and the segment of the Devonochonetes - Mucrospirifer community from the lower cycle. This pattern contrasts with that seen at the Road Number 4 outcrop which is also from the Ludlowville Formation where all adjacent communities tested were clearly from overlapping rectangular distributions at 0.05 probability. Thus, the communities at Cascade seem to be more highly structured than at Road Number 4. These differences will be subjected to further investigation.
Sequence of communities
The lithologies and organic matter contents lead one to conclude that the communities are mostly related to changes in depth. The MucroSl>irifer- bivalve community is associated with the coarsest sediments and least amounts of organic matter. Conversely the Devonochonetes community resides in the finer and darker shales with the most organics. The Devonochonetes - MucroSJ?irifer community and its intermediate lithologies probably occupied a wide range of intermediate depths along the gradient The exact position of the Mucrospirifer- Athyris community is somewhat uncertain but it most likely falls within the depth range of the Devonochonetes -Mucrospirifer community, although in somewhat more calcareous settings. The Mucrospirifer - bivalve community is associated with the coarsest siltstones with the lowest amounts of organic matter and low calcium carbonate contents.
Figure 20a: Community progression at Upper Cucado 111iD& Correspoodt::Dce Axis 1.
10
\ • • •
0 0
• • 0
0 0
0 0 - -- DEVONOCHONETES-MUCROSI'/11/FEA
0
l 0
0 0
• - DEVONOCHONETES
o+-------T-------~------~----~ ·1 0 3
Axis 1
194
Figure 20b: Sequence of communities at Upper Cascade.
MUCROSPIRlFERBNALVE
I J DEVONOCHONETES
MUCROSPIRIFER
I DEVONOCHONETES
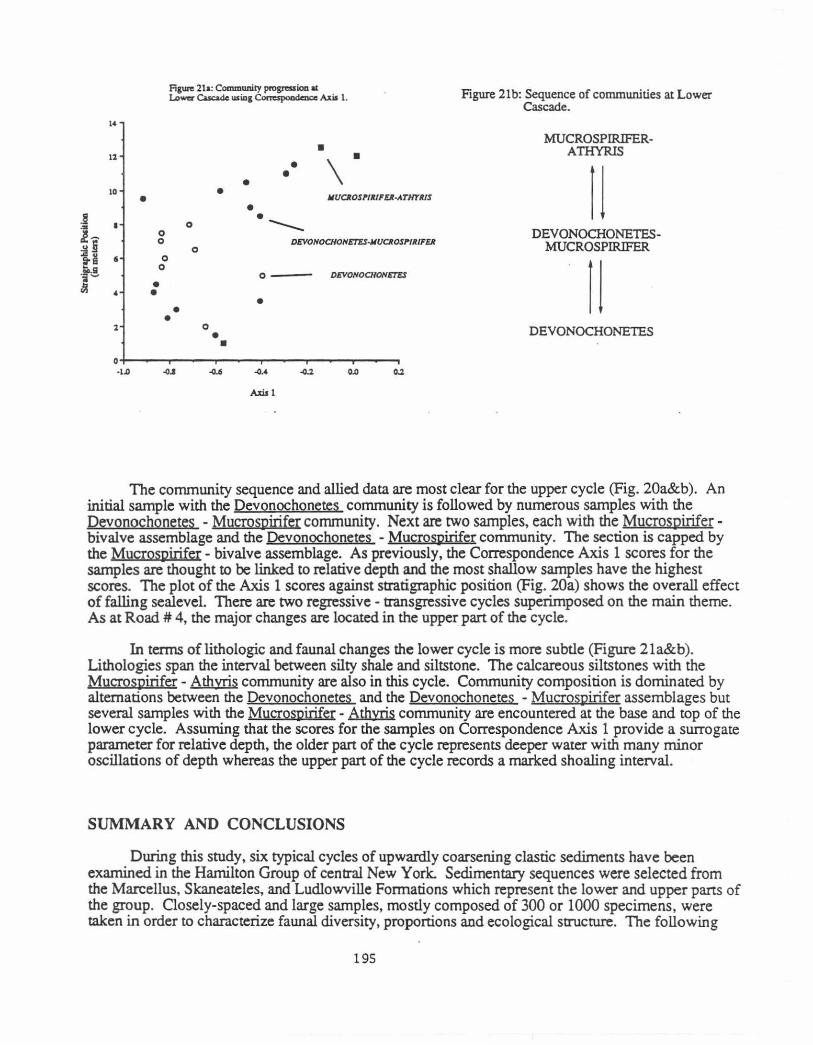
Figure 21a: Community progression at Lo,...,.. Dscade usiag Conespoodalce Axis 1.
• \
• • • • l l
• • JIUCAOSl'lllfFEA·A.THT/llS 10
• • 0 ---0 0 DEVONOCHONETES-JIUCAOSI'lll/FEA
0 0
0 0 DEVONOCHONETES
• • • • • l 0
• • o+---~----~--~~--~----r---~ · l.D ~.a ~.6 .0.4 -O.l O.D
AWl
Figure 21b: Sequence of communities at Lower Cascade.
MUCROSPIRIFERATHYRIS
I I DEVONOCHONETES
MUCROSPIRIFER
I I DEVONOCHONETES
The corrununity sequence and allied data are most clear for the upper cycle (Fig. 20a&b ). An initial sample with the Devonochonetes corrununity is followed by numerous samples with the Devonochonetes - Mucrospirifer community. Next are two samples, each with the Mucrospiriferbivalve assemblage and the Devonochonetes - MucroSl'irifer corrununity. The section is capped by the Mucrospirifer- bivalve assemblage. As previously, the Correspondence Axis 1 scores for the samples are thought to be linked to relative depth and the most shallow samples have the highest scores. The plot of the Axis 1 scores against stratigraphic position (Fig. 20a) shows the overall effect of falling sealevel. There are two regressive - transgressive cycles superimposed on the main theme. As at Road # 4, the major changes are located in the upper part of the cycle.
In terms of lithologic and faunal changes the lower cycle is more subtle (Figure 21a&b). Lithologies span the interval between silty shale and siltstone. The calcareous siltstones with the Mucrospirifer- Athyris corrununity are also in this cycle. Corrununity composition is dominated by alternations between the Devonochonetes and the Devonochonetes -Mucrospirifer assemblages but several samples with the Mucrospirifer - Athyris community are encountered at the base and top of the lower cycle. Assuming that the scores for the samples on Correspondence Axis 1 provide a surrogate parameter for relative depth, the older part of the cycle represents deeper water with many minor oscillations of depth whereas the upper part of the cycle records a marked shoaling interval.
SUMMARY AND CONCLUSIONS
During this study, six typical cycles of upwardly coarsening clastic sediments have been examined in the Hamilton Group of central New Y ode. Sedimentary sequences were selected from the Marcellus, Skaneateles, and Ludlowville Formations which represent the lower and upper parts of the group. Closely-spaced and large samples, mostly composed of 300 or 1000 specimens, were taken in order to characterize faunal diversity, proportions and ecological structure. The following
195
conclusions are drawn:
1. Samples of 300 specimens are large enough to characterize the most diverse Hamilton communities in this area.
2. The main pattern in all cycles consists of decreasing depth and correlated differences as evidenced by change in sediment grain size, sedimentary structures, amount of organic matter, and faunal composition.
3. The multivariate techniques of cluster analysis and correspondence analysis are successful in the identification of faunal communities or assemblages. They also point to relations between and within communities. The ordination method of correspondence analysis and the clustering algorithms produce complimentary data, and both types of techniques should be employed in concert Once the analyses are complete, it will be possible to specify average composition and variances for the various communities.
4. Statistical significance tests at the 0.05 probability level have been performed on all pairs of related communities as ascertained from the correspondence analysis plots and the known vertical sequences of communities. As expected, the multivariate means of all communities are statistically different, and all communities differ in average composition. Significance tests on clusters were also employed on the data to test the amounts of overlap in the populations from which the samples were derived. In two locations, Route 20 and Cascade, most or all of the communities comprise samples from rectangular distributions that do not overlap along the observed faunal gradients. These communities seem to have been tightly structured. At the other outcrops, Swamp Road, Cheese Factory Gulf, and Road #4, the pairs of communities come from populations that are characterized by overlapping rectangular distributions. In fact, the parent populations may exhibit as much as 50 percent of overlap (calculated for Gaussian or normal distributions) although lower percentages are more typical. Widely overlapping communities are deemed to be weakly structured and, perhaps, poorly integrated. The significance tests are still being explored.
5. The scores for the samples along the frrst correspondence axis extract the main pattern of change and relations between the communities for each outcrop and cycle treated. As mentioned previously, the cycles were probably produced by decreasing depth or shoaling, so these scores yield a generalized measure of relative depth. The exact relation between the first correspondence axis and depth cannot be specified at present, and the relationship could be rank order, linear or nonlinear.
196
REFERENCES
Allen, J.R.L., 1970. Sediments of the modem Niger Delta: a summary and review. in Morgan, J.P. ed., Deltaic sedimentation modem and ancient. Society of Economic Paleontologists and Mineralogists Special Publication 15, p. 138-151.
Bailey, J.B., 1983, Middle Devonian Bivalvia from the Solsville Member (Marcellus Formation), Central New York. American Museum of Natural History Bulletin, 174, p. 193-326,51 figures, 12 tables.
Brett, C.E., ed., 1986. Dynamic Stratigraphy and Depositional Environments of the Hamilton Group (Middle Devonian) in New York State, Part I. New York State Museum Bulletin 457, 156p.
Brett, C.E. and Baird, G.C., 1985. Carbonate-shale cycles in the Middle Devonian of New York: an evaluation of models for the origin of limestones in terrigenous shelf sequences. Geology, 13, p. 324-327.
Brett, C.E., Baird, G. C., and Miller, K.B., 1986. Sedimentary cycles and lateral facies gradients across a Middle Devonian shelf-to-basin-ramp, Ludlowville Formation, Cayuga Basin. New York State Geological Association Field Trip Guidebook for 58th Annual Meeting, p. 81-127.
Brower, J.C., 1987. Multivariate analysis in community paleoecology. The Compass, 64 (2), p. 89-102.
Brower, J.C. and Nye, O.B., Jr., 1986. Fossil communities in the lower Hamilton Group near Syracuse, New York. Program for Spring Meeting, Appalachian Basin Industrial Associates, p. 97-132.
Brower, J.C. and Nye, O.B., Jr., 1991. Quantitative analysis of paleocommunities in the lower Hamilton Group near Cazenovia, New York. in Landing, E. and Brett, C.E. eds., Dynamic stratigraphy and Depositional Environments of the Hamilton Group (Middle Devonian) in New York State, Part II. New York State Museum Bulletin 469, p. 37-74.
Brower, J.C. , Thomson, J.A., and Kile, K.M., 1988. The Paleoecology of a Middle Devonian regression. in McMillan, N.J., Embry, A.F., and Glass, D.J., Proceedings of the Second International Symposium on the Devonian System, Calgary, Canada, Volume III, p.243-256.
Cameron, B. 1967. Fossilization of an ancient (Devonian) soft-bodied worm. Science , 155 (3767), p. 1246-1248.
Carter, J.G. and Tevesz, M.J.S., 1978. Shell microstructure of a Middle Devonian (Hamilton Group) Bivalve fauna from central New York. Journal of Paleontology, 52 (4), p. 859-880, 21 text-figures.
Clifford, H.T. and Stephenson, W., 1975. An introduction to numerical taxonomy. Academic Press, New York, 229 p.
Gauch, H.G., Jr., 1982. Multivariate analysis in community ecology. Cambridge Univ. Press, New York, 298p.
Grasso, T.X., Brett, C.E., and Baird, G.C., 1985. Revised upper Marcellus (Middle Devonian) correlations in the Chenango Valley region: Central New York. GSA Abstracts with Programs, Northeast Section.
197
Landing, E. and Brett, C. E. eds., 1991. Dynamic stratigraphy and Depositional Environments of the Hamilton Group (Middle Devonian) in New York State, Part IT. New York State Museum Bulletin 469, 177p.
Legendre, L. and Legendre, P., 1983. Numerical ecology. Elsevier Scientific Publishing Company, New York, 419 p.
Ludwig, J.A. and Reynolds, J.F., 1988. Statistical ecology: a primer on methods and computing. J. Wiley and Sons, New York. 337p., 1 diskette.
Mazzullo, S.J., 1973. Deltaic depositional environments in the Hamilton Group (Middle Devonian), southeastern New York State. Journal of Sedimentary Petrology, 43 (4), p. 1061-1071.
McCollum, L.B., 1991. Revised stratigraphy, sedimentology, and paleoec paleoecology of the lowermost part of the Ludlowville Formation (Middle Devonian, central New York). in Landing, E. and Brett, C.E. eds., Dynamic stratigraphy and Depositional Environments of the Hamilton Group (Middle Devonian) in New York State, Part II. New York State Museum Bulletin 469, p. 107-128.
Miller, K.B., 1986. Depositional Environments and Sequences, "Pieurodictywn Zone", Ludlowville Formation of Western New York. in Brett, C.E., ed., 1986. Dynamic Stratigraphy and Depositional Environments of the Hamilton Group (Middle Devonian) in New York State, Part I. New York State Museum Bulletin 457, p.57-77.
Pielou, E.C., 1984. The interpretation of ecological data. John Wiley & Sons, New York, xi and 263 p.
Rickard, L.V., 1975. Correlation of the Silurian and Devonian rocks in New York State. New York State Museum and Science Service Map and Chart Series 24, 16 p.
Rollins, H.B., Eldredge, N., and Spiller, J., 1971. Gastropoda and Monoplacophora of the Solsville Member (Middle Devonian, Marcellus Formation) in the Chenango Valley, New York State. American Museum Natural History Bulletin 144, p.129-170.
Savarese, M., Gray, L.M., and Brett, C.E., 1986. Faunal and lithologic cyclicity in the Centerfield Member (Middle Devonian: Hamilton Group) of western New York: a reinterpretation of depositional history. in Brett, C.E., ed., 1986. Dynamic Stratigraphy and Depositional Environments of the Hamilton Group (Middle Devonian) in New York State, Part I. New York State Museum Bulletin 457, p. 32-56.
Sneath, P.H.A., 1977. A method for testing the distinctness of clusters, a test of the disjunction of two clusters in Euclidean space as measured by their overlap. Journal of Mathematical Geology, 9 (2), p. 123-143.
Sneath, P.H.A., 1979. The sampling distribution of theW Statistic of Disjunction for the arbitrary division of a random rectangular distribution. Journal of Mathematical Geology, 11 (4), p. 423-429.
Vogel, K., Golubic, S., and Brett, C.E., 1987. Endolith associations and their relation to facies distribution in the Middle Devonian of New York State, U.S.A. Lethaia, 20 (3), p. 263-290.
198
TRIP B-1: QUANTITATIVE PALEOECOLOGY OF HAMILTON GROUP LOCALITIES IN CENTRAL NEW YORK.
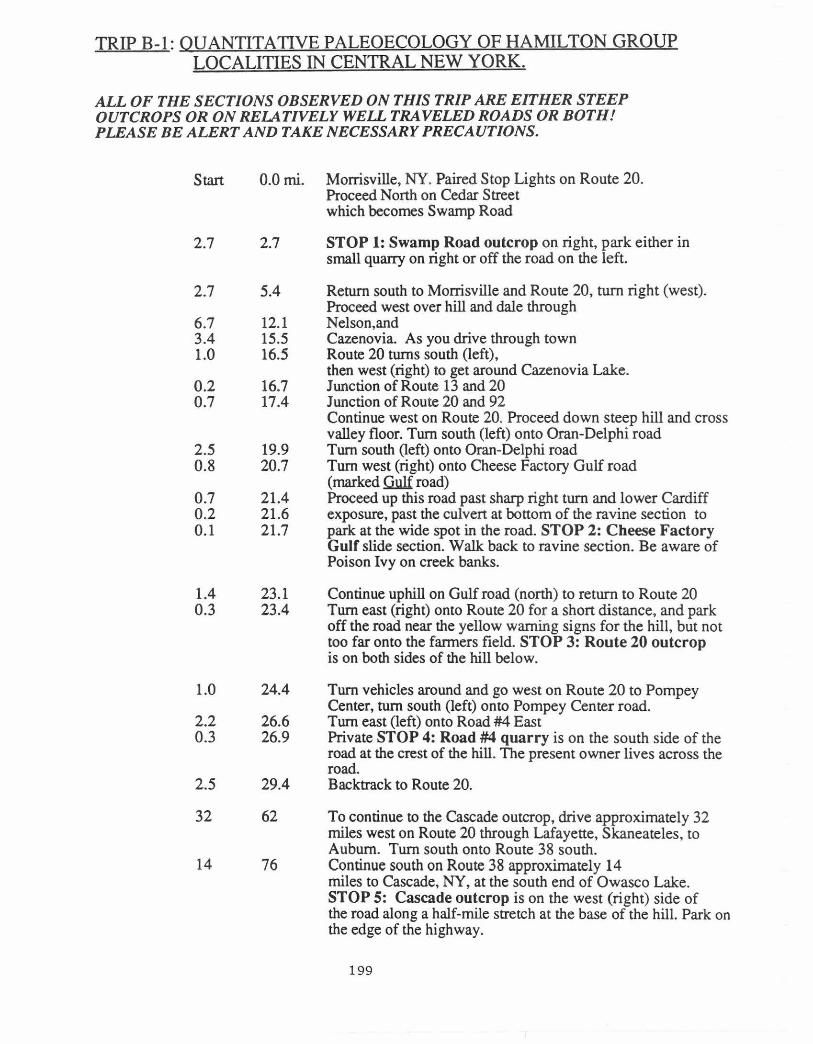
ALL OF THE SECTIONS OBSERVED ON THIS TRIP ARE EITHER STEEP OUTCROPS OR ON RELATIVELY WELL TRAVELED ROADS OR BOTH! PLEASE BE ALERT AND TAKE NECESSARY PRECAUTIONS.
Start O.Omi. Morrisville, NY. Paired Stop Lights on Route 20. Proceed North on Cedar Street which becomes Swamp Road
2.7 2.7 STOP 1: Swamp Road outcrop on right, park either in small quarry on right or off the road on the left.
2.7 5.4 Return south to Morrisville and Route 20, tum right (west). Proceed west over hill and dale through
6.7 12.1 Nelson,and 3.4 15.5 Cazenovia. As you drive through town 1.0 16.5 Route 20 turns south (left),
then west (right) to get around Cazenovia Lake. 0.2 16.7 Junction of Route 13 and 20 0.7 17.4 Junction of Route 20 and 92
Continue west on Route 20. Proceed down steep hill and cross valley floor. Turn south (left) onto Oran-Delphi road
2.5 19.9 Turn south (left) onto Oran-Delphi road 0 .8 20.7 Turn west (right) onto Cheese Factory Gulf road
(marked QWf road) 0.7 21.4 Proceed up this road past sharp right turn and lower Cardiff 0.2 21.6 exposure, past the culven at bottom of the ravine section to 0 .1 21.7 park at the wide spot in the road. STOP 2: Cheese Factory
Gulf slide section. Walk back to ravine section. Be aware of Poison Ivy on creek banks.
1.4 23.1 Continue uphill on Gulf road (north) to return to Route 20 0 .3 23.4 Turn east (right) onto Route 20 for a shon distance, and park
off the road near the yellow warning signs for the hill, but not too far onto the fanners field. STOP 3: Route 20 outcrop is on both sides of the hill below.
1.0 24.4 Turn vehicles around and go west on Route 20 to Pompey Center, turn south (left) onto Pompey Center road.
2.2 26.6 Turn east (left) onto Road #4 East 0.3 26.9 Private STOP 4: Road #4 quarry is on the south side of the
road at the crest of the hill. The present owner lives across the road.
2.5 29.4 Backtrack to Route 20.
32 62 To continue to the Cascade outcrop, drive approximately 32 miles west on Route 20 through Lafayette, Skaneateles, to Auburn. Turn south onto Route 38 south.
14 76 Continue south on Route 38 approximately 14 miles to Cascade, NY, at the south end of Owasco Lake. STOP 5: Cascade outcrop is on the west (right) side of the road along a half-mile stretch at the base of the hill. Park on the edge of the highway.
199