trilayers with subnanometer rms roughness
TRANSCRIPT

1
a-axis YBa2Cu3O7-x/PrBa2Cu3O7-x/YBa2Cu3O7-x
trilayers with subnanometer rms roughness
Y. Eren Suyolcu,1† Jiaxin Sun,1† Berit H. Goodge,2 Jisung Park,1 Jürgen Schubert,3 Lena F.
Kourkoutis,2,4 and Darrell G. Schlom1,4,5
1Department of Materials Sciences and Engineering, Cornell University, Ithaca, New York 14853,
USA
2School of Applied and Engineering Physics, Cornell University, Ithaca, New York 14853, USA
3Peter Grünberg Institute (PGI-9) and JARA-Fundamentals of Future Information Technology,
Forschungszentrum Jülich GmbH, 52425 Jülich, Germany
4Kavli Institute at Cornell for Nanoscale Science, Ithaca, New York 14853, USA
5Leibniz-Institut für Kristallzüchtung, Max-Born-Str. 2, 12489 Berlin, Germany
†These authors contributed equally to this work

2
ABSTRACT
We demonstrate a-axis YBa2Cu3O7-x/PrBa2Cu3O7-x/YBa2Cu3O7-x trilayers grown on (100) LaAlO3
substrates with improved interface smoothness. The trilayers are synthesized by ozone-assisted
molecular-beam epitaxy. The thickness of the PrBa2Cu3O7-x layer is held constant at 8 nm and the
thickness of the YBa2Cu3O7-x layers is varied from 24 nm to 100 nm. X-ray diffraction measurements
show all trilayers to have >95% a-axis content. The rms roughness of the thinnest trilayer is < 0.7 nm
and this roughness increases with the thickness of the YBa2Cu3O7-x layers. The thickness of the
YBa2Cu3O7-x layers also affects the transport properties: while all samples exhibit an onset of the
superconducting transition at and above 85 K, the thinner samples show wider transition widths, ΔTc.
High-resolution scanning transmission electron microscopy reveals coherent and chemically sharp
interfaces, and that growth begins with a cubic (Y,Ba)CuO3-x perovskite phase that transforms into
a-axis oriented YBa2Cu3O7-x as the substrate temperature is ramped up.

3
Shortly after the discovery of high-temperature superconductivity in YBa2Cu3O7,1,2
measurements showed that the superconducting proximity length along the a-axis (ξa ≈ 1.1 nm)3,4 of
YBa2Cu3O7-x is nearly an order of magnitude longer than along the c-axis (ξc ≈ 0.1 nm).4,5 Note that
ξc is shorter than the distance between the CuO2 planes. This difference makes the a-axis direction
relevant to forming controlled and reproducible YBa2Cu3O7-x based Josephson junctions (JJs) for
superconducting electronics.6 Most JJs in YBa2Cu3O7-x have been made using epitaxial YBa2Cu3O7-x
films oriented with the c-axis perpendicular to the film surface.7 This is because such films, referred
to as c-axis oriented films, exhibit the highest superconducting transition temperature (Tc), highest
critical current density (Jc), and smoothest surface. JJs in such films are made in the (001) plane to
exploit the longer in-plane coherence length, ξa. They occur at weak links present at grain
boundaries8–12 or formed by helium ion bombardment.13 They are also made by introducing tunnel
barriers by a ramp-junction process that involves patterning the c-axis YBa2Cu3O7-x film followed by
epitaxial regrowth.11,14,15
A more direct approach to fabricate high quality JJs—one that involves pristine interfaces
formed without breaking vacuum—is through the growth of YBa2Cu3O7-x films oriented with the
a-axis perpendicular to the film surface (i.e., a-axis oriented films). This was recognized early on and
numerous groups developed methods to grow a-axis oriented films16,17 as well as JJs based upon
them, e.g., a-axis oriented YBa2Cu3O7-x/PrBa2Cu3O7-x/YBa2Cu3O7-x trilayers.6,18 Although JJs were
successfully fabricated, the resulting junctions were neither controlled nor reproducible due to the
significant roughness of the a-axis oriented YBa2Cu3O7-x films.18 Note that the low-energy surface of
YBa2Cu3O7-x is the (001) plane,19 explaining the far smoother morphology of c-axis YBa2Cu3O7-x
films compared to a-axis YBa2Cu3O7-x films.

4
To improve the quality of a-axis YBa2Cu3O7-x films and heterostructures, several techniques
have been employed when using PrBa2Cu3O7-x as either a buffer layer or a barrier layer.20 These
include increasing the substrate temperature, either gradually21 or with a step-like ramp after the
a-axis buffer layer has nucleated,6,20,22,23 and even performing this in tandem with ramping down the
background oxidant gas pressure.21,24 Nonetheless, interface roughness has remained a major
challenge for samples showing good superconducting transitions (e.g., an rms of ~10 nm for a-axis
YBa2Cu3O7-x grown on (100) LaAlO3)21 as has avoiding the unwanted nucleation of c-axis
YBa2Cu3O7-x or PrBa2Cu3O7-x when the temperature is ramped.22,23
Following the initial pioneering studies on a-axis YBa2Cu3O7-x/PrBa2Cu3O7-x/YBa2Cu3O7-x
trilayers and a recognition of the challenges involved in making a viable JJ technology by this
approach, work on this system has all but ceased. Now decades later, we revisit this challenge
harnessing the improvements that have been made in the intervening years in thin film growth
methods. Using ozone-assisted molecular-beam epitaxy (MBE), we grow a-axis
YBa2Cu3O7-x/PrBa2Cu3O7-x/YBa2Cu3O7-x trilayers paying particular attention to growth conditions
that yield smooth surfaces. We study the thickness dependence of the surface roughness as well as
the superconducting transition width. Our results, including cross-sectional scanning transmission
electron microscopy with electron energy loss spectroscopy (STEM-EELS) to characterize the
interfaces with chemical specificity, demonstrate that the interface roughness can be decreased
significantly to a level comparable to the thickness of relevant tunneling barrier layers. The
substantial improvement in interface smoothness that we observe in a-axis
YBa2Cu3O7-x/PrBa2Cu3O7-x/YBa2Cu3O7-x trilayers suggests that a-axis YBa2Cu3O7-x-based JJs with

5
requisite smoothness to provide the precise thickness control of the tunnel barrier needed for a JJ
technology is achievable.
YBa2Cu3O7-x/PrBa2Cu3O7-x/YBa2Cu3O7-x trilayers with 24 nm, 32 nm, 64 nm, and 100 nm thick
YBa2Cu3O7-x layers, in which the PrBa2Cu3O7-x layer thickness is kept constant at 8 nm, were grown
on 10 mm 10 mm (100)-oriented LaAlO3 substrates by ozone-assisted MBE (Fig. 1(a)). Although
high quality a-axis YBa2Cu3O7-x films have been grown on (100) LaSrGaO4 substrates,25 we used
(100) LaAlO3 substrates in this work because our goal is to identify a path that can be scaled to large
diameters to enable its translation to a viable technology. 3-inch diameter LaAlO3 substrates are
currently available; in the past, even 4-inch diameter LaAlO3 substrates were commercially
produced.26
The YBa2Cu3O7-x/PrBa2Cu3O7-x/YBa2Cu3O7-x trilayers were synthesized in a Veeco GEN10
MBE. Yttrium (99.6%), barium (99.99%), praseodymium (99.1%), and copper (99.99%) were
evaporated from thermal effusion cells with fluxes of 1.11013 cm-2s-1, 2.21013 cm-2s-1, and
3.31013 cm-2s-1, respectively. Prior to growth, the (100) LaAlO3 substrates (CrysTec GmbH) were
etched in boiling water, annealed at 1300 °C in air for 10 hours, and then etched again in boiling
water, to obtain an AlO2-terminated surface with a step-and-terrace morphology.27 Following this
surface treatment, the backside of the (100) LaAlO3 substrates were coated with a 10 nm thick
titanium adhesion layer followed by 200 nm of platinum, enabling the otherwise transparent
substrates to be radiatively heated during MBE growth. The YBa2Cu3O7-x (or PrBa2Cu3O7-x) layers
were grown by simultaneously depositing yttrium (or praseodymium), barium, and copper onto the
heated substrate under a continuous flux of distilled ozone (~80% O3 + 20% O2) yielding a
background pressure of 110-6 Torr. After growth, the samples were cooled to under 100 °C in the

6
same pressure of distilled ozone in which they were grown before turning off the ozone molecular
beam and removing the samples from vacuum.
Because YBa2Cu3O7-x is a point compound that is unable to accommodate appreciable off-
stoichiometry,28 flux calibration presents a significant challenge where secondary impurity phases
nucleate easily and significantly degrade film quality.29 We tackle this challenge by separately
calibrating the flux of each element by growing binary oxides of the constituents, namely Y2O3, PrO2,
BaO, and CuO. From these separate binary flux calibrations, the temperatures of the effusion cells
containing yttrium, barium, praseodymium, and copper are adjusted to match the desired 1:2:3 flux
ratio among Y(Pr):Ba:Cu. The temperature of the substrate is measured during growth by a
thermocouple (TTc) that is positioned close to, but not in direct contact with the substrate, and by an
optical pyrometer (TPyr) operating at a wavelength of 1550 nm. The growth of the trilayers starts at
low-temperature, TTc ≈ 420 °C (TPyr ≈ 530 °C), resulting in a cubic perovskite (Y,Ba)CuO3-x phase30
for the first few layers and ends at TTc ≈ 570 °C (TPyr ≈ 620 °C) following a temperature-ramping
procedure. Details of the flux calibration method (including the characterization of individual binary
oxides) are presented in Figs. S1-S5 of the Supplementary Material. Also shown are the temperature-
ramping details and the in-situ reflection high-energy electron diffraction (RHEED) characterization
of a reference a-axis YBa2Cu3O7-x single-phase film grown as part of the optimization of the growth
procedure (Fig. S6).
During growth the films were monitored by in-situ RHEED with KSA-400 software and a Staib
electron gun operating at 13 kV and 1.45 A. RHEED images taken during the growth of the 24 nm
YBa2Cu3O7-x/8 nm PrBa2Cu3O7-x/24 nm YBa2Cu3O7-x trilayer are shown in Figs. 1(b)-1(g). The
structural quality and the a-axis/c-axis ratio of the samples was explored using a PANalytical

7
Empyrean x-ray diffractometer (XRD) at 45 kV and 40 mA with Cu K1 radiation (1.54057 Å). For
surface morphological characterization of the films, ex situ atomic force microscopy (AFM)
measurements were conducted using an Asylum Cypher ES Environmental AFM system. Resistance
as a function of temperature measurements were carried out using a homemade four-point van der
Pauw geometry system that slowly dips the samples into a Dewar of liquid helium.
Detailed investigations of the films were conducted using atomic-resolution scanning
transmission electron microscopy (STEM). Cross-sectional TEM specimens were prepared by
focused ion beam (FIB) lift-out with a Thermo Fisher Helios G4 UX Dual Beam system. The samples
were imaged on an aberration-corrected FEI Titan Themis at 300 kV. STEM high-angle annular dark-
field (HAADF) imaging was performed with a probe convergence semi-angle of 21.4 mrad and inner
and outer collection angles from 68-340 mrad. STEM electron energy loss spectroscopy (EELS)
measurements were performed on the same Titan system equipped with a 965 GIF Quantum ER and
Gatan K2 Summit direct detector operated in electron counting mode, with a beam current of ∼50 pA
and scan times of 2.5 or 5 ms per 0.4 Å pixel. A multivariate weighted principal component analysis
routine (MSA Plugin in Digital Micrograph) is used to decrease the noise level in STEM data.31

8
Figure 1. (a) Schematic of the YBa2Cu3O7-x/PrBa2Cu3O7-x/YBa2Cu3O7-x trilayers grown on
(100) LaAlO3 substrates. (b-g) Real-time RHEED images acquired along the [010] azimuth of the
(100) LaAlO3 substrate during the growth of the 24 nm YBa2Cu3O7-x/8 nm PrBa2Cu3O7-x/24 nm
YBa2Cu3O7-x trilayer at the six different times schematically illustrated in (a). The RHEED patterns
are from the bottom YBa2Cu3O7-x layer (b), YBa2Cu3O7-x/PrBa2Cu3O7-x interface (c), PrBa2Cu3O7-x
layer (d,e), PrBa2Cu3O7-x/YBa2Cu3O7-x interface, and (f) top YBa2Cu3O7-x layer. The red arrows
added to (b) and (g) point to the diffraction streaks associated with the c-axis of the YBa2Cu3O7-x
lying in-plane.
The structural quality of the samples is assessed by XRD measurements. In the coupled θ-2θ
XRD scans in Fig. 2(a), only h00, 0k0, and 00ℓ reflections of the YBa2Cu3O7-x and PrBa2Cu3O7-x
phases are indexed, indicating that the film only contains phases with the desired stoichiometry; they

9
are free of impurity phases associated with off-stoichiometry. With increasing YBa2Cu3O7-x layer
thicknesses, 00ℓ reflections emerge showing the nucleation and propagation of c-axis grains in the
films. Off-axis scans of the 102 family of reflections of the orthorhombic YBa2Cu3O7-x /
PrBa2Cu3O7-x at ≈ 56.6° and ≈ 33.4° are used to measure the a-axis and c-axis content of the
orthorhombic grains, respectively. Note that = 90 aligns the diffraction vector to be perpendicular
to the plane of the substrate.32 In the 102 scan of the trilayer sample shown in Fig. 2(b), four peaks
associated with the a-axis grains are observed corresponding to 90° in-plane rotational twinning: the
c-axis of the YBa2Cu3O7-x and PrBa2Cu3O7-x is aligned parallel to the [010] direction of the (100)
LaAlO3 substrate in one set of twin domains and parallel to the [001] direction of the (100) LaAlO3
substrate in the other set of twin domains.17,20,33,34 No intensity associated with c-axis grains is
observed indicating that the film contains no c-axis grains within the resolution of our XRD scan.
The off-axis scans of all trilayer samples shown in Fig. S5 indicate that all four trilayers have more
than 95% a-axis content in the Y(Pr)Ba2Cu3O7-x orthorhombic phase. In addition to the orthorhombic
phases, we also observe a cubic perovskite phase. This phase has been previously reported in the
literature as a low-temperature, kinetically-stabilized I-centered cubic phase35 or primitive simple-
cubic phase.36 The formation of this phase and its role in stabilizing the a-axis
YBa2Cu3O7-x/PrBa2Cu3O7-x/YBa2Cu3O7-x trilayers is discussed below in tandem with its observation
by HAADF-STEM. In the reciprocal space map (RSM) around the LaAlO3 1̅03 reflection
(pseudocubic) in Fig. 2(c), we also observe a perovskite-like 1̅03 reflection (denoted p-
(Y,Ba)CuO3-x) and the orthorhombic phase 303̅/31̅0 and 033/1̅30 reflections associated with the a-
axis and b-axis YBa2Cu3O7-x grains, respectively..

10
Figure 2. X-ray diffraction of YBa2Cu3O7-x/PrBa2Cu3O7-x/YBa2Cu3O7-x trilayers with 24 nm, 32 nm,
64 nm, and 100 nm thick YBa2Cu3O7-x layers. (a) θ-2θ scans of the trilayers show only h00, 0k0, and
00ℓ reflections. (b) Off-axis 102 reflection scans at ≈ 56.6° (red) and ≈ 33.4° (blue) of the
trilayer with 24 nm thick YBa2Cu3O7-x layers showing the absence of c-axis grains. (c) RSM around
the LaAlO3 1̅03 reflection (pseudocubic) of this same trilayer with 24 nm thick YBa2Cu3O7-x layers
showing the a-axis and b-axis orthorhombic 303̅/31̅0 and 033/1̅30 reflections of YBa2Cu3O7-x, as
well as the perovskite (Y,Ba)CuO3-x 1̅03 reflection. The positions of these film reflections are
indicated by the “+” symbols and dashed ellipses near the corresponding reflection labels.
The surface morphologies of the same as-grown YBa2Cu3O7-x/PrBa2Cu3O7-x/YBa2Cu3O7-x
trilayers were established by ex situ AFM in tapping mode. With increasing YBa2Cu3O7-x layer
thickness, the elongated YBa2Cu3O7-x grains as well as the in-plane 90° rotational twinning of these
rectangular-shaped features become visible in the 2 µm 2 µm topography scans presented in
Figs. 3(a)-3(d). This morphology arises from the much slower growth rate of YBa2Cu3O7-x grains
along [001] than in the (001) plane.37 The root-mean-square (rms) roughness also increases with
increasing YBa2Cu3O7-x layer thickness from 0.62 nm in the thinnest 24 nm/8 nm/24 nm trilayer to
2.3 nm in the thickest 100 nm/8 nm/100 nm trilayer. Surface roughness is an important metric
affecting the yield and electrical performance of YBa2Cu3O7-x-based JJs involving extrinsic

11
interfaces, i.e., tunnel barriers. The 0.62 nm rms roughness we observe is the smoothest reported in
the literature and a significant reduction from the 11.3 nm measured previously on a-axis
YBa2Cu3O7-x/PrBa2Cu3O7-x bilayers with 270 nm thick YBa2Cu3O7-x layers grown on (100) LaAlO3
substrates.21
Figure 3. Surface morphology of the YBa2Cu3O7-x/PrBa2Cu3O7-x/YBa2Cu3O7-x trilayers revealed by
AFM. (a)-(d) 2 µm 2 µm topography scans of the 24 nm/8 nm/24 nm, 32 nm/8 nm/32 nm,
64 nm/8 nm/64 nm, and 100 nm/8 nm/100 nm trilayers in tapping mode, respectively. (e) rms
roughness calculated from (a)-(d) as a function of the YBa2Cu3O7-x layer thickness. The dotted line
serves as a guide for the eye.
The resistance as a function of temperature (R-T) was measured on the same
YBa2Cu3O7-x/PrBa2Cu3O7-x/YBa2Cu3O7-x trilayers; the results are presented in Fig. 4. As is evident
from the R-T plots in Fig. 4(a), all trilayers superconduct. The normal state resistance decreases and
the onset temperature of the superconducting transition (Tonset) increases with increasing YBa2Cu3O7-x

12
layer thickness—from 85 K for the 24nm/8nm/24nm trilayer to 90 K for the 100nm/8nm/100nm
trilayer, as shown in Fig. 4(b). We define Tonset as the temperature at which the resistance falls below
a linear extrapolation of the R vs. T behavior from its slope in the 200-300 K regime. The
superconducting transition width (ΔTc), here defined as the temperature difference between Tonset and
the temperature at which the resistance is zero (within the noise of our measurement), ΔTc, decreases
with increasing YBa2Cu3O7-x layer thickness from 29 K for the 24 nm/8 nm/24 nm trilayer to 10 K
for the 100 nm/8 nm/100 nm trilayer, as seen in Fig. 4(c). Compared to c-axis YBa2Cu3O7-x films,
however, these transition widths are still relatively broad.38 Such behavior is ubiquitous in twinned
a-axis YBa2Cu3O7-x films17,20,21,24 especially when the thickness of the a-axis YBa2Cu3O7-x is under
100 nm.18,39 It may arise from local disorder and inhomogeneities in the samples, insufficient
oxidation, or from the degradation of the samples over time.40
Figure 4. Transport properties of the same YBa2Cu3O7-x/PrBa2Cu3O7-x/YBa2Cu3O7-x trilayers. (a)
Resistance as a function of temperature, (b) onset of the superconducting transition (Tonset) as a
function of YBa2Cu3O7-x layer thickness, and (c) superconducting transition width (∆Tc) as a function
of YBa2Cu3O7-x layer thickness. The dotted lines are guides to the eye.

13
To reveal the microstructure and interface abruptness of the samples, we studied two trilayer
samples with cross-sectional high-resolution STEM. A low-magnification HAADF-STEM image of
the 24 nm/8 nm/24 nm YBa2Cu3O7-x/PrBa2Cu3O7-x/YBa2Cu3O7-x trilayer shown in Fig. 5(a) is
representative of the complete sample. Individual layers are distinguished as darker and brighter
regions due to the atomic number (Z) contrast41 of HAADF imaging. The PrBa2Cu3O7-x layer gives
brighter contrast compared to the YBa2Cu3O7-x layer because praseodymium (ZPr = 59) is heavier
than yttrium (ZY = 39). The LaAlO3 substrate also shows relatively bright contrast for the same reason
(ZLa = 57). A higher magnification image (Fig. 5(b)) focusing on a representative interface region
reveals that the interfaces in the YBa2Cu3O7-x/PrBa2Cu3O7-x/YBa2Cu3O7-x trilayer are coherent. In
neither low-magnification nor in high-magnification scans were c-axis grains observed in our STEM
images, consistent with the high volume fraction of a-axis growth measured by XRD. Nevertheless,
structural coherence does not prove chemical abruptness at interfaces involving cuprate high-
temperature superconductors.42,43
The chemical abruptness of the YBa2Cu3O7-x/PrBa2Cu3O7-x/YBa2Cu3O7-x interfaces was
assessed by atomic-resolution elemental mapping via STEM-EELS. Figures 5(c)-5(e) show the
elemental maps obtained using Pr–M5,4 (red), Y–L3,2 (green), and Ba–M5,4 (blue) edges in the region
outlined by the tan rectangle in Fig. 5(a). A red, green, blue (RGB) overlay of the elemental maps
from this region is shown in Fig. 5(f), while Fig. 5(g) shows the simultaneously acquired ADF-STEM
image of the same region. Atomic-resolution EELS maps reveal abrupt interface profiles,
corroborating the STEM-HAADF images. Both interfaces show minimal Y-Pr intermixing, although
some asymmetry of the interface profiles is seen. The lower YBa2Cu3O7-x/PrBa2Cu3O7-x interface
shows a nearly perfect interface profile free of Y–Pr intermixing; the upper interface

14
(PrBa2Cu3O7-x/YBa2Cu3O7-x) presents a slightly rougher local profile with a roughness limited to 1-2
monolayers.
The roughness of the interfaces revealed by STEM and STEM-EELS in Fig. 5 is consistent
with the qualitative observations made during growth by in situ RHEED (Figs. 1(b)-1(g)) of this same
YBa2Cu3O7-x/PrBa2Cu3O7-x/YBa2Cu3O7-x trilayer. The arrowed streaks of a-axis oriented
YBa2Cu3O7-x in Fig. 1(b) promptly disappear in transitioning from the lower YBa2Cu3O7-x layer to
the PrBa2Cu3O7-x barrier layer in Fig. 1(c), indicating that the PrBa2Cu3O7-x barrier layer uniformly
covers the lower YBa2Cu3O7-x layer. At the upper interface, however, it takes noticeably longer for
the arrowed streaks of the upper YBa2Cu3O7-x layer to reappear (Figs. 1(f) and 1(g)). Further, the time
that it takes for the arrowed streaks of a-axis oriented YBa2Cu3O7-x to reappear in going from the
PrBa2Cu3O7-x barrier to the YBa2Cu3O7-x upper layer takes progressively longer for the thicker
trilayers. This is consistent with the increased surface roughness seen by AFM in Fig. 3 as the
thickness of the YBa2Cu3O7-x layers increases.
In addition to the coherent and chemically sharp interfaces, some defects were observed by
STEM. For example, intergrowths of an extra Cu-O layer intercalated into the YBa2Cu3O7-x structure
to locally form YBa2Cu4O8-x (Fig. S7) are seen. Such intergrown layers are well-known and common
in YBa2Cu3O7-x—in bulk, thin-films, and heterostructures.44–46

15
Figure 5. (a) Low-magnification cross-sectional HAADF-STEM image of the 24 nm/8 nm/24 nm
YBa2Cu3O7-x/PrBa2Cu3O7-x/YBa2Cu3O7-x trilayer revealing the microstructure and interface
abruptness at the atomic scale. Individual YBa2Cu3O7-x and PrBa2Cu3O7-x layers are separated using
dashed lines and the pink arrows indicate the interfaces. (b) High-magnification scan of the area
highlighted by the orange rectangle in (a) demonstrates the interfaces are fully coherent. (c)–(e)
Atomically resolved Pr–M5,4 edge (red), Y–L3,2 edge (green), and Ba–M5,4 edge (blue) elemental maps
evidencing the sharp chemical abruptness of the interfaces. (f) The RGB overlay and (g) the
simultaneously acquired ADF-STEM image of the same region, outlined by the tan rectangle in (a).
The cross-sectional HAADF-STEM imaging also unveils the location of the cubic perovskite
(Y,Ba)CuO3-x phase detected in the XRD measurements. The thickness of the cubic (Y,Ba)CuO3-x

16
layer is found to be ~10 nm and it is located under the bottom YBa2Cu3O7-x layer (Fig. S7(a)). This
cubic (Y,Ba)CuO3-x layer forms at the start of growth when the substrate is coldest and surface
diffusion is most constrained. Yttrium and barium are unable to diffuse sufficiently far to establish
the Y-Ba-Ba-… ordered arrangement found in the unit cell of YBa2Cu3O7-x; instead yttrium and
barium share the A-site of the resulting perovskite structure, with copper on the B-site.47
As the temperature of the substrate is ramped, the diffusion lengths increase, and in-plane
structural order emerges. The resulting a-axis YBa2Cu3O7-x grains grow epitaxially in one of two
symmetry equivalent orientations: with the c-axis parallel to either [010] or [001] of the cubic
(Y,Ba)CuO3-x layer on which they nucleate on the (100) LaAlO3 substrate. One set of such domains
is clearly seen in Fig. S7: the set with the c-axis along the horizontal direction of the image. The other
set, with the c-axis oriented into the plane of the image, are more difficult to establish because their
spacing along the horizontal direction is the same perovskite spacing as the cubic (Y,Ba)CuO3-x layer
on which they nucleated.
Our hypothesis is that the ~10 nm thick cubic (Y,Ba)CuO3-x layer only lies under the a-axis
oriented YBa2Cu3O7-x layer and that the regions in which this perovskite structure appears to extend
further, i.e., through and all the way to the surface of the trilayer, are actually the set of a-axis domains
oriented with the c-axis running into the plane of the image. This hypothesis is consistent with the
grain size of the a-domains seen in the AFM images (Figs. 3(a)-3(d)) as well as published by others
for a-axis YBa2Cu3O7-x grown on (100) LaAlO3.17,20,33,34,47,48 We know from the XRD -scans (Figs.
2(b) and S5) that there is an equal volume fraction of both 90° in-plane rotation twin variants and
although the volume sampled in our STEM investigation is small, this hypothesis is also consistent
with our STEM observations. Once the substrate temperature is sufficiently high that the a-axis

17
YBa2Cu3O7-x grains nucleate, both twin variants continue through the entire
YBa2Cu3O7-x/PrBa2Cu3O7-x/YBa2Cu3O7-x trilayer.
Lastly, in order to gain insights on the effect of c-axis grains in the trilayers, we perform
additional cross-sectional STEM investigations on a less-ideal 32 nm/8 nm/32 nm sample. XRD
shows the sample chosen to contain a higher volume fraction (16%) of c-axis oriented
YBa2Cu3O7-x/PrBa2Cu3O7-x (Fig. S8) and to have a higher rms roughness than the 32 nm/8 nm/32 nm
trilayer characterized in Figs. 2-4. HAADF-STEM imaging (Fig. S9) of this less-ideal
32 nm/8 nm/32 nm trilayer confirms the presence of c-axis oriented grains in the structure and also
demonstrates the rougher interfaces. Although the interfaces are rougher, STEM-EELS (Fig. S10)
shows that they remain chemically abrupt. These results, when evaluated together, explain the
rougher surfaces of the thicker samples. The c-axis grain formation in the bottom YBa2Cu3O7-x layer
not only disturbs the PrBa2Cu3O7-x layer (and interface) profiles, but also directly influences the top
surface roughness with changes in the local structural homogeneity in the first layers of the growth.
The strong correlation between surface roughness and the volume fraction of c-axis grains in a-axis
YBa2Cu3O7-x films has been previously noted.39 To avoid c-axis oriented YBa2Cu3O7-x, we initiate
growth at a substrate temperature where only cubic (Y,Ba)CuO3-x can nucleate.
In conclusion, we revisited the growth of a-axis YBa2Cu3O7-x/PrBa2Cu3O7-x/YBa2Cu3O7-x
trilayers and were able to improve their structural quality. By leveraging a temperature-ramping
procedure that begins with a cubic (Y,Ba)CuO3-x buffer layer, we have grown high-quality a-axis
trilayers as confirmed by ex-situ XRD measurements. AFM investigations revealed the improved
surface quality with rms roughness that is less than ξa for the thinnest
YBa2Cu3O7-x/PrBa2Cu3O7-x/YBa2Cu3O7-x trilayers. STEM analyses unveil the interrelation between

18
c-axis oriented regions and surface roughness. Resistivity vs. temperature measurements exhibit an
onset of the superconducting transition at Tonset ~ 85 K and also the widening of the superconducting
transition width with decreasing YBa2Cu3O7-x film thickness. Sharp and coherent interfaces with
limited elemental intermixing are evidenced by atomic-resolution HAADF-STEM and STEM-EELS.
Our findings suggest that with precise control of the growth conditions, the sharp interfaces and
smooth surfaces required in a-axis-based YBa2Cu3O7-x heterostructures for high-performance
Josephson junctions and other oxide electronics are within reach.

19
ACKNOWLEDGMENTS
This work was primarily supported by Ambature, Inc. B.H.G. and L.F.K. acknowledge support
by the Department of Defense Air Force Office of Scientific Research (No. FA 9550-16-1-0305). The
authors thank Ronald Kelly, Michael Lebby, Davis Hartman, Mitch Robson, and Ivan Bozovic for
fruitful discussions. This work made use of a Helios FIB supported by NSF (DMR-1539918) and the
Cornell Center for Materials Research (CCMR) Shared Facilities, which are supported through the
NSF MRSEC Program (Grant No. DMR-1719875). The authors acknowledge Malcolm Thomas,
Donald Werder, John Grazul, and Mariena Silvestry Ramos for assistance in the Electron Microscopy
CCMR facilities. The FEI Titan Themis 300 was acquired through Grant No. NSF-MRI-1429155,
with additional support from Cornell University, the Weill Institute, and the Kavli Institute at Cornell.
This work also made use of the CESI Shared Facilities partly sponsored by the NSF (Grant No. DMR-
1338010) and the Kavli Institute at Cornell. Substrate preparation was performed in part at the Cornell
NanoScale Facility, a member of the National Nanotechnology Coordinated Infrastructure (NNCI),
which is supported by the NSF (Grant No. NNCI-2025233). The authors thank Sean C. Palmer for
his assistance with substrate preparation.
Data availability Statement
The data that support the findings of this study are available from the corresponding author upon
reasonable request.

20
REFERENCES
1 M.K. Wu, J.R. Ashburn, C.J. Torng, P.H. Hor, R.L. Meng, L. Gao, Z.J. Huang, Y.Q. Wang, and
C.W. Chu, Phys. Rev. Lett. 58, 908 (1987). 2 R.J. Cava, B. Batlogg, R.B. van Dover, D.W. Murphy, S. Sunshine, T. Siegrist, J.P. Remeika, E.A.
Rietman, S. Zahurak, and G.P. Espinosa, Phys. Rev. Lett. 58, 1676 (1987). 3 H.-C. Ri, R. Gross, F. Gollnik, A. Beck, R.P. Huebener, P. Wagner, and H. Adrian, Phys. Rev. B
50, 3312 (1994). 4 R.I. Rey, C. Carballeira, J.M. Doval, J. Mosqueira, M.V. Ramallo, A. Ramos-Álvarez, D. Sóñora,
J.A. Veira, J.C. Verde, and F. Vidal, Supercond. Sci. Technol. 32, 045009 (2019). 5 B. Oh, K. Char, A.D. Kent, M. Naito, M.R. Beasley, T.H. Geballe, R.H. Hammond, A. Kapitulnik,
and J.M. Graybeal, Phys. Rev. B 37, 7861 (1988). 6 J.B. Barner, C.T. Rogers, A. Inam, R. Ramesh, and S. Bersey, Appl. Phys. Lett. 59, 742 (1991). 7 R. Gross, L. Alff, A. Beck, O.M. Froehlich, D. Koelle, and A. Marx, IEEE Trans. Appl. Supercond.
7, 2929 (1997). 8 R.H. Koch, C.P. Umbach, G.J. Clark, P. Chaudhari, and R.B. Laibowitz, Appl. Phys. Lett. 51, 200
(1987). 9 J.E. Zimmerman, J.A. Beall, M.W. Cromar, and R.H. Ono, Appl. Phys. Lett. 51, 617 (1987). 10 J. Mannhart, P. Chaudhari, D. Dimos, C.C. Tsuei, and T.R. McGuire, Phys. Rev. Lett. 61, 2476
(1988). 11 D. Koelle, R. Kleiner, F. Ludwig, E. Dantsker, and J. Clarke, Rev. Mod. Phys. 71, 631 (1999). 12 H. Hilgenkamp and J. Mannhart, Rev. Mod. Phys. 74, 485 (2002). 13 S.A. Cybart, E.Y. Cho, T.J. Wong, B.H. Wehlin, M.K. Ma, C. Huynh, and R.C. Dynes, Nature
Nanotechnology 10, 598 (2015). 14 J. Gao, Yu. Boguslavskij, B.B.G. Klopman, D. Terpstra, G.J. Gerritsma, and H. Rogalla, Appl.
Phys. Lett. 59, 2754 (1991). 15 J. Gao, Yu.M. Boguslavskij, B.B.G. Klopman, D. Terpstra, R. Wijbrans, G.J. Gerritsma, and H.
Rogalla, Journal of Applied Physics 72, 575 (1992). 16 H. Asano, M. Asahi, and O. Michikami, Jpn. J. Appl. Phys. 28, L981 (1989). 17 C.B. Eom, A.F. Marshall, S.S. Laderman, R.D. Jacowitz, and T.H. Geballe, Science 249, 1549
(1990). 18 I. Takeuchi, P.A. Warburton, Z. Trajanovic, C.J. Lobb, Z.W. Dong, T. Venkatesan, M.A. Bari,
W.E. Booij, E.J. Tarte, and M.G. Blamire, Appl. Phys. Lett. 69, 112 (1996). 19 F. Miletto Granozio and U.S. di Uccio, Journal of Crystal Growth 174, 409 (1997). 20 A. Inam, C.T. Rogers, R. Ramesh, K. Remschnig, L. Farrow, D. Hart, T. Venkatesan, and B.
Wilkens, Appl. Phys. Lett. 57, 2484 (1990). 21 Z. Trajanovic, I. Takeuchi, P.A. Warburton, C.J. Lobb, and T. Venkatesan, Appl. Phys. Lett. 66,
1536 (1995). 22 A. Inam, R. Ramesh, and C.T. Rogers, 5324714 (28 June 1994). 23 A. Inam, R. Ramesh, and C.T. Rogers, 5358927 (25 October 1994). 24 I. Bozovic, J.N. Eckstein, N. Bozovic, and J. O’Donnell, MRS Online Proceedings Library Archive
502, (1997). 25 R. Baghdadi, R. Arpaia, E. Stepantsov, M. Arzeo, D. Golubev, D. Montemurro, E. Andersson, T.
Bauch, and F. Lombardi, Phys. Rev. B 95, 184505 (2017).

21
26 G.W. Berkstresser, A.J. Valentino, and C.D. Brandle, Journal of Crystal Growth 128, 684 (1993). 27 P.D.C. King, H.I. Wei, Y.F. Nie, M. Uchida, C. Adamo, S. Zhu, X. He, I. Božović, D.G. Schlom,
and K.M. Shen, Nature Nanotechnology 9, 443 (2014). 28 M. Park, M.J. Kramer, K.W. Dennis, and R.W. McCallum, Physica C: Superconductivity and Its
Applications 259, 43 (1996). 29 J.A. Edwards, N.G. Chew, S.W. Goodyear, J.S. Satchell, S.E. Blenkinsop, and R.G. Humphreys,
Journal of the Less Common Metals 164–165, 414 (1990). 30 J.A. Agostinelli, S. Chen, and G. Braunstein, Phys. Rev. B 43, 11396 (1991). 31 M. Bosman, M. Watanabe, D.T.L. Alexander, and V.J. Keast, Ultramicroscopy 106, 1024 (2006). 32 C. Giacovazzo, H.L. Monaco, G. Artioli, D. Viterbo, G. Ferraris, G. Gilli, G. Zanotti, and M. Catti,
Fundamentals of Crystallography, 2nd Edition (Oxford University Press, Oxford ; New York, 2002). 33 R. Ramesh, A. Inam, D.M. Hwang, T.S. Ravi, T. Sands, X.X. Xi, X.D. Wu, Q. Li, T. Venkatesan,
and R. Kilaas, Journal of Materials Research 6, 2264 (1991). 34 A.F. Marshall and C.B. Eom, Physica C: Superconductivity 207, 239 (1993). 35 H.M. Appelboom, V.C. Matijasevic, F. Mathu, G. Rietveld, B. Anczykowski, W.J.A.M. Peterse,
F. Tuinstra, J.E. Mooij, W.G. Sloof, H.A. Rijken, S.S. Klein, and L.J. van IJzendoorn, Physica C:
Superconductivity 214, 323 (1993). 36 J.A. Agostinelli, S. Chen, and G. Braunstein, Physica C: Superconductivity 180, 26 (1991). 37 S. Chan, D.M. Hwang, and L. Nazar, Journal of Applied Physics 65, 4719 (1989). 38 P. Berberich, B. Utz, W. Prusseit, and H. Kinder, Physica C: Superconductivity 219, 497 (1994). 39 T. Umezawa, D.J. Lew, S.K. Streiffer, and M.R. Beasley, Appl. Phys. Lett. 63, 3221 (1993). 40 D. Putzky, P. Radhakrishnan, Y. Wang, P. Wochner, G. Christiani, M. Minola, P.A. van Aken, G.
Logvenov, E. Benckiser, and B. Keimer, Appl. Phys. Lett. 117, 072601 (2020). 41 S.J. Pennycook, Ultramicroscopy 30, 58 (1989). 42 Y.E. Suyolcu, Y. Wang, F. Baiutti, A. Al-Temimy, G. Gregori, G. Cristiani, W. Sigle, J. Maier,
P.A. van Aken, and G. Logvenov, Scientific Reports 7, 453 (2017). 43 Y.E. Suyolcu, G. Christiani, P.A. van Aken, and G. Logvenov, J Supercond Nov Magn 33, 107
(2020). 44 H.W. Zandbergen, R. Gronsky, K. Wang, and G. Thomas, Nature 331, 596 (1988). 45 R. Ramesh, D.M. Hwang, J.B. Barner, L. Nazar, T.S. Ravi, A. Inam, B. Dutta, X.D. Wu, and T.
Venkatesan, Journal of Materials Research 5, 704 (1990). 46 H. Zhang, N. Gauquelin, G.A. Botton, and J.Y.T. Wei, Appl. Phys. Lett. 103, 052606 (2013). 47 S.K. Streiffer, B.M. Lairson, E.M. Zielinski, and J.C. Bravman, Phys. Rev. B 47, 11431 (1993). 48 S.K. Streiffer, B.M. Lairson, E.M. Zielinski, and J.C. Bravman, MRS Online Proceedings Library
Archive 275, (1992).

1
Supplementary Material
a-axis YBa2Cu3O7-x/PrBa2Cu3O7-x/YBa2Cu3O7-x
trilayers with subnanometer rms roughness
Y. Eren Suyolcu1†, Jiaxin Sun1†, Berit H. Goodge2, Jisung Park1, Jürgen Schubert3, Lena F.
Kourkoutis2,4, and Darrell G. Schlom1,4,5
1Department of Materials Sciences and Engineering, Cornell University, Ithaca, New York 14853,
USA
2School of Applied and Engineering Physics, Cornell University, Ithaca, New York 14853, USA
3Peter Grünberg Institute (PGI-9) and JARA-Fundamentals of Future Information Technology,
Forschungszentrum Jülich GmbH, 52425 Jülich, Germany
4Kavli Institute at Cornell for Nanoscale Science, Ithaca, New York 14853, USA
5Leibniz-Institut für Kristallzüchtung, Max-Born-Str. 2, 12489 Berlin, Germany
†These authors contributed equally to this work
This file contains:
Supplementary Note, Table, and Supplementary Figures S1-S10

2
Binary oxide calibration
To achieve the desired Y(Pr):Ba:Cu = 1:2:3 composition ratio in the deposited
Y(Pr)Ba2Cu3O7-x films, we assume that these elements have a sticking coefficient of unity for the
growth conditions used for Y(Pr)Ba2Cu3O7-x. Under this assumption, we establish the individual
fluxes of yttrium, praseodymium, barium, and copper by synthesizing epitaxial films of their
respective binary oxides individually, and use either x-ray reflectivity (XRR) or RHEED
oscillations to determine the thicknesses of these calibration films. From the measured film
thickness and assuming (1) unity sticking coefficients of these cations for the growth conditions
used to grow the binary oxide calibration films and (2) that these calibration films are fully relaxed
and have the bulk density of these binary oxides, we calculate the respective elemental fluxes.
Having established the elemental fluxes under the assumptions stated, we then alter the
temperatures of the MBE effusion cells containing yttrium, praseodymium, barium, and copper
until the binary oxide calibration films grown with these sources indicate that we have the desired
1:2:3 flux ratio among Y(Pr):Ba:Cu. At this point, the growths of Y(Pr)Ba2Cu3O7-x and
YBa2Cu3O7-x/PrBa2Cu3O7-x/YBa2Cu3O7-x trilayers commence. We perform these binary oxide
flux calibrations each day, immediately prior to the growth of Y(Pr)Ba2Cu3O7-x and
YBa2Cu3O7-x/PrBa2Cu3O7-x/YBa2Cu3O7-x trilayers to achieve the growth of stoichiometric films.
Our demonstrated success in growing phase-pure Y(Pr)Ba2Cu3O7-x thin films and
YBa2Cu3O7-x/PrBa2Cu3O7-x/YBa2Cu3O7-x trilayers attests to the validity of the assumptions we
have made in this calibration procedure.
The conditions used to grow each of the binary oxides—Y2O3, PrO2, BaO, and CuO—are
outlined in Supplementary Table S1. Also shown are the substrates used and epitaxial orientations
of the resulting binary oxide calibration films. In all cases, the oxidant used is distilled ozone

3
(~80% O3 + 20% O2), i.e., the same oxidant and background pressure used for the growth of the
subsequent Y(Pr)Ba2Cu3O7-x thin films and YBa2Cu3O7-x/PrBa2Cu3O7-x/YBa2Cu3O7-x trilayers.
For Y2O3, PrO2, and CuO the thickness of the calibration film is measured by XRR. For
hydroscopic BaO, the RHEED oscillation periodicity corresponding to the smallest charge-neutral
formula unit of BaO,1 which in the case of BaO is half of the cubic lattice constant of BaO, is used
to calculate the barium flux. Examples of the RHEED patterns, RHEED oscillations, XRD θ-2θ
scans, and XRR scans for this calibration method are shown for each binary oxide in Figs. S1-S4.
The orientation relationships of the binary oxide calibration layers are: (111) Y2O3 || (111) YSZ
and [1̅10] Y2O3 || [1̅10] YSZ,2 (111) PrO2 || (111) YSZ and [1̅10] PrO2 || [1̅10] YSZ, (100) BaO
|| (100) SrTiO3 and [100] BaO || [110] SrTiO3,3 and (111) CuO || (100) MgO and [1̅10] CuO ||
[110] MgO.4
TABLE S1. Binary oxide growth conditions, substrates used, and the orientation of the resulting
epitaxial films.
Binary oxide Substrate Temperature (°C) Pressure
(Torr)
(111) CuO (100) MgO Room Temperature 110-6
(100) BaO (100) SrTiO3 600 110-6
(111) Y2O3 (111) YSZ 900 110-6
(111) PrO2 (111) YSZ 900 110-6
YSZ = (ZrO2)0.905(Y2O3)0.095 (or 9.5 mol% yttria-stabilized zirconia)
4
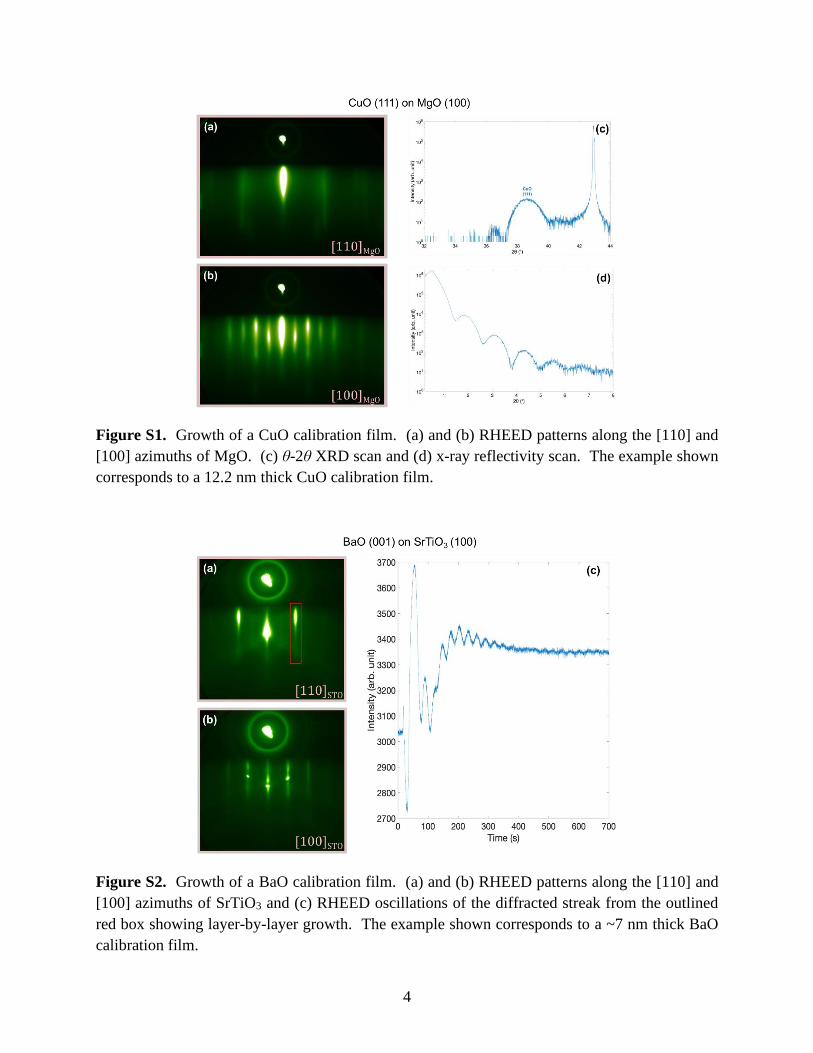
Figure S1. Growth of a CuO calibration film. (a) and (b) RHEED patterns along the [110] and
[100] azimuths of MgO. (c) θ-2θ XRD scan and (d) x-ray reflectivity scan. The example shown
corresponds to a 12.2 nm thick CuO calibration film.
Figure S2. Growth of a BaO calibration film. (a) and (b) RHEED patterns along the [110] and
[100] azimuths of SrTiO3 and (c) RHEED oscillations of the diffracted streak from the outlined
red box showing layer-by-layer growth. The example shown corresponds to a ~7 nm thick BaO
calibration film.

5
Figure S3. Growth of a Y2O3 calibration film. (a) and (b) RHEED patterns along the [1̅10] and
[21̅1̅] azimuths of YSZ. (c) θ-2θ scan and (d) x-ray reflectivity scan. The example shown
corresponds to a 11.5 nm thick Y2O3 calibration film.
Figure S4. Growth of a PrO2 calibration film. (a) and (b) RHEED patterns along the [1̅10] and
[21̅1̅] azimuths of YSZ. (c) θ-2θ scan and (d) x-ray reflectivity scan. The example shown
corresponds to a 11.1 nm thick PrO2 calibration film.

6
Figure S5. Off-axis -scans of the 102 family of peaks at ≈ 56.8° (red) and ≈ 33.2° (blue) of
(a) 24 nm/8 nm/24 nm, (b) 32 nm/8 nm/32 nm, (c) 64 nm/8 nm/64 nm, and
(d) 100 nm/8 nm/100 nm YBa2Cu3O7-x/PrBa2Cu3O7-x/YBa2Cu3O7-x trilayers. Peak area
integration indicates that the volume fractions of a-axis oriented Y(Pr)Ba2Cu3O7-x in these trilayers
are 97%, 97%, 96%, and 99%, , respectively.

7
Figure S6. Temperature ramping procedure and related RHEED patterns. (a) A simple depiction
of the four-step temperature-ramping method for the growth of the
YBa2Cu3O7-x/PrBa2Cu3O7-x/YBa2Cu3O7-x trilayers. (b) Schematic of the YBa2Cu3O7-x layer grown
on a (100) LaAlO3 substrate. Real-time RHEED images of a single YBa2Cu3O7-x layer acquired
at four different temperatures during the temperature ramping procedure, i.e., at thermocouple
temperatures of (c) TTc = 440 °C, (d) TTc = 470 °C, (e) TTc = 500 °C, and (f) TTc = 540 °C. The red
arrows added to (c)-(f) point to the diffraction streaks associated with the c-axis of the YBa2Cu3O7-x
lying in-plane. As the temperature is ramped, these streaks become more intense and sharper,
demonstrating the enhanced crystalline quality of the a-axis oriented YBa2Cu3O7-x film during
growth.

8
Figure S7. (a) Representative cross-sectional HAADF-STEM image of the 24 nm/8 nm/24 nm
YBa2Cu3O7-x/PrBa2Cu3O7-x/YBa2Cu3O7-x trilayer highlighting aspects of the microstructure
observed. The six (1-6) pink circles indicate the positions at which the RHEED patterns presented
in Fig. 1(a) in the main text were taken during growth. The thickness of the cubic (Y,Ba)CuO3-x
buffer layer is 10±2 nm. (b) High-magnification HAADF-STEM image showing the region of
interest highlighted by the green rectangle in (a). The orange arrow indicates the intercalation of
an additional CuO layer (dark feature) as a consequence of YBa2Cu4O8-x stacking faults with
double-chain layers. (c) The high magnification view of the area highlighted by the gray rectangle
in (a) demonstrates the presence of YBa2Cu3O7-x and PrBa2Cu3O7-x in-plane rotation twins on top
of the cubic (Y,Ba)CuO3-x layer that forms during the “cold” growth. The gray double-sided
arrows mark the width of the 90° in-plane rotational twins. (d) High magnification view of the
area highlighted by the pink rectangle in (a) shows the boundary between the cubic (Y,Ba)CuO3-x
and the a-axis YBa2Cu3O7-x layer, marked by the pink line.

9
Figure S8. XRD scans of the less-ideal 32 nm/8 nm/32 nm
YBa2Cu3O7-x/PrBa2Cu3O7-x/YBa2Cu3O7-x trilayer containing a higher concentration of c-axis
grains. (a) θ-2θ scan and (b) -scan of the 102 family of peaks at ≈ 56.8° (red) and ≈ 33.2°
(blue) of this less ideal trilayer indicate that it contains a volume fraction of ~84% a-axis
YBa2Cu3O7-x.

10
Figure S9. (a) Representative cross-sectional HAADF-STEM image of the less-ideal
32 nm/8 nm/32 nm YBa2Cu3O7-x/PrBa2Cu3O7-x/YBa2Cu3O7-x trilayer showing increased
roughness, c-axis and a-axis domains as well as YBa2Cu4O8-x stacking faults (dark lines), and a
cubic (Y,Ba)CuO3-x buffer layer. The red arrows mark the c-axis domain that starts from the
bottom cubic (Y,Ba)CuO3-x layer. The orange arrows indicate some of the YBa2Cu4O8-x stacking
faults (features with darker contrast). The gray double-ended arrows mark the width of examples
of 90° in-plane rotational twins in which the c-axis is oriented into the plane of the image. The
thickness of the cubic-(Y,Ba)CuO3-x buffer layer is 11±2 nm.

11
Figure S10. (a) Low-magnification cross-sectional HAADF-STEM image of the same less-ideal
32 nm/8 nm/32 nm YBa2Cu3O7-x/PrBa2Cu3O7-x/YBa2Cu3O7-x trilayer exhibiting increased
roughness. Individual YBa2Cu3O7-x and PrBa2Cu3O7-x layers are separated using dashed lines and
the pink arrows indicate the nominal interfaces. (b) The high-magnification scan of a
representative region demonstrates fairly abrupt interfaces and YBa2Cu4O8-x stacking faults as
marked with orange arrows that either originate from the underlying YBa2Cu3O7-x or PrBa2Cu3O7-x
layers. (c–e) Atomically resolved Pr–M5,4 edge (red), Y–L3,2 edge (green), and Ba–M5,4 edge (blue)
elemental maps evidencing the sharp chemical abruptness of the interfaces. (f) The RGB overlay
and (g) the simultaneously acquired ADF-STEM image showing this same region highlighted by
the tan rectangle in (a).

12
References
1 T. Terashima, Y. Bando, K. Iijima, K. Yamamoto, K. Hirata, K. Hayashi, K. Kamigaki, and H.
Terauchi, Phys. Rev. Lett. 65, 2684 (1990). 2 C. Korte, A. Peters, J. Janek, D. Hesse, and N. Zakharov, Phys. Chem. Chem. Phys. 10, 4623
(2008). 3 D.C. Sayle and G.W. Watson, J. Phys. Chem. B 105, 5506 (2001). 4 K. Kawaguchi, R. Kita, M. Nishiyama, and T. Morishita, Journal of Crystal Growth 143, 221
(1994).