trig/pre-calculus opening activity
DESCRIPTION
Trig/Pre-Calculus Opening Activity. Write the domain of the following functions. Solve the following inequalities. y. x. 4. -4. Definition of Graph. The graph of a function f is the collection of ordered pairs ( x , f ( x )) where x is in the domain of f . . - PowerPoint PPT PresentationTRANSCRIPT

Trig/Pre-Calculus
Opening Activity
532)(
2)(
33)(
2
xxxh
xxg
xxf
3)
2)
1)
Write the domain of the following functions.
Solve the following inequalities.
12362
953
082
xx
x
x
or 6)
5)
4)

The graph of a function f is the collection of ordered pairs (x, f(x)) where x is in the domain of f.
x
y
4
-4
(2, –2) is on the graph of f(x) = (x – 1)2 – 3.
(2, –2)
f(2) = (2 – 1)2 – 3 = 12 – 3 = – 2
x
y
4
-4
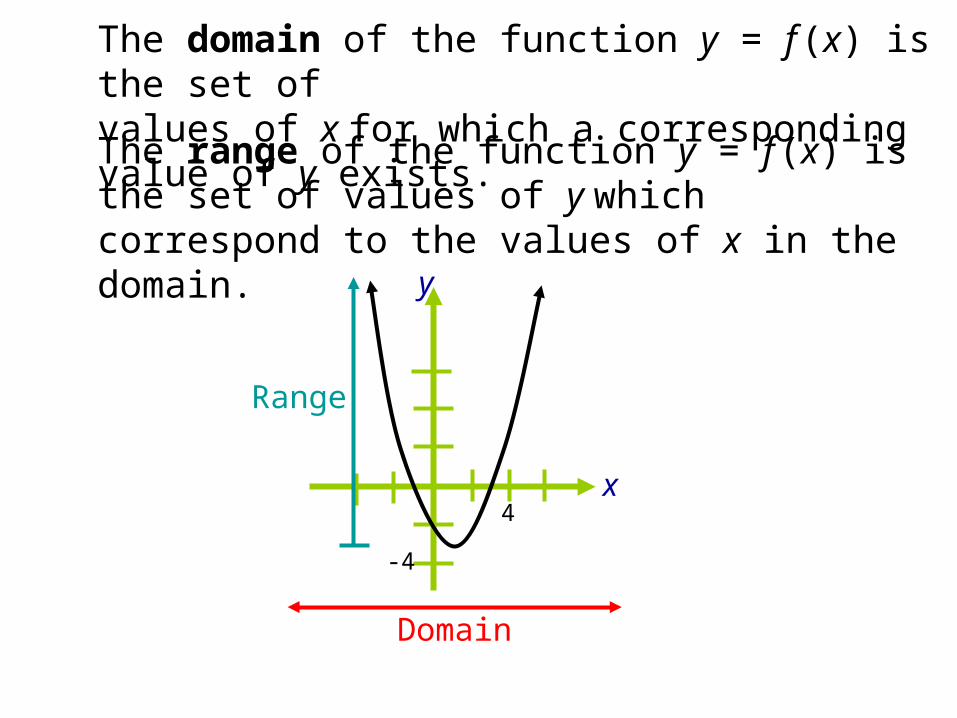
The domain of the function y = f (x) is the set of values of x for which a corresponding value of y exists.
The range of the function y = f (x) is the set of values of y which correspond to the values of x in the domain.
Domain
Range
x
y
– 1
1
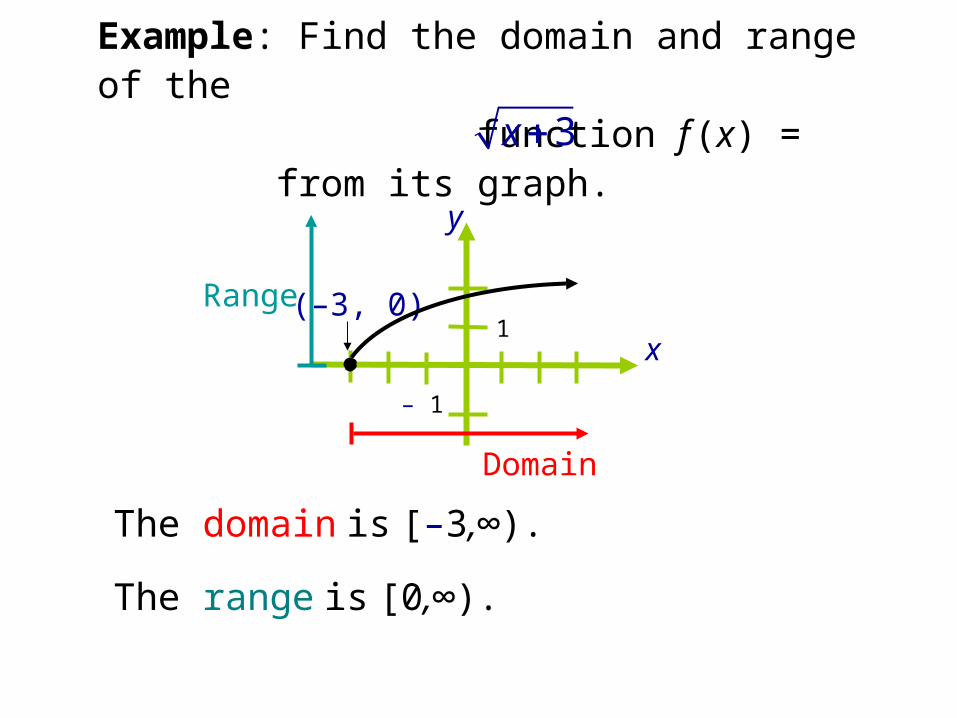
Example: Find the domain and range of the function f (x) = from its graph.
The domain is [–3,∞).
The range is [0,∞).
3x
Range
Domain
(–3, 0)

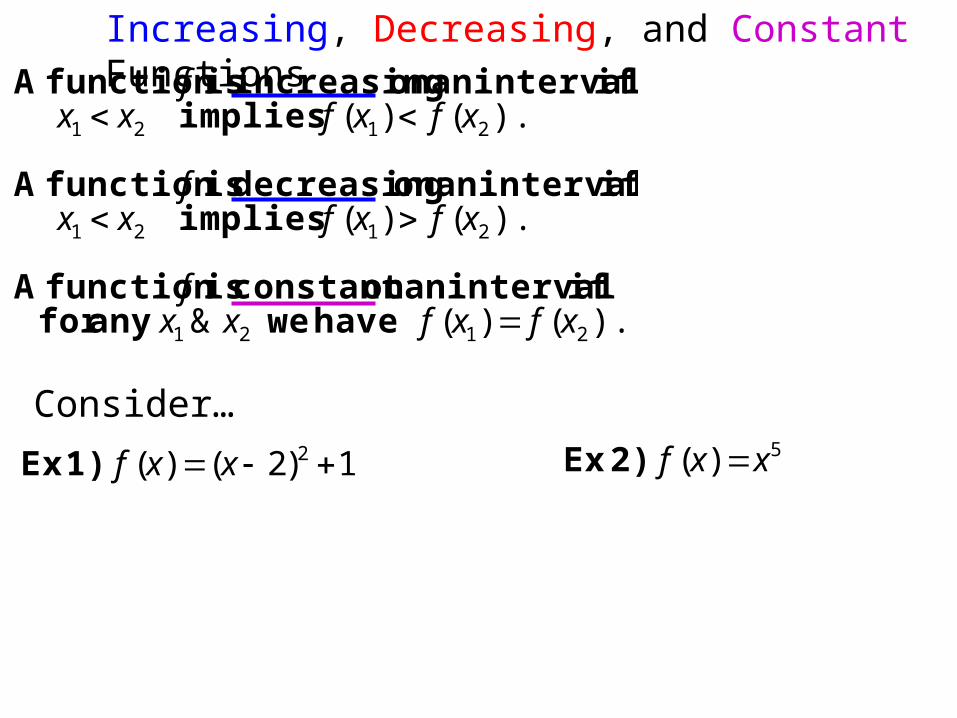
• decreasing on an interval if, for any x1 and x2 in the interval, x1 < x2 implies f (x1) > f (x2),
• constant on an interval if, for any x1 and x2 in the interval, f (x1) = f (x2).
The graph of y = f (x):
• increases on (– ∞, –3),
• decreases on (–3, 3),
• increases on (3, ∞).
A function f is:• increasing on an interval if, for any x1 and x2 in the
interval, x1 < x2 implies f (x1) < f (x2),
(3, – 4)
x
y(–3, 6)
–2
2

A function value f(a) is called a relative minimum of f if there is an interval (x1, x2) that contains a such that
x1 < x < x2 implies f(a) f(x).
x
y
A function value f(a) is called a relative maximum of f if there is an interval (x1, x2) that contains a such that
x1 < x < x2 implies f(a) f(x).
Relative minimum
Relative maximum

Graphing Utility: Approximate the relative minimum of the function f(x) = 3x2 – 2x – 1.
– 6
– 6
6
6
– 0.86– 4.79
– 1.79
2.14
0.58 0.76
-3.24
-3.43
Zoom In:
Zoom In: The approximate minimum is
(0.67, –3.33).

Determine the relative minima and maxima of the following function. Determine where the graph is increasing, decreasing, and constant.
xxxxg 623

x
y
4
-4
A piecewise-defined function is composed of two or more functions.
f(x) =3 + x, x < 0 x2 + 1, x 0
Use when the value of x is less than 0.
Use when the value of x is greater or equal to 0.
(0 is not included.)open circle
(0 is included.)closed circle
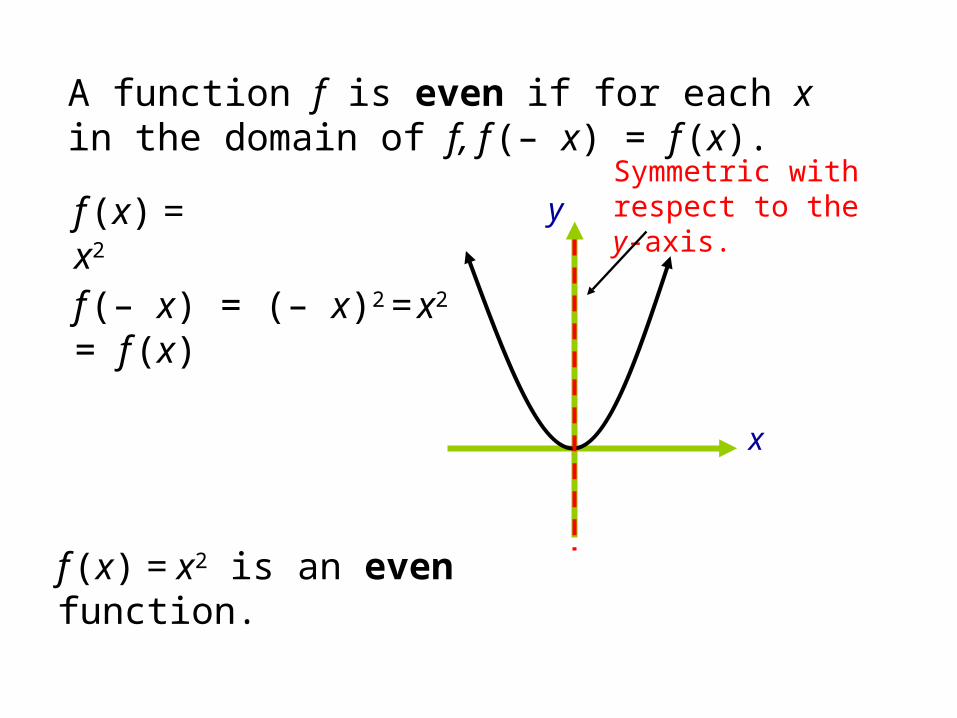
A function f is even if for each x in the domain of f, f (– x) = f (x).
x
yf (x) = x2
f (– x) = (– x)2 = x2 = f (x)
f (x) = x2 is an even function.
Symmetric with respect to the y-axis.

A function f is odd if for each x in the domain of f, f (– x) = – f (x).
x
y
f (x) = x3
f (– x) = (– x)3 = –x3 = – f (x)
f (x) = x3 is an odd function.
Symmetric with respect to the origin.

Now we are going to graph the piecewise function from DNA #4-6 by HAND.
4,5
4,621
)(
xx
xxxf
x
y
4
-4
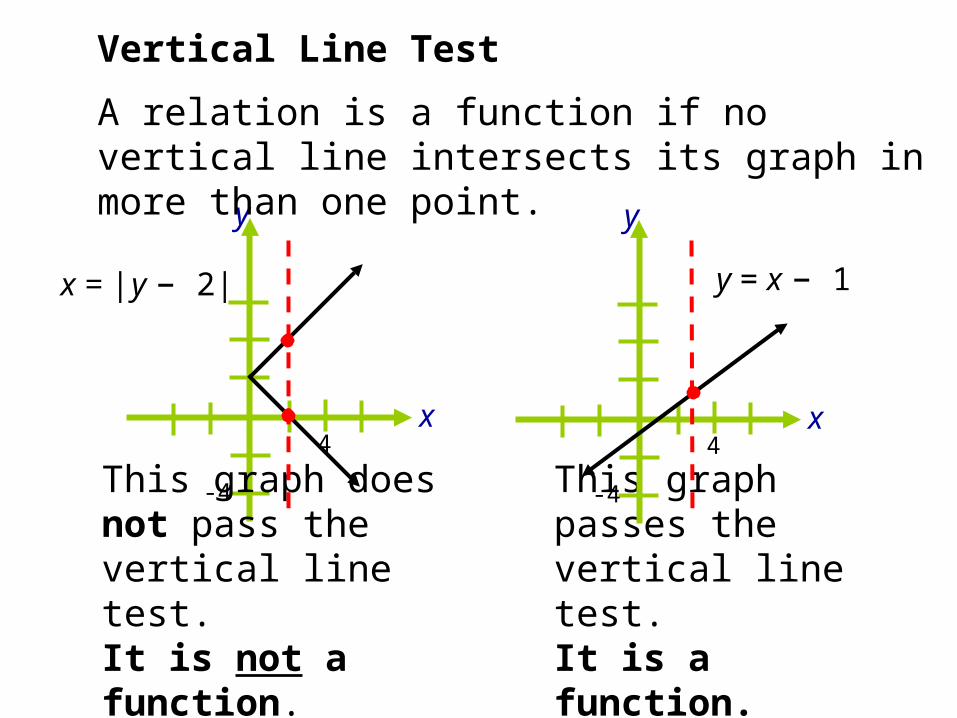
Vertical Line Test
A relation is a function if no vertical line intersects its graph in more than one point.
This graph does not pass the vertical line test. It is not a function.
This graph passes the vertical line test. It is a function.
y = x – 1x = | y – 2|
x
y
4
-4

Graph this…
2,5
2,32)(
xx
xxxf
1)
1,212,4
2,3)(
xxx
xxf
2)
112
2
xx
x
).()(&
).()(
).()(
2121
2121
2121
xfxfxxf
xfxfxxf
xfxfxxf
have we anyfor if interval an onconstant is function A
implies if interval an on decreasing is function A
implies if interval an on increasing is function A
Increasing, Decreasing, and Constant Functions
Consider…1)2()( 2 xxf 1)Ex 5)( xxf 2)Ex
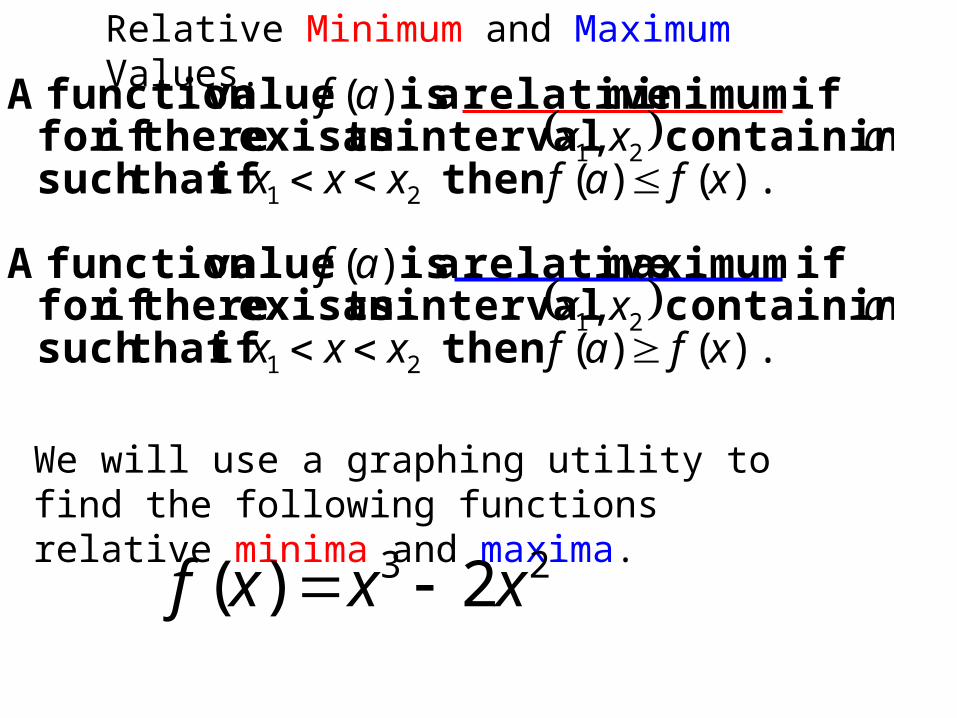
Relative Minimum and Maximum Values.
).()(
,)(
).()(,
)(
21
21
21
21
xfafxxxaxx
af
xfafxxxaxx
af
then ifthat such containing interval an exists there iffor
if maximum relative a is value function A
then ifthat such containing interval an exists there iffor
if minimum relative a is value function A
We will use a graphing utility to find the following functions relative minima and maxima.
23 2)( xxxf

EVEN Functions
)()(
:
xfxf
x
everyfor if EVEN is function A
Every EVEN function is symmetric about the y-axis.
ODD Functions
)()(
:
xfxf
x
everyfor if ODD is function A
Every ODD function is symmetric about the y-axis.

Now we are going to graph the piecewise function from DNA #4-6 by HAND.
4,5
4,621
)(
xx
xxxf

Graph this…
2,5
2,32)(
xx
xxxf
1)
1,212,4
2,3)(
xxx
xxf
2)
112
2
xx
x

)()()1(
)3(32 2
xfhxfxf
fxxxf
c. b. a.
for 6)
.0)4()4(
922
hh
fhf
xxxf
,
find ,For 5)
0132;
223 yxxxy of function a is if Determine 7)
13)(
x
xf :domain the Find 8)
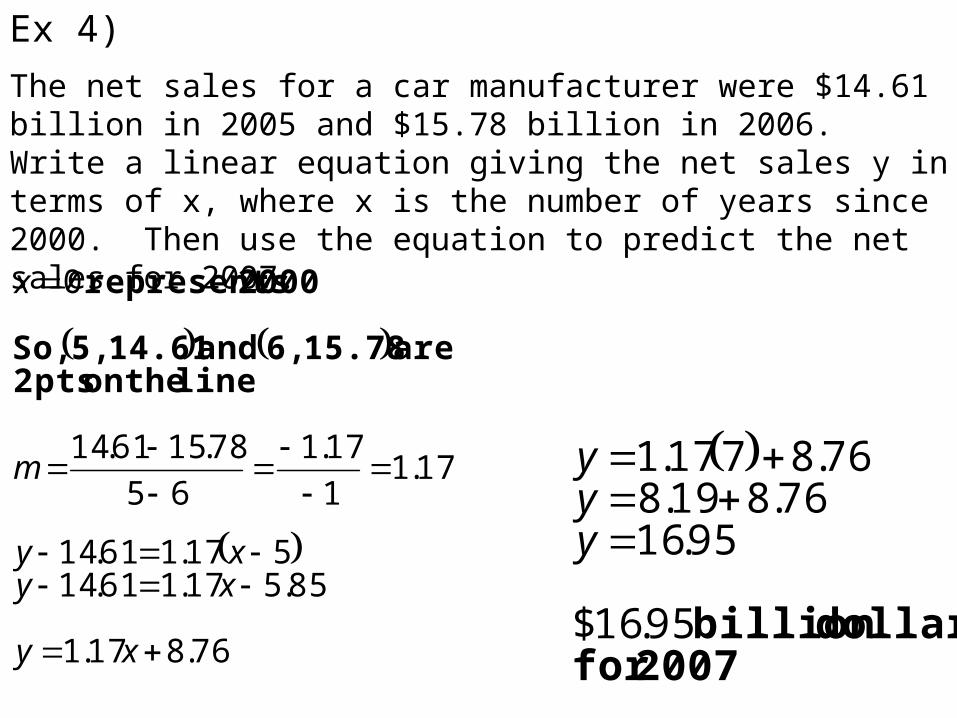
Ex 4)The net sales for a car manufacturer were $14.61 billion in 2005 and $15.78 billion in 2006. Write a linear equation giving the net sales y in terms of x, where x is the number of years since 2000. Then use the equation to predict the net sales for 2007.
76.817.1
85.517.161.14517.161.14
17.1117.1
6578.1561.14
0
xy
xyxy
m
x
line the on pts 2 are 15.78 6, and 14.61 5, So,
2000 represents
2007for dollars billion 95.16$
95.1676.819.8
76.8717.1
yyy
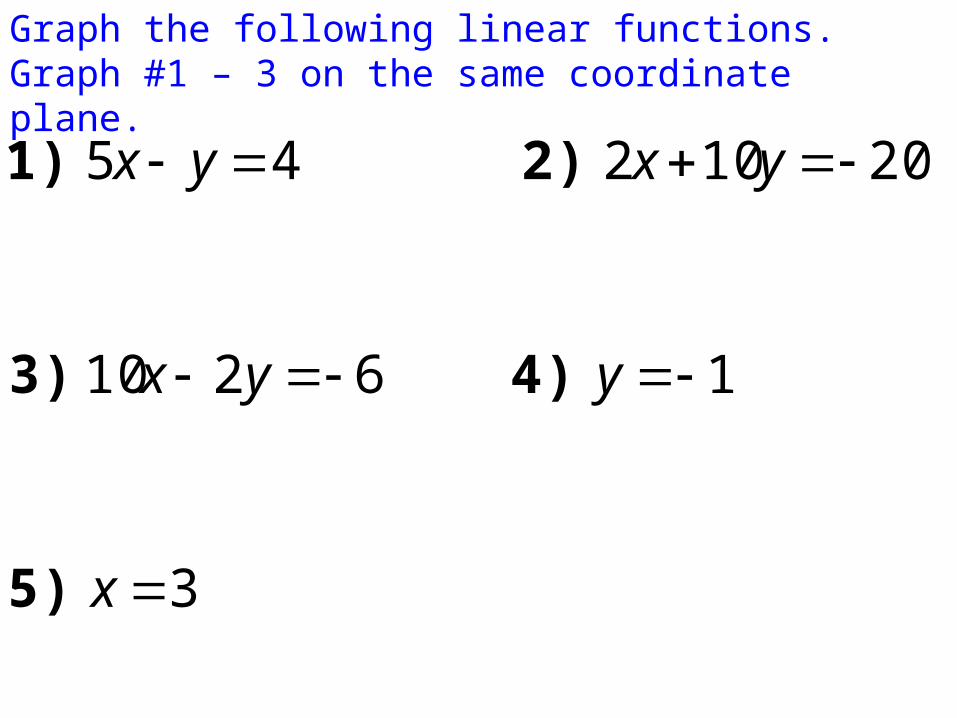
Graph the following linear functions. Graph #1 – 3 on the same coordinate plane.
5)
4) 3)
2) 1)
3
16210
2010245
x
yyx
yxyx