tribology of alumina nano composites - …ethesis.nitrkl.ac.in/5032/1/109me0194.pdf · ·...
TRANSCRIPT

1
TRIBOLOGY OF ALUMINA NANO COMPOSITES
A Thesis Submitted to
National Institute of Technology
Rourkela
In Partial fulfillment of the requirement for the degree of
Bachelor of Technology
in
Mechanical Engineering
By
N.V.S.S.SUBHASH
Department of Mechanical Engineering
National Institute of Technology
Rourkela -769 008 (India)
2013

2
TRIBOLOGY OF ALUMINA NANO COMPOSITES
A Thesis Submitted to
National Institute of Technology
Rourkela
In Partial fulfillment of the requirement for the degree of
Bachelor of Technology
in
Mechanical Engineering
By
N.V.S.S.SUBHASH
Under the guidance and supervision of
Prof. S. K. ACHARYA
Department of Mechanical Engineering
National Institute of Technology
Rourkela -769 008 (India)
2013

3
National Institute of Technology
Rourkela
CERTIFICATE
This is to certify that the thesis entitled “TRIBOLOGY OF ALUMINA NANOCOMPOSITES” submitted
to the National Institute of Technology, Rourkela (Deemed University) by N.V.S.S.SUBHASH, Roll No.
109ME0194 for the award of the Degree of Bachelor of Technology in Mechanical Engineering is a
record of bonafide research work carried out by him under my supervision and guidance. The results
presented in this thesis has not been, to the best of my knowledge, submitted to any other University
or Institute for the award of any degree or diploma.
The thesis, in my opinion, has reached the standards fulfilling the requirement for the award of the
degree of Bachelor of technology in accordance with regulations of the Institute.
Date : Supervisor
Prof. S. K. ACHARYA

4
ACKNOWLEDGEMENT
It is with a feeling of great pleasure that i would like to express my most sincere heartfelt
gratitude to Prof. S.K.Acharya, Dept. of Mechanical Engineering, NIT Rourkela for suggesting
the topic for my thesis report and for his ready and able guidance throughout the course of my
preparing the report. We are greatly indebted to him for his constructive suggestions and
criticism from time to time during the course of progress of my work.
I am also sincerely thankful to Prof K.P. Maity, Head of the Department of
Mechanical Engineering, NIT Rourkela for the allotment of this project and also for his
continuous encouragement
I am also thankful to Mr.Raghavendra Gujjala of mechanical engineering for his
support & help during my experimental work.
We feel pleased and privileged to fulfill our parents‟ ambition and I am greatly
indebted to them for bearing the inconvenience during my mechanical engineering course.
Date:
N.V.S.S.SUBHASH
109ME0194

5
Contents page number
Abstract 7
Chapter 1: Introduction
1.1 Tribology 8
1.2 Definition of composite 8
1.3 Classification 9
1.3.1 Classification based on reinforcing material 9
1.3.2 Classification based on matrix material 10
Chapter 2: Literature Survey
2.1 Why polymer matrix selection 12
2.2 Reinforcement 14
2.2.1 Reinforcement materials 14
Chapter 3: experimental work
3.1 Experiment 17
3.1.1 Testing for surface area of nanoparticles 20
3.1.2 Calculation of density 22
3.1.3 Average particle size 23
3.2 Observations 23
Chapter 4: Fabrication of nanocomposite
And study of wear characteristics
4.1 Preparation of nanocomposite 24
4.2 Wear 26
4.2.1 Calculation of wear 27
4.3 Results 34
Chapter 5: Conclusions 36
References 37

6
LIST OF FIGURES
Fig 3.1 magnetic hot plate
Fig 3.2 schematic diagram of auto combustion process
Fig 3.3 BET result of sample Aluminium nitrate : glycine = 1:0.5
Fig 3.4 BET result of sample Aluminium nitrate : glycine = 1:1
Fig 3.5 BET result of sample Aluminium nitrate : glycine = 1:1.5
Fig 4.1 Schematic diagram of dry sand/rubber wheel abrasive wear test rig
Fig 4.2 dry sand abrasion test rig
Fig4.3 weight loss due to abrasion wear for sample having 30% volume fraction silcon carbide
and zero percentage of nano fillers for varying applied loads of 5N,10N,15N and number of
revolutions 300,600,900
Fig 4.4 weight loss due to abrasion wear for sample having 30% volume fraction silcon carbide
and 2% of nano fillers for varying applied loads of 5N,10N,15N and number of revolutions
300,600,900.
Fig 4.5 shows weight loss due to abrasion wear for sample having 30% volume fraction silcon
carbide and 4% of nano fillers for varying applied loads of 5N,10N,15N and number of
revolutions 300,600,900.
Fig 4.6 weight loss due to abrasion wear for sample having 30% volume fraction silicon carbide
and 2% of nanofillers for varying applied loads of 5N,10N,15N and number of revolutions
300,600,900.
Fig 4.7 amount of wear for 5kg applied load
Fig 4.8 amount of wear for 10 kg applied load
Fig 4.9 amount of wear for 15 kg applied load

7
Abstract
The rapid development in the field of nano-particles over the past 20 years has driven
tremendous advances in the field of nanotechnolgy. While there remains significant interest in
the use of nano particles as fillers in polymer materials to enhance mechanical and physical
properties, many research efforts are being carried out that focus on precise structures of nano-
particles in polymers, including their assembly in arrays and along interfacial boundaries. The
objective of this study is two fold
1. Preparation and characterization of alumina nano particles and
2. Tribological behavior of silicon carbide alumina nanocomposite.

8
CHAPTER 1
INTRODUCTION
1.1 TRIBOLOGY
Tribology is the science and engineering of interacting surfaces in relative motion. It
includes the study and application of the principles of friction, lubrication and wear. It was coined
by the British physicist David Tarbor and also by Peter Jost in 1964, a lubrication expert who
noticed the problems with increasing friction on machines, and started the new discipline of
tribology. It includes the study and application of the principles of friction, wear and lubrication.
Tribology is a branch of mechanical engineering. The tribological interactions of a solid surface's
exposed face with interfacing materials and environment may result in loss of material from the
surface. The process leading to loss of material is known as "wear". Major types of wear
include abrasion, friction (adhesion and cohesion), erosion, and corrosion. Wear can be minimized
by modifying the surface properties of solids by one or more of "surface engineering" processes
( surface finishing) or by use of lubricants (for frictional or adhesive wear) [1].
1.2 DEFINITION OF COMPOSITE:
The most widely used meaning is the following one, which has been stated by Jartiz [2]
“Composites are multifunctional material systems that provide characteristics not obtainable
from any discrete material. They are cohesive structures made by physically combining two or
more compatible materials, different in composition and characteristics and sometimes in form”.
Accordingly one may classify among the composite materials nearly all substances such as bones,
wood, shell etc., and also some man-made materials such as certain powder metallurgy products,
electrical insulators, resin bonded magnetic materials, powder charged plastics, paper laminates
etc..

9
The weakness of this definition resided in the fact that it allows one to classify among
the composites any mixture of materials without indicating either its specificity or the laws which
should give it which distinguishes it from other very banal, meaningless mixtures.
Kelly [3] very clearly stresses that the composites should not be regarded simple as a
combination of two materials. In the broader significance; the combination has its own distinctive
properties. In terms of strength to resistance to heat or some other desirable quality, it is better
than either of the components alone or radically different from either of them.
Berghezan [4] defines as “The composites are compound materials which differ from
alloys by the fact that the individual components retain their characteristics but are so
incorporated into the composite as to take advantage only of their attributes and not of their
short comings”, in order to obtain improved materials.
1.3 Classification
Composite materials can be classified in different ways [5].
1.3.1 Classification based on reinforcing material
Particulate Composites
The reinforcement is of particle nature (platelets are also included in this class). In this
type of composites, 1μm to 200μm size particles are dispersed in the matrix. It may be spherical,
cubic, tetragonal, a platelet, or of other regular or irregular shape, but they are equiaxed.
Generally particles are not very effective in improving fracture resistance but they enhance the
stiffness of the composite to a limited extent. Particle fillers are extensively used to improve the
properties of matrix materials such as to modify the thermal and electrical conductivities,
improve performance at elevated temperatures, increase wear, reduce friction and abrasion
resistance, improve machinability, increase surface hardness and reduce shrinkage.

10
Fibrous composites
A fiber is characterized by its length being much greater than its dimension of crossection.
The dimensions of the reinforcement determine its capability of its properties to the composite.
Fibers play very effective role in improving the fracture resistance of the matrix since a
reinforcement having a long dimension discourages the growth of incipient cracks normal to the
reinforcement that might otherwise lead to ultimate failure, particularly with brittle matrix
composites.
1.3.2 Classification based on matrix material
(1) Metal matrix composites
Metal matrix composites possess better properties, when compared with organic
matrices. These include (i) can retain their strength even at higher temperatures, (ii) higher
transverse strength, (iii) better electrical and thermal conductivities,(iv) better erosion
resistance etc. Major disadvantage of metal matrix composites is higher densities and low
specific mechanical properties when compared to polymer matrix composites. Another notable
difficulty is requirement of very high energy for fabrication.
(2) Polymer matrix composites
A very large proportion of polymeric materials consisting of both thermosetting and
thermoplastic, are used as matrix materials in the preparation composites. The resinous binders
(polymer matrices) are selected taking fatigue resistance, adhesive strength, heat resistance,
chemical and moisture resistance etc into account. The resin must have mechanical strength with
that of the reinforcement. It should be easy to be employed in the fabrication process selected
and also satisfy the service conditions. On the other hand, the resin matrix must have the
capability of wetting and penetrating into the bundles of fibers which provide the reinforcement,
replacing the dead air spaces with in and offering those physical characteristics capable of
enhancing the performance of fibers.

11
(3) Ceramic matrix composites
Ceramic fibers, such as alumina and SiC (Silicon Carbide) have better results in very high
temperature applications, and also where the environment attack is a major problem. Since
ceramics show poor properties in tension and shear, most of its applications as reinforcement
are in the particulate form (e.g. zinc and calcium phosphate). Ceramic Matrix Composites (CMCs)
used in very high temperature environments, these materials use a ceramic material as the
matrix and reinforce it.
Composites as engineering materials normally characterized by
1. These are artificially made (thus, excluding natural material such as wood).
2. These consist of at least two different species with a well-defined interface.
3. Their properties are influenced by the volume percentage of ingredients.
4. These have at least one property not possessed by the individual constituents.

12
CHAPTER 2
LITERATURE SURVEY
2.1 WHY POLYMER MATRIX SELECTION? Polymers are structurally more complex than metals or ceramics. They are
cheap and can be easily processed. On the other hand, polymers have low strength and modulus
of rigidity and used in lower temperature applications. Prolonged exposure to ultraviolet light
and some solvents can cause the deterioration of polymer properties. Because of predominant
covalent bonds, polymers are poor conductors of heat and electricity. Polymers, however, are
generally show more resistance to chemicals than metals. Structurally, polymers are giant
chainlike molecular structures (hence the name macromolecules) with covalent bonded carbon
atoms forming backbone of the chain. The process of formation large molecules from smaller
ones is called polymerization; that is, polymerization is the process of joining many monomers,
the building blocks put together to form polymer. Polymers that are used to manufacture
advanced PMCs which are of two basic types thermoset and thermoplastics resins.
a) Thermosetting resins:
Thermoset resins play prominent role in the advanced composites industry today, while
thermoplastics have only a minor role. It requires addition of a hardener or curing agent and
impregnation onto a reinforcing material, then followed by a curing step to produce a finished
part. Some of the more common thermoset resins are described briefly here.
Epoxy resins have relatively low molecular weight monomers with low shrinkage during
cure. These can be partially cured and stored in that transition state. The cured epoxy resins have
high resistance to chemical and corrosion, good mechanical thermal properties, but they are
more expensive compared to polyester resin. The second of the essential ingredients of an
advanced composite system is hardener or curing agent. These compounds are very important
because they have control over rate of reaction and determine the performance characteristics
of the finished part. Since these material serve as catalysts for the reaction, they must have active

13
sites on their molecules. Some of the most commonly used curing agent in the advanced
composite industry is the aromatic amines like 4.4 methylene-dianiline (MDA) and 4.4-
sulfonylianiline (DDS)
Unsaturated polyester resins are most widely used because of their good corrosion
resistance, mechanical properties, low weight and low cost. They consists of linear polymer
chains in styrene monomer. These polymer chains contain reactive sites resulting from the
incorporation of the anhydrous forms of unsaturated dicarboxylic acids (e.g. maleic anhydride).
The reactive unsaturation sites on the polymer chains react and crosslinking with the styrene
monomer via a free radical reaction. This reaction is initiated by the addition of a peroxide
catalyst, such a methyl ethyl ketone peroxide (MEKP). The addition of an accelerator in the resin,
such as cobalt octate, speed the rate of reaction at a given temperature. The addition of heat
considerably speeds up the rate of cross-linking reaction.
Polyurethanes are another group of resin used in advanced composite process. These
compounds are formed by reaction the polyol component with an isocynate compound, typically
toluene diisocynate (TDI). Methylene diisocynate (MDI) and hexamethylenediisocynate (HDI) are
also widely used. These are used to preparation of fiber reinforced foams. Amino and Phenolic
resins are used extensively in aircraft interiors because of the exceptional low smoke and heat
release properties in the event of a fire.
b) Thermoplastic resins:
Thermoplastic resins require only heat and pressure to form the finished part. Unlike
the thermoset resins, thermoplastics resins can usually be reheated and reformed into different
shapes. Common examples of thermoplastics resins are known to be polyethylene,
polyphenylenesulfine, polystyrene, nylon, polysulfone, polycarbonate etc. Polyamides,
Polyimide, PEEK are relatively newcomers to the composite industry and are used for high
temperature applications. These resins have better characteristics of thermal stability and flame
resistance than the epoxy resins. Polyamide based composites have excellent retention of
strength in how-wet environment but they are brittle and have a very low elongation at break.

14
2.2 Reinforcement:
Reinforcement increases the stiffness, strength and the temperature resistance
capacity and lowers the density of polymer matrix composites. In order to achieve these
properties the selection depends on the type of reinforcement and its method of production and
chemical compatibility with the matrix and the following aspects must be considered while
selecting the reinforcement material.
Size – diameter and aspect ratio
Shape – Chopped fiber, whisker, spherical or irregular particulate, flake, etc:
Surface morphology – smooth or corrugated and rough:
Poly – or single crystal
Structural defects – voids, occluded material, second phase
Surface chemistry
Impurities
Inherent properties – strength, modulus and density.
2.2.1 Reinforcement materials:
Fibers used as reinforcing material offer two advantages. Primarily the bulk material is
always stronger when produced as smaller diameter fibers due to the natural omission of large
scale defects. Secondly, fiber configuration allows the tailoring of properties in specific directions.
Fibers are added to the resin system to provide strength to the finished part. The selection for
reinforcing material is based on properties desired to be in the finished product. Fibers used in
advanced composite manufacture come in various forms, such as roving, chopped strands, yarns
and mats. Each of these has its own special application. In processes such as pultrusion or
filament winding, yarns and roving are used. When performs are used in parts manufacture,
woven fabric or mats are required.

15
[6] Jihong She, et al
In this paper Fibrous Al2O3 ceramics with a mixture of SiC and Al2O3 as the cell
boundaries were fabricated by extrusion-molding and hot-pressing techniques. The effects of the
cell boundary composition on the mechanical properties and fracture behavior are investigated.
It is shown that a 65:35 mixture of SiC:Al2O3 can act as a suitable cell boundary for Al2O3 cells.
In bending tests, such a ceramic displays a non-catastrophic fracture behavior with reasonable
load-carrying capability, and its fracture energy and appar- ent toughness are up to 1349 J/m2
and 6.0 MPa m1/2 , respectively
[7] M. Belmonte, et al
In this paperDry ceramic block-on-steel ring wear tests were performed at high loads in
several Al2O3/20 vol.%SiC composites as a function of the SiC grain size, which ranged from0.2
to 4.5µm in d50. The wear resistance of themonolithic alumina was radically improved by the
addition of the silicon carbide particles, reducing down to one order of magnitude of wear rate.
Two different behaviours were identified according to the microstructural observations on the
worm surfaces: intergranular fracture and grain pull-out in the monolithic Al2O3, surface plishing
and plastic deformation in the composites. The wear resistance of the Al2O3/SiC composites
increased with the SiC grain size due to their fracture toughness enhancement.
[8] Guo-Dong Zhan, et al
In the present study, piezoelectric Nd2Ti2O7 second phase toughening nanocrystalline
alumina composites with higher toughness were successfully developed at relatively low
temperatures Spark plasma sintering technique.
[9]. David L. Burris, W. Gregory Sawyer
Past studies with PTFE nanocomposites showed up to 600× improvements in wear
resistance over unfilled PTFE with the addition of Al2O3 nanoparticles. Irregularly shaped
nanoparticles are used in this study to increase the mechanical entanglement of PTFE fibrils with
the filler. The tribological properties of 10wt.% filled samples are evaluated under a normal

16
pressure and sliding speed of 6.3MPa and 50.8mm/s, respectively. The wear resistance was found
to improve 3000× over unfilled PTFE with the addition of 1wt. % nanoparticles. The 5wt.% sample
had the lowest steady state wear rate of K= 1.3×10⁻⁷ mm3 /Nm and the lowest steady friction
coefficient with µ= 0.21.

17
CHAPTER 3
3.1 Experimental work
Aim
Fabrication of best alumina nano powder from aluminum nitrate using auto
combustion process.
Process followed to fabricate nano alumina is Auto combustion
Auto combustion is a chemo mechanical process to produce nano alumina with
chemical ingredients having variable compositions to obtain the best nano alumina.
Chemical ingredients used
Aluminium nitrate (Al (NO3)3.9H2O)
Glycine
Equipment used
Magnetic hot plate
Fig 3.1 magnetic hot plate

18
Auto combustion [10]process involves heating and stirring up of the solution
until the solution changes to gel form and once the solution changed to gel then stop stirring and
heating is continued till it forms foamy mass and still heated up to remove all the water
molecules present in the solution
Procedure
In the preparation of Nano alumina one mole of Aluminium nitrate
(Al(NO3)39H2O).was taken as constant and varying the mole fractions (0.5, 1 and 1.5) of Glycine
to get the optimum nano size.
In the nano fabrication different steps are involved
Step 1: 0.4 mole of Aluminium nitrate (Al (NO3)3.9H2O) was mixed with 100 ml of water and
stirred to get the solution and add slowly the other gradient (Glycine) of selected mole to produce
20 gms of alumina.
Step 2: Keep the solution on the magnetic hot plate and keep the temperature 500C to 600C and
put one magnetic stirrer in the solution as after some time the solution start becoming galley
remove the stirrer and keep the solution on the magnetic up to complete removal of water from
the material.
Step 3: The material obtained after heating on magnetic hot plate is fired in furnace up to 8000C
to 10000C..
The furnace takes 3to 4 hours to reach the temperature and 2 hours soaking time
and 6 to7 hours time to reach the room temperature thus nano alumina powder is obtained
which in white colour.
For particle size optimization of alumina different mole of Glycine is mixed with
Aluminium nitrate (Al(NO3)39H2O).

19
Calculations
2(Al (NO3)3.9H2O) -----------> Al2O3 + 6NO + 4O2 + 18 H2O
Two moles of aluminium nitrate gives one mole of Al2O3
Molecular weight of aluminum nitrate is 375.13
Molecular weight of Al2O3 is 102
2*375.13 gm of aluminium nitrate gives 102gm of alumina
20 gm of alumina require =2*375.13*20/102
=147.1 gm
i.e. 147.1/375.13 = 0.4 moles of aluminium nitrate is required
Molecular weight of glycine = 75.067
Molecular formula of glycine C2H5NO2
Aluminium nitrate vs glycine
case 1 0.4 mole (Al(NO3)3.9H2O) ------- 0.2 mole glycine
case 2 0.4 mole (Al(NO3)3.9H2O) ------- 0.4 mole glycine
case 3 0.4 mole (Al(NO3)3.9H2O) ------- 0.6 mole glycine
moles of glycine
0.2 mole ----------- 15.0134 gm of glycine
0.4 mole ----------- 30.026 gm of glycine
0.6 mole ----------- 45.0402 gm of glycine

20
Fig 3.2 schematic diagram of auto combustion process
Alumina powder obtained is analysed for density, surface area, particle size using BET analysis and
XRD techniques.
3.1.1 Testing of nanoparticles surface area
BET analysis
BET analysis is used to calculate the surface area of nano particles. BET
analysis provides precise specific surface area evaluation of materials by nitrogen multilayer
adsorption measured as a function of relative pressure using a fully automated analyser. The
technique considers external area and pore area evaluations to determine the total specific
surface area in m2/g yielding important information in studying the effects of surface porosity
and particle size in many applications.

21
For sample 1
(Aluminium nitrate : glycine = 1:0.5)
Fig 3.3 BET result of sample Aluminium nitrate : glycine = 1:0.5
For sample 2
(Aluminium nitrate : glycine = 1:1)
. Fig 3.4 BET result of sample Aluminium nitrate : glycine = 1:1

22
Sample 3
Aluminium nitrate : glycine = 1:1.5
Fig 3.5 BET result of sample Aluminium nitrate : glycine = 1:1.5
3.1.2 Density calculation
Specific gravity of each sample is measured using a picnometer
S = (w1 −w2)
(w1−w2)−(w3−w4)
W1 = weight of empty Pycnometer
W2 = weight of the Pycnometer with nano powder
W3 = weight of the Pycnometer, nano powder and kerosene
W4 = weight of Pycnometer filled with kerosene only
S = specific gravity of sample
True density of sample = specific gravity × 0.8( density of kerosene )
Density of sample 1(Aluminium nitrate: glycine = 1:0.5) is found to be 0.9015 gm/cm3.
Density of sample 2(Aluminium nitrate: glycine = 1:1) is 1.37 gm/ cm3.
Density of sample 3 (Aluminium nitrate: glycine = 1:1.5) is 0.79 gm/ cm3.
23
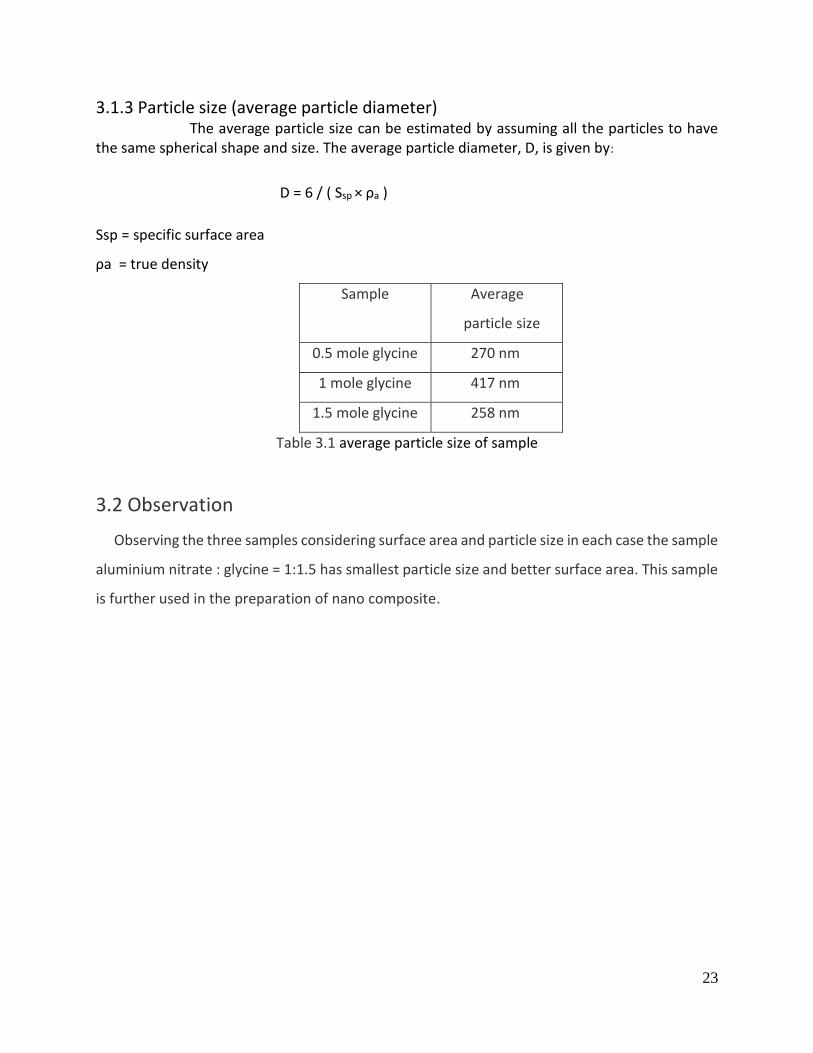
3.1.3 Particle size (average particle diameter) The average particle size can be estimated by assuming all the particles to have the same spherical shape and size. The average particle diameter, D, is given by:
D = 6 / ( Ssp × ρa )
Ssp = specific surface area
ρa = true density
Sample Average
particle size
0.5 mole glycine 270 nm
1 mole glycine 417 nm
1.5 mole glycine 258 nm
Table 3.1 average particle size of sample
3.2 Observation
Observing the three samples considering surface area and particle size in each case the sample
aluminium nitrate : glycine = 1:1.5 has smallest particle size and better surface area. This sample
is further used in the preparation of nano composite.

24
CHAPTER 4
4.1 Preparation of Nanocomposite Materials used
Silicon carbide
Epoxy
Hardener
Nanopowder
Procedure
A mould is prepared with the dimensions 14cm × cm × 0.8cm = 89.6 cm3.
Four moulds are made of same dimensions given above.
30% volume fraction of silicon carbide i in epoxy gives better wear resistance compared
to other volume fractions[11].
Density of silicon carbide is found to be 2.21 gm/cm3 using picnometer.
Volume of silicon carbide required = 0.3 × 89,6 = 26.88 cm3.
Mass of silicon carbide required = 26,88 × 2.21 = 59.4 gms
59.4 gms of silicon carbide is added to epoxy of 63 ml of epoxy and this ingredients are well mixed
and poured into the mould.

25
Mould 1
Silicon carbide fillers are added to epoxy in 30 % volume fraction to epoxy and hardener
is added then this mixture is thoroughly mixed and poured into the mould.
Mould 2
Nanofillers of 2% volume fraction and silicon carbide of 30% volume fraction are added to
epoxy along with hardener and this mixture is poured into the mould.
2% volume fraction = 0.02 × 89.6 = 1.792 cm3
Mass of nanofillers = density of nano(0.79 gm/ cm3) × 1.792 cm3 = 1.5 gms approx..
Mould 3
Nanofillers of 4% volume fraction and silicon carbide of 30% volume fraction are added
to epoxy along with hardener and this mixture is poured into the mould.
4% volume fraction = 0.04 × 89.6 = 3.584 cm3
Mass of nanofillers = density of nano(0.79 gm/ cm3) × 3.584 cm3 = 3 gms approx..
Mould 4
Nanofillers of 6% volume fraction and silicon carbide of 30% volume fraction are added
to epoxy along with hardener and this mixture is poured into the mould.
6% volume fraction = 0.06 × 89.6 = 5.376 cm3
Mass of nanofillers = density of nano(0.79 gm/ cm3) × 5.376 cm3 = 4.5 gms approx..

26
4.2 Wear
Wear occurs as a natural consequence when two surfaces with a relative motion interact with
each other. Wear is also defined as the progressive loss of material from contacting surfaces in
relative motion. Many scientists have developed various wear theories in which the Physico-
Mechanical characteristics of the materials and the physical conditions (e.g. the resistance of the
rubbing body and the stress state at the contact area) are taken in to consideration. In 1940 Holm
[12] starting from the atomic mechanism of wear, calculated the volume of substance worn over
unit sliding path.
Table 4.1 type of wear in industry[13]
Type of wear in Industry Approximate percentage involved
Abrasive
Adhesive
Erosion
Fretting
Chemical
50
15
8
8
5
ABRASIVE WEAR:
Abrasive wear can be defined as wear that occurs when a hard surface slides against
and cuts groove from a softer surface. It can be responcible for most failures in practice. Hard
particles or asperities that cut or groove one of the rubbing surfaces produce abrasive wear. This
hard material which may be originated from one of the two rubbing surfaces in contact. In sliding
mechanisms, abrasion can arise from the existing asperities on one surface (if it is harder than
the other), starting from the generation of wear fragments which are repeatedly deformed and
hence get work hardened for oxidized until they became harder than either or both of the sliding
surfaces, or from the entry of hard particles, such as dirt particles from outside the system. Two
body abrasive wear occurs when one surface (usually harder than the second) cuts material away
from the second, although this mechanism changes very often to three body abrasion as the wear

27
debris then acts as an abrasive between the two surfaces. Abrasives can also act as in grinding
where the abrasive is fixed relative to one surface or as in lapping where the abrasive tumbles
producing a series of indentations as opposed to a scratch. According to the recent tribological
survey, abrasive wear is mainly responsible for the large amount of material loss in industrial
practice
Schematic representations of the abrasion wear mechanism
4.2.1Calculation of wear
Wear rate was estimated by measuring the weight loss of the specimen after
each test. The weight loss is calculated taking the weight difference of the sample before and
after the test. The weight loss is given by
ba www)( gm
Abrasion wear of samples is tested using DRY SAND ABRASION TEST RIG. The samples
obtained are tested for abrasion wear for different load and number of revolutions
28
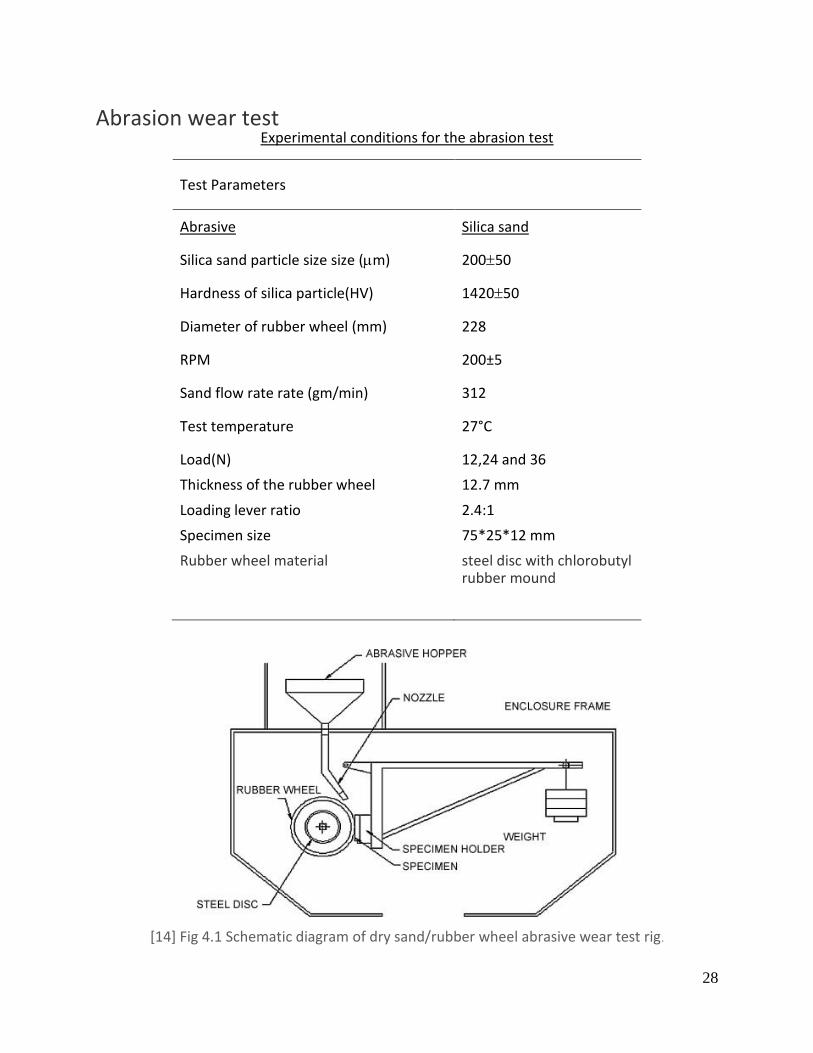
Abrasion wear test
Experimental conditions for the abrasion test
Test Parameters
Abrasive Silica sand
Silica sand particle size size (m) 20050
Hardness of silica particle(HV) 142050
Diameter of rubber wheel (mm) 228
RPM 200±5
Sand flow rate rate (gm/min) 312
Test temperature 27°C
Load(N)
Thickness of the rubber wheel
Loading lever ratio
Specimen size
Rubber wheel material
12,24 and 36
12.7 mm
2.4:1
75*25*12 mm
steel disc with chlorobutyl rubber mound
[14] Fig 4.1 Schematic diagram of dry sand/rubber wheel abrasive wear test rig.

29
Fig 4.2 dry sand abrasion test rig
Procedure
The composite obtained by the casting process described above is cut into pieces of
dimensions (75*25*12 mm) for testing the abrasive wear of particular sample under different
loads and revolution of the wheel.
Sliding distance for 300 revolutions = radius of wheel (0.114) m × 300 = 34.2 m
Sliding distance for 600 revolutions = radius of wheel (0.114) m × 600 = 68.4 m
Sliding distance for 900 revolutions = radius of wheel (0.114) m × 900 = 102.6 m
30
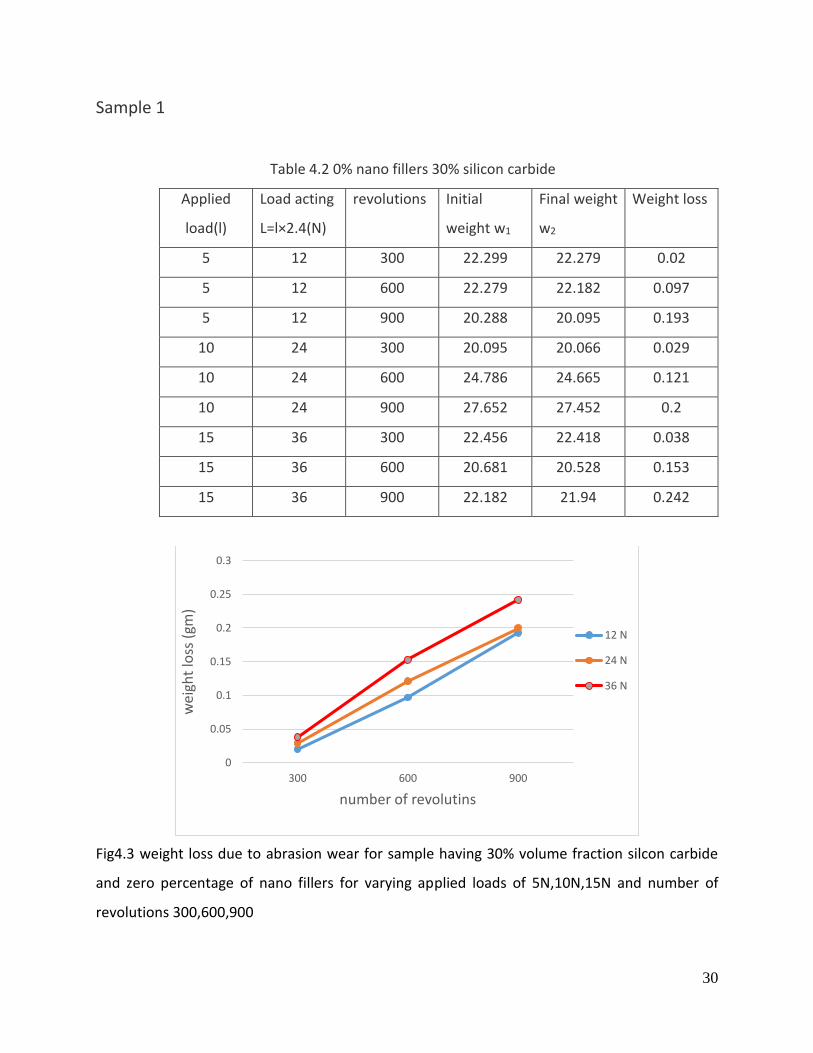
Sample 1
Table 4.2 0% nano fillers 30% silicon carbide
Applied
load(l)
Load acting
L=l×2.4(N)
revolutions Initial
weight w1
Final weight
w2
Weight loss
5 12 300 22.299 22.279 0.02
5 12 600 22.279 22.182 0.097
5 12 900 20.288 20.095 0.193
10 24 300 20.095 20.066 0.029
10 24 600 24.786 24.665 0.121
10 24 900 27.652 27.452 0.2
15 36 300 22.456 22.418 0.038
15 36 600 20.681 20.528 0.153
15 36 900 22.182 21.94 0.242
Fig4.3 weight loss due to abrasion wear for sample having 30% volume fraction silcon carbide
and zero percentage of nano fillers for varying applied loads of 5N,10N,15N and number of
revolutions 300,600,900
0
0.05
0.1
0.15
0.2
0.25
0.3
300 600 900
wei
ght
loss
(gm
)
number of revolutins
12 N
24 N
36 N
31
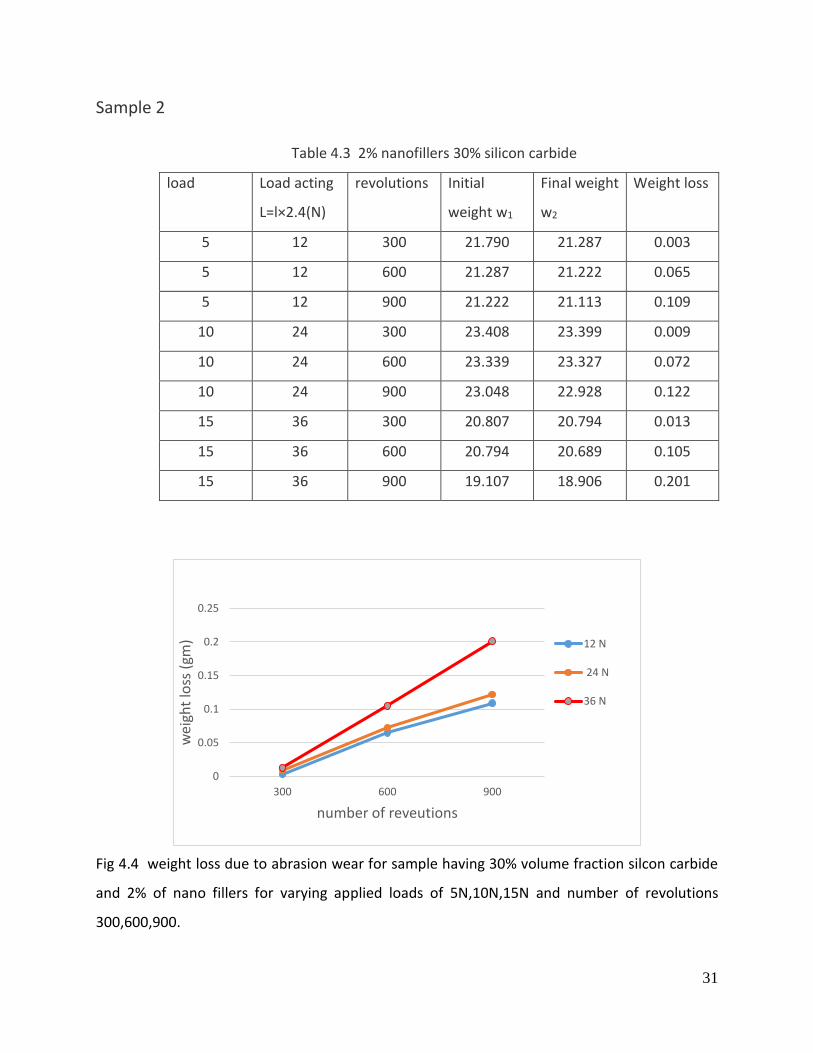
Sample 2
Table 4.3 2% nanofillers 30% silicon carbide
load Load acting
L=l×2.4(N)
revolutions Initial
weight w1
Final weight
w2
Weight loss
5 12 300 21.790 21.287 0.003
5 12 600 21.287 21.222 0.065
5 12 900 21.222 21.113 0.109
10 24 300 23.408 23.399 0.009
10 24 600 23.339 23.327 0.072
10 24 900 23.048 22.928 0.122
15 36 300 20.807 20.794 0.013
15 36 600 20.794 20.689 0.105
15 36 900 19.107 18.906 0.201
Fig 4.4 weight loss due to abrasion wear for sample having 30% volume fraction silcon carbide
and 2% of nano fillers for varying applied loads of 5N,10N,15N and number of revolutions
300,600,900.
0
0.05
0.1
0.15
0.2
0.25
300 600 900
wei
ght
loss
(gm
)
number of reveutions
12 N
24 N
36 N

32
Sample 3
Table 4.4 4% nano fillers 30% silicon carbide
load Load acting
L=l×2.4(N)
revolutions Initial
weight w1
Final weight
w2
Weight loss
5 12 300 21.732 21.731 0.001
5 12 600 21.731 21.681 0.05
5 12 900 21.681 21.592 0.089
10 24 300 23.315 23.310 0.005
10 24 600 23.310 23.247 0.063
10 24 900 25.876 25.766 0.11
15 36 300 21.214 21.204 0.01
15 36 600 27.972 27.881 0.091
15 36 900 26.782 26.597 0.185
Fig 4.5 shows weight loss due to abrasion wear for sample having 30% volume fraction silcon
carbide and 4% of nano fillers for varying applied loads of 5N,10N,15N and number of revolutions
300,600,900.
0
0.02
0.04
0.06
0.08
0.1
0.12
0.14
0.16
0.18
0.2
0 200 400 600 800 1000
wei
ght
loss
(gm
)
number of revolutions
12 N
24 N
36 N

33
Sample 4
Table 4.5 6% nano fillers 30% silicon carbide
load Load acting
L=l×2.4(N)
revolutions Initial
weight w1
Final weight
w2
Weight loss
5 12 300 25.283 25.274 0.009
5 12 600 25.274 25.201 0.073
5 12 900 25.201 25.046 0.155
10 24 300 27.276 27.266 0.01
10 24 600 27.266 27.177 0.089
10 24 900 25.403 25.239 0.164
15 36 300 27.097 27.071 0.026
15 36 600 25.743 25.633 0.11
15 36 900 24.922 24.807 0.215
Fig 4.6 weight loss due to abrasion wear for sample having 30% volume fraction silicon carbide
and 2% of nanofillers for varying applied loads of 5N,10N,15N and number of revolutions
300,600,900.
0
0.05
0.1
0.15
0.2
0.25
0 200 400 600 800 1000
wei
ght
loss
(gm
)
number of revolutions
12 N
24 N
36 N
34
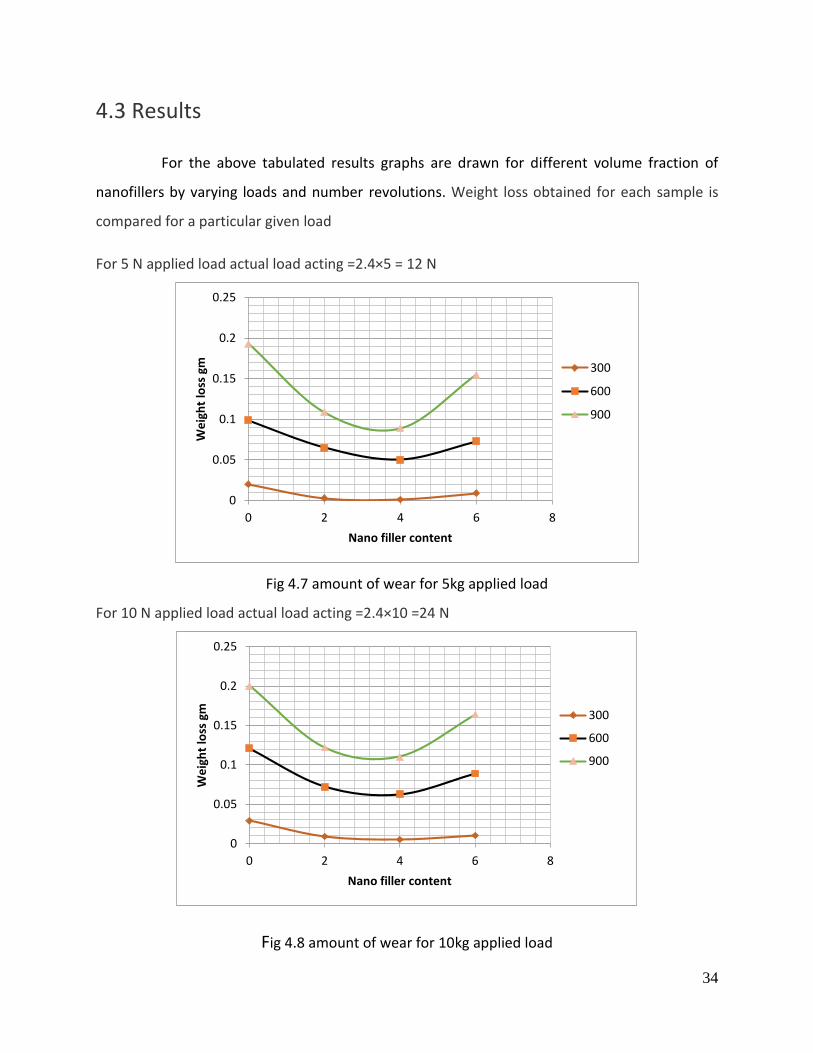
4.3 Results
For the above tabulated results graphs are drawn for different volume fraction of
nanofillers by varying loads and number revolutions. Weight loss obtained for each sample is
compared for a particular given load
For 5 N applied load actual load acting =2.4×5 = 12 N
Fig 4.7 amount of wear for 5kg applied load
For 10 N applied load actual load acting =2.4×10 =24 N
Fig 4.8 amount of wear for 10kg applied load
0
0.05
0.1
0.15
0.2
0.25
0 2 4 6 8
We
igh
t lo
ss g
m
Nano filler content
300
600
900
0
0.05
0.1
0.15
0.2
0.25
0 2 4 6 8
We
igh
t lo
ss g
m
Nano filler content
300
600
900

35
For 15 N applied load actual load acting =2.4×15 =36 N
Fig 4.9 amount of wear for 15 kg applied load
From the graphs plotted above its evident that the sample which is having 4% volume fraction of
nanofillers in silicon carbide reinforced composite is having the lowest wear for different applied
loads of 5N, 10N, 15N.
0
0.05
0.1
0.15
0.2
0.25
0.3
0 1 2 3 4 5 6 7
We
igh
t lo
ss g
m
Nano filler content
300
600
900

36
CHAPTER 5
Conclusions
From the above discussed results following conclusions are drawn
1. The nano alumina silicon carbide nanocomposites are successfully fabricated.
2. The sample having 4% volume fraction of nanofillers gave the best results showing less
amount of wear.
3. Addition of nanofillers to composite in addition to the traditional fillers decrease the wear
rate of composite by considerable extent.
4. Alumina nanocomposites show better wear resistance compared to the composites
without nanofillers.
5. Amount of wear initially decreased from 2% volume fraction of nanofillers to 4% volume
fraction nanofillers but for 6% volume fraction of nanofillers the amount of wear is higher
than that of sample having 4% volume fraction of nanofillers.

37
REFERENCES
1) http://en.wikipedia.org/wiki/Tribology
2) Jartiz, A.E., Design 1965, p.18.
3) Kelly, A. Sci. American 217, (B), (1967): p. 161.
4) Berghezan,A.Nucleus,8(5),1966,(Nucleus A Editeur,1,rhe,Chalgrin,Paris, 16(e).
5) Suchetclan Van, Philips Res. Repts.Volume 27, (1972): p. 28
6) Jihong She etal, “Mechanical properties and fracture behavior of fiberous Al2O3/SiC
ceramics” Journal of the European Ceramic Society 20 (2000) 1877±1881
7) M. Belmonte, M.I. Nieto, M.I. Osendi, P. Miranzo “Influence of the SiC grain size on the
wear behaviour of Al2O3/SiC composites” Journal of the European Ceramic Society 26
(2006) 1273–1279
8) Guo-Dong Zhan, Joshua Kuntz, Julin Wan, Javier Garay, Amiya K. Mukherjee “Alumina-
based nanocomposites consolidated by spark plasma sintering”Scripta Materialia 47
(2002) 737–741
9) David L. Burris, W. Gregory Sawyer “Improved wear resistance in alumina-PTFE
nanocompositeswith irregular shaped nanoparticles”Wear 260 (2006) 915–918
10) Gujjala Raghavendra, S.K.Acharya, S.K.Pal. Preparation of Alumina (Al2O3) Nano
Powder by Auto Combusion Process. International Journal of Systems, Algorithms &
Applications (IJSAA), Volume 2, 2012, pp 74-76.
11) R. Holm, “The frictional force over the real area of Contact”, Wiss. Vereoff. Siemens
Werken, Vol. 17 (4), 1938, pp. 38-42.
12) L.S. Eyre, “Wear Characteristics of metals”, Tribology International, October 1976, pp.
203-212.
13) B.Suresha,G.Chandramohan, Siddaramaiah, Kunigal,N.Shivakumar, Mohammed
IsmailMechanical and three-body abrasive wear behaviour of three-dimensional glass
fabric reinforced vinyl ester composite, Materials Science and Engineering: A
Volume 480, Issues 1–2, 15 May 2008, Pages 573–579