tribological behavior of micro/nano structured tantalum ... · ayesha khalid tribological behavior...
TRANSCRIPT
Ayesha Khalid
Tribological Behavior of Micro/Nano Structured Tantalum Surfaces by Anodization Method
Submitted in partial fulfillment of the requirements for the degree of Master in Tribology of Surface and Interfaces
July 2016

ii
DEPARTAMENTO DE
ENGENHARIA MECÂNICA
Tribological Behavior of Micro/Nano Structured Tantalum Surfaces by Anodization Method Submitted in Partial Fulfilment of the Requirements for the Joint European Master in Tribology of Surfaces and Interfaces
Author
Ayesha Khalid
Advisors
Professor Amilcar Ramalho Professor Sandra Carvalho
Jury
President Bruno Trindade
Professor at University of Coimbra
Vowels
Paulo Ferreira
Professor at University of Texas
Stephen Muhl Professor at National Autonomous University of Mexico
Advisor Amilcar Ramalho
Professor at University of Coimbra
In the framework of Joint European Master in Tribology of Surfaces and Interfaces
Coimbra, July, 2016

"When I'm working on a problem, I never think about beauty. I think
only how to solve the problem. But when I have finished, if the
solution is not beautiful, I know it is wrong."
(R. Buckminster Fuller)


Acknowledgements
Ayesha Khalid iii
ACKNOWLEDGEMENTS
As I come to the end of my thesis and put the final touch of acknowledging all
the people who helped and supported me through this I reflect back to this period of
intense learning, not just on academic level but also on a personal level.
I would first and foremost like to express my profound gratitude to my
supervisors Professor Sandra Carvalho and Professor Amilcar Ramalho who were always
available whenever I needed guidance. I am grateful to Professor Albano for his help,
patience and support and for facilitating me in every way possible. I am especially thankful
to Professor Amilcar for his valuable guidance and for inspiring me to think out of the box
in scientific research. I am also thankful to Cristiana Alves for her support and guidance.
She was a valuable mentor on my visits University of Minho for experimental work.
I am thankful to the TRIBOS consortium for providing me with the opportunity
of pursuing my master studies under this prestigious program. A special thanks to all my
TRIBOS mentors Professor Ardian Morina, Professor Mitjan Kalin and Professor Bruno
Trindade for their support.
Lastly, I would like to acknowledge the iron support of my family, especially
my mother and my fiancé, through this journey. I thank you for being my cheerleaders in
hard times and pushing me to do my best.

iv 2016
Abstract
Ayesha Khalid v
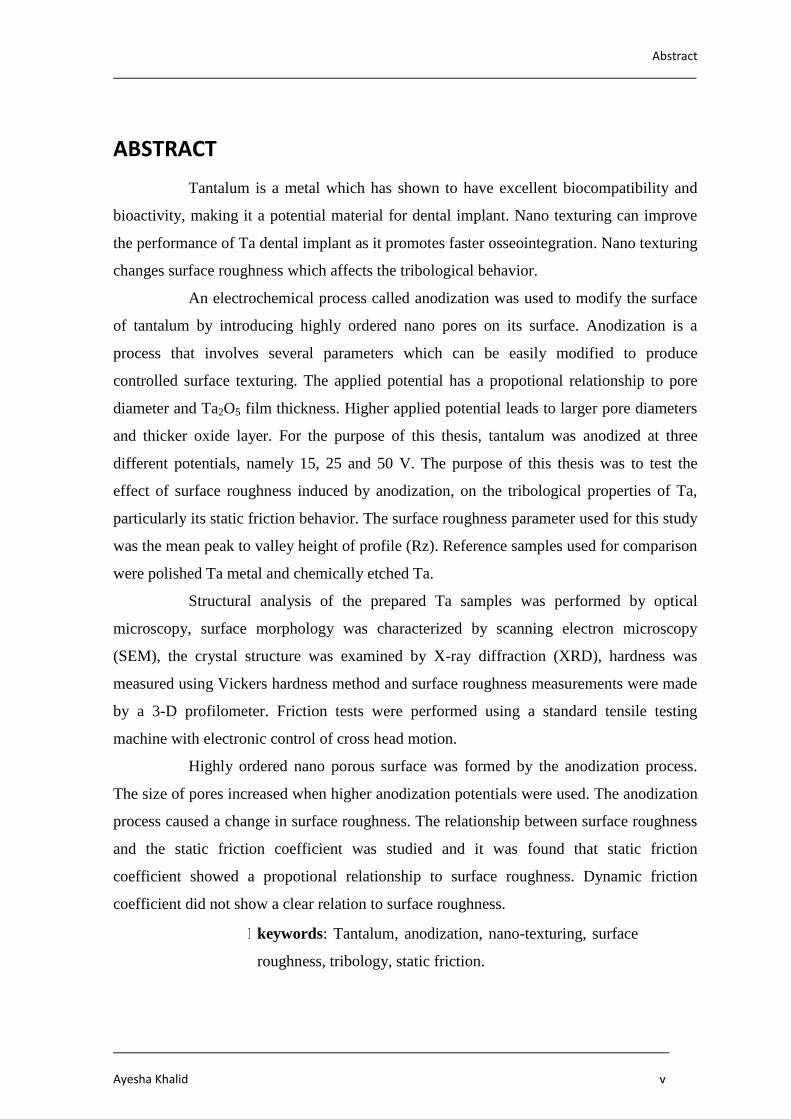
ABSTRACT
Tantalum is a metal which has shown to have excellent biocompatibility and
bioactivity, making it a potential material for dental implant. Nano texturing can improve
the performance of Ta dental implant as it promotes faster osseointegration. Nano texturing
changes surface roughness which affects the tribological behavior.
An electrochemical process called anodization was used to modify the surface
of tantalum by introducing highly ordered nano pores on its surface. Anodization is a
process that involves several parameters which can be easily modified to produce
controlled surface texturing. The applied potential has a propotional relationship to pore
diameter and Ta2O5 film thickness. Higher applied potential leads to larger pore diameters
and thicker oxide layer. For the purpose of this thesis, tantalum was anodized at three
different potentials, namely 15, 25 and 50 V. The purpose of this thesis was to test the
effect of surface roughness induced by anodization, on the tribological properties of Ta,
particularly its static friction behavior. The surface roughness parameter used for this study
was the mean peak to valley height of profile (Rz). Reference samples used for comparison
were polished Ta metal and chemically etched Ta.
Structural analysis of the prepared Ta samples was performed by optical
microscopy, surface morphology was characterized by scanning electron microscopy
(SEM), the crystal structure was examined by X-ray diffraction (XRD), hardness was
measured using Vickers hardness method and surface roughness measurements were made
by a 3-D profilometer. Friction tests were performed using a standard tensile testing
machine with electronic control of cross head motion.
Highly ordered nano porous surface was formed by the anodization process.
The size of pores increased when higher anodization potentials were used. The anodization
process caused a change in surface roughness. The relationship between surface roughness
and the static friction coefficient was studied and it was found that static friction
coefficient showed a propotional relationship to surface roughness. Dynamic friction
coefficient did not show a clear relation to surface roughness.
K keywords: Tantalum, anodization, nano-texturing, surface
roughness, tribology, static friction.

vi 2016
Resumo
Ayesha Khalid vii
RESUMO
O Tântalo (Ta) é um elemento metálico com excelentes propriedades no que
diz respeito a biocompatibilidade e bioatividade, demonstrando possuir um enorme
potencial para ser usado em implantes odontológicos. A nano-texturização pode melhorar o
desempenho de implantes dentários promovendo um aumento por parte da integração
óssea. No entanto, a alteração da rugosidade superficial através desta técnica de superfície
pode afetar o seu comportamento tribológico. No presente trabalho, foi utilizado um
processo eletroquímico conhecido como anodização de forma a modificar a superfície do
Ta através da introdução de nano poros, altamente ordenados. A anodização é um processo
que envolve a utilização de vários parâmetros que podem ser facilmente modificados,
permitindo obter um maior controle sobre a texturização da superfície do elemento. Existe
uma relação diretamente proporcional entre o potencial aplicado (Volts-V) e o diâmetro
dos poros assim como a espessura dos filmes de Ta2O5. Quanto maior for o potencial
aplicado, maior será o diâmetro dos poros e mais espessa será a camada de óxido formada
sobre a superfície de Ta.
O presente trabalho tem como objetivo o estudo do efeito da alteração da
rugosidade na superfície de Ta induzida por anodização, assim como, a influência sobre as
propriedades tribológicas, em particular o seu comportamento à fricção estática. Para que
este estudo fosse possível foi realizada a análise estrutural e morfológica de amostras
anodizadas a três potenciais diferentes: 15, 25 e 50 V.
A análise estrutural das amostras de Ta foi avaliada com recurso à técnica de
difração de raios-X (DRX), a morfologia da superfície foi estudada por microscopia de
varrimento eletrónico (SEM), a dureza classificada segundo a escala de Vickers e a
rugosidade avaliada através de um perfilómetro 3-D. Os ensaios de desgaste foram
realizados utilizando uma máquina de ensaios de tração com controlo numérico. Os
resultados obtidos foram comparados com amostras de Ta sem qualquer tratamento
superficial.
O processo de anodização permitiu obter superfícies nano porosas
extremamente ordenadas. O tamanho das porosidades aumentou com o aumento do
potencial de anodização. A utilização do processo de anodização possibilitou uma
alteração da rugosidade superficial. A relação entre a rugosidade superficial e o coeficiente
de atrito estático, foi comparada, verificando-se que o valor de coeficiente de atrito é

Resumo
viii 2016
diretamente proporcional á rugosidade superficial. Em relação ao coeficiente de atrito
dinâmico, não foi encontrado uma relação empírica com a rugosidade superficial.
palavras-chave: Tântalo, anodização, nano-texturização, rugosidade
superficial, tribologia , atrito estático .
Contents
Ayesha Khalid ix
Contents
Acknowledgements .............................................................................................................. iii
Abstract .................................................................................................................................. v
Resumo ................................................................................................................................ vii
List of Figures ....................................................................................................................... xi
List of Tables ...................................................................................................................... xiii
Symbology and Acronyms ................................................................................................. xiv Symbology ...................................................................................................................... xiv Acronyms ....................................................................................................................... xiv
1. Introduction ................................................................................................................... 1 1.1. Objectives ............................................................................................................... 2
1.2. Thesis Structure ...................................................................................................... 2
2. State of the art ................................................................................................................ 4 2.1. Dental Implants ....................................................................................................... 4 2.2. Surface modification of dental implant .................................................................. 5
2.2.1. Anodization ..................................................................................................... 6 2.3. Dental implant/Bone interface: Tribological Problems ........................................ 10
3. Experimental Procedure .............................................................................................. 15 3.1. Materials and methods .......................................................................................... 15
3.1.1. Tantalum sample preparation ........................................................................ 15
3.1.2. Bone material ................................................................................................. 17
3.2. Characterization Techniques ................................................................................. 18
4. Results and Discussion ................................................................................................ 21 4.1. Surface Imaging (Optical Microscopy) ................................................................ 21
4.2. Surface Morphology ............................................................................................. 22 4.3. Crystal Structure ................................................................................................... 23 4.4. Hardness ................................................................................................................ 25
4.5. Wetting behavior ................................................................................................... 26 4.6. Surface Roughness ................................................................................................ 26
4.6.1. Surface roughness in dry condition ............................................................... 26 4.6.2. Surface roughness after immersion in saliva ................................................. 27
4.7. Friction Behavior .................................................................................................. 28
4.7.1. Static Friction Behavior ................................................................................. 30 4.7.2. Dynamic Friction Behavior ........................................................................... 32 4.7.3. Static Friction Behavior in Artificial Saliva (Dry vs. Wet) ........................... 34
4.7.4. Dynamic friction behavior in dry vs. wet conditions .................................... 36
4.7.5. Static friction vs. Surface roughness ............................................................. 37 4.8. Wear analysis ........................................................................................................ 38
4.8.1. Dry condition ................................................................................................. 38 4.8.2. Wet condition ................................................................................................ 40
Conclusions ......................................................................................................................... 42

Contents
x 2016
Future work ......................................................................................................................... 43
Bibliography ........................................................................................................................ 44
Annex A – SEM-EDS Spectrum of anodized tantalum surface .......................................... 50
Annex B – SEM images of tantalum surfaces anodized at different potentials ................. 51

List of Figures
Ayesha Khalid xi
LIST OF FIGURES
Figure 2.1. Tooth vs. Implant Comparison [5] ...................................................................... 4
Figure 2.2. Schematic diagram of porous titanium oxide formation above the breakdown
potential: (A) oxide growth to maximal thickness (B) burst of oxide by the
formation of crystallites (pore formation), (C) immediate repassivation of pore
tips, (D) burst of repassivated oxide, and (E) dissolution of the formed oxide and
second repassivation [16]. ....................................................................................... 7
Figure 2.3. Fretting modes existed in the dental implant/bone interface [44] ..................... 12
Figure 2.4. Four kind of cracks in radial fretting test [44]. ................................................. 13
Figure 3.1. Schematics of experimental setup for two-sided anodization of Ta metal. ...... 16
Figure 3.2. (a) Prepared artificial bone sample (b) Artificial bone samples placed in the
friction test equipment. .......................................................................................... 17
Figure 3.3. (a)The friction coefficient measurement setup and (b) schematics of the friction
test ......................................................................................................................... 19
Figure 4.1. Surface images of Ta samples obtained from optical microscope. (a) Ta-
Polished, (b)Ta-Polished and anodized at 15 V, (c) Ta-Etched, (d) Ta-polished,
etched and anodized at 15 V (e) Ta-polished, etched and anodized at 25 V, (f) Ta-
polished, etched and anodized at 50 V .................................................................. 21
Figure 4.2. SEM images (50000X magnification) of Ta surfaces treated at different
conditions (a) polished and etched (b) Polished and anodized at 15 V (c) Polished,
etched and anodized at 15 V (d) Polished, etched and anodized at 25 V (e)
Polished, etched and anodized at 50 V .................................................................. 23
Figure 4.3. XRD patterns of Ta samples treated at different conditions (a) Pure Ta with
polished surface (b) Ta metal polished and anodized at 15V (c) Ta metal polished
and etched (d) Ta metal polished, etched and anodized at 15V (e) Ta metal
polished, etched and anodized at 25V (f) Ta metal polished, etched and anodized
at 50V .................................................................................................................... 24
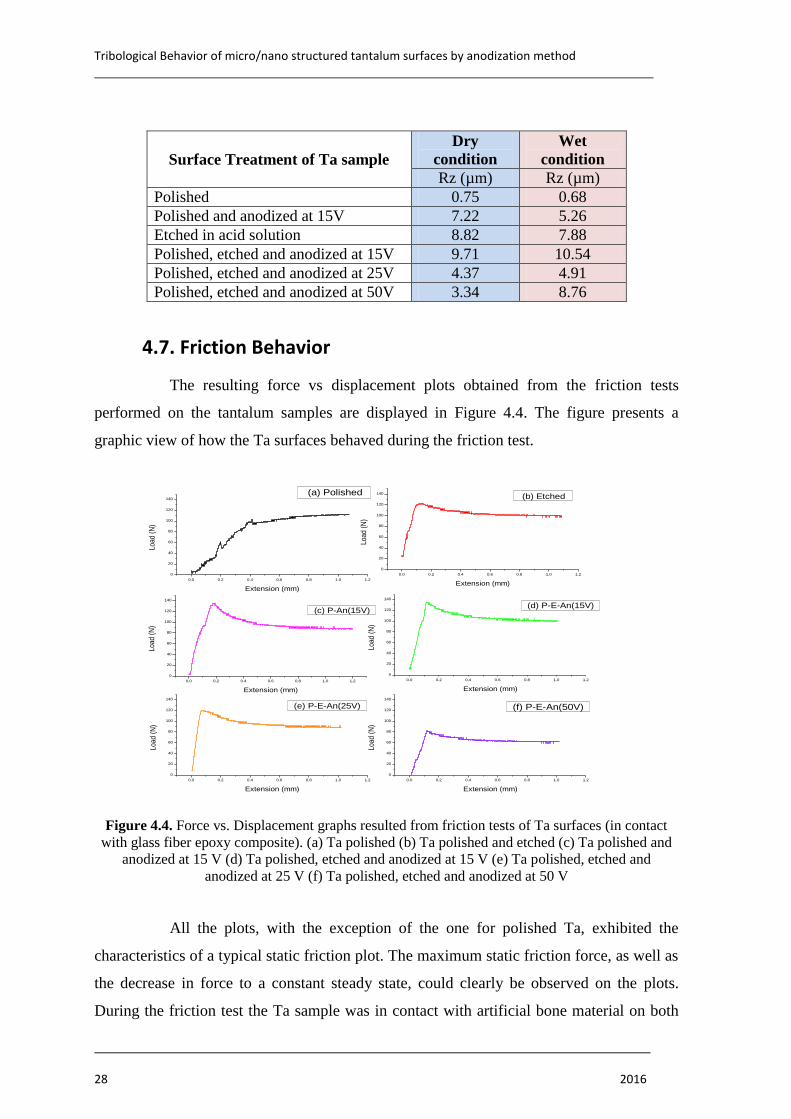
Figure 4.4. Force vs. Displacement graphs resulted from friction tests of Ta surfaces (in
contact with glass fiber epoxy composite). (a) Ta polished (b) Ta polished and
etched (c) Ta polished and anodized at 15 V (d) Ta polished, etched and anodized
at 15 V (e) Ta polished, etched and anodized at 25 V (f) Ta polished, etched and
anodized at 50 V .................................................................................................... 28
Figure 4.5. (a) The mean peak to valley height of roughness profile (Rz) and (b) static
friction coefficient (µs) of Ta surfaces treated at different conditions (P=Polished,
E=Etched, An=Anodized) ..................................................................................... 30
Figure 4.6. Static and dynamic friction coefficients of Ta surfaces treated at different
conditions (P=Polished, E=Etched, An=Anodized) .............................................. 34
Figure 4.7. Friction graphs of Ta samples in dry and wet conditions (P=Polished,
E=Etched, An=Anodized) ..................................................................................... 35
Figure 4.8. Relationship between surface roughness (Rz) and static friction coefficient (µs)
of Ta samples treated at different conditions ........................................................ 38

List of Figures
xii 2016
Figure 4.9. Wear marks on Ta surfaces after friction test in dry conditions (a) Ta-polished
(b) Ta-polished and anodized at 15 V (c) Ta-etched (d) Ta-polished, etched and
anodized at 15 V (e) Ta-polished, etched and anodized at 25 V (f) Ta-polished,
etched and anodized at 50 V ................................................................................. 40
Figure 4.10. Wear marks on Ta surfaces after friction tests in wet condition. (a) Ta-
polished (b) Ta-polished and anodized at 15 V (c) Ta-etched (d) Ta-polished,
etched and anodized at 15 V (e) Ta-polished, etched and anodized at 25 V (f) Ta-
polished, etched and anodized at 50 V .................................................................. 41

List of Tables
Ayesha Khalid xiii
LIST OF TABLES
Table 3.1. Treatment conditions of tantalum samples ......................................................... 15
Table 4.1. Vicker hardness measurements of Ta surfaces treated at different conditions .. 25
Table 4.2. Wetting contact angle measurements of Ta samples with artificial saliva as
wetting fluid .......................................................................................................... 26
Table 4.3. Surface roughness data obtained for Ta samples treated at different conditions 27
Table 4.4. Friction parameters obtained from friction plots of Ta samples treated at
different conditions................................................................................................ 29
Table 4.5. Friction coefficients of Ta samples treated at different conditions .................... 29
Table 4.6. Static friction coefficient data of Ta samples in dry and wet conditions ........... 35
Table 4.7. Dynamic friction coefficients of Ta samples in dry and wet conditions ............ 37
Symbology and Acronyms
xiv 2016
SYMBOLOGY AND ACRONYMS
Symbology
µs – static friction coefficient
µd – dynamic friction coefficient
Acronyms
ICDD – International centre for diffraction data
CEMUC – Centre for Mechanical Engineering
HV – Vickers hardness
Tribological Behavior of micro/nano structured tantalum surfaces by anodization method
Ayesha Khalid xv

Chapter 1
Ayesha Khalid 1
1. INTRODUCTION
A dental implant is an artificially constructed tooth root which is integrated
with an artificially made tooth crown to replace missing teeth [1]. When the implant is
inserted inside the jaw, a healing process takes place. The healing process is called
osseointegration, which occurs when the bone cells surround the implant grow into a
network around the artificial prosthetic, hence holding it firmly in place. The growing bone
cells are called osteoblasts. Their adhesion to the implant surface greatly depends on the
implant geometry and surface properties. Biocomplatibility is the most essential property
required for dental implant materials. In this regards tantalum seems to be a good option.
Modification of surface properties of a dental implant has been given special
focus in terms of accelerating the healing process. Particularly surface roughness has been
identified as an important parameter in this respect [2]. Several surface texturing
techniques have been used in the past but each of them has certain drawbacks. Most
importantly, the techniques do not provide easy control of surface roughness. Anodization
is an electrochemical technique that has been employed in the past for surface texturing.
The parameters involved in this technique can be easily controlled, hence giving the user to
ability to control the surface roughness. The technique can be used to achieve surface
roughness values from the micron scale down to the nano scale.
The tribological behavior of a textured dental implant surface plays a
significant role in its performance. When a dental implant is inserted inside the jaw, ideally
it should become anchored firmly with no motion. The efficiency of mechanical
interlocking between the textured surface and the surrounding bone decides the degree of
the anchorage. The mechanical interlocking also decides how much force would be
required to slide the contacting surfaces against each other. In a dental implant sliding
should not exist. Therefore, the textured surface should have a surface roughness that
enables it to efficiently interlock with the bone structure. In other words, its static friction
coefficient should be as high as possible. However, dental implants have shown to exhibit
some fretting motion. Fretting can lead to wear debris and loosely anchored dental implant.
Therefore it is essential to study the tribological behavior of the material used for dental
implant in order to validate its suitability for the application.
The purpose of this master’s thesis is to study the tribological behavior of
micro/nano anodized tantalum surface by anodization to be used as dental implant
Tribological Behavior of micro/nano structured tantalum surfaces by anodization method
2 2016
materials. Tantalum surfaces with different nano pore sizes have been made by anodization
and the tribological performance of these surfaces in contact with bone will be evaluated.
1.1. Objectives
The aim of this master thesis research work is to measure and analyze the
tribological behavior of micro/nano textured tantalum surfaces formed by anodization
method. Anodization is an electrochemical technique that has been employed in the past
for surface texturing of materials for different applications. For dental implants, surface
texturing has been performed to accelerate the healing process. The anodization technique
involves several parameters which can be easily controlled to modify the surface texture
and to achieve highly ordered nanopores. For this thesis, the applied potential was varied
while keeping all other parameters (time, electrolyte, current and temperature) constant.
Increasing the potential causes the pore diameter and the tantalum oxide layer thickness to
increase.
Surface morphology was characterized by scanning electron microscope
(SEM), the crystal structure by X-ray diffraction (XRD), the surface roughness by 3-D
profilometry and hardness by vickers hardness test. The tribological characterization was
done by using a friction coefficient measurement device which was originally developed in
CEMUC. The setup was operated by a standard tensile testing machine where the cross
head motion was controlled electronically. The wear marks were analyzed under an optical
microscope. The friction tests were performed at both dry and wet conditions. For the wet
conditions, the ageing effect of saliva was studied by immersing the samples in aritificial
saliva for 3 days, after which, friction tests were performed.
1.2. Thesis Structure
This thesis titled “Tribological properties of micro/nano textured tantalum
surfaces by anodization method” was performed as partial requirement for the completion
of masters in tribology of surfaces and interface (TRIBOS).
The thesis is divided into five parts. Chapter 1 describes the objectives and
structure of the thesis. The state of the art is presented in Chapter 2. The experimental
methods and the materials used as well as the characterization techniques are explained in
Chapter 1
Ayesha Khalid 3
Chapter 3. The results and discussion are presented in Chapter 4. The conclusions are
given in Chapter 5 and the future work is presented in Chapter 6.
Tribological Behavior of micro/nano structured tantalum surfaces by anodization method
4 2016
2. STATE OF THE ART
2.1. Dental Implants
Tantalum is a high density, high strength and high hardness metal. It has been
studied in the past for its possible biomedical applications and it has shown to have good
biocompatibility and bioactivity [1], [2]. The factors that contribute to the high bioactivity
in tantalum are its higher surface wettability and surface energy as compared to titanium
which lacks bioactivity [25], therefore tantalum has potential application as dental implant.
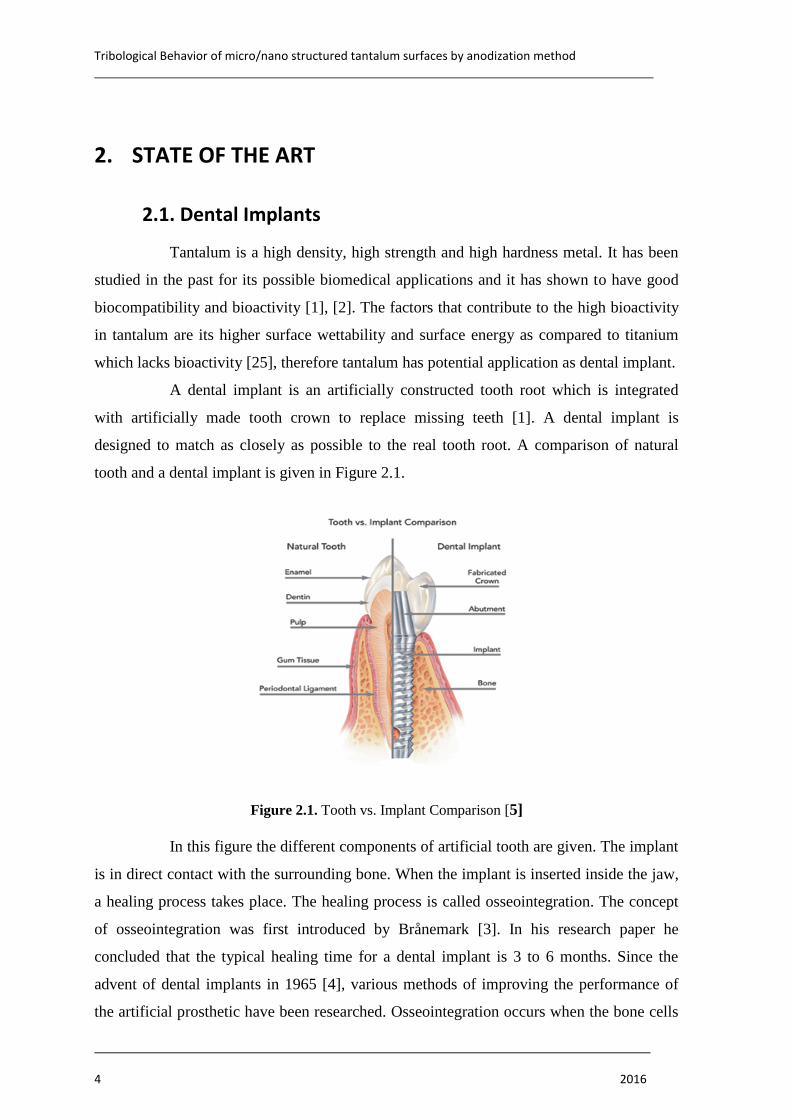
A dental implant is an artificially constructed tooth root which is integrated
with artificially made tooth crown to replace missing teeth [1]. A dental implant is
designed to match as closely as possible to the real tooth root. A comparison of natural
tooth and a dental implant is given in Figure 2.1.
Figure 2.1. Tooth vs. Implant Comparison [5]
In this figure the different components of artificial tooth are given. The implant
is in direct contact with the surrounding bone. When the implant is inserted inside the jaw,
a healing process takes place. The healing process is called osseointegration. The concept
of osseointegration was first introduced by Brånemark [3]. In his research paper he
concluded that the typical healing time for a dental implant is 3 to 6 months. Since the
advent of dental implants in 1965 [4], various methods of improving the performance of
the artificial prosthetic have been researched. Osseointegration occurs when the bone cells
Chapter 2
Ayesha Khalid 5
surround the implant grow into a network around the artificial prosthetic, hence holding it
firmly in place. The growing bone cells are called osteoblasts. Their adhesion to the
implant surface greatly depends on the implant geometry and surface properties. Titanium
is a popular material used to make dental implant due to its excellent corrosion resistance,
high strength and excellent biocomplatibility. Titanium forms an oxide upon exposure to
air. The oxide layer is biocompatible and bioinert . Hence bone cells are not easily bonded
with its surface, resulting in the formation of a fibrous tissue layer which subsequently
separates the metal surface from the cells. Tantalum is another biocompatible material
which forms a bioactive oxide layer on its surface and thus has exhibited a behavior much
closer to real bone behavior than titanium [25]. Therefore this research has focused on
tantalum as a dental implant material because tantalum holds the promise of a faster and
more effective healing process.
2.2. Surface modification of dental implant
Modification of surface properties has been given special focus in terms of
improved biocompatibility of dental implant material. Particularly surface roughness has
been identified as an important parameter in the acceleration of healing process [2]. A
research study was conducted by Albrektsson & Wennerberg [7] on the effect of surface
roughness on dental implant performance. They focused their research on four most
commonly used commercially available dental implants. They categorized dental implants
according to their surface roughness values as: smooth (Sa < 0.5 µm), minimally rough (Sa
= 0.5-1.0 µm), moderately rough (Sa = 1.0-2.0 µm) and rough (Sa > 2.0 µm) [2]. The
researchers also introduced a new surface roughness parameter, developed surface area
ratio (Sdr) which takes into account the density of peaks (Sds) and surface roughness (Sa).
Hence it is a hybrid parameter used to estimate the heights and peaks of a surface [2].
Surface roughness can be divided into three levels based on scale [8]: macro, micro and
nano scaled roughness.
Several surface modification techniques have been used in the past. The most
commonly used surface modification techniques are: sand blasting (mechanical method),
acid etching (chemical method), plasma spraying (coating method), laser modification and
anodization (electrochemical method) [8].
Sand blasting is a process by which the surface is impinged by particles,
creating grooves and craters. This way the surface roughness is increased. Wennerberg et.
Tribological Behavior of micro/nano structured tantalum surfaces by anodization method
6 2016
al. performed extensive research on this method of surface modification on commercially
pure titanium implants [9][10]. They were able to conclude that the surface roughness
depends on the size, speed, density and shape of the impinging particle. The impinging
particles used were titanium oxide and aluminum oxide. A drawback of sand blasting is
that sometimes the particles can become buried in the surface. Typical surface roughness
values obtained from this method are 0.5 – 2.0 µm [2].
Acid etching is a technique by which an acid is used to pit the surface,
selectively removing some grains and grain boundaries. A surface can be made of different
phases. Compositional differences result in different sensitivity to acid etching. Hence,
some phases are more easily removed than others, resulting in increased surface roughness
by pitting. The surface roughness depends on the type of acid used, soaking time and
material surface composition. Typical surface roughness values obtained from acid etching
are 0.3 – 1.0 µm [2].
Coating methods such as plasma spraying have been used in the past as well.
Groot et. al. researched the possibility of improving the biocompatibility of titanium
implants by coating the surface with hydroxyapatite [11]. Their reason for using this
particular coating is its close match with bone. Past research has shown that the coating
effectively increases osseointegration, However, the coatings have weak adhesion on the
metal surface. They can dissolve when the implant is inserted or develop long term failure
[12].
2.2.1. Anodization
Bone cells (osteoblasts) have been shown to exhibit greater adhesion to nano-
textured titanium than to conventional titanium [12]-[14]. Hence, nanotexturing has shown
to improve the osseointegration process. Anodization is an electrochemical technique that
has been employed in the past for surface texturing of materials for different applications.
In the medical sector, anodization has been used to modify the surface properties of
implants. The anodization process consists of three major steps as given in literature [12]:
alkaline cleaning, acid activation and electrolyte anodizing. The anodization is an
electrochemical process which is carried out in a typical three electrode cell: Sample
anode, platinum cathode and Ag/AgCl reference electrode. The two electrode cell can also
be used. The technique can be used in two modes: constant potential and constant current.
Anodization has been used for inducing micro and nanopores on tantalum oxide surface, in
Chapter 2
Ayesha Khalid 7
past research. The electrochemical reactions and ions diffusion that take places during the
process lead to the formation of an oxide on the anode.
The earliest studies on anodization involved high voltage anodization (ASD).
The mechanism behind surface texturing by this method can be explained by the avalanche
theory [12]. When an oxide film forms it acts as a dielectric barrier to current flow. As the
potential is increase, the film continues to grow until the dielectric breakdown limit is
reached. At this point, the weaker regions of the heterogenous oxide film undergo thermal
stressing and subsequent breakdown. The exposed metal below the oxide starts forming an
oxide layer again. Therefore the process involves a balance between the growth and
breakdown of the oxide film. The balance is dependent on the processing parameters given
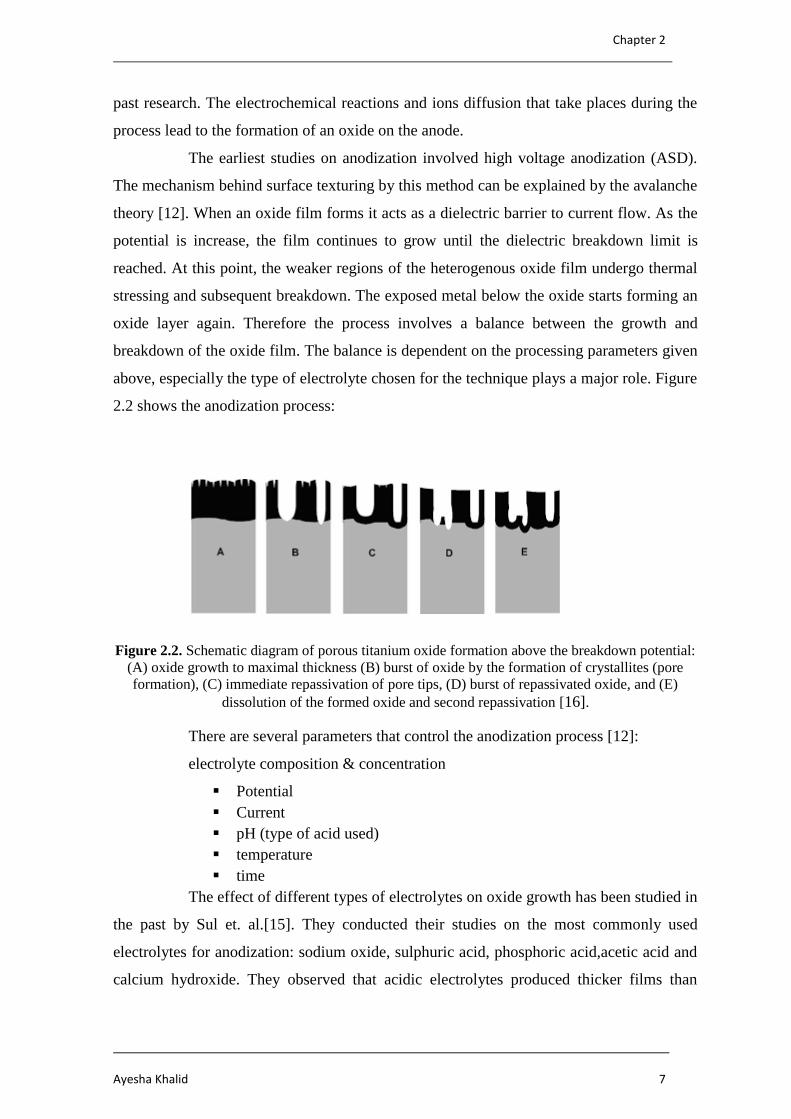
above, especially the type of electrolyte chosen for the technique plays a major role. Figure
2.2 shows the anodization process:
Figure 2.2. Schematic diagram of porous titanium oxide formation above the breakdown potential:
(A) oxide growth to maximal thickness (B) burst of oxide by the formation of crystallites (pore
formation), (C) immediate repassivation of pore tips, (D) burst of repassivated oxide, and (E)
dissolution of the formed oxide and second repassivation [16].
There are several parameters that control the anodization process [12]:
electrolyte composition & concentration
Potential
Current
pH (type of acid used)
temperature
time
The effect of different types of electrolytes on oxide growth has been studied in
the past by Sul et. al.[15]. They conducted their studies on the most commonly used
electrolytes for anodization: sodium oxide, sulphuric acid, phosphoric acid,acetic acid and
calcium hydroxide. They observed that acidic electrolytes produced thicker films than
Tribological Behavior of micro/nano structured tantalum surfaces by anodization method
8 2016
alkaline electrolytes. A number of researchers have studied the formation of TiO2
nanotubes on oxide thin film by anodization.
In 1980, Baun was able to form nanoporous TiO2 by anodization in chromic
acid at 10-40 V [17]. Since then, a number of researchers have found that presence of
hydrogen fluoride (HF) in electrolyte leads to formation of nanoporous structures TiO2 at
relatively lower voltages [18]-[22].
The effect of using different potential values in HF solution was studied by
Gong et. al. [[23]] and they found that as potential is increased, the pore size increases but
the final length of the nanotubes was independent of pore size [23].
The pH of the electrolyte bath affects the ability of oxide to reform after
breaking and the ability of electrolyte to dissolve the oxide [24]. Cai et. al. [25] studied the
effect of electrolyte pH on the growth of nanotubes on titanium oxide surface. They
observed that increasing the pH increases the time required for nanotube formation. Longer
nanotubes could be obtained at higher pH [25]. Hence the nanotube length can be
controlled by controlling the pH. The anodization time influences the nanotube wall
thickness but does not affect the tube diameter. With an increase in time the tube wall
thickness increases [24].
The pore wall thickness can be varied by changing the electrolyte bath
temperature. This relationship was studied by Mor GK et. al. [26]. They found out that
varying the temperature varied the process of electrochemical etching and chemical
dissolution. They performed their experiments at a constant potential of 10 V and two
different temperatures: 5 ˚C and 50 ˚C. The pore diameter is both cases was the same but
the average pore wall thickness at 5 ˚C was 34 nm and at 50 ˚C it was 9 nm.
Biological studies have shown a high healing rate in anodized nanoporous TiO2
dental implant. This is due to the increased adhesion, attachment and growth of the
osteoblasts on the bone-mimicking nanoporous surface. The osteoblasts have also shown to
have a different morphology on anodized surface than on unanodized titanium. They show
greater spreading on the surface of anodized titanium whereas they appear more rounded
on unanodized titanium [13]. The nanotubular structure also promoted much higher
calcium deposition by osteoblasts than the low roughness surface.
In the extensive study and research on the application of titanium as a
biocompatible material, it has been discovered that even though titanium oxide has
excellent biocompatibility, it lacks sufficient osseointegration for implant longetivity [27].
Chapter 2
Ayesha Khalid 9
As discussed in chapter 2.2, surface modification of dental implant, different surface
texturing methods have been used to promote bioactivity in titanium surface by improving
its adhesion and mechanically interlocking with bioactive coatings. Titanium oxide
surfaces need to be coated with a more bioactive hydroxyapatite to improve their
osseointegration performance. But ceramic porous coatings carry the risks of delamination,
cracking and low fracture toughness [27]. A bioactive material should not require any
coatings; its own surface should encourage bone growth [28]. Tantalum has come into the
spotlight as a material with good bioactivity, high mechanical strength and excellent
fatigue resistance [28]. The only reason its application in the medical field has been limited
is the processing problems associated with the metal. Tantalum is an expensive material
with a high melting point and high affinity to oxygen. This has posed as an obstacle in
manufacturing of a fully dense tantalum implant. In 2010, Balla et. al. [27] performed laser
coating of tantalum on titanium for bone replacement structures. Their study found that Ta
coated implant showed enhanced cell attachment and proliferation as compared to titanium
oxide surface. The enhanced osseointegration was attributed to the superior wettability and
high surface energy of Ta surface [27]. Jafari et. al. [29] compared the performance of
porous tantalum hip cup and hydroxyapatite coated titanium hip cup. Their aim was the
compare the bioactivity of both materials. Ta hip cup exhibited superior performance than
HA coated Ti cup. They concluded that Ta has clear potential for bone ingrowth whereas
Ti surface has potential for bone ongrowths. It requires an assistive bioactive coating such
as HA, hence it is not a true bone ingrowth surface (lacks bioactivity) [29].
The anodization of tantalum oxide films, both amorphous and crystalline has
been given special focus. The growth of dense oxide on tantalum in dilute phosphoric acid
electrolyte was studied by Lu et. al. in 2002 [30]. The growth of porous Ta2O5 films in
mixed H2SO4/HF electrolyte was studied by Sieber et. al. [31]. It was found that the nearly
uniform porous oxide can be achieved with pore diameter ranging from 2 to 10 nm. The
morphology and thickness of the layer depends on applied potential, anodization time and
the concentration of HF [31]. Anodization of tantalum has also been performed in non-
aqueous electrolytes consisting of glycerol with small quantities of NH4 [32]. It was found
that porous layers of thickness up to 15 µm and pore diameters in the range of 10-40 nm
can be achieved by optimizing the electrochemical conditions [32]. This study also
confirmed the strong effect of fluoride concentration and applied potential on the
morphology of the layers. Allama et. al. [33] studied the effect of using different
concentrations of HF and H2SO4. In addition they also studied the effect of adding small

Tribological Behavior of micro/nano structured tantalum surfaces by anodization method
10 2016
amounts of different additives such as H3PO4, ethylene glycol and dimethyl sulfoxide.
They observed that pore diameter increases with increasing concentration of HF. Addition
of H3PO4 resulted in growth of higher lengths of nanorods (1300 nm) and the other
additives enabled fabrication of high aspect-ratio vertically oriented tantalum oxide
nanotube array films [33].
Hence the same principals of controlling anodization parameters for texturing
titanium can also be applied for tantalum oxide surface, making its processing an
economical and simple task.
Anodic oxidation of tantalum can be used to produce controlled surface
porosity at the micro and nano scale. It has proven to be a simple, efficient technique for
surface texturing of dental implants. Anodized surfaces have shown to have higher
biocompatibility and lead to better adhesion and network formation from osteoblasts. Since
tantalum has excellent biocompatibility, its nanoporous oxide surface can potentially lead
to shorter healing time.
2.3. Dental implant/Bone interface: Tribological Problems
The design of a dental implant may be improved and optimized to match as
closely as possible to the real tooth but there will still be some differences. The mechanical
interlocking between a dental implant surface and the surrounding bone is not as strong as
the real biological surfaces of tooth and bone.
In chapter 2.2 the importance of surface texturing was discussed. Texturing of
the implant surface is performed to provide it with a surface structure that will fit into the
nano-porous structure of the bone. The two surfaces can ideally be thought of as having
complimenting jigsaw pattern, although the mechanical interlocking would not be as
perfect as a jigsaw. This interlocking provides the initial mechanical anchorage to the
implant/bone interface while the bone grows around the implant. Friction plays a major
role in the initial stability of immediately loaded dental implants [34]. It results from the
mechanical interlocking of implant and bone surfaces. Good mechanical interlocking
means that under loaded conditions the interface should undergo minor elastic
deformations but no slippage, as slippage will lead to micro-motions which result in
problems as will be explained further. Keeping this mechanical interlocking phenomenon
in mind, researchers have been improving the surface properties of dental implants. In
Chapter 2
Ayesha Khalid 11
1972, Predcki et. al. studied the effect of threaded implants as compared to smooth
implants, on the attachment of bone [35]. They found that the threaded implants showed
greater bone growth due to better mechanical interlocking and osseointegration.
Researchers also developed porous coatings in order to improve friction properties of the
implant [36]. The idea was that the increased surface roughness will improve implant
fixation. But studies have found that only a small percentage of pore volume is actually
filled with bone [37]-[39]. In 2012, Hasan et. al. researched an experimental approach to
determine the friction coefficient of implant-antler interface [34]. The antler is similar in
nature to human bone; hence the static and kinetic friction coefficients were measured. The
static friction coefficient values came to be in the range of 0.5-0.7 and increasing sliding
velocity decreased the friction coefficient [34]. A finite element method was also
developed by Bulaqi et. al [40] to study the effect of coefficient of friction on the preload
induced at the implant/bone interface and other interfaces of implant system. They were
able to conclude that coefficient of friction plays the most important role in implant screw
loosening [40].
In reality the implant’s surface does not interlock with the bone surface quite as
efficiently as desired. This causes some micro-motion to occur between the implant and
bone and the knowledge of the implications of this micro-motion on the performance of the
dental implant is important. tribological implications. The following paragraphs explain the
state of the art of the micro-motion problems that exist in dental implants.
In the earliest studies on the application of titanium dental implants, the
existence of some small degree of motion between the implant and bone was pointed out
by Carlsson et. al.[41]. This small degree of motion is called fretting. Fretting is the
tribological motion between two contacting surfaces under loaded condition, where the
amplitude of the movement is less than 100 µm [42]. The dental implant/bone interface
undergoes fretting wear due to the chewing motion of the mouth. The motion turns the
dental implant/bone interface into a special tribological pair undergoing different stresses
(tension, compression, shear) resulting in complex fretting and ultimately failure [1]. It is
especially a prominent problem during the early stages of osseointegration. After insertion
of the dental implant, the healing process takes a few months. In the primary healing phase
the fretting motion is highest as the surrounding bone has not fully attached itself to the
implant. The fretting behavior of titanium implants/cortical bone interface was studied by
Yu et. al. in 2005 [43].

Tribological Behavior of micro/nano structured tantalum surfaces by anodization method
12 2016
In a bio-tribological system, fretting will not just lead to production of wear
debris and surface damage. One of the contacting surfaces is the bone which is a living
tissue. It grows with time around the implant. The bio-response of the bone and the process
of osseointegration are also affected due to fretting motion. Fretting in dental implant/bone
interface can be divided into three types which are also illustrated in Figure 2.3 [44]:
1. tangential fretting
2. radial fretting
3. dual-motion fretting
Figure 2.3. Fretting modes existed in the dental implant/bone interface [44]
Yu et. al. in their research on fretting of titanium implants as mentioned before,
studied the tagential mode of fretting. They performed their experiments in-vitro by
employing a titanium ball on bone flat geometry on a reciprocating tribometer modified for
fretting. They were able to conclude that tagential fretting occurs due to delamination and
abrasive wear [43].
In 2008, Yu HY et. al. studied the radial fretting behavior of cortical bone/
titanium implant interface [45]. Radial fretting behaves quite differently from tagential
fretting due to the different direction of loading. The researchers concluded from their
study that radial fretting results in four types of cracks. The most common were along the
cement line due to the deficiency of calcium and phosphate along those lines. ‘The second
cracks initiate from or end at the Havers's canal. The third ones are cracks connecting two
consecutive Havers's canals if the stress is big enough. Each Harvers's system is a relative
independent structure, but it will release the stress energy to adjacent Harvers's system if it
could not use out the high stress brought from cracks alone. The fourth type is that kind of
cracks propagating at interstitial lamella linearly’ [45]. The four types of cracks are given
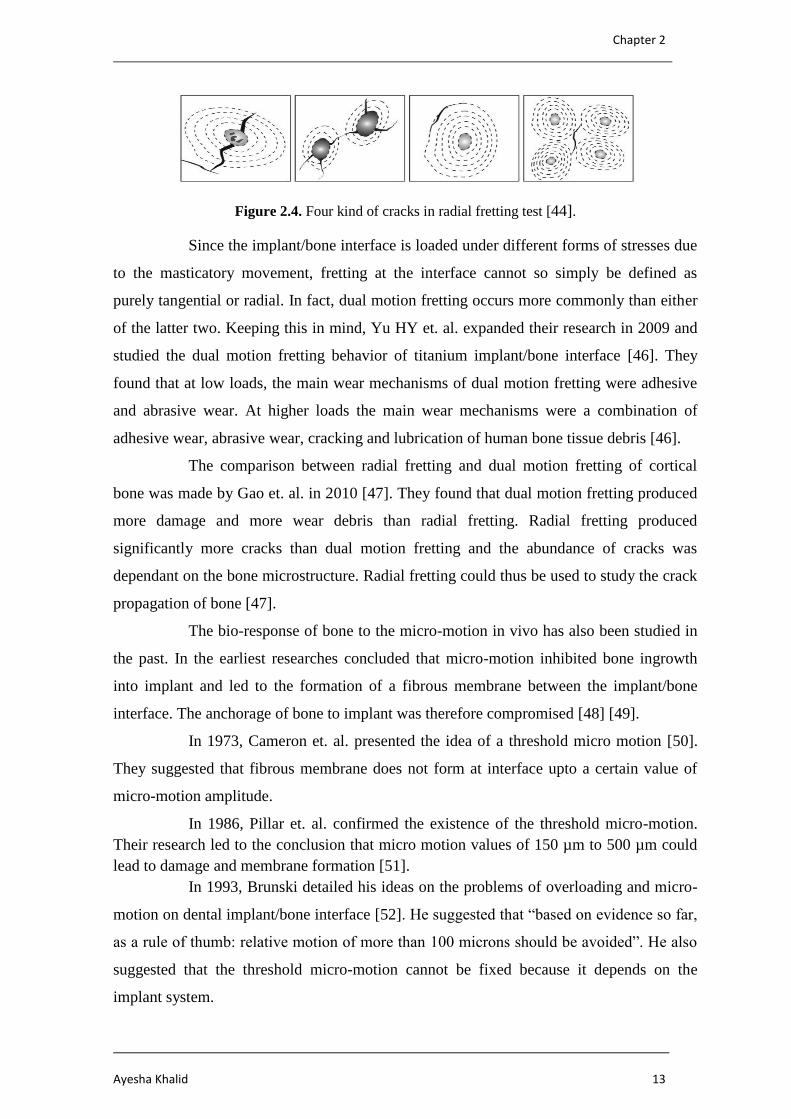
in Figure 2.4 [44]:
Chapter 2
Ayesha Khalid 13
Figure 2.4. Four kind of cracks in radial fretting test [44].
Since the implant/bone interface is loaded under different forms of stresses due
to the masticatory movement, fretting at the interface cannot so simply be defined as
purely tangential or radial. In fact, dual motion fretting occurs more commonly than either
of the latter two. Keeping this in mind, Yu HY et. al. expanded their research in 2009 and
studied the dual motion fretting behavior of titanium implant/bone interface [46]. They
found that at low loads, the main wear mechanisms of dual motion fretting were adhesive
and abrasive wear. At higher loads the main wear mechanisms were a combination of
adhesive wear, abrasive wear, cracking and lubrication of human bone tissue debris [46].
The comparison between radial fretting and dual motion fretting of cortical
bone was made by Gao et. al. in 2010 [47]. They found that dual motion fretting produced
more damage and more wear debris than radial fretting. Radial fretting produced
significantly more cracks than dual motion fretting and the abundance of cracks was
dependant on the bone microstructure. Radial fretting could thus be used to study the crack
propagation of bone [47].
The bio-response of bone to the micro-motion in vivo has also been studied in
the past. In the earliest researches concluded that micro-motion inhibited bone ingrowth
into implant and led to the formation of a fibrous membrane between the implant/bone
interface. The anchorage of bone to implant was therefore compromised [48] [49].
In 1973, Cameron et. al. presented the idea of a threshold micro motion [50].
They suggested that fibrous membrane does not form at interface upto a certain value of
micro-motion amplitude.
In 1986, Pillar et. al. confirmed the existence of the threshold micro-motion.
Their research led to the conclusion that micro motion values of 150 µm to 500 µm could
lead to damage and membrane formation [51].
In 1993, Brunski detailed his ideas on the problems of overloading and micro-
motion on dental implant/bone interface [52]. He suggested that “based on evidence so far,
as a rule of thumb: relative motion of more than 100 microns should be avoided”. He also
suggested that the threshold micro-motion cannot be fixed because it depends on the
implant system.
Tribological Behavior of micro/nano structured tantalum surfaces by anodization method
14 2016
In 2003, Gapski et. al. reviewed the effect of immediate implant loading [53].
He agreed with the past concepts of threshold micro-motion and Brunsk’s “rule of thumb”.
Based on these, they differentiated two different kinds of micro-motions: tolerable and
deleterious. They concluded that primary implant stability is the most important factor
affecting immediate implant loading [53].
It can be concluded that tribological properties of a dental implant material
play an important role in its performance and the tribological problems that can occur
when a dental implant is integrated into the biological system need to be analyzed and
solved before deeming a material suitable for this particular application.

Chapter 3
Ayesha Khalid 15
3. EXPERIMENTAL PROCEDURE
3.1. Materials and methods
The materials used for tribological test were tantalum samples and artificial
bone material (epoxy resin reinforced by glass fibers). The preparation of these materials
has been described in sub chapters of this topic (3.1.1 & 3.1.2).
3.1.1. Tantalum sample preparation
Tantalum sheets (T1-9000-D73), of purity 99.95% and thickness of 0.5 mm,
were obtained from the supplier Testbourne. Tantalum samples were prepared by cutting
the sheets to dimensions of 20 x 25 mm with a cutting machine. The burrs formed on the
edge of the samples, from cutting the metal sheet, were removed by using grinding paper
of grit size 320. In order to prepare the sample surface for anodization, both sides of the
samples were polished on grinding papers of grit size size 250, 320, 500, 800, 1200 and
2000, 2500 and 4000. Six conditions were defined for the treatment of the samples and
these are summarized in Table 3.1.
Table 3.1. Treatment conditions of tantalum samples
No. Treatment
1 Polished (reference)
2 Polished and Anodized at potential of 15 V in H2SO4:HF (9:1)
3 Polished and Etched in HNO3:HF (1:1) solution (reference)
4 Etched and Anodized at 15 V in H2SO4:HF (9:1)
5 Etched and Anodized at 25 V in H2SO4:HF (9:1)
6 Etched and Anodized at 50 V in H2SO4:HF (9:1)
As Table 3.1 shows, two samples were used as reference. They differed in
terms of their surface preparation i.e. mechanical polishing and chemical etching. The Ta
sheets supplied had poor surface quality hence etching was employed to remove scratchs
and irregularities from the surface. But since etching introduces pitting at the micron level
on the metal surface, the effect of this micro porosity on the friction of the textured surface
was also studied. Hence the mechanically polished sample was required for comparison in
this case. The samples were etched in an acid solution consisting of nitric acid and
hydrofluoric acid (1:1) for two minutes. Extreme care needed to be taken during the
Tribological Behavior of micro/nano structured tantalum surfaces by anodization method
16 2016
etching process due to the use of highly corrosive liquids. The samples immersed in the
solution were carefully stirred after every 30 seconds in order to ensure uniform etching.
After etching treatment the samples were washed with distilled water and air dried.
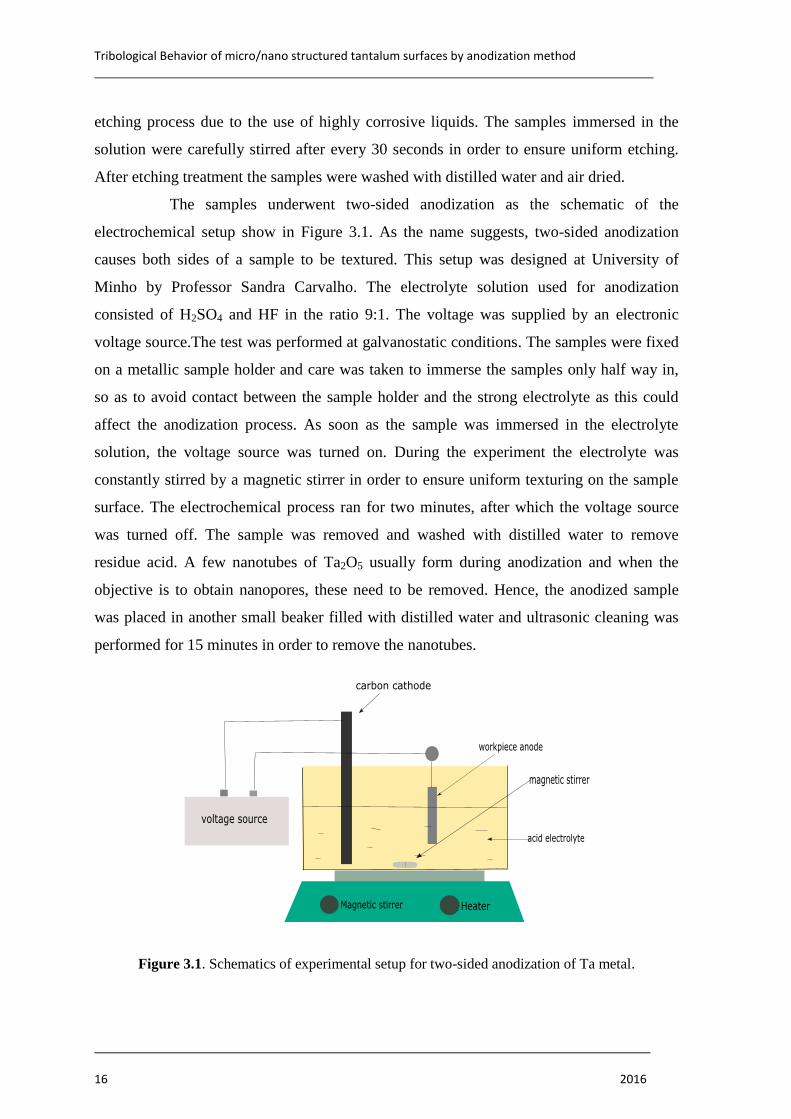
The samples underwent two-sided anodization as the schematic of the
electrochemical setup show in Figure 3.1. As the name suggests, two-sided anodization
causes both sides of a sample to be textured. This setup was designed at University of
Minho by Professor Sandra Carvalho. The electrolyte solution used for anodization
consisted of H2SO4 and HF in the ratio 9:1. The voltage was supplied by an electronic
voltage source.The test was performed at galvanostatic conditions. The samples were fixed
on a metallic sample holder and care was taken to immerse the samples only half way in,
so as to avoid contact between the sample holder and the strong electrolyte as this could
affect the anodization process. As soon as the sample was immersed in the electrolyte
solution, the voltage source was turned on. During the experiment the electrolyte was
constantly stirred by a magnetic stirrer in order to ensure uniform texturing on the sample
surface. The electrochemical process ran for two minutes, after which the voltage source
was turned off. The sample was removed and washed with distilled water to remove
residue acid. A few nanotubes of Ta2O5 usually form during anodization and when the
objective is to obtain nanopores, these need to be removed. Hence, the anodized sample
was placed in another small beaker filled with distilled water and ultrasonic cleaning was
performed for 15 minutes in order to remove the nanotubes.
Figure 3.1. Schematics of experimental setup for two-sided anodization of Ta metal.
Chapter 3
Ayesha Khalid 17
The samples were anodized at three different voltages in order to achieve
different pore sizes on the oxide layer. Increasing the potential increases the pore size [23]
as stated earlier in the state of the art. It should also be noted that increasing the voltage
also increases the oxide film thickness [55]. Hence, the samples anodized at 50 V had a
thicker oxide layer with a distinct grey-green color. Tantalum oxide tends to exhibit
different colors depending on the applied voltage, and at around 50 V the oxide film
usually exhibits a grey-green colour [56]. This phenomena was not observed on the surface
of the samples anodized at 15 V and 25 V. The surface of the different samples was
analyzed under an optical microscope and the results have been discussed in Chapter 4.1.
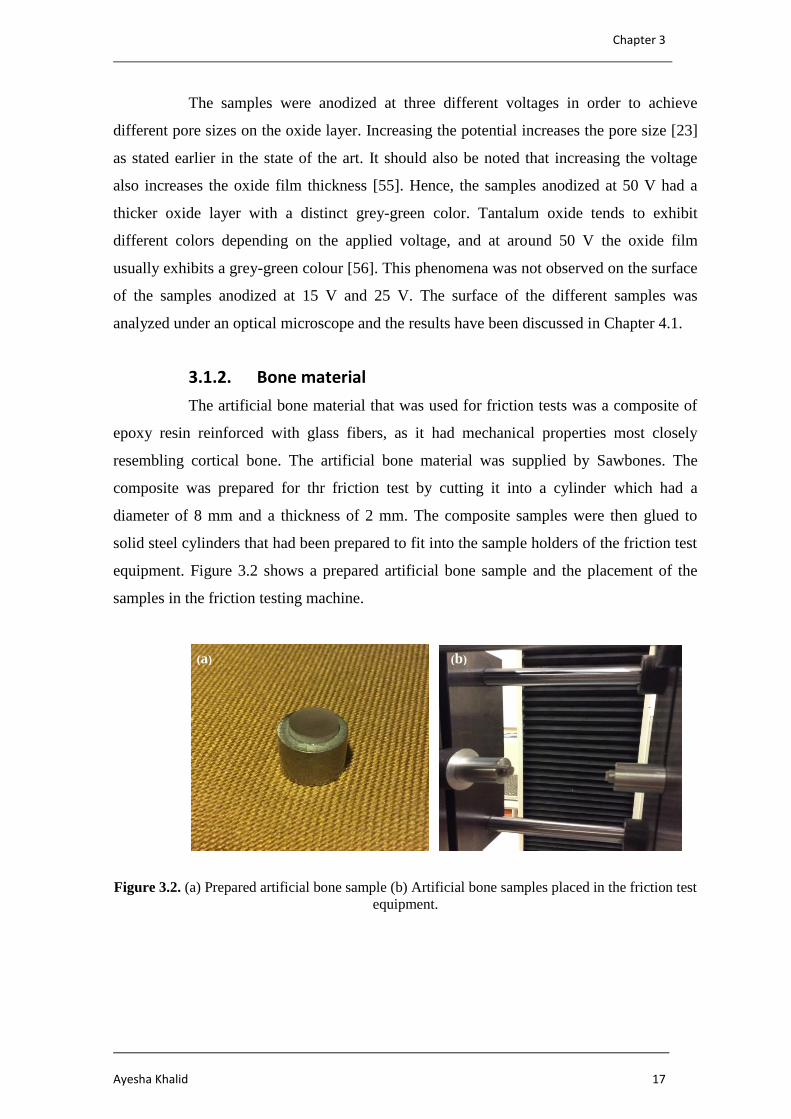
3.1.2. Bone material
The artificial bone material that was used for friction tests was a composite of
epoxy resin reinforced with glass fibers, as it had mechanical properties most closely
resembling cortical bone. The artificial bone material was supplied by Sawbones. The
composite was prepared for thr friction test by cutting it into a cylinder which had a
diameter of 8 mm and a thickness of 2 mm. The composite samples were then glued to
solid steel cylinders that had been prepared to fit into the sample holders of the friction test
equipment. Figure 3.2 shows a prepared artificial bone sample and the placement of the
samples in the friction testing machine.
Figure 3.2. (a) Prepared artificial bone sample (b) Artificial bone samples placed in the friction test
equipment.
(a) (b)

Tribological Behavior of micro/nano structured tantalum surfaces by anodization method
18 2016
3.2. Characterization Techniques
The prepared tantalum samples were characterized by various techniques. The
surface of the samples was inspected under an optical microscope and images were
captured with a camera attached to the microscope (Canon A620).
Field Emission Scanning Electron Microscopy (Zeiss Merlin Gemini 2) was
used to observe the morphology of the sample surfaces in order to compare the textured
surfaces with polished and etched surfaces, to measure the pore size of nano pores formed
on the surface of samples anodized at different potentials and to determine the uniformity
of nano-texturing obtained on the sample surface after anodization treatment.
X-ray Diffraction (PANalytical X’Pert PRO) was used to analyze the
crystallographic structure of the etched and anodized tantalum samples. Bragg-Brentano
X-ray diffraction was performed in conventional (θ-2θ) mode (scan range 20˚ < 2θ < 85˚,
step size 2θ= 0.04˚, scan step time 3 seconds and Cu Kα1 radiations (λ = 1.54060 Å).
Hardness measurements were made by using the Vickers hardness method
(Struess Duramin) in order to determine change in hardness due to developed of oxide
layer of different thickness. Hardness tests were performed with a diamond shaped
indenter at two different, 25 and 100 g.
The surface roughness of tantalum samples was measured using a 3-D
profilometry (alicona INFINITE FOCUS) in order to determine changes in the surface
roughness after etching and anodization treatment. The roughness measurements were also
performed on samples that have been kept in saliva at 37 ˚C for three days.
The tribological characterization was done by using a friction coefficient
measurement device which was originally developed in CEMUC. An image of the setup
and the schematics are shown in Figure 3.2. The setup was operated by a standard tensile
testing machine with electronic control of cross-head motion [54].
Chapter 3
Ayesha Khalid 19
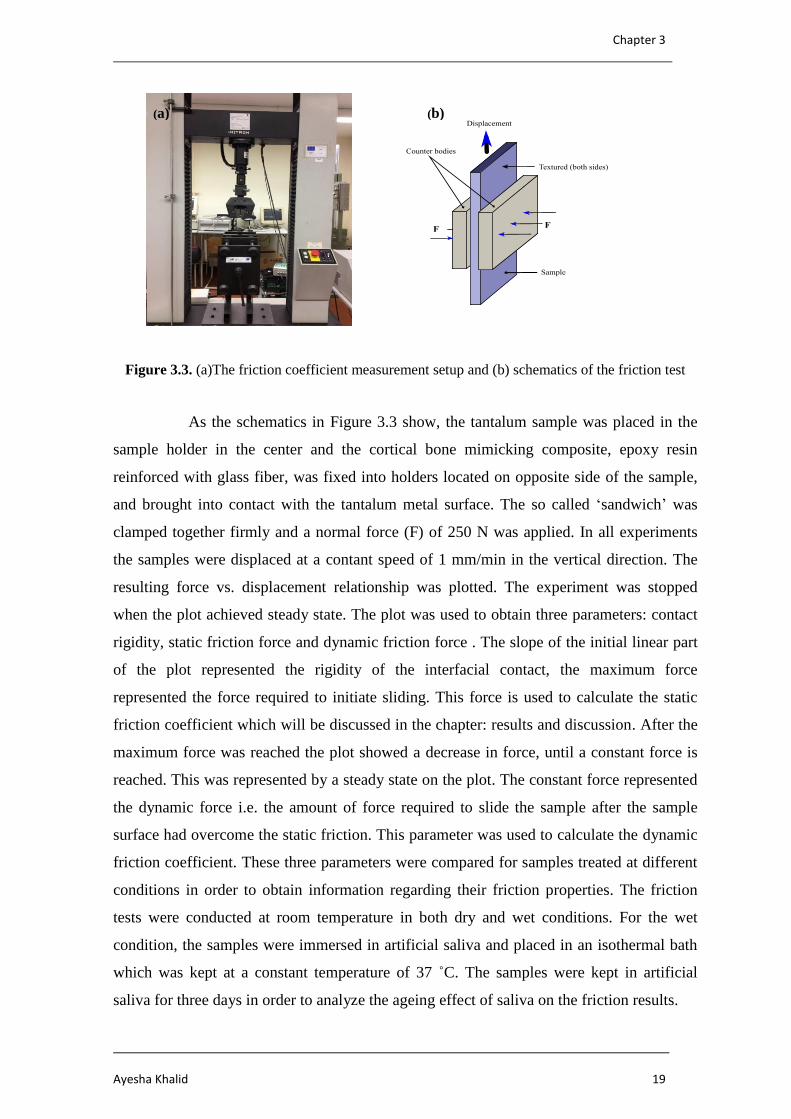
Figure 3.3. (a)The friction coefficient measurement setup and (b) schematics of the friction test
As the schematics in Figure 3.3 show, the tantalum sample was placed in the
sample holder in the center and the cortical bone mimicking composite, epoxy resin
reinforced with glass fiber, was fixed into holders located on opposite side of the sample,
and brought into contact with the tantalum metal surface. The so called ‘sandwich’ was
clamped together firmly and a normal force (F) of 250 N was applied. In all experiments
the samples were displaced at a contant speed of 1 mm/min in the vertical direction. The
resulting force vs. displacement relationship was plotted. The experiment was stopped
when the plot achieved steady state. The plot was used to obtain three parameters: contact
rigidity, static friction force and dynamic friction force . The slope of the initial linear part
of the plot represented the rigidity of the interfacial contact, the maximum force
represented the force required to initiate sliding. This force is used to calculate the static
friction coefficient which will be discussed in the chapter: results and discussion. After the
maximum force was reached the plot showed a decrease in force, until a constant force is
reached. This was represented by a steady state on the plot. The constant force represented
the dynamic force i.e. the amount of force required to slide the sample after the sample
surface had overcome the static friction. This parameter was used to calculate the dynamic
friction coefficient. These three parameters were compared for samples treated at different
conditions in order to obtain information regarding their friction properties. The friction
tests were conducted at room temperature in both dry and wet conditions. For the wet
condition, the samples were immersed in artificial saliva and placed in an isothermal bath
which was kept at a constant temperature of 37 ˚C. The samples were kept in artificial
saliva for three days in order to analyze the ageing effect of saliva on the friction results.
(a)
(a)
(b)
(a)
Tribological Behavior of micro/nano structured tantalum surfaces by anodization method
20 2016
The artificial saliva solution used in the experiments was prepared by using the
guidelines given in a publication by Darvell [57]. Prior to placing the samples in saliva,
wetting contact angle measurements were made to determine the change in wettability of
tantalum surface after surface treatment. Contact angle measurements were made with the
instrument dataphysics Contact Angle System OCA. The droplet volume was 9 µl and the
liquid used for comparison was water AS. Three measurements were taken for each sample
in order to ensure repeatability of results.
Wear marks formed at the sliding contact region on the sample surfaces, during
friction tests, were observed under an optical microscope in order to analyze and compare
degree of wear caused by sliding on the different treated tantalum surfaces.
Chapter 4
Ayesha Khalid 21
4. RESULTS AND DISCUSSION
4.1. Surface Imaging (Optical Microscopy)
After the Ta samples were prepared, their surfaces were analyzed under an
optical microscope (LEICA DM4000) . Images of the Ta surfaces, captured by the camera
connected to the microscope (LEICA MC120 HD) are shown in Figure 4.1.
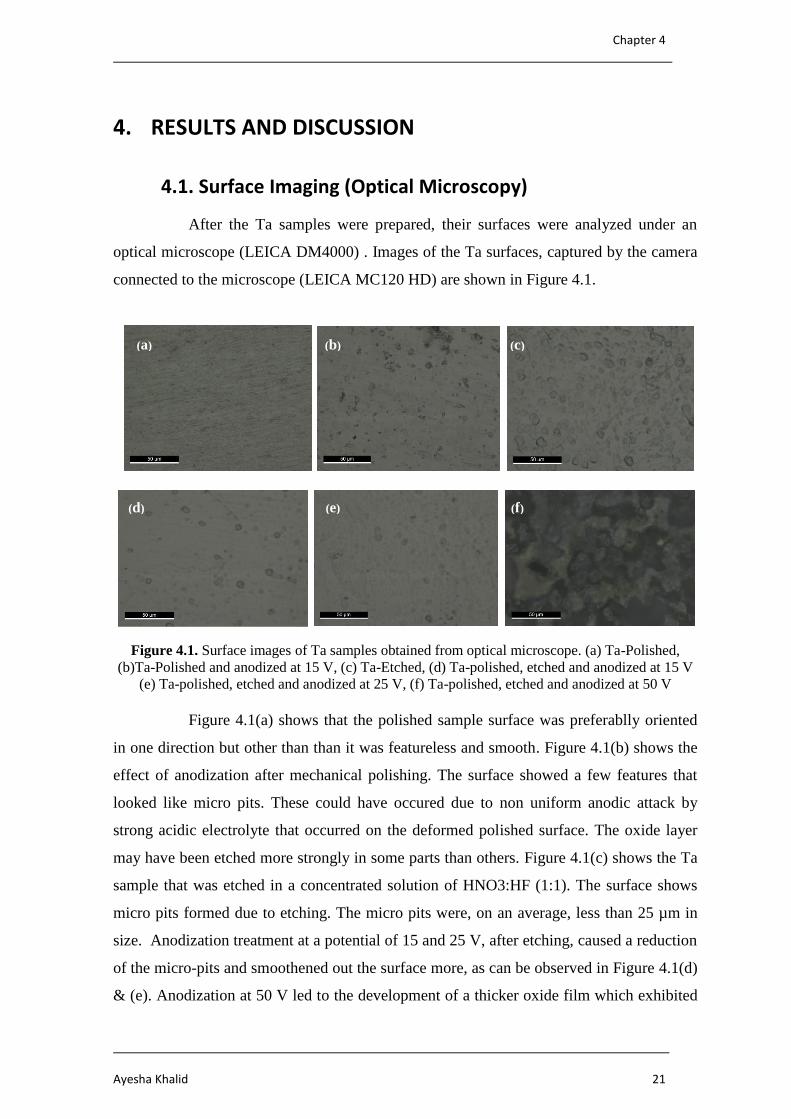
Figure 4.1. Surface images of Ta samples obtained from optical microscope. (a) Ta-Polished,
(b)Ta-Polished and anodized at 15 V, (c) Ta-Etched, (d) Ta-polished, etched and anodized at 15 V
(e) Ta-polished, etched and anodized at 25 V, (f) Ta-polished, etched and anodized at 50 V
Figure 4.1(a) shows that the polished sample surface was preferablly oriented
in one direction but other than than it was featureless and smooth. Figure 4.1(b) shows the
effect of anodization after mechanical polishing. The surface showed a few features that
looked like micro pits. These could have occured due to non uniform anodic attack by
strong acidic electrolyte that occurred on the deformed polished surface. The oxide layer
may have been etched more strongly in some parts than others. Figure 4.1(c) shows the Ta
sample that was etched in a concentrated solution of HNO3:HF (1:1). The surface shows
micro pits formed due to etching. The micro pits were, on an average, less than 25 µm in
size. Anodization treatment at a potential of 15 and 25 V, after etching, caused a reduction
of the micro-pits and smoothened out the surface more, as can be observed in Figure 4.1(d)
& (e). Anodization at 50 V led to the development of a thicker oxide film which exhibited
(a) (b) (c)
(e) (d) (f)
Tribological Behavior of micro/nano structured tantalum surfaces by anodization method
22 2016
the characteristic grey-ish coloring (Figure 4.1 (f)) that usually develops when Ta2O5 is
formed at 50 V [56].
Surface morphology was examined at higher magnifications to obtain nano
features, using SEM. The results are presented in Chapter 4.2.
4.2. Surface Morphology
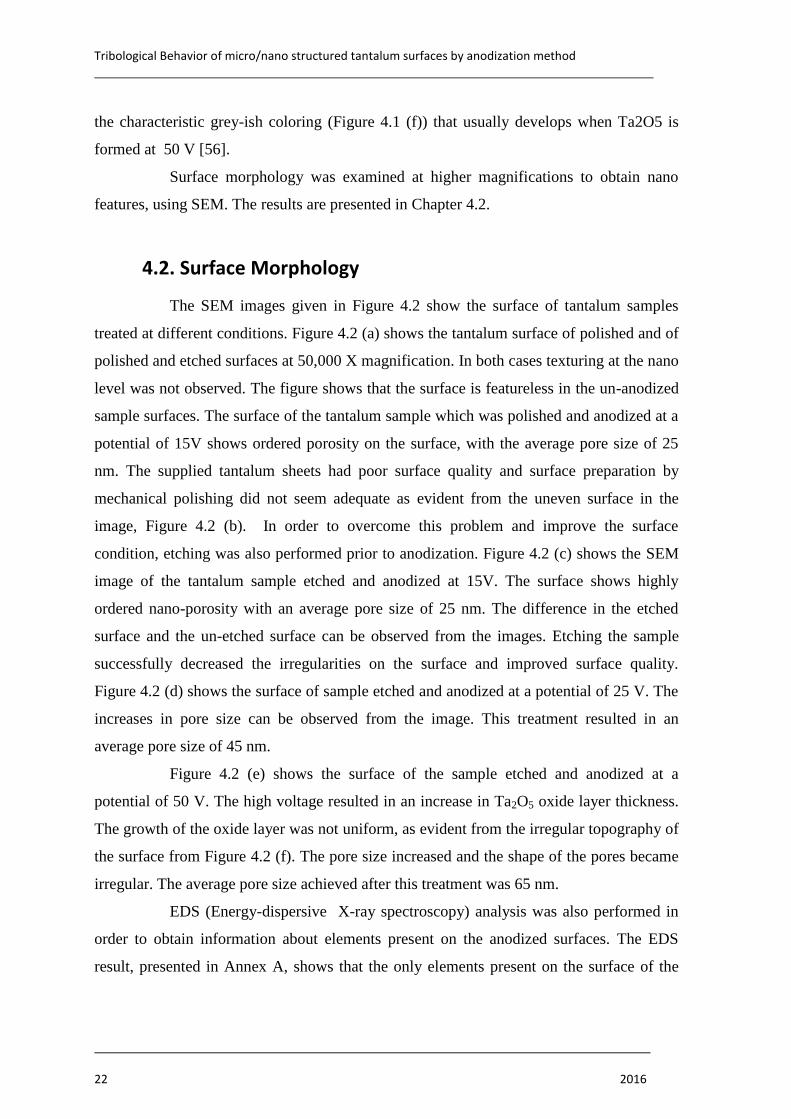
The SEM images given in Figure 4.2 show the surface of tantalum samples
treated at different conditions. Figure 4.2 (a) shows the tantalum surface of polished and of
polished and etched surfaces at 50,000 X magnification. In both cases texturing at the nano
level was not observed. The figure shows that the surface is featureless in the un-anodized
sample surfaces. The surface of the tantalum sample which was polished and anodized at a
potential of 15V shows ordered porosity on the surface, with the average pore size of 25
nm. The supplied tantalum sheets had poor surface quality and surface preparation by
mechanical polishing did not seem adequate as evident from the uneven surface in the
image, Figure 4.2 (b). In order to overcome this problem and improve the surface
condition, etching was also performed prior to anodization. Figure 4.2 (c) shows the SEM
image of the tantalum sample etched and anodized at 15V. The surface shows highly
ordered nano-porosity with an average pore size of 25 nm. The difference in the etched
surface and the un-etched surface can be observed from the images. Etching the sample
successfully decreased the irregularities on the surface and improved surface quality.
Figure 4.2 (d) shows the surface of sample etched and anodized at a potential of 25 V. The
increases in pore size can be observed from the image. This treatment resulted in an
average pore size of 45 nm.
Figure 4.2 (e) shows the surface of the sample etched and anodized at a
potential of 50 V. The high voltage resulted in an increase in Ta2O5 oxide layer thickness.
The growth of the oxide layer was not uniform, as evident from the irregular topography of
the surface from Figure 4.2 (f). The pore size increased and the shape of the pores became
irregular. The average pore size achieved after this treatment was 65 nm.
EDS (Energy-dispersive X-ray spectroscopy) analysis was also performed in
order to obtain information about elements present on the anodized surfaces. The EDS
result, presented in Annex A, shows that the only elements present on the surface of the
Chapter 4
Ayesha Khalid 23
anodized samples were tantalum and oxygen. SEM images obtained at magnification of
200000X are given in Annex B.
Figure 4.2. SEM images (50000X magnification) of Ta surfaces treated at different conditions (a)
polished and etched (b) Polished and anodized at 15 V (c) Polished, etched and anodized at 15 V
(d) Polished, etched and anodized at 25 V (e) Polished, etched and anodized at 50 V
4.3. Crystal Structure
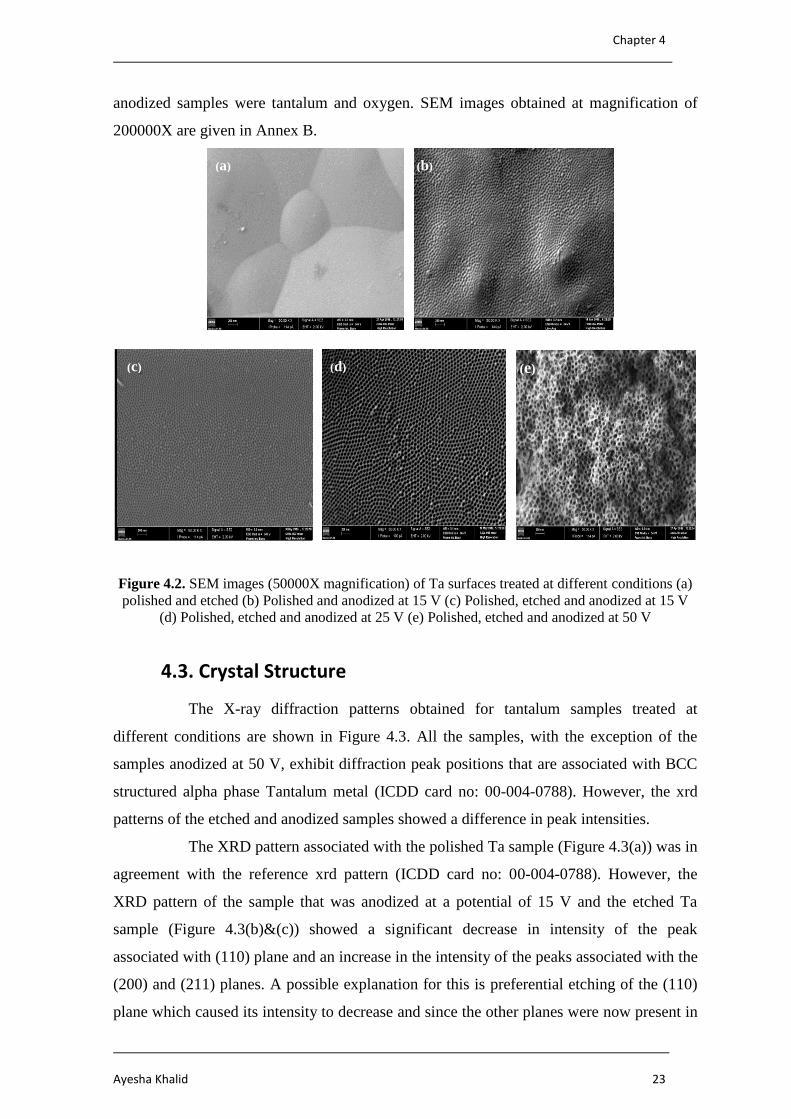
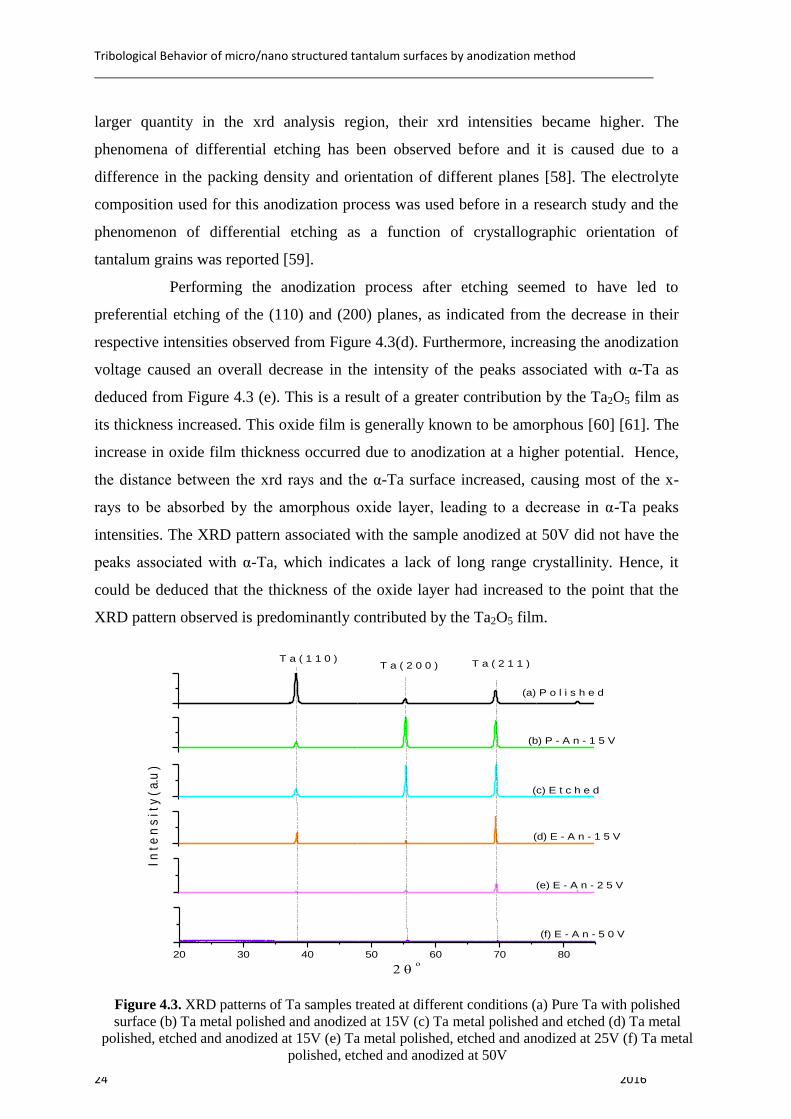
The X-ray diffraction patterns obtained for tantalum samples treated at
different conditions are shown in Figure 4.3. All the samples, with the exception of the
samples anodized at 50 V, exhibit diffraction peak positions that are associated with BCC
structured alpha phase Tantalum metal (ICDD card no: 00-004-0788). However, the xrd
patterns of the etched and anodized samples showed a difference in peak intensities.
The XRD pattern associated with the polished Ta sample (Figure 4.3(a)) was in
agreement with the reference xrd pattern (ICDD card no: 00-004-0788). However, the
XRD pattern of the sample that was anodized at a potential of 15 V and the etched Ta
sample (Figure 4.3(b)&(c)) showed a significant decrease in intensity of the peak
associated with (110) plane and an increase in the intensity of the peaks associated with the
(200) and (211) planes. A possible explanation for this is preferential etching of the (110)
plane which caused its intensity to decrease and since the other planes were now present in
(a) (b)
(c) (d) (e)
Tribological Behavior of micro/nano structured tantalum surfaces by anodization method
24 2016
larger quantity in the xrd analysis region, their xrd intensities became higher. The
phenomena of differential etching has been observed before and it is caused due to a
difference in the packing density and orientation of different planes [58]. The electrolyte
composition used for this anodization process was used before in a research study and the
phenomenon of differential etching as a function of crystallographic orientation of
tantalum grains was reported [59].
Performing the anodization process after etching seemed to have led to
preferential etching of the (110) and (200) planes, as indicated from the decrease in their
respective intensities observed from Figure 4.3(d). Furthermore, increasing the anodization
voltage caused an overall decrease in the intensity of the peaks associated with α-Ta as
deduced from Figure 4.3 (e). This is a result of a greater contribution by the Ta2O5 film as
its thickness increased. This oxide film is generally known to be amorphous [60] [61]. The
increase in oxide film thickness occurred due to anodization at a higher potential. Hence,
the distance between the xrd rays and the α-Ta surface increased, causing most of the x-
rays to be absorbed by the amorphous oxide layer, leading to a decrease in α-Ta peaks
intensities. The XRD pattern associated with the sample anodized at 50V did not have the
peaks associated with α-Ta, which indicates a lack of long range crystallinity. Hence, it
could be deduced that the thickness of the oxide layer had increased to the point that the
XRD pattern observed is predominantly contributed by the Ta2O5 film.
20 30 40 50 60 70 80
(a) P o l i s h e d
(b) P - A n - 1 5 V
(c) E t c h e d
I n t
e n
s i t
y (
a.u
)
(d) E - A n - 1 5 V
(e) E - A n - 2 5 V
T a ( 1 1 0 )T a ( 2 0 0 ) T a ( 2 1 1 )
(f) E - A n - 5 0 V
Figure 4.3. XRD patterns of Ta samples treated at different conditions (a) Pure Ta with polished
surface (b) Ta metal polished and anodized at 15V (c) Ta metal polished and etched (d) Ta metal
polished, etched and anodized at 15V (e) Ta metal polished, etched and anodized at 25V (f) Ta metal
polished, etched and anodized at 50V
Chapter 4
Ayesha Khalid 25
4.4. Hardness
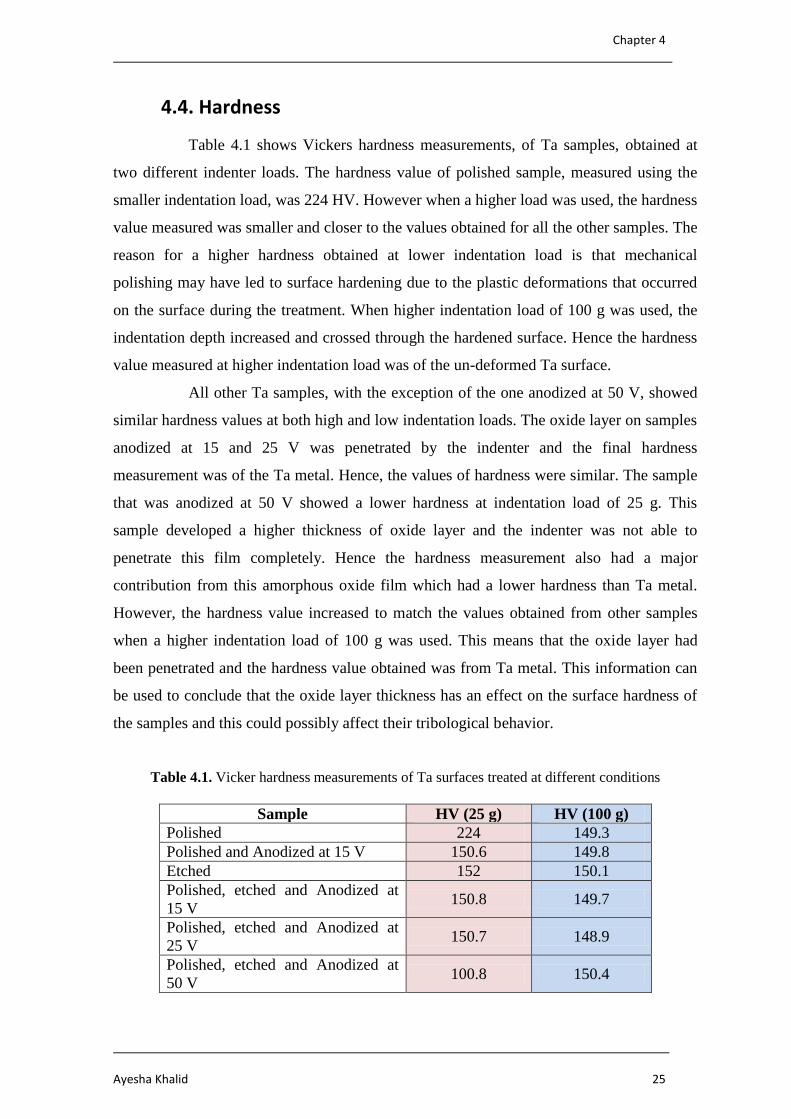
Table 4.1 shows Vickers hardness measurements, of Ta samples, obtained at
two different indenter loads. The hardness value of polished sample, measured using the
smaller indentation load, was 224 HV. However when a higher load was used, the hardness
value measured was smaller and closer to the values obtained for all the other samples. The
reason for a higher hardness obtained at lower indentation load is that mechanical
polishing may have led to surface hardening due to the plastic deformations that occurred
on the surface during the treatment. When higher indentation load of 100 g was used, the
indentation depth increased and crossed through the hardened surface. Hence the hardness
value measured at higher indentation load was of the un-deformed Ta surface.
All other Ta samples, with the exception of the one anodized at 50 V, showed
similar hardness values at both high and low indentation loads. The oxide layer on samples
anodized at 15 and 25 V was penetrated by the indenter and the final hardness
measurement was of the Ta metal. Hence, the values of hardness were similar. The sample
that was anodized at 50 V showed a lower hardness at indentation load of 25 g. This
sample developed a higher thickness of oxide layer and the indenter was not able to
penetrate this film completely. Hence the hardness measurement also had a major
contribution from this amorphous oxide film which had a lower hardness than Ta metal.
However, the hardness value increased to match the values obtained from other samples
when a higher indentation load of 100 g was used. This means that the oxide layer had
been penetrated and the hardness value obtained was from Ta metal. This information can
be used to conclude that the oxide layer thickness has an effect on the surface hardness of
the samples and this could possibly affect their tribological behavior.
Table 4.1. Vicker hardness measurements of Ta surfaces treated at different conditions
Sample HV (25 g) HV (100 g)
Polished 224 149.3
Polished and Anodized at 15 V 150.6 149.8
Etched 152 150.1
Polished, etched and Anodized at
15 V 150.8 149.7
Polished, etched and Anodized at
25 V 150.7 148.9
Polished, etched and Anodized at
50 V 100.8 150.4

Tribological Behavior of micro/nano structured tantalum surfaces by anodization method
26 2016
4.5. Wetting behavior
Wetting contact angle measurements on Ta surfaces were made by using
artificial saliva as wetting fluid. Table 4.2 shows the average contact angle measurements
obtained for the samples. The measurements were very similar to each other with very
small deviations. It could be deduced that the nano texturing had not caused a significant
change in the wettability of Ta surfaces when saliva was used as liquid.
However possible experimentation could be performed in the future, to test the
time dependent wettability of the nano textured surfaces.
Table 4.2. Wetting contact angle measurements of Ta samples with artificial saliva as wetting fluid
Sample Wetting Contact angle (art. saliva)
Polished 80.3
Polished and Anodized at 15 V 83.4
Etched 83.9
Polished, etched and Anodized at 15 V 80.8
Polished, etched and Anodized at 25 V 80.6
Polished, etched and Anodized at 50 V 83.7
4.6. Surface Roughness
The results of 3-D profilometry performed on Ta samples treated at different
conditions are presented in Table 4.3. Roughness results were obtained in both dry
conditions and after immersion in saliva.
4.6.1. Surface roughness in dry condition
The polished untreated sample had the lowest surface roughness compared to
the other samples, which was expected since its surface had not undergone any surface
texturing treatment. The Rz surface roughness values for this sample were very small as
can be seen from Table 4.3. The Ta sample that was anodized after polishing, without
etching treatment, had a higher surface roughness than the polished sample. Even though
no etching treatment had been performed on the surface, the anodization process itself
could be called an electrochemical etching process. Mechanical polishing is achieved by
plastic deformation which changes the crystal structure on the surface more or less
intensively by disturbing the orientation. The quality of surface is poorer compared to a
chemically polished surface. Anodization is sensitive to the nature of the surface. The
Chapter 4
Ayesha Khalid 27
uneven polished layers are etched off more easily than the undisturbed structure beneath
them. This uneven etching results in an increase in surface roughness. The increase in Rz
value indicated that this surface had more peaks and valleys than the polished sample.
However, this electrochemical treatment seemed to be less aggressive than chemical
etching, as indicated from the Rz value of this sample, which were smaller compared to the
chemically etched sample.
The chemically etched Ta sample had a significantly higher surface roughness
compared to the polished surface and polished & anodized surface. Etching in a strong acid
solution of nitric acid and hydrofluoric acid resulted in micro pitting on the surface and
consequently, in an increase in surface roughness.
The samples that were polished, etched and anodized at 15 V had a higher
surface roughness than the polished and anodized sample at the same potential. The acid
etching treatment improved the quality of the surface by removing scratches and
irregularities. But it introduced micropits on the surface and anodization treatment at a low
voltage of 15 V did not significantly affect the micro scale surface roughness of the etched
sample. However, at higher anodization potentials smaller Rz value was obtained, of
samples anodized at 25. This could be due to the increase in the intensity of
electrochemical attack which would have an increased smoothening effect and lead to a
decrease in surface roughness. An abnormally small Rz value was obtained at 50 V.
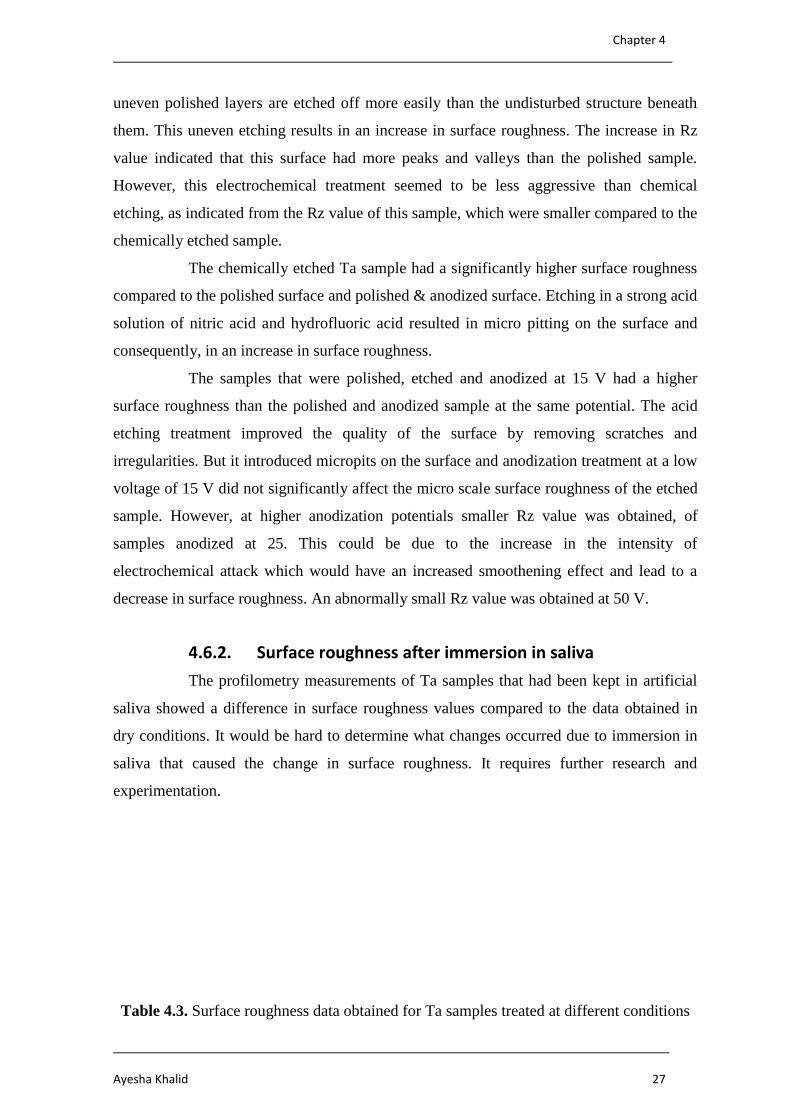
4.6.2. Surface roughness after immersion in saliva
The profilometry measurements of Ta samples that had been kept in artificial
saliva showed a difference in surface roughness values compared to the data obtained in
dry conditions. It would be hard to determine what changes occurred due to immersion in
saliva that caused the change in surface roughness. It requires further research and
experimentation.
Table 4.3. Surface roughness data obtained for Ta samples treated at different conditions
Tribological Behavior of micro/nano structured tantalum surfaces by anodization method
28 2016
Surface Treatment of Ta sample
Dry
condition
Wet
condition
Rz (µm) Rz (µm)
Polished 0.75 0.68
Polished and anodized at 15V 7.22 5.26
Etched in acid solution 8.82 7.88
Polished, etched and anodized at 15V 9.71 10.54
Polished, etched and anodized at 25V 4.37 4.91
Polished, etched and anodized at 50V 3.34 8.76
4.7. Friction Behavior
The resulting force vs displacement plots obtained from the friction tests
performed on the tantalum samples are displayed in Figure 4.4. The figure presents a
graphic view of how the Ta surfaces behaved during the friction test.
0.0 0.2 0.4 0.6 0.8 1.0 1.2
0
20
40
60
80
100
120
140
0.0 0.2 0.4 0.6 0.8 1.0 1.2
0
20
40
60
80
100
120
140
0.0 0.2 0.4 0.6 0.8 1.0 1.2
0
20
40
60
80
100
120
140
0.0 0.2 0.4 0.6 0.8 1.0 1.2
0
20
40
60
80
100
120
140
0.0 0.2 0.4 0.6 0.8 1.0 1.2
0
20
40
60
80
100
120
140
0.0 0.2 0.4 0.6 0.8 1.0 1.2
0
20
40
60
80
100
120
140
Load
(N
)
Extension (mm)
(a) Polished
Load
(N
)
Extension (mm)
(c) P-An(15V)
Load
(N
)
Extension (mm)
(b) Etched
Load
(N
)
Extension (mm)
(d) P-E-An(15V)
Load
(N
)
Extension (mm)
(e) P-E-An(25V)
Load
(N
)
Extension (mm)
(f) P-E-An(50V)
Figure 4.4. Force vs. Displacement graphs resulted from friction tests of Ta surfaces (in contact
with glass fiber epoxy composite). (a) Ta polished (b) Ta polished and etched (c) Ta polished and
anodized at 15 V (d) Ta polished, etched and anodized at 15 V (e) Ta polished, etched and
anodized at 25 V (f) Ta polished, etched and anodized at 50 V
All the plots, with the exception of the one for polished Ta, exhibited the
characteristics of a typical static friction plot. The maximum static friction force, as well as
the decrease in force to a constant steady state, could clearly be observed on the plots.
During the friction test the Ta sample was in contact with artificial bone material on both
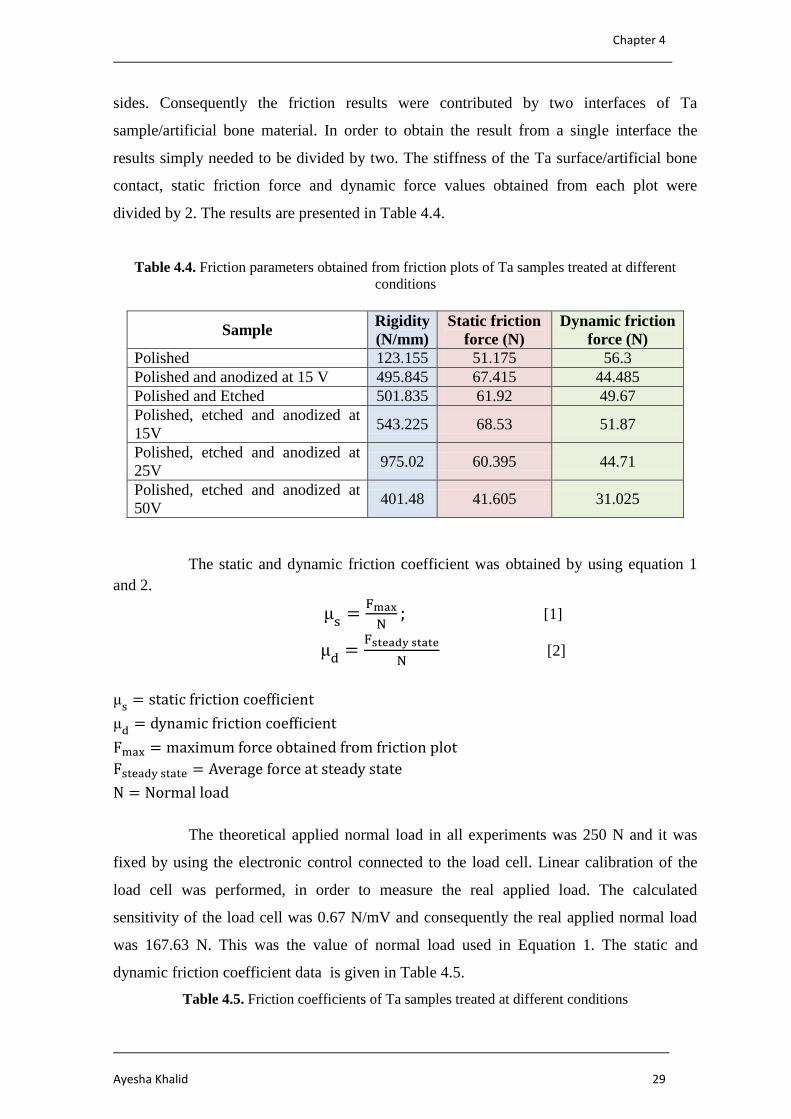
Chapter 4
Ayesha Khalid 29
sides. Consequently the friction results were contributed by two interfaces of Ta
sample/artificial bone material. In order to obtain the result from a single interface the
results simply needed to be divided by two. The stiffness of the Ta surface/artificial bone
contact, static friction force and dynamic force values obtained from each plot were
divided by 2. The results are presented in Table 4.4.
Table 4.4. Friction parameters obtained from friction plots of Ta samples treated at different
conditions
Sample Rigidity
(N/mm)
Static friction
force (N)
Dynamic friction
force (N)
Polished 123.155 51.175 56.3
Polished and anodized at 15 V 495.845 67.415 44.485
Polished and Etched 501.835 61.92 49.67
Polished, etched and anodized at
15V 543.225 68.53 51.87
Polished, etched and anodized at
25V 975.02 60.395 44.71
Polished, etched and anodized at
50V 401.48 41.605 31.025
The static and dynamic friction coefficient was obtained by using equation 1
and 2.
[1]
[2]
The theoretical applied normal load in all experiments was 250 N and it was
fixed by using the electronic control connected to the load cell. Linear calibration of the
load cell was performed, in order to measure the real applied load. The calculated
sensitivity of the load cell was 0.67 N/mV and consequently the real applied normal load
was 167.63 N. This was the value of normal load used in Equation 1. The static and
dynamic friction coefficient data is given in Table 4.5.
Table 4.5. Friction coefficients of Ta samples treated at different conditions
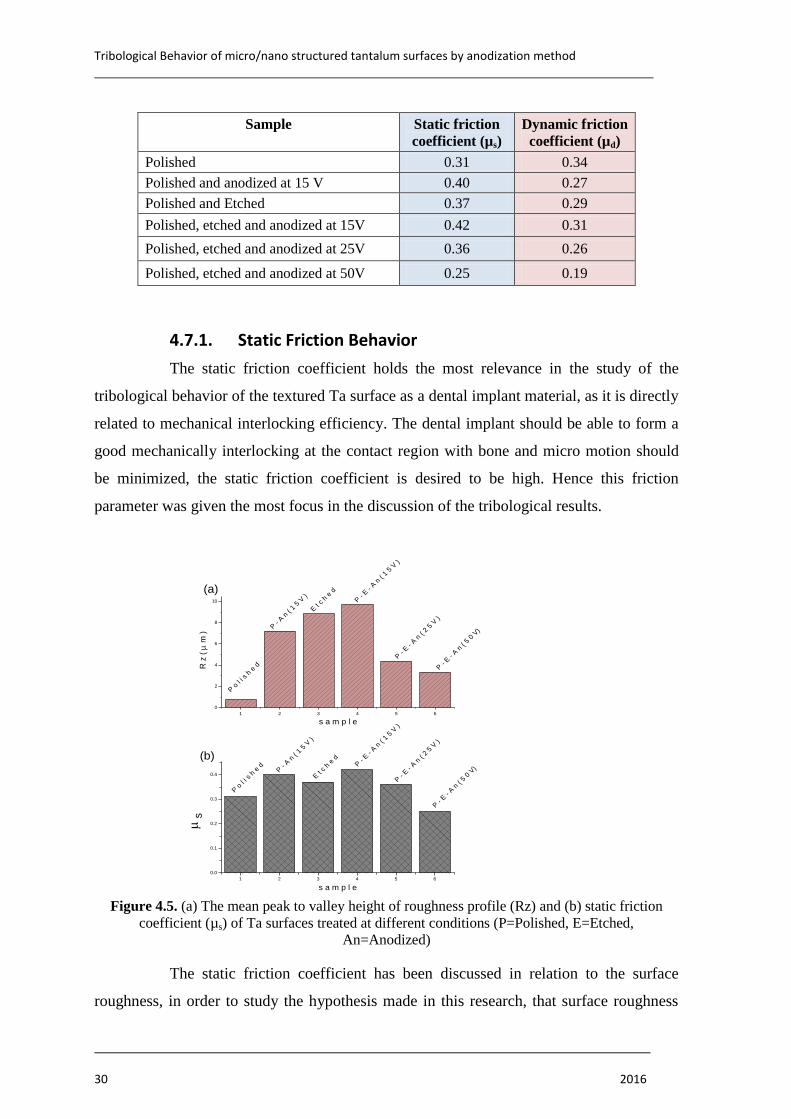
Tribological Behavior of micro/nano structured tantalum surfaces by anodization method
30 2016
Sample
Static friction
coefficient (µs)
Dynamic friction
coefficient (µd)
Polished 0.31 0.34
Polished and anodized at 15 V 0.40 0.27
Polished and Etched 0.37 0.29
Polished, etched and anodized at 15V 0.42 0.31
Polished, etched and anodized at 25V 0.36 0.26
Polished, etched and anodized at 50V 0.25 0.19
4.7.1. Static Friction Behavior
The static friction coefficient holds the most relevance in the study of the
tribological behavior of the textured Ta surface as a dental implant material, as it is directly
related to mechanical interlocking efficiency. The dental implant should be able to form a
good mechanically interlocking at the contact region with bone and micro motion should
be minimized, the static friction coefficient is desired to be high. Hence this friction
parameter was given the most focus in the discussion of the tribological results.
1 2 3 4 5 6
0
2
4
6
8
10
P o l
i s h
e d
P - E -
A n (
1 5
V )
E t c
h e
d
P - E -
A n (
5 0
V)
P - E -
A n (
2 5
V )
P - E -
A n (
1 5
V )
E t c
h e
d
R z
(m
)
s a m p l e
P - A n
( 1
5 V )
1 2 3 4 5 6
0.0
0.1
0.2
0.3
0.4
P o l
i s h
e d
(b)
P - E -
A n (
5 0
V)
P - E -
A n (
2 5
V )
P - A n
( 1
5 V )
s
s a m p l e
(a)
Figure 4.5. (a) The mean peak to valley height of roughness profile (Rz) and (b) static friction
coefficient (µs) of Ta surfaces treated at different conditions (P=Polished, E=Etched,
An=Anodized)
The static friction coefficient has been discussed in relation to the surface
roughness, in order to study the hypothesis made in this research, that surface roughness
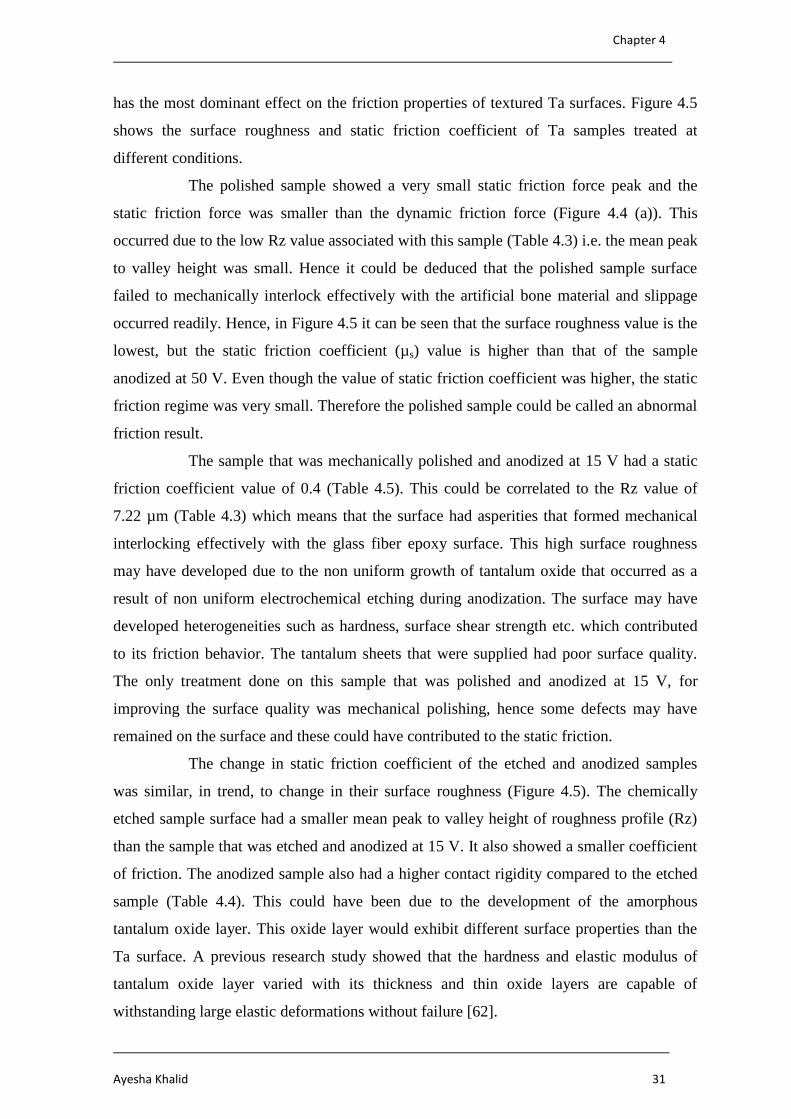
Chapter 4
Ayesha Khalid 31
has the most dominant effect on the friction properties of textured Ta surfaces. Figure 4.5
shows the surface roughness and static friction coefficient of Ta samples treated at
different conditions.
The polished sample showed a very small static friction force peak and the
static friction force was smaller than the dynamic friction force (Figure 4.4 (a)). This
occurred due to the low Rz value associated with this sample (Table 4.3) i.e. the mean peak
to valley height was small. Hence it could be deduced that the polished sample surface
failed to mechanically interlock effectively with the artificial bone material and slippage
occurred readily. Hence, in Figure 4.5 it can be seen that the surface roughness value is the
lowest, but the static friction coefficient (µs) value is higher than that of the sample
anodized at 50 V. Even though the value of static friction coefficient was higher, the static
friction regime was very small. Therefore the polished sample could be called an abnormal
friction result.
The sample that was mechanically polished and anodized at 15 V had a static
friction coefficient value of 0.4 (Table 4.5). This could be correlated to the Rz value of
7.22 µm (Table 4.3) which means that the surface had asperities that formed mechanical
interlocking effectively with the glass fiber epoxy surface. This high surface roughness
may have developed due to the non uniform growth of tantalum oxide that occurred as a
result of non uniform electrochemical etching during anodization. The surface may have
developed heterogeneities such as hardness, surface shear strength etc. which contributed
to its friction behavior. The tantalum sheets that were supplied had poor surface quality.
The only treatment done on this sample that was polished and anodized at 15 V, for
improving the surface quality was mechanical polishing, hence some defects may have
remained on the surface and these could have contributed to the static friction.
The change in static friction coefficient of the etched and anodized samples
was similar, in trend, to change in their surface roughness (Figure 4.5). The chemically
etched sample surface had a smaller mean peak to valley height of roughness profile (Rz)
than the sample that was etched and anodized at 15 V. It also showed a smaller coefficient
of friction. The anodized sample also had a higher contact rigidity compared to the etched
sample (Table 4.4). This could have been due to the development of the amorphous
tantalum oxide layer. This oxide layer would exhibit different surface properties than the
Ta surface. A previous research study showed that the hardness and elastic modulus of
tantalum oxide layer varied with its thickness and thin oxide layers are capable of
withstanding large elastic deformations without failure [62].
Tribological Behavior of micro/nano structured tantalum surfaces by anodization method
32 2016
The sample anodized at 25 V showed even higher rigidity. Anodization at 25 V
resulted in a greater film thickness and the amorphous film showed greater elasticity at the
contact region. Hence it could be deduced that the oxide film thickness of this sample was
within the limit of high elasticity defined in the research work mentioned in the previous
paragraph [62]. However, it showed a lower static friction coefficient than the etched
sample and the sample anodized at a lower potential of 15 V. This decrease in the static
friction was attributed to the low surface roughness of this sample. The Rz value of this
sample was significantly smaller compared to the etched and the anodized samples; hence
it may have formed poorer mechanical interlocking. Despite the significant difference in
the surface roughness, the static friction of this sample was not significantly smaller than
the one anodized at 15 V or the chemically etched sample. This may have been because of
the higher rigidity at contact region caused due to the good elasticity of the film, which
hindered initiation of slippage. It has been observed that at increasing oxide film thickness
(>100 nm), this elastic behavior decreases and more plastic strain is observed [62]. From
Table 4.4, comparing the etched and anodized samples it can be seen that contact rigidity
increased i.e. the etched sample had the lowest contact rigidity, which increased for the
sample anodized at 15 V and the highest was achieved for the sample anodized at 25 V.
However, contact rigidity decreased for the sample that was anodized at 50 V. The Rz
value of this sample was also the lowest, compared to the other anodized samples.
Consequently, this sample exhibited the lowest static friction coefficient. This sample had
the highest oxide film thickness. From the SEM image in Figure 4.2 (e) it was observed
that the oxide layer was not homogenously formed. The surface was non uniform and the
pores were larger and irregular. This surface also exhibited lower hardness value. These
factors may have contributed towards the sample’s poor friction performance compared to
the other anodized samples.
The surface roughness of the different Ta sample surfaces seemed to be the
dominant factor in determining their static friction behavior. However, other contributions
such as surface adhesion and the effect of the surface properties of oxide layer were not
studied.
4.7.2. Dynamic Friction Behavior
The dynamic friction behavior represents how the sample surface would
behave when it start sliding. Although sliding of a dental implant is not desired, it is
Chapter 4
Ayesha Khalid 33
important to have knowledge about the dynamic friction behavior as it helps in
understanding the micro motion behavior of the implants and also their failure
mechanisms.
The polished sample showed the highest dynamic friction coefficient compared
to the treated samples. This could be explained in terms of the surface polishing which led
to an increase in surface flatness. This was supported by the very small Rz surface
roughness value of polished sample (Table 4.3), which indicated a very flat surface. This
led to an increase in the contact area between Ta and the glass fiber epoxy composite. A
higher sliding force was required to drag the Ta surface over the composite’s surface.
However, the contact rigidity was the smallest, compared to other samples (Table 4.4).
Despite the high dynamic friction coefficient, the absence of any effective static contact
and consequently the failure of the un-textured sample to form an effective mechanically
interlocking with artificial bone and hence resulted in small contact rigidity.
Figure 4.6 shows the comparison of static and dynamic friction coefficients of
the etched and the anodized samples. The dynamic friction coefficient was smaller than the
static friction coefficient in all cases. This is a typical friction behavior that surfaces
exhibit. In the initial stage of sliding, the surface asperities undergo deformation and wear
i.e. the running-in effect. Sliding could be described as a polishing phenomenon as it leads
to surface smoothening resulting from wear. The Ta sample surfaces were worn due to
sliding contact with glass fiber epoxy composite and the wear marks were observable with
the naked eye.
The Ta surface anodized at 15 V after mechanical polishing had a lower
dynamic friction coefficient than the surface anodized at the same potential after etch
treatment. This could be related to the quality of oxide film that formed on both surfaces.
The anodized Ta surface may have worn off more easily due to the poor adherence of the
oxide film to the metal surface. Scratch tests could provide a more detailed insight into this
argument but this would have to be left for future work due to the shortage of time.
However this argument makes sense as the wear track of this sample showed a shinier
surface than the etched sample, hence a higher degree of wear (Chapter 4.8).
The samples anodized at higher potentials had lower dynamic friction
coefficients compared to the samples anodized at 15 V. These thicker oxide layers maye
have been more easily worn away. The surface shear strength may have changed as surface
texturing occurred at higher potential. A greater intensity of electrochemical attack on the
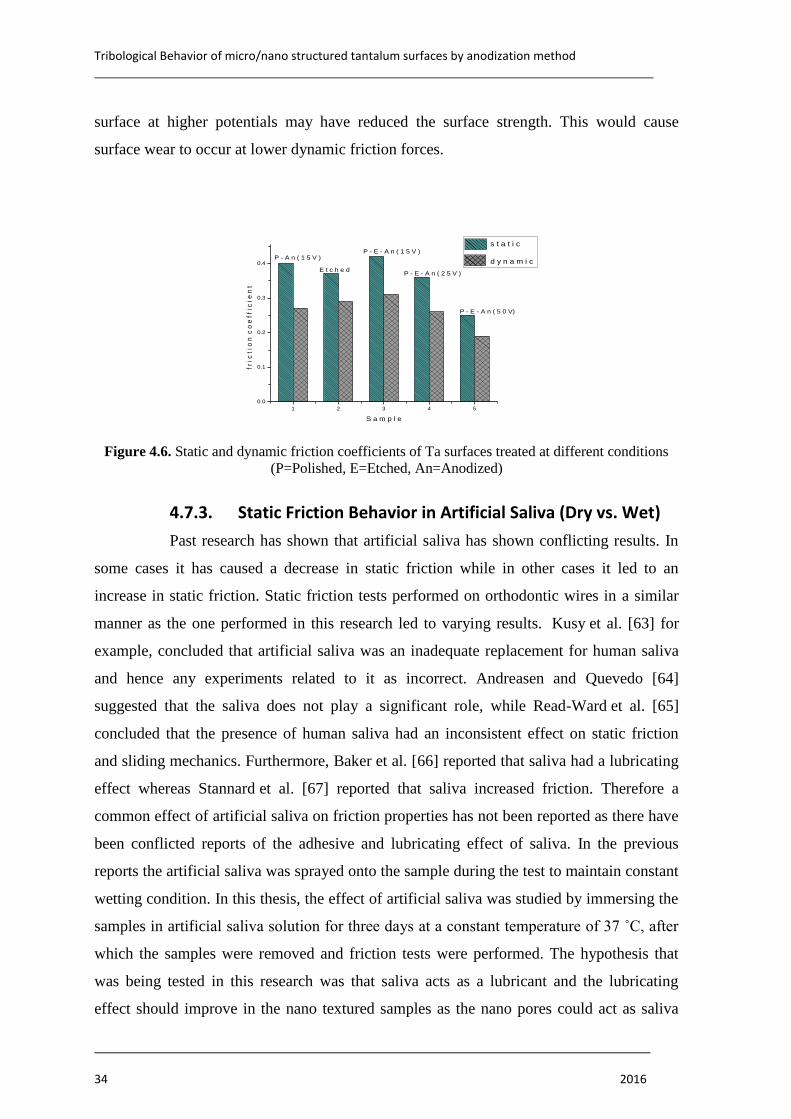
Tribological Behavior of micro/nano structured tantalum surfaces by anodization method
34 2016
surface at higher potentials may have reduced the surface strength. This would cause
surface wear to occur at lower dynamic friction forces.
1 2 3 4 5
0.0
0.1
0.2
0.3
0.4
f r
i c t
i o n
c
o e
f f
i c
i e n
t
S a m p l e
s t a t i c
d y n a m i cP - A n ( 1 5 V )
E t c h e d
P - E - A n ( 1 5 V )
P - E - A n ( 2 5 V )
P - E - A n ( 5 0 V)
Figure 4.6. Static and dynamic friction coefficients of Ta surfaces treated at different conditions
(P=Polished, E=Etched, An=Anodized)
4.7.3. Static Friction Behavior in Artificial Saliva (Dry vs. Wet)
Past research has shown that artificial saliva has shown conflicting results. In
some cases it has caused a decrease in static friction while in other cases it led to an
increase in static friction. Static friction tests performed on orthodontic wires in a similar
manner as the one performed in this research led to varying results. Kusy et al. [63] for
example, concluded that artificial saliva was an inadequate replacement for human saliva
and hence any experiments related to it as incorrect. Andreasen and Quevedo [64]
suggested that the saliva does not play a significant role, while Read-Ward et al. [65]
concluded that the presence of human saliva had an inconsistent effect on static friction
and sliding mechanics. Furthermore, Baker et al. [66] reported that saliva had a lubricating
effect whereas Stannard et al. [67] reported that saliva increased friction. Therefore a
common effect of artificial saliva on friction properties has not been reported as there have
been conflicted reports of the adhesive and lubricating effect of saliva. In the previous
reports the artificial saliva was sprayed onto the sample during the test to maintain constant
wetting condition. In this thesis, the effect of artificial saliva was studied by immersing the
samples in artificial saliva solution for three days at a constant temperature of 37 ˚C, after
which the samples were removed and friction tests were performed. The hypothesis that
was being tested in this research was that saliva acts as a lubricant and the lubricating
effect should improve in the nano textured samples as the nano pores could act as saliva
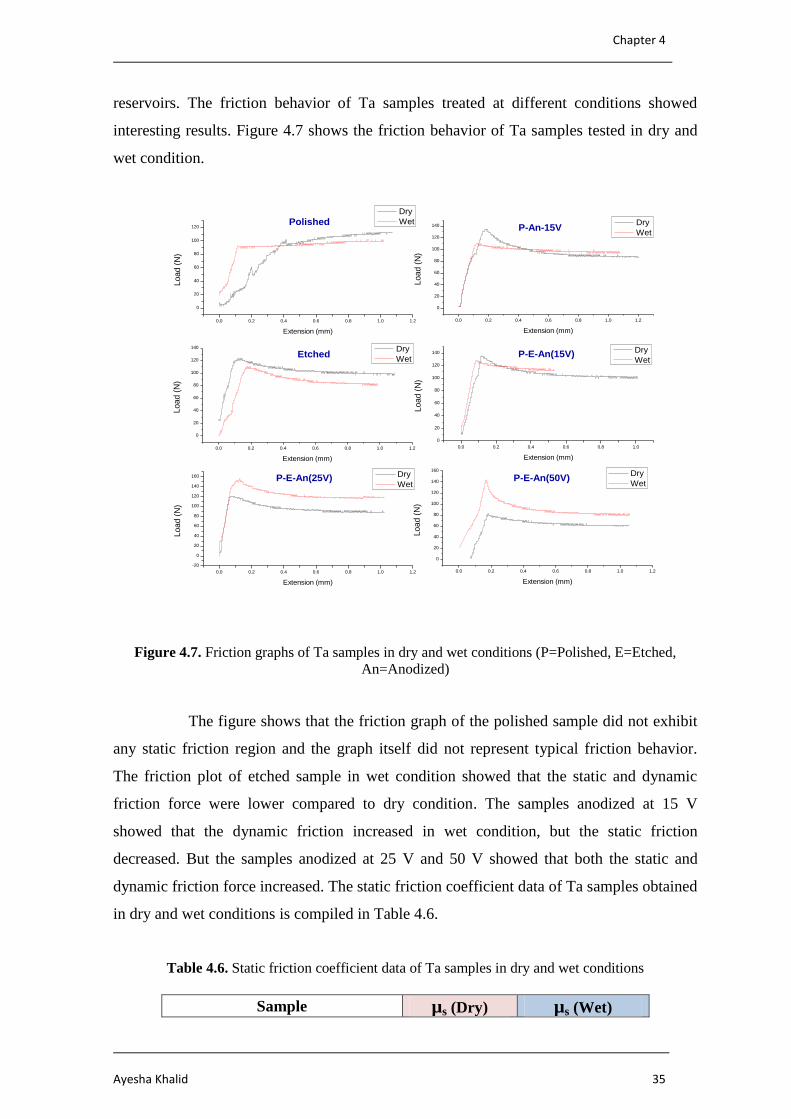
Chapter 4
Ayesha Khalid 35
reservoirs. The friction behavior of Ta samples treated at different conditions showed
interesting results. Figure 4.7 shows the friction behavior of Ta samples tested in dry and
wet condition.
0.0 0.2 0.4 0.6 0.8 1.0 1.2
0
20
40
60
80
100
120
0.0 0.2 0.4 0.6 0.8 1.0 1.2
0
20
40
60
80
100
120
140
0.0 0.2 0.4 0.6 0.8 1.0 1.2
0
20
40
60
80
100
120
140
0.0 0.2 0.4 0.6 0.8 1.0
0
20
40
60
80
100
120
140
0.0 0.2 0.4 0.6 0.8 1.0 1.2
-20
0
20
40
60
80
100
120
140
160
0.0 0.2 0.4 0.6 0.8 1.0 1.2
0
20
40
60
80
100
120
140
160
Load (
N)
Extension (mm)
Dry
WetPolished
Load (
N)
Extension (mm)
Dry
WetEtched
Load (
N)
Extension (mm)
Dry
WetP-An-15V
Load (
N)
Extension (mm)
Dry
WetP-E-An(15V)
Load (
N)
Extension (mm)
Dry
WetP-E-An(25V)
Load (
N)
Extension (mm)
Dry
WetP-E-An(50V)
Figure 4.7. Friction graphs of Ta samples in dry and wet conditions (P=Polished, E=Etched,
An=Anodized)
The figure shows that the friction graph of the polished sample did not exhibit
any static friction region and the graph itself did not represent typical friction behavior.
The friction plot of etched sample in wet condition showed that the static and dynamic
friction force were lower compared to dry condition. The samples anodized at 15 V
showed that the dynamic friction increased in wet condition, but the static friction
decreased. But the samples anodized at 25 V and 50 V showed that both the static and
dynamic friction force increased. The static friction coefficient data of Ta samples obtained
in dry and wet conditions is compiled in Table 4.6.
Table 4.6. Static friction coefficient data of Ta samples in dry and wet conditions
Sample µs (Dry) µs (Wet)
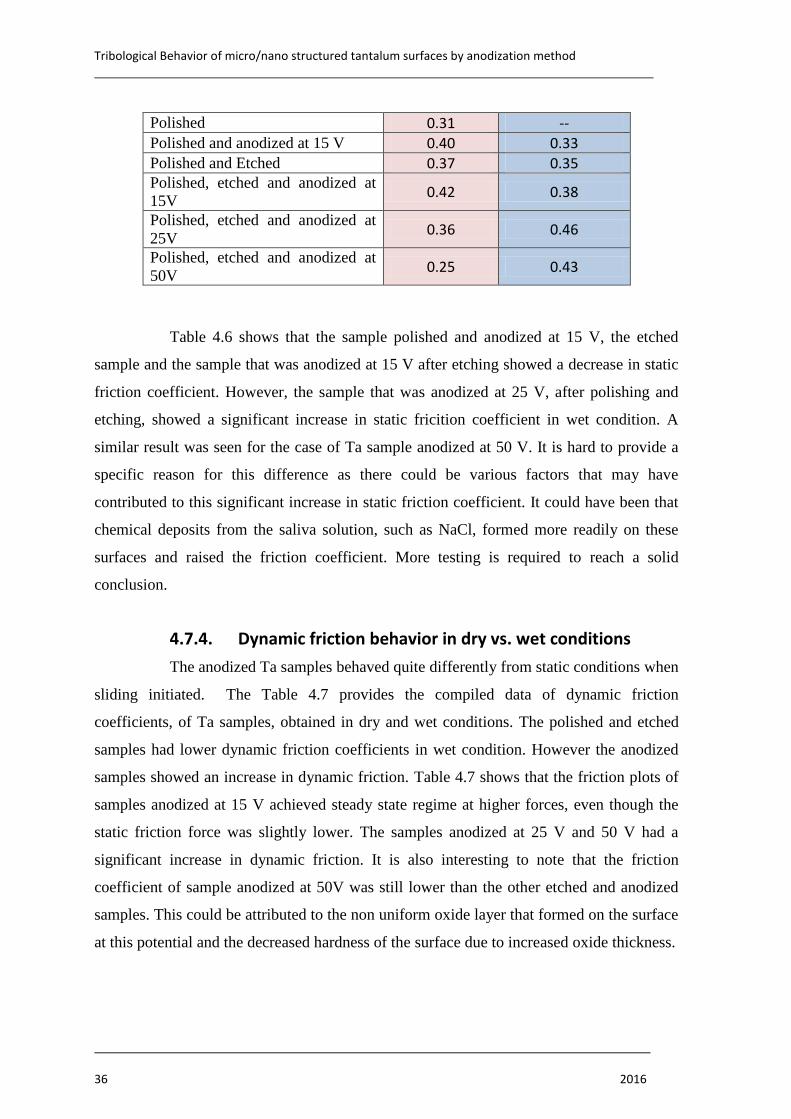
Tribological Behavior of micro/nano structured tantalum surfaces by anodization method
36 2016
Polished 0.31 -- Polished and anodized at 15 V 0.40 0.33 Polished and Etched 0.37 0.35 Polished, etched and anodized at
15V 0.42 0.38
Polished, etched and anodized at
25V 0.36 0.46
Polished, etched and anodized at
50V 0.25 0.43
Table 4.6 shows that the sample polished and anodized at 15 V, the etched
sample and the sample that was anodized at 15 V after etching showed a decrease in static
friction coefficient. However, the sample that was anodized at 25 V, after polishing and
etching, showed a significant increase in static fricition coefficient in wet condition. A
similar result was seen for the case of Ta sample anodized at 50 V. It is hard to provide a
specific reason for this difference as there could be various factors that may have
contributed to this significant increase in static friction coefficient. It could have been that
chemical deposits from the saliva solution, such as NaCl, formed more readily on these
surfaces and raised the friction coefficient. More testing is required to reach a solid
conclusion.
4.7.4. Dynamic friction behavior in dry vs. wet conditions
The anodized Ta samples behaved quite differently from static conditions when
sliding initiated. The Table 4.7 provides the compiled data of dynamic friction
coefficients, of Ta samples, obtained in dry and wet conditions. The polished and etched
samples had lower dynamic friction coefficients in wet condition. However the anodized
samples showed an increase in dynamic friction. Table 4.7 shows that the friction plots of
samples anodized at 15 V achieved steady state regime at higher forces, even though the
static friction force was slightly lower. The samples anodized at 25 V and 50 V had a
significant increase in dynamic friction. It is also interesting to note that the friction
coefficient of sample anodized at 50V was still lower than the other etched and anodized
samples. This could be attributed to the non uniform oxide layer that formed on the surface
at this potential and the decreased hardness of the surface due to increased oxide thickness.
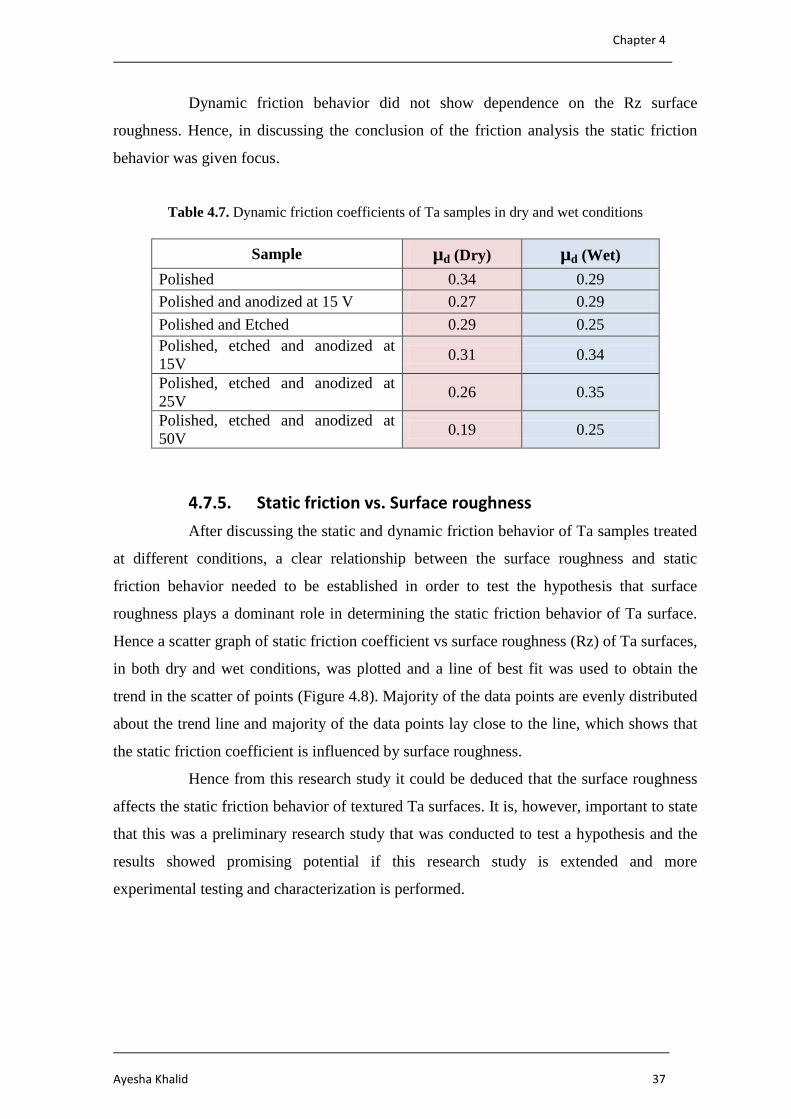
Chapter 4
Ayesha Khalid 37
Dynamic friction behavior did not show dependence on the Rz surface
roughness. Hence, in discussing the conclusion of the friction analysis the static friction
behavior was given focus.
Table 4.7. Dynamic friction coefficients of Ta samples in dry and wet conditions
Sample µd (Dry) µd (Wet)
Polished 0.34 0.29
Polished and anodized at 15 V 0.27 0.29
Polished and Etched 0.29 0.25
Polished, etched and anodized at
15V 0.31 0.34
Polished, etched and anodized at
25V 0.26 0.35
Polished, etched and anodized at
50V 0.19 0.25
4.7.5. Static friction vs. Surface roughness
After discussing the static and dynamic friction behavior of Ta samples treated
at different conditions, a clear relationship between the surface roughness and static
friction behavior needed to be established in order to test the hypothesis that surface
roughness plays a dominant role in determining the static friction behavior of Ta surface.
Hence a scatter graph of static friction coefficient vs surface roughness (Rz) of Ta surfaces,
in both dry and wet conditions, was plotted and a line of best fit was used to obtain the
trend in the scatter of points (Figure 4.8). Majority of the data points are evenly distributed
about the trend line and majority of the data points lay close to the line, which shows that
the static friction coefficient is influenced by surface roughness.
Hence from this research study it could be deduced that the surface roughness
affects the static friction behavior of textured Ta surfaces. It is, however, important to state
that this was a preliminary research study that was conducted to test a hypothesis and the
results showed promising potential if this research study is extended and more
experimental testing and characterization is performed.
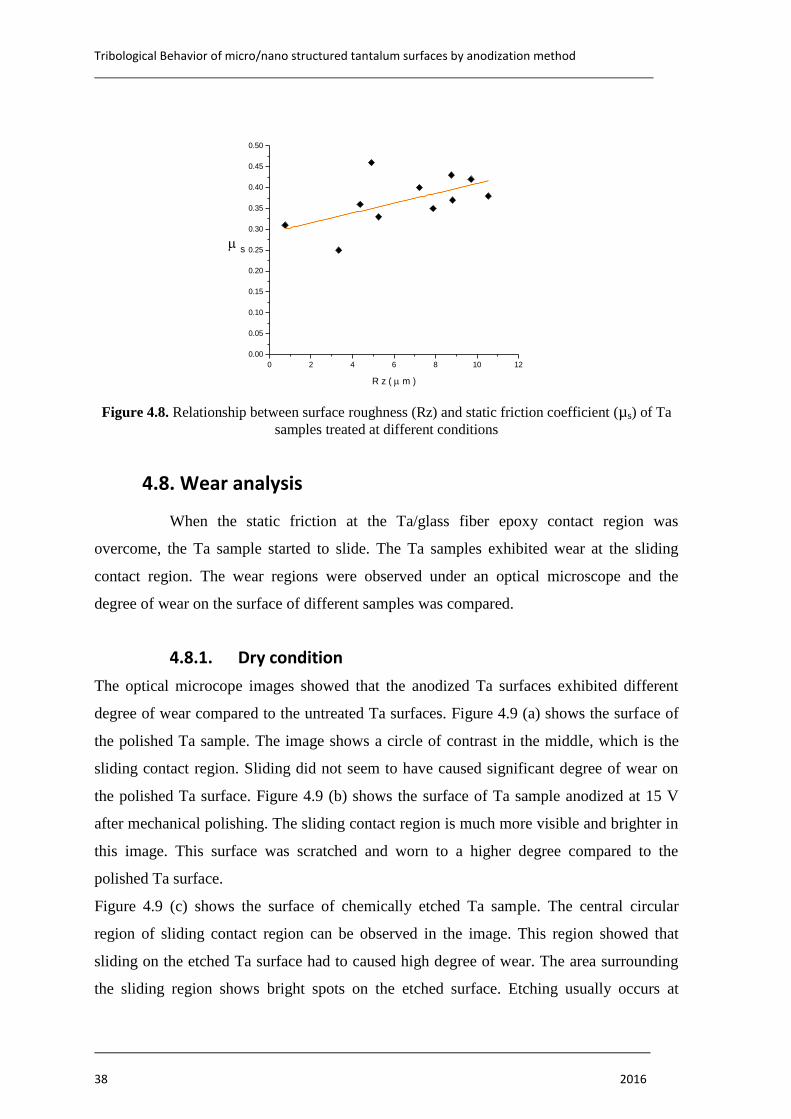
Tribological Behavior of micro/nano structured tantalum surfaces by anodization method
38 2016
Figure 4.8. Relationship between surface roughness (Rz) and static friction coefficient (µs) of Ta
samples treated at different conditions
4.8. Wear analysis
When the static friction at the Ta/glass fiber epoxy contact region was
overcome, the Ta sample started to slide. The Ta samples exhibited wear at the sliding
contact region. The wear regions were observed under an optical microscope and the
degree of wear on the surface of different samples was compared.
4.8.1. Dry condition
The optical microcope images showed that the anodized Ta surfaces exhibited different
degree of wear compared to the untreated Ta surfaces. Figure 4.9 (a) shows the surface of
the polished Ta sample. The image shows a circle of contrast in the middle, which is the
sliding contact region. Sliding did not seem to have caused significant degree of wear on
the polished Ta surface. Figure 4.9 (b) shows the surface of Ta sample anodized at 15 V
after mechanical polishing. The sliding contact region is much more visible and brighter in
this image. This surface was scratched and worn to a higher degree compared to the
polished Ta surface.
Figure 4.9 (c) shows the surface of chemically etched Ta sample. The central circular
region of sliding contact region can be observed in the image. This region showed that
sliding on the etched Ta surface had to caused high degree of wear. The area surrounding
the sliding region shows bright spots on the etched surface. Etching usually occurs at
0 2 4 6 8 10 12
0.00
0.05
0.10
0.15
0.20
0.25
0.30
0.35
0.40
0.45
0.50
s
R z ( m )
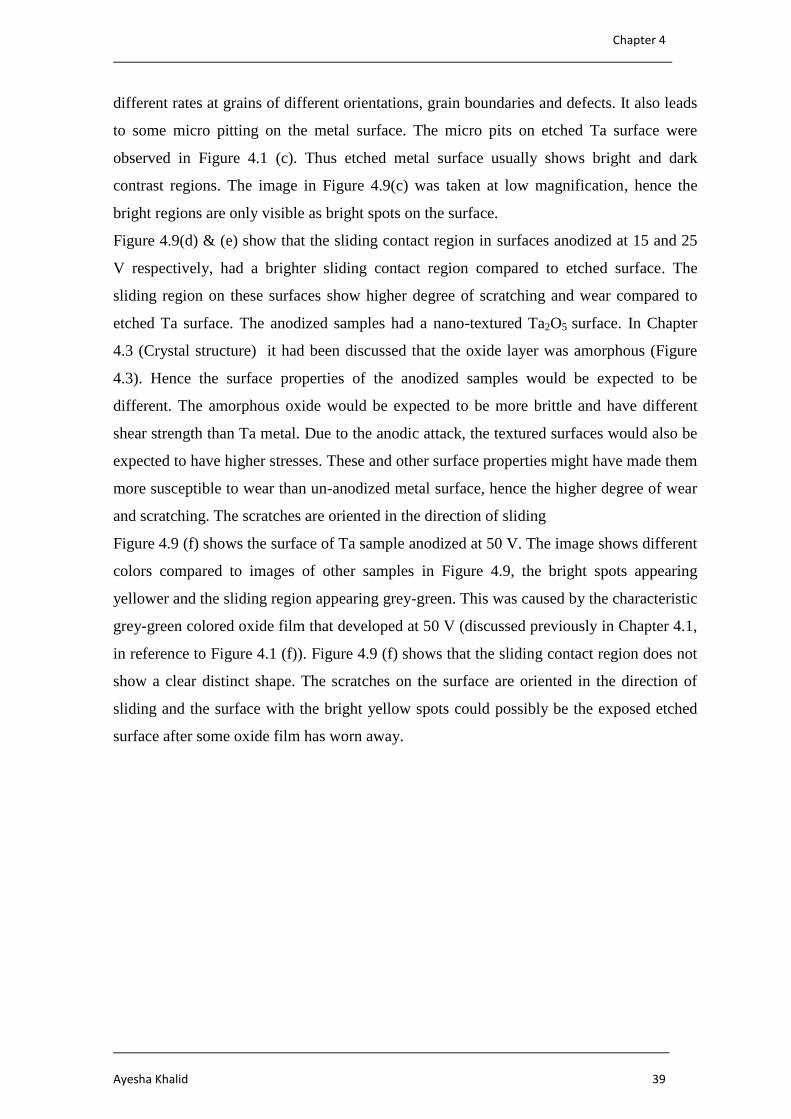
Chapter 4
Ayesha Khalid 39
different rates at grains of different orientations, grain boundaries and defects. It also leads
to some micro pitting on the metal surface. The micro pits on etched Ta surface were
observed in Figure 4.1 (c). Thus etched metal surface usually shows bright and dark
contrast regions. The image in Figure 4.9(c) was taken at low magnification, hence the
bright regions are only visible as bright spots on the surface.
Figure 4.9(d) & (e) show that the sliding contact region in surfaces anodized at 15 and 25
V respectively, had a brighter sliding contact region compared to etched surface. The
sliding region on these surfaces show higher degree of scratching and wear compared to
etched Ta surface. The anodized samples had a nano-textured Ta2O5 surface. In Chapter
4.3 (Crystal structure) it had been discussed that the oxide layer was amorphous (Figure
4.3). Hence the surface properties of the anodized samples would be expected to be
different. The amorphous oxide would be expected to be more brittle and have different
shear strength than Ta metal. Due to the anodic attack, the textured surfaces would also be
expected to have higher stresses. These and other surface properties might have made them
more susceptible to wear than un-anodized metal surface, hence the higher degree of wear
and scratching. The scratches are oriented in the direction of sliding
Figure 4.9 (f) shows the surface of Ta sample anodized at 50 V. The image shows different
colors compared to images of other samples in Figure 4.9, the bright spots appearing
yellower and the sliding region appearing grey-green. This was caused by the characteristic
grey-green colored oxide film that developed at 50 V (discussed previously in Chapter 4.1,
in reference to Figure 4.1 (f)). Figure 4.9 (f) shows that the sliding contact region does not
show a clear distinct shape. The scratches on the surface are oriented in the direction of
sliding and the surface with the bright yellow spots could possibly be the exposed etched
surface after some oxide film has worn away.

Tribological Behavior of micro/nano structured tantalum surfaces by anodization method
40 2016
Figure 4.9. Wear marks on Ta surfaces after friction test in dry conditions (a) Ta-polished (b) Ta-
polished and anodized at 15 V (c) Ta-etched (d) Ta-polished, etched and anodized at 15 V (e) Ta-
polished, etched and anodized at 25 V (f) Ta-polished, etched and anodized at 50 V
4.8.2. Wet condition
The wear marks in Figure 4.10 were formed on Ta surface that had been
immersed in artificial saliva for three days prior to friction tests. The polished and etched
sample showed low wear at sliding region (Figure 4.10 (a)&(c)), which was similar to the
observations made on these surfaces in dry conditions (Figure 4.9 (a)&(c)). Ta sample, that
was anodized after mechanical polishing, showed a bright circular sliding region. The
surface showed considerable scratching and wear.
The samples that were etched and anodized at 15 and 25 V (Figure 4.10
(d)&(e)) also showed bright sliding regions. The scratches and wear in the region was
easily observable. The sliding region on the sample anodized at 50 V (Figure 4.10 (f)) was
very visible under the microscope. The oxide layer had clearly been worn away as the
bright metal surface was exposed at the sliding region, in clear contrast to the dull grey-
green oxide surface in the surrounding regions.
The anodized surfaces in both dry and wet conditions showed a higher degree
of wear than un-anodized surfaces. The textured tantalum oxide clearly had surface
properties which made it more vunerable to surface wear than Ta metal. Anodic attack
possibly induced surface stresses. Ta samples anodized at different potentials underwent
different intensity of chemical attack by the strong electrolyte. This could affect the degree
of surface stresses induced on the oxide surface and the surface shear strength. Figure 4.10
(a) (b) (c)
(d) (e) (f)
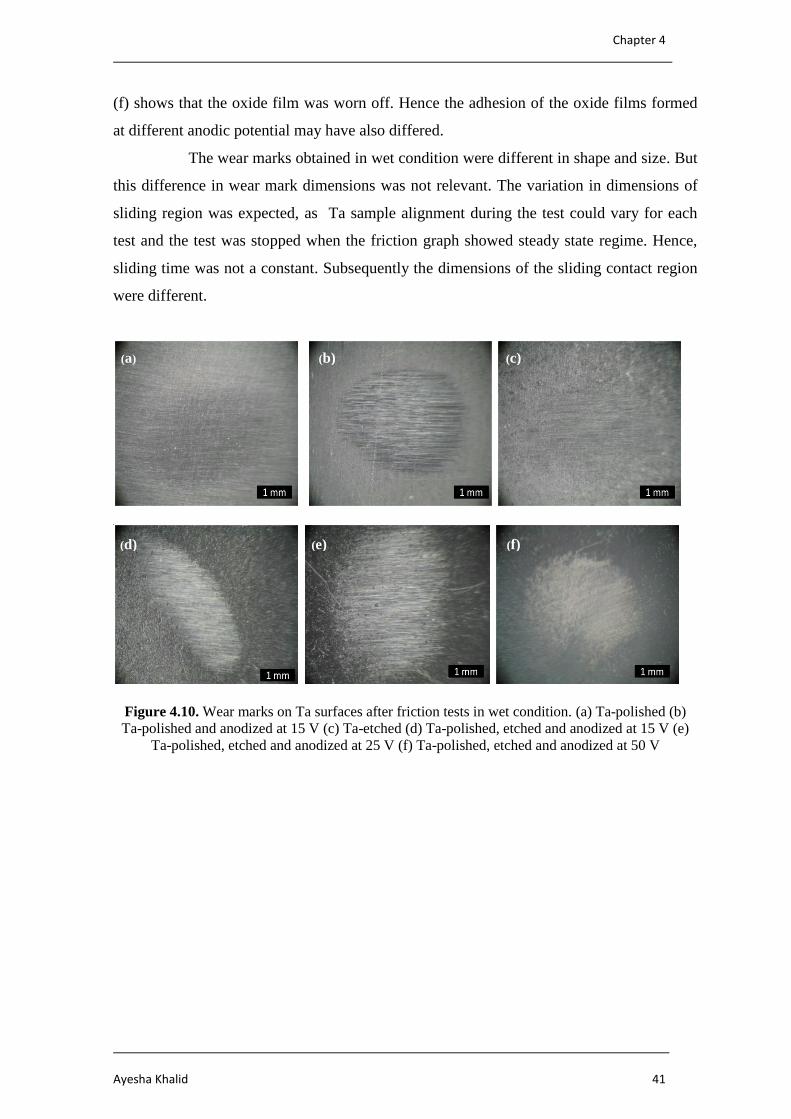
Chapter 4
Ayesha Khalid 41
(f) shows that the oxide film was worn off. Hence the adhesion of the oxide films formed
at different anodic potential may have also differed.
The wear marks obtained in wet condition were different in shape and size. But
this difference in wear mark dimensions was not relevant. The variation in dimensions of
sliding region was expected, as Ta sample alignment during the test could vary for each
test and the test was stopped when the friction graph showed steady state regime. Hence,
sliding time was not a constant. Subsequently the dimensions of the sliding contact region
were different.
Figure 4.10. Wear marks on Ta surfaces after friction tests in wet condition. (a) Ta-polished (b)
Ta-polished and anodized at 15 V (c) Ta-etched (d) Ta-polished, etched and anodized at 15 V (e)
Ta-polished, etched and anodized at 25 V (f) Ta-polished, etched and anodized at 50 V
(a) (b)
(a)
(c)
(a)
(d)
(a)
(e)
(a)
(f)
(a)
Conclusion
42 2016
CONCLUSIONS
In this thesis the tribological properties of nano textured tantalum were studied.
Anodization method was used to introduce highly ordered nano pores on tantalum surface.
Three different potentials, 15, 25 and 50 V, were used in anodization in order to obtain
three diferent pore diameters on the nano dimpled surface. Three different average pore
sizes were obtained at different potentials, SEM images showed that highly ordered nano
texturing had been achieved by the electrochemical process.
XRD patterns of the treated Ta samples showed that the tantalum oxide film
was amorphous and preferential etching had occured on the treated surfaces. The hardness
results showed that the amorphous oxide layer is softer than the metal and the hardness
tends to change with oxide thickness as effect of the metal on the overall hardness
decreases.Wetting contact angle measurements showed that there was no significant
change in the wetting behavior of treated and untreated Ta surfaces.
3-d profilometry measurements showed that anodization influenced the micro-
surface roughness (Rz).The static friction coefficient showed an almost linear dependancy
on the micro surface roughness. Dynamic friction coefficient did not show a clear
relationship to surface roughness. The anodized Ta surfaces had nano textured amorphous
oxide layer and showed a higher degree of wear than the un-anodized Ta surfaces.
It can be concluded that nano texturing by anodization treatment caused the
surface roughness to change on the micron level. The surface roughness was a major
contributor to the static friction behavior of the untreated and treated Ta surfaces. Hence,
when deciding the optimum nano texture, by anodization, for biological performane of Ta
dental implant it is also important to assess its friction behavior, as it plays an important
role in defining the performance of the dental implant when it is inserted into the jaw and
brought into contact with bone.

Future work
Ayesha Khalid 43
FUTURE WORK
1. The friction tests on nano textured Ta surfaces will be performed with real
bone material to obtain a more realistic result of the friction behavior of the
textured Ta surfaces as dental implants.
2. Study the history of the materials before sample preparation
3. The Ta surfaces will be anodized at more magnitudes of voltage in order to
achieve a wider range of pore size on the textured surface. This could
provide more information and data regarding the relationship between
surface roughness and friction behavior of nano textured Ta surfaces.
4. Scratch tests will performed to study the adhesion of oxide film formed at
different voltages during anodization, as this could provide more
information regarding the wear behavior of nano textured Ta surfaces.
5. The experiments will be repeated for higher number of times to obtain a
more statistically improved data.
6. The time dependent wetting behavior of nano textured Ta surfaces, with
artificial saliva, will be studied.
7. The fretting behavior of the nano textured Ta surfaces will be studied.
Bibliography
44 2016
BIBLIOGRAPHY
[1] Z. Zhou, H. Yu,, J. Zheng,, L. Qian, Y. Yan, Dental biotribology, New York,
Springer, 2013.
[2] J. Black, "Biologic performance of tantalum", Clinical Materials, vol.16, 1994,
p.167-173.
[3] H. Matsuno, A. Yokoyama, F. Watari, M. Uo, T. Kawasaki, "Biocompatibility and
osteogenesis of refractory metal implants, titanium, hafnium, niobium, tantalum
and rhenium", Biomaterials, vol.22, 2001, p.1253-1262.
[4] M. A. Ballo, O. Omar, W. Xia, A. Palmquist, "Dental Implant Surfaces –
Physicochemical Properties, Biological Performance, and Trends". Implant
Dentistry - A Rapidly Evolving Practice, 2011.
[5] P. I. Branemark, U. Breine, B. Johansson, P. J. Roylance, H. Rockert, J. M.
Yoffey, "Regeneration Of Bone Marrow", Acta Anatomica, vol.59, 1964, p.1-46.
[6] C. Nelson, "Factors Affecting the Success of Dental Implants", Implant Dentistry -
A Rapidly Evolving Practice, 2011.
[7] T. Ebert, "Dental Implants Progression", Dentalimplantsprogression.blogspot.pt,
2012, <http://dentalimplantsprogression.blogspot.pt/> [accessed 24 February
2016].
[8] A. Wennerberg, T. Albrektsson, "On implant surfaces: a review of current
knowledge and opinions", The International Journal of Oral & Maxillofacial
Implants, vol.25, no.1, 2010, p.63-74.
[9] L. Le Guéhennec, A. Soueidan, P. Layrolle, Y. Amouriq, "Surface treatments of
titanium dental implants for rapid osseointegration", Dental Materials, vol.23,
no.7, 2007, p.844-854.
[10] A. Wennerberg, T. Albrektsson, C. Johansson, B. Andersson, "Experimental
study of turned and grit-blasted screw-shaped implants with special emphasis on
effects of blasting material and surface topography", Biomaterials, vol.17, no.1,
1996, p.15-22.
[11] A. Wennerberg, T. Albrektsson, B. Andresson, "Bone tissue response to
commercially pure titanium implants blasted with fine and coarse particles of
aluminum oxide", The International Journal of Oral & Maxillofacial Implants,
vol.11, no.1, 1996, p.38-45.
[12] M. J. Jackson, A. Waqar (Eds.), "Anodization: A Promising Nano-Modification
Technique of Titanium-based Implants for Orthopedic Applications", Surface
Engineered Surgical Tools and Medical Devices, 2007, p.21-47.
Tribological Behavior of micro/nano structured tantalum surfaces by anodization method
Ayesha Khalid 45
[13] K. De Groot, R. Geesink, C. Klein, P. Serekian, "Plasma sprayed coatings of
hydroxylapatite", Journal of Biomedical Materials Research, vol. 21, no.12, 1987,
p.1375-1381.
[14] T. Webster, J. Ejiofor, "Increased osteoblast adhesion on nanophase metals: Ti,
Ti6Al4V, and CoCrMo", Biomaterials, vol. 25, no. 19, 2004, p.4731-4739.
[15] Y. Sul, C. Johansson, Y. Jeong, T. Albrektsson, "The electrochemical oxide
growth behaviour on titanium in acid and alkaline electrolytes", Medical
Engineering & Physics, vol. 23, no. 5, 2001, p.329-346.
[16] J. Choi, R. Wehrspohn, J. Lee, J. Gosele, "Anodization of nanoimprinted
titanium: a comparison with formation of porous alumina", Electrochimica Acta,
49, 16, 2004, p.2645-2652.
[17] W. Baun, "Formation of porous films on titanium alloys by anodization" Surface
Technology, vol.11, no.6, 1980, p.421-430.
[18] M. Okada, K. Tajima,Y. Yasusei, K. Yoshimura, "Self-Organized Formation of
Short TiO2 Nanotube Arrays By Complete Anodization of Ti Thin Films",
Physics Procedia, vol.32, 2012, p.714-718.
[19] A. Jaroenworaluck, D. Regonini, C.R. Bowen, R. Stevens, "Nucleation and early
growth of anodized TiO2 film". Journal of Materials Research, vol.23, no.8,
2008, p.2116-2124.
[20] R. Beranek, H. Hildebrand, P. Schmuki, "Self-Organized Porous Titanium Oxide
Prepared in H[sub 2]SO[sub 4]/HF Electrolytes", Electrochemical and Solid-State
Letters, vol.6, no.3, 2003, p.B12.
[21] P. Roy, S. Berger, P. Schmuki, "TiO2 Nanotubes: Synthesis and
Applications", Angewandte Chemie International Edition, vol.50, no.13, 2011,
p.2904-2939.
[22] C. Grimes, G. Mor, TiO2 nanotube arrays. Dordrecht, Springer, 2009.
[23] D. Gong, C. Grimes, O. Varghese, W. Hu, R. Singh, Z. Chen, E. Dickey,
"Titanium oxide nanotube arrays prepared by anodic oxidation", Journal of
Materials Research, vol.16, no.12, 2001, p.3331-3334.
[24] S. Minagar, C. Berndt, J. Wang, E. Ivanova, C. Wen, "A review of the application
of anodization for the fabrication of nanotubes on metal implant surfaces", Acta
Biomateralia, vol.8, no.8, 2012, p.2875-2888.
[25] Q. Cai, L. Yang, Y. Yu, "Investigations on the self-organized growth of TiO2
nanotube arrays by anodic oxidation", Thin Solid Films, vol.515, no.4, 2006,
p.1802-1806.
Bibliography
46 2016
[26] G. Mor, K. Shankar, M. Paulose, O. Varghese, C. Grimes, "Enhanced
Photocleavage of Water Using Titania Nanotube Arrays", Nano Letters, vol.5,
no.1, 2005, p.191-195.
[27] V. Balla, S. Banerjee, S. Bose, A. Bandyopadhyay, "Direct laser processing of a
tantalum coating on titanium for bone replacement structures", Acta
Biomaterialia, vol.6, no.6, 2010, p.2329-2334.
[28] V. Balla, S. Bose, N. Davies, A. Bandyopadhyay, "Tantalum—A bioactive metal
for implants", The Journal of The Minerals, Metals & Materials Society, vol.62,
no.7, 2010, p.61-64.
[29] S. Jafari, B. Bender, C. Coyle, J. Parvizi, P. Sharkey, W. Hozack, "Do Tantalum
and Titanium Cups Show Similar Results in Revision Hip
Arthroplasty?", Clinical Orthopaedics and Related Research®, vol.468, no.2,
2009, p.459-465.
[30] Q. Lu, S. Mato, P. Skeldon, G. Thompson, D. Masheder, H. Habazaki, K.
Shimizu, "Anodic film growth on tantalum in dilute phosphoric acid solution at
20 and 85°C", Electrochimica Acta, vol.47, no.17, 2002, p.2761-2767.
[31] I. Sieber, H. Hildebrand, A. Friedrich, P. Schmuki, "Initiation of tantalum oxide
pores grown on tantalum by potentiodynamic anodic oxidation", Journal of
Electroceramics, vol.16, no.1, 2006, p.35-39.
[32] W. Wei, J. Macak, P. Schmuki, "High aspect ratio ordered nanoporous Ta2O5
films by anodization of Ta", Electrochemistry Communications, vol.10, no.3,
2008, p.428-432.
[33] N. Allam, X. Feng, C. Grimes, "Self assembled fabrication of vertically oriented
Ta2O5 nanotubes arrays, and membranes thereof, by one-step tantalum
anodization", Chemistry of Materials, vol.20, no. 20, 2008, p.6477-6481.
[34] I. Hasan, L. Keileg, M. Staat, G. Wahl, C. Bourauel, "Determination of the
frictional coefficient of the implant-antler interface: experimental
approach", Biomedizinische Technik/Biomedical Engineering, vol.57, no.5, 2012,
p.359-363.
[35] P. Predcki, B. Auslaender, J. Stephan, V. Mooney, C. Stanitski, "Attachment of
bone to threaded implants by ingrowth and mechanical interlocking", Journal of
Biomedical Materials Research, vol.6, no.5, 1972, p.401-412.
[36] D. Puleo, A. Nanci, "Understanding and controlling the bone–implant interface",
Biomaterials, vol.20, no.23-24, 1999, p.2311-2321.
[37] J. Galante, J. Jacobs, "Clinical Performances of Ingrowth Surfaces", Clinical
Orthopaedics and Related Research, vol.276, 1992, p.41-49.
Tribological Behavior of micro/nano structured tantalum surfaces by anodization method
Ayesha Khalid 47
[38] S. Cook, K. Thomas, H. Haddad, "Histologic Analysis of Retrieved Human
Porous-Coated Total Joint Components", Clinical Orthopaedics and Related
Research,vol. 234, 1988, p.90-101.
[39] C. Engh, J. Bobyn, A. Glassman, "Porous-coated hip replacement. The factors
governing bone ingrowth, stress shielding, and clinical results", Journal of Bone
and Joint Surgery, vol.69, no.1, 1987, p.45-55.
[40] H. Bulaqi, M. Mousavi, F. Geramipanah, H. Safari, M. Paknejad, "Effect of the
coefficient of friction and tightening speed on the preload induced at the dental
implant complex with the finite element method", The Journal of Prosthetic
Dentistry, vol.113, no.5, 2015, p.405-411.
[41] L. Carlsson, T. Rostlund, B. Albrektsson, P. Branemark, "Osseointegration of
titanium implants", Acta Orthopaedica, vol.57, no.4, 1986, p.285-289.
[42] P. Buchert, P. Vaughn, T. Mallory, T. Engh, J. Bobyn, "Excessive metal release
due to loosening and fretting of sintered particles on porous-coated hip
prostheses: Report of two cases", Journal of Bone and Joint Surgery, vol.68, no.4,
1986, p.606-609.
[43] H. Yu, Z. Cai, Z. Zhou, M. Zhu, "Fretting behavior of cortical bone against
titanium and its alloy" Wear, vol.259, no.7-12, 2005, p.910-918.
[44] S. Gao, Y. Zhang, Z. Zhu, H. Yu, "Micromotions and combined damages at the
dental implant/bone interface", International Journal of Oral Science, vol.4, no.4,
2012, p.182-188.
[45] H. Yu, H. Quan, Z. Cai, S. Gao, M. Zhu, "Radial Fretting Behavior of Cortical
Bone Against Titanium", Tribol Lett, vol.31, no.2, 2008, p.69-76.
[46] H. Yu, S. Gao, S. Cai, H. Quan, M. Zhu, "Dual-motion fretting behavior of
mandibular cortical bone against pure titanium", Tribology International, vol.42,
no.9, 2009, p.1365-1372.
[47] S. Gao, Z. Cai, H. Quan, M. Zhu, H. Yu, "Comparison between radial fretting and
dual-motion fretting features of cortical bone", Tribology International, vol.43,
no.1-2, 201, p.440-446.
[48] K. SØballe, E. Hansen, H. B-Rasmussen, P. Jorgesen, C. Bunger, "Tissue
ingrowth into titanium and hydroxyapatite-coated implants during stable and
unstable mechanical conditions", Journal of Orthopaedic Research, vol.10, no.2,
1992, p.285-299.
[49] Y. Akagawa, M. Hashimoto, N. Kondo, K. Satomi, T. Takata, H. Tsuru, "Initial
bone-implant interfaces of submergible and supramergible endosseous single-
crystal sapphire implants", The Journal of Prosthetic Dentistry, vol.55, no.1,
1986, p.96-100.
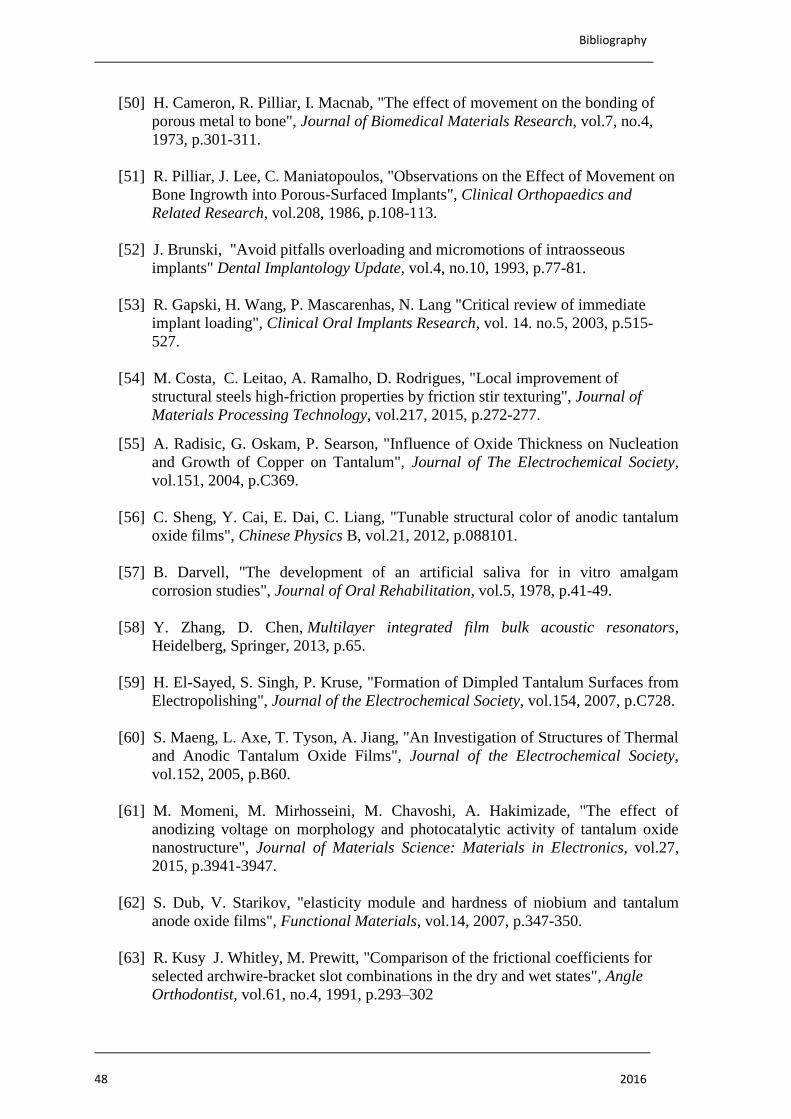
Bibliography
48 2016
[50] H. Cameron, R. Pilliar, I. Macnab, "The effect of movement on the bonding of
porous metal to bone", Journal of Biomedical Materials Research, vol.7, no.4,
1973, p.301-311.
[51] R. Pilliar, J. Lee, C. Maniatopoulos, "Observations on the Effect of Movement on
Bone Ingrowth into Porous-Surfaced Implants", Clinical Orthopaedics and
Related Research, vol.208, 1986, p.108-113.
[52] J. Brunski, "Avoid pitfalls overloading and micromotions of intraosseous
implants" Dental Implantology Update, vol.4, no.10, 1993, p.77-81.
[53] R. Gapski, H. Wang, P. Mascarenhas, N. Lang "Critical review of immediate
implant loading", Clinical Oral Implants Research, vol. 14. no.5, 2003, p.515-
527.
[54] M. Costa, C. Leitao, A. Ramalho, D. Rodrigues, "Local improvement of
structural steels high-friction properties by friction stir texturing", Journal of
Materials Processing Technology, vol.217, 2015, p.272-277.
[55] A. Radisic, G. Oskam, P. Searson, "Influence of Oxide Thickness on Nucleation
and Growth of Copper on Tantalum", Journal of The Electrochemical Society,
vol.151, 2004, p.C369.
[56] C. Sheng, Y. Cai, E. Dai, C. Liang, "Tunable structural color of anodic tantalum
oxide films", Chinese Physics B, vol.21, 2012, p.088101.
[57] B. Darvell, "The development of an artificial saliva for in vitro amalgam
corrosion studies", Journal of Oral Rehabilitation, vol.5, 1978, p.41-49.
[58] Y. Zhang, D. Chen, Multilayer integrated film bulk acoustic resonators,
Heidelberg, Springer, 2013, p.65.
[59] H. El-Sayed, S. Singh, P. Kruse, "Formation of Dimpled Tantalum Surfaces from
Electropolishing", Journal of the Electrochemical Society, vol.154, 2007, p.C728.
[60] S. Maeng, L. Axe, T. Tyson, A. Jiang, "An Investigation of Structures of Thermal
and Anodic Tantalum Oxide Films", Journal of the Electrochemical Society,
vol.152, 2005, p.B60.
[61] M. Momeni, M. Mirhosseini, M. Chavoshi, A. Hakimizade, "The effect of
anodizing voltage on morphology and photocatalytic activity of tantalum oxide
nanostructure", Journal of Materials Science: Materials in Electronics, vol.27,
2015, p.3941-3947.
[62] S. Dub, V. Starikov, "elasticity module and hardness of niobium and tantalum
anode oxide films", Functional Materials, vol.14, 2007, p.347-350.
[63] R. Kusy J. Whitley, M. Prewitt, "Comparison of the frictional coefficients for
selected archwire-bracket slot combinations in the dry and wet states", Angle
Orthodontist, vol.61, no.4, 1991, p.293–302

Tribological Behavior of micro/nano structured tantalum surfaces by anodization method
Ayesha Khalid 49
[64] G. Andreasen, F. Quevedo, "Evaluation of friction forces in the 0·022 × 0·028
edgewise bracket in vitro", Journal of Biomechanics, vol.3, 1970, p.151-160.
[65] G. Read-Ward, S. Jones, E. Davies, "A comparison of self-ligating and
conventional orthodontic bracket systems.", British Journal of Orthodontics, vol.
24, 1997, p.309-317.
[66] K. Baker, L. Nieberg, A. Weimer, M. Hanna, "Frictional changes in force values
caused by saliva substitution", American Journal of Orthodontics and Dentofacial
Orthopedics, vol.91, 1987, p.316-320.
[67] J. Stannard, J. Gau, M. Hanna, "Comparative friction of orthodontic wires under
dry and wet conditions", American Journal of Orthodontics, vol.89, 1986, p.485-
491.

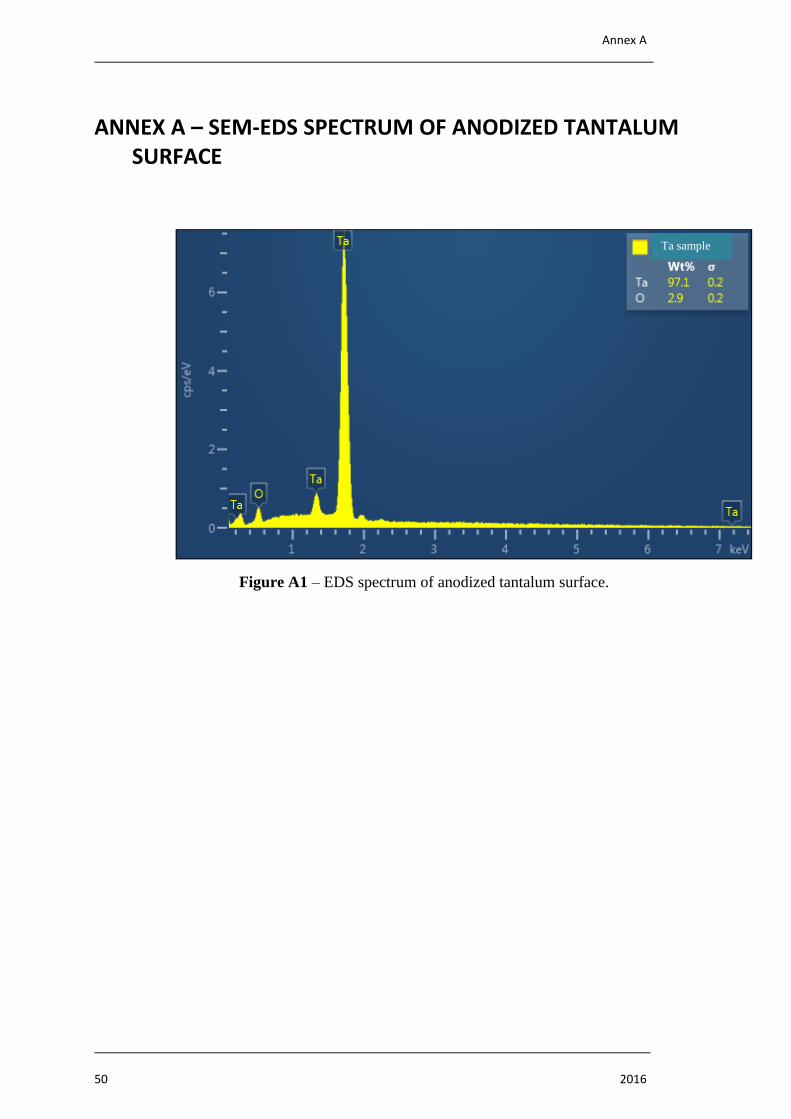
Annex A
50 2016
ANNEX A – SEM-EDS SPECTRUM OF ANODIZED TANTALUM SURFACE
Figure A1 – EDS spectrum of anodized tantalum surface.
Ta sample

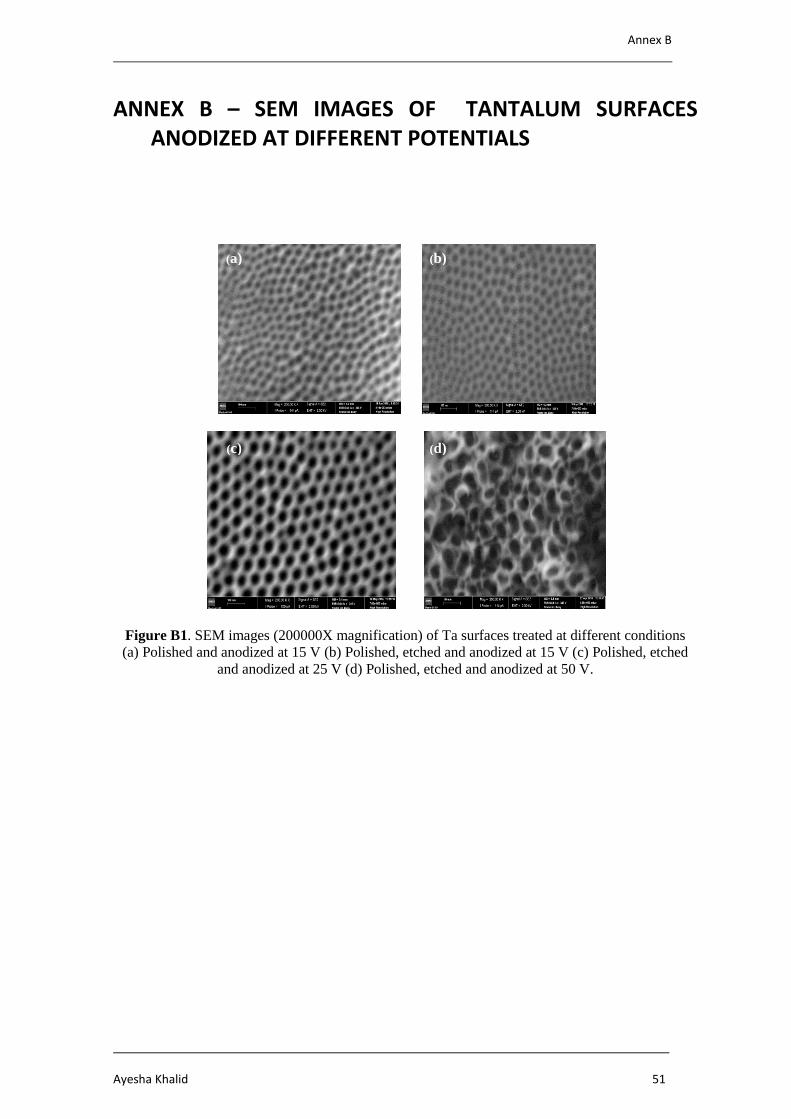
Annex B
Ayesha Khalid 51
ANNEX B – SEM IMAGES OF TANTALUM SURFACES ANODIZED AT DIFFERENT POTENTIALS
Figure B1. SEM images (200000X magnification) of Ta surfaces treated at different conditions
(a) Polished and anodized at 15 V (b) Polished, etched and anodized at 15 V (c) Polished, etched
and anodized at 25 V (d) Polished, etched and anodized at 50 V.
(a)
(a)
(b)
(a)
(c)
(a)
(d)
(a)
(a)
(a)