“tribalism is the bane of independent africa - social sciences division
TRANSCRIPT

African Borders as Sources of Natural Experiments*
Daniel N. Posner Department of Political Science
University of California, Los Angeles Los Angeles, CA 90095-1472
This version: 10 April 2006
* I thank John McCauley for his many comments and for sharing his data on religious identification along the Côte d’Ivoire-Burkina Faso border and Anoop Sarbahi for his help assembling the GPCP rainfall data.

The arbitrary nature of Africa’s borders is well known.1 Less well recognized is the opportunity that these arbitrary borders provide for social science research. This paper describes some of the shortcomings of traditional, observational studies and shows how natural experiments can provide for more reliable inferences about causality. The paper then draws on examples from three different projects to illustrate how the artificial nature of Africa’s borders can be used as a source of natural experiments. The Quest for Causal Inferences in Social Science Research
In the social sciences, researchers typically make causal inferences through observational studies. These are analyses where the variables that the researcher is studying acquire their values through the unfolding of real-world events that are outside the researcher’s control (Collier et al 2004). The problem with observational studies is that they make it difficult or impossible to rule out the possibility that other, unmeasured variables may be the cause of the observed relationship between the variables of interest. Suppose, for example, we are interested in the linkage between smoking and cancer. To investigate the connection, we might recruit a large number of people, divide them into smokers and non-smokers, and compare the cancer rates of each group. If we found higher cancer rates among the smokers, we might be tempted to conclude that smoking does indeed cause cancer. But we would be wrong to reach such a conclusion unless we could first rule out the possibility that other unobserved factors – for example, poverty or stress or diet – might have caused people both to smoke more and to be more susceptible to disease. If we just took smokers and non-smokers “as we found them” – which is what researchers in observational studies do – then we would be unable to rule out these potentially serious competing explanations for the relationship we found between smoking and cancer. This is the weakness of observational studies. They may be useful for identifying possible causal effects, but they cannot reliably establish causation (Gerber et al 2004).
Experimental studies, such as those commonly undertaken in the natural sciences, do
permit causal inferences to be made. In experimental research, the values on the key independent variables are products of the random assignment of subjects or subjects by the researcher to different treatments. It is precisely the random assignment of subjects to treatments that permits the researcher to rule out confounding explanations of the sort described above. The analog to the cancer and smoking example, set up as an experiment, would be to randomly choose subjects and then randomly assign them to two groups. The first group would be forced to smoke; the second group would be prevented from doing so during the course of the experiment. Since the assignment to the smoking treatment was randomized, we could safely rule out the possibility that some unmeasured factor was responsible for the decision on the part of the subjects in the first group to smoke, or for the health outcomes that we observe (which we might be tempted to link to smoking). For social scientists, the major drawback to experimental studies is that they are difficult to undertake outside of the laboratory (and, as the smoking and cancer illustration makes clear, also sometimes unethical). Also, experiments done in the lab often have questionable validity in the real world. Nonetheless, precisely because of their advantages in making causal inferences, the use of experimental methods in the social sciences – 1 For an excellent recent summary of this literature, see Englebert et al (2002).
1

African Borders as Sources of Natural Experiments Daniel N. Posner
increasingly through field studies (e.g., experiments that take place outside the laboratory) – is growing (McDermott 2002).
Natural experiments stand as a middle ground between observational and experimental
studies. Like observational studies, they derive from naturally occurring phenomena rather than the manipulation of the experimenter. But, unlike observational studies, they permit the researcher to “make a credible claim that the assignment of the non-experimental subjects to treatment and control conditions is ‘as if’ random” (Dunning 2005). This means that they combine the methodological power of experiments with the “out of the lab” flexibility of observational studies. The trick, however, is to find them, for good ones are as rare as they are valuable. This paper shows how the arbitrary boundaries between African countries can be viewed as a random assignment of populations to different national treatments, and thus as a rich source of natural experiments.
African Borders as Sources of Natural Experiments
The borders between African countries today are products of colonial era boundary-making. Although sometimes delimited on the basis of language, religion, or other sociological characteristics, Africa’s boundaries were, for the most part, arrived at with no reference at all to the social or cultural characteristics of the people they partitioned. A clear indication of the arbitrary nature of Africa’s borders is the fact that 44% of them follow meridians or parallels and another 30% follow other rectilinear or curved lines. The remaining 26% follow geographical features such as rivers and watersheds. An indication of their disregard for the populations they bisect comes from Asiwaju’s (1985) estimate that Africa’s 104 distinct borders divide 177 cultural or ethnic groups.
If we accept the physical location of a given border as arbitrary (that is, exogenous to all the potentially relevant sociological, cultural and historical facts on the ground), then we can treat the division of people on either side of the border as a random assignment of subjects to different treatments – the treatments provided by the different political institutions, country-level demographics, histories, and public policies in effect in the countries on either side of the boundary. This implies that African boundaries can serve as sources of natural experiments.
This paper draws on materials from three different projects – one completed, one ongoing, and one just beginning – to illustrate how Africa’s arbitrary borders can generate natural experiments. In doing so, I join a number of other authors (e.g., Asiwaju 1985; Laitin 1986; Miguel 1984; Miles 1994, 2005; Miles and Rochefort 1991) who similarly take advantage of the arbitrary placement of country boundaries in Africa as a tool for making causal inferences.2
2 Africa is not the only place where authors have taken advantage of the analytic leverage provided by the borders between countries. Sahlins (1989) explores the division of the Cerdanya region along the French-Spanish border in the Pyrenees; Elton (2005) analyzes the division of the Jivaro people on the Peru-Equador border; and Passi (2005) examines the Karelia border of Russis and Finland.
2

African Borders as Sources of Natural Experiments Daniel N. Posner
The first project exploits the arbitrary positioning of the Zambia-Malawi border to study
the different inter-group relations between members of the Chewa and Tumbuka ethnic groups living on either side. From an objective standpoint, the cultural differences between Chewas and Tumbukas are identical on either side of the border. But the cleavage between them is much more politically and socially salient in one country than the other. The project explains this difference by emphasizing the different sizes of the Chewa and Tumbuka communities in each country relative to each country’s national population. I show that this has important implications for the usefulness of each group as a basis for political coalition formation, and thus for whether or not these groups (and the cleavage between them) are mobilized politically, and thereby rendered politically salient.
The second project is similar to the first, in that it explores attitudinal and behavioral
differences among members of the same population that happens to be bisected by an arbitrarily demarcated border – this time between Burkina Faso and Côte d’Ivoire. But whereas the variation being explained in the first project is in the nature of relations between a pair of groups, the variation being explained in the second is the salience of different social identities within the same (divided) community. Specifically, the project explores why religion is more salient to people on one side of the border than the other. We explain this difference by documenting the political mobilization of religious divisions in one country but not the other. The project thus underscores the political sources of religious identification.
The third project uses Africa’s arbitrary borders to study how different countries and populations react to identical exogenous climate shocks – specifically droughts. The project uses rainfall data based on satellite images of cold cloud cover to identify droughts that affect neighboring countries (or neighboring regions on either side of a national boundary). Then, using the assignment of drought-affected areas to different countries as a form of random assignment, the project investigates the sources of the different responses to and impacts of the drought on either side of the border. This project is still in its beginning stages, so I explain the set-up and provide some working hypotheses that I plan to explore, but I do not present any results. Why Are Cultural Cleavages Sometimes Politically Salient and Sometimes Not?3
The first project I will describe exploits the division of the Chewa and Tumbuka peoples by the border between Zambia and Malawi. The Zambia-Malawi boundary follows the watershed of a set of low hills that run from southwestern Tanzania to northwestern Mozambique, roughly parallel to the shoreline of Lake Malawi. The boundary was originally demarcated by the British South African Company in 1891 to distinguish the territories of what were then called Northeastern and Northwestern Rhodesia. Like many African borders, it was drawn purely for administrative purposes with no attention to the distribution of groups on the ground. The way it divided the Chewa, Tumbuka, and other communities in the area can thus be treated as a random assignment to two treatments – what might be thought of as the “Zambia treatment” and the “Malawi treatment” – which can be exploited to explore the impact of
3 This section reproduces, in abbreviated form, the more detailed discussion presented in Posner (2004).
3
African Borders as Sources of Natural Experiments Daniel N. Posner
country-level factors such as political institutions, demographics, leadership styles and public policies on the local social and political outcomes that we observe on either side of the border.
Chewas and Tumbukas living on one side of the border are culturally identical to their
co-ethnics living on the other side. Thus, we might expect Chewa-Tumbuka relations to be the same in both countries – particularly if we thought that the nature of the social interactions between two communities was a product of the degree of cultural difference between them. However, as I document below – and as the writings of country experts corroborate (e.g., Dresang 1974; Gertzel et al 1984; Vail and White 1989; Kaspin 1995; Chirwa 1998; and Posner 1991 and 2005) – inter-cultural relations on either side of the border are quite different. Whereas the cultural cleavage between Chewas and Tumbukas is highly politically salient in Malawi, it has almost no political salience in Zambia. The objective cultural differences between members of these two communities may be the same on both sides of the border, but the salience of the cultural cleavage that divides them is different. What explains this striking cross-border contrast? Why is the cultural cleavage between these two communities so much more politically and socially important in one country than the other?
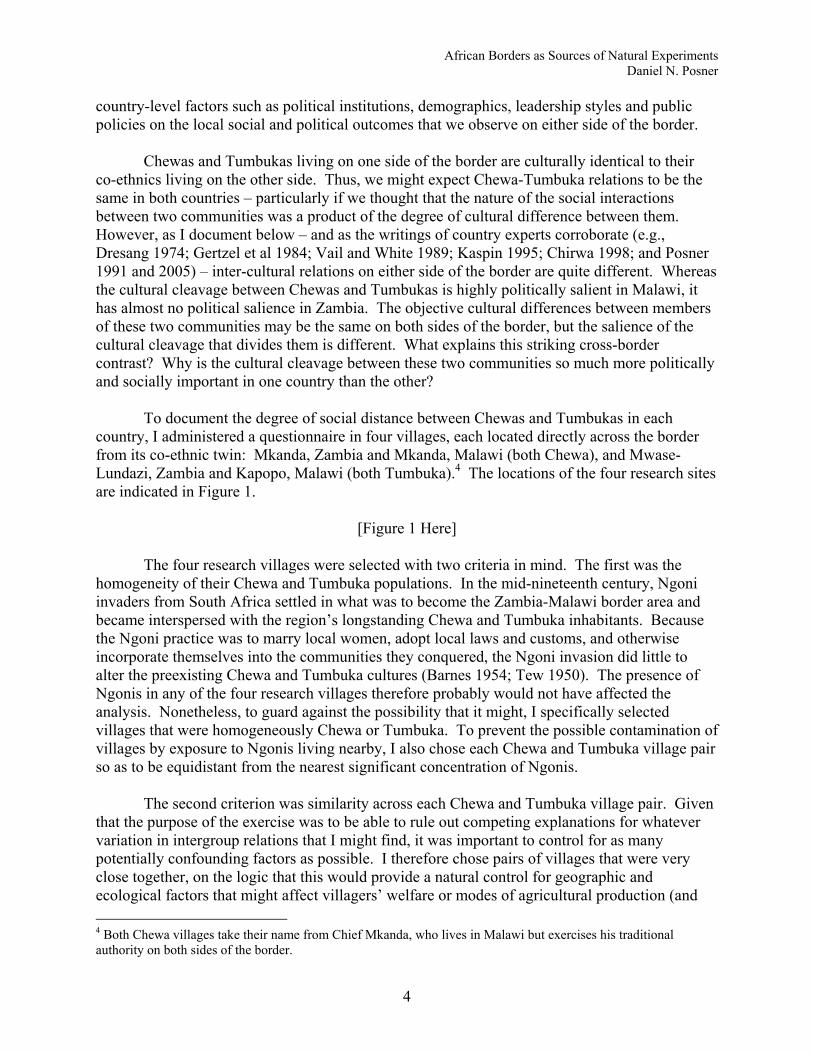
To document the degree of social distance between Chewas and Tumbukas in each
country, I administered a questionnaire in four villages, each located directly across the border from its co-ethnic twin: Mkanda, Zambia and Mkanda, Malawi (both Chewa), and Mwase-Lundazi, Zambia and Kapopo, Malawi (both Tumbuka).4 The locations of the four research sites are indicated in Figure 1.
[Figure 1 Here]
The four research villages were selected with two criteria in mind. The first was the homogeneity of their Chewa and Tumbuka populations. In the mid-nineteenth century, Ngoni invaders from South Africa settled in what was to become the Zambia-Malawi border area and became interspersed with the region’s longstanding Chewa and Tumbuka inhabitants. Because the Ngoni practice was to marry local women, adopt local laws and customs, and otherwise incorporate themselves into the communities they conquered, the Ngoni invasion did little to alter the preexisting Chewa and Tumbuka cultures (Barnes 1954; Tew 1950). The presence of Ngonis in any of the four research villages therefore probably would not have affected the analysis. Nonetheless, to guard against the possibility that it might, I specifically selected villages that were homogeneously Chewa or Tumbuka. To prevent the possible contamination of villages by exposure to Ngonis living nearby, I also chose each Chewa and Tumbuka village pair so as to be equidistant from the nearest significant concentration of Ngonis.
The second criterion was similarity across each Chewa and Tumbuka village pair. Given
that the purpose of the exercise was to be able to rule out competing explanations for whatever variation in intergroup relations that I might find, it was important to control for as many potentially confounding factors as possible. I therefore chose pairs of villages that were very close together, on the logic that this would provide a natural control for geographic and ecological factors that might affect villagers’ welfare or modes of agricultural production (and 4 Both Chewa villages take their name from Chief Mkanda, who lives in Malawi but exercises his traditional authority on both sides of the border.
4

African Borders as Sources of Natural Experiments Daniel N. Posner
thus, potentially, their attitudes toward out-group members). Mkanda (Zambia) and Mkanda (Malawi) are within 15 kilometers of each other and occupy nearly identical ecological niches. The same is true of Mwase-Lundazi and Kapopo. Indeed, both pairs of villages are so close to each other that several respondents reported regularly visiting friends and relatives across the border in the other village. Agricultural production in all four villages is also very similar, revolving around the production of maize and groundnuts for local consumption and small amounts of tobacco for domestic and international markets.
I was also careful to select villages that were equally exposed to national political affairs in their respective countries, as well as to domestic markets, and to members of the other cultural community. I proxied for exposure to politics and markets by distance from paved roads (which was approximately eight kilometers in all cases) and for exposure to members of the other community by distance from the nearest Chewa or Tumbuka village (which was equal in each pair). The only meaningful difference between the village pairs was the fact that Mkanda (Zambia) and Mwase-Lundazi were on the Zambian side of the border and Mkanda (Malawi) and Kapopo were on the Malawian side.
I interviewed 42 respondents in each of the two Zambian villages and 48 respondents in each of the two Malawian villages, for a total sample of 180. I selected respondents through a random stratified quota sampling procedure (with stratification by gender and age) from every third unrelated household. The surveys were conducted in the respondent’s local language (either Chichewa or Chitumbuka). The survey asked five questions:
• What, if anything, makes Chewas different from Tumbukas? • Do you think Chewas (Tumbukas) here would vote for a Tumbuka (Chewa) if he
were standing for president? • What about you? Would you vote for a Chewa (Tumbuka) if he were standing for
president? • Are you married?
[If married] Are you married to a Chewa (Tumbuka)? [If no] Would you have considered marrying a Chewa (Tumbuka)?
[If not married] Would you marry a Chewa (Tumbuka)? • In general, how do people here feel about Chewas marrying Tumbukas? The purpose of the first open-ended survey question was to confirm that the objective
cultural differences between Chewas and Tumbukas – or, more accurately, respondents’ perceptions of these differences – were the same in both countries. This was necessary to establish to rule out the possibility that the difference in the salience of the Chewa-Tumbuka cleavage in each country was a product of greater objective differences between these groups on one side of the border than the other.
Again and again, respondents in all four villages identified the same attributes as
distinguishing members of the two communities. Many began by pointing to differences in the two groups’ languages and traditional dances. Others pointed to the communities’ different norms regarding lobola (brideprice) payments: Whereas Tumbuka parents customarily demand payment of seven cows from their daughters’ suitors, Chewa parents require only a chicken.
5

African Borders as Sources of Natural Experiments Daniel N. Posner
Several respondents pointed out that Tumbukas are patrilocal, whereas Chewas are matrilocal. Others mentioned that Tumbukas insist on the ritual cleansing of the wife after the death of her husband, while Chewas do not. One respondent noted that Tumbukas use long hoes and Chewas use short hoes. Another noted that whereas Tumbukas do not make ridges when planting groundnuts, Chewas do.
While the specific cultural practices that respondents mentioned varied somewhat from
person to person, nearly every interviewee on both sides of the border (83% overall) was able to identify at least one attribute, tradition, or custom – and often several – that made Chewas and Tumbukas culturally different from one another. On average, respondents mentioned 1.36 differences (SD = 0.97), although 23% of Zambian respondents and 15% of Malawian respondents mentioned none. Among those who mentioned at least one difference, the average number of differences mentioned was nearly identical on both sides of the border: 1.66 for Zambians (SD = 1.0) and 1.70 for Malawians (SD = 0.91).
Zambian and Malawian respondents did differ in one important respect. Malawians
occasionally supplemented their list of objective differences with negative statements about members of the other community. For example, several Malawian Chewas volunteered that, in addition to having different cultural practices, Tumbukas are odzikonda (literally, they “love themselves”). Others referred to Tumbukas as nepotistic, selfish, or boastful. One Chewa summarized the relations between the two communities by saying that, between the groups, there is mpatukano (loosely, “great division;” literally, “going different ways”). Some Malawian Tumbukas also had negative things to say about Chewas. More than one Malawian Tumbuka respondent characterized Chewas as “crooks” or as being “too clever.” Others referred to them as “lazy.” While the number of Malawian respondents who volunteered such negative characterizations was fairly small (just 13 of the 93 who answered the question), this stood in marked contrast to the Zambian respondents, only two (of 83) of whom supplemented their objective characterizations of Chewa-Tumbuka differences with negative comments about members of the other group. In fact, the modal Zambian response to my request for a list of differences between Chewas and Tumbukas was to emphasize that “We are one” or “We are united.”
The different views held by Malawians and Zambians about members of the other group
were demonstrated even more clearly in the responses to the next four questions. The first asked respondents whether they thought that people in their village would be willing to vote for a member of the other group if such a person were running for president. Whereas only 21% of Zambians said they thought that others would be unwilling to support a candidate from the other community, fully 61% of Malawians said they thought their fellow villagers would be unwilling to vote across group lines. When asked what they themselves would do (a formulation that usually leads to more inhibited answers and lower professed levels of intergroup antipathy), 45% of Malawians still insisted that they would not support a member of the other group, compared to just 24% of Zambians.
These response patterns carried over from the political sphere into the realm of private
social relations. In response to the question about whether they would marry a member of the
6

African Borders as Sources of Natural Experiments Daniel N. Posner
other group, just 24% of Zambians said they would not, compared to 55% of Malawians.5 When asked more generally how people in their community felt about members of one group marrying members of the other, only 6% of Zambians said it was frowned upon, whereas 38% of Malawians said so. Note that these differences cannot be attributed to the possibility that respondents on one side of the border had greater exposure to members of the other group than respondents on the other side: Both Chewa villages were equidistant from the nearest concentration of Tumbukas, and both Tumbuka villages were equidistant from the nearest concentration of Chewas. Also, all villages were located equally far from paved roads that might have promoted exposure to outsiders or facilitated out-migration by those who were more open to marrying outside the group.
The gulf between the Zambian and Malawian respondents on all of these questions is
made clear in Figure 2. For all four questions, the observed difference between the Zambian and the Malawian response patterns is significant at p < .01 in a two-tailed test. These differences are all the more remarkable when we remember that the proximity of the village pairs (less than 15 kilometers in both cases), the porosity of the border, and the peripheral location of the four research sites from the center of each country’s political affairs almost certainly generated a bias against finding a difference between the Zambian and the Malawian respondents. If anything, the findings must be viewed as a lower bound on the true difference in the salience of the Chewa-Tumbuka cleavage in each country.
[Figure 2 Here]
In Table 1, I revisit these results in a series of logit regressions in which I control for
respondents’ tribal affiliations, gender, and age. I also control for the number of cultural differences they mentioned in response to the open-ended question about Chewa-Tumbuka differences. I include this last variable to control for the possibility that the difference in the salience of the Chewa-Tumbuka cleavage in Zambia and Malawi might be a product of different perceptions about the objective differences between these communities in each country. If the degree of perceived cultural difference between Chewas and Tumbukas matters in shaping intergroup relations, then we might expect respondents who mentioned more differences to be more hostile to members of the other community. This would be reflected in a significant positive coefficient on the Number of Differences variable.
[Table 1 Here]
The analysis yields several interesting results. First, the coefficient on the Number of Differences variable is insignificant in all four regressions, signaling that the perceived degree of cultural difference between the two communities has no effect on respondents’ attitudes toward members of the other group. Second, in both countries, Tumbuka respondents demonstrate more
5 Given the ethnically homogeneous nature of the survey villages, individuals would have needed to go to some lengths even to find a spouse from outside of their own group. Hence, the vast majority of respondents were answering the intermarriage question in terms of the hypothetical (i.e., whether they would have considered marrying a member of the other community). Only 7.1% of Zambian respondents (six of eighty-four) and 5.2% of Malawian respondents (five of ninety-six) reported that they actually were married to a person from the other ethnic group.
7

African Borders as Sources of Natural Experiments Daniel N. Posner
hostility to Chewas than Chewas do to Tumbukas, particularly when it comes to the issue of intermarriage. Third, women are significantly less willing to marry outside their group than men. This is perhaps not surprising given the generally low status of women in both Chewa and Tumbuka societies and the preference of women to maintain links to ethnic kin who might offer them protection from abusive husbands or in-laws.
The most important finding, however, is that, controlling for all of these other factors, the
most powerful determinant of a respondent’s attitudes toward members of the other community is his or her physical – and, it bears underscoring, from an historical perspective, entirely accidental – location on one side of the Zambia-Malawi border or the other. Malawian respondents are significantly less willing to vote for a presidential candidate from the other group and significantly less willing to marry across group lines than are their otherwise identical Zambian counterparts. The interpretation of the coefficient estimates for country reported in Table 1 is that Malawian respondents were 45% more likely than their otherwise identical counterparts across the border in Zambia to believe that others in the area would not vote for a presidential candidate from the other group; 25% more likely to say that they themselves would not vote for a presidential candidate from the other group; 36% less likely to say they would have (considered) marrying across group lines; and 39% more likely to say that marriage across group lines is frowned upon in their community (calculation of marginal effects not shown). These findings accord with the received wisdom from the secondary source literature: Both in the political realm and in the sphere of social relations, the divisions between Chewas and Tumbukas run much deeper in Malawi than in Zambia. The objective cultural cleavage that separates members of one community from the other may be the same, but the salience of that cleavage as a marker of political and social division is altogether different.
Why are Chewa-Tumbuka relations so different in the Zambian and Malawian survey
villages? Or, put slightly differently, what is it about the “Zambian” and “Malawian” treatments that can account for the differences in inter-group relations we observe among identical populations on either side of the border? In Posner (2004), I explore and rule out a number of possible explanations. These include differences in modernization, political institutions, colonial histories, degree of social contact between Chewas and Tumbukas on either side of the border, and proximity to a national election (which might have led to political mobilization along ethnic lines and a deepening of nascent Chewa-Tumbuka divisions). For each of these potential explanations, I show that the differences between the Zambian and Malawian survey respondents were not sufficiently great to account for the quite different inter-group relations found in each pair of villages. The crucial aspect of the “treatment,” I argue, was the different physical sizes of the two countries – Zambia’s land area is almost eight times larger than Malawi’s – and the sizes of the Chewa and Tumbuka communities in each country relative to the size of the country as a whole. I argue that this simple structural difference critically affects the relative political salience of the Chewa-Tumbuka cleavage on either side of the border.
Why might group size matter? Politics in Zambia and Malawi, as in other developing
nations, revolves around the competition for control over scarce patronage resources – things like jobs, schools, clinics, roads, import and export licenses, tariff exemptions, and access to credit. Because these resources are controlled by the national government, the key to gaining access to them is to build a political coalition that can either capture political power outright (which, in the
8

African Borders as Sources of Natural Experiments Daniel N. Posner
highly centralized political systems of these countries, means capturing and retaining the presidency) or become a strong enough political force to exert pressure on the person who holds that office.6 In the course of building these coalitions, politicians find it useful to mobilize their supporters by exploiting cultural divisions. However, there are numerous cultural divisions that they might exploit. Which should they choose? If the purpose of mobilizing the cultural cleavage is to build a coalition that can help them achieve political power, then it is natural for them to emphasize the cleavage that defines the most usefully sized coalitional building blocks and to ignore those that define groups that are too small to be politically viable.
In Malawi, both the Chewa and the Tumbuka communities are sufficiently large (28% and 12% of the national population, respectively) as to constitute viable political coalitions in the competition over national power. Thus, when Malawian politicians seek to build political support bases, they find these groups to be useful building-blocks, and their mobilization of these communities renders the cultural cleavage between them politically salient. There are other cultural divisions that politicians might mobilize: those between the Ngonde and Henga, between the Lambya and Sukwa, or between the Ngoni and Tonga, for example. However, none of these other groups are large enough to be useful political vehicles – they are all less than 5% of the national population – so these cultural cleavages remain unexploited and politically irrelevant. Only the Chewa and Tumbuka are big enough groups in the north and center of the country to represent viable political support bases groups for the national political stage, so, among the several cultural cleavages that might be mobilized, only the cleavage between the Chewa and the Tumbuka is seized upon by politicians, and only this cleavage comes to matter politically.7
In Zambia, neither the Chewa nor Tumbuka community alone has the size to be an
effective political vehicle (they are 7% and 4% of the national population, respectively). These groups therefore go unmobilized by Zambian politicians and the cultural differences between them remain politically inconsequential. This is not to say that Zambian politicians do not exploit cultural differences in their coalition-building efforts, for they do. Rather it is to say that, when they do “play the ethnic card,” they choose not to emphasize the cleavage between Chewas and Tumbukas. The logic of ethnic coalition-building in Zambia leads them instead to mobilize Chewas and Tumbukas as part of a common coalition of “Easterners.” This “Eastern” coalition, which includes Chewas, Tumbukas, and other Nyanja-speaking groups from the Eastern part of the country (and for this reason is sometimes referred to as the coalition of “Nyanjas” or “Nyanja-speakers”), constitutes just over 20% of the national population. This is a size sufficiently large to permit it to compete formidably in the national political arena, and this accounts for why it is mobilized, and for why the cultural differences among its ethnic subunits (including the Chewas and Tumbukas) are ignored.
6 Note that while capturing the presidency may require mobilizing one’s coalition in the context of a competitive election, securing resources by exerting pressure does not. Positioning oneself as the leader of a weighty political coalition is thus a central ingredient for political success even in undemocratic contexts. 7 In the south of the country, other groups are politically viable as well and other ethnic cleavages are salient. But in the areas adjacent to the study area, the Chewa-Tumbuka cleavage is most relevant.
9

African Borders as Sources of Natural Experiments Daniel N. Posner
The Political Sources of Religious Identification
The case selection and data collection for the second project I will describe were conducted by John McCauley.8 The project takes advantage of the arbitrary division of the communities living on either side of the border between Côte d’Ivoire and Burkina Faso. The Côte d’Ivoire-Burkina Faso boundary runs east to west for 584 kilometers, connecting a series of seasonal streams from the southeastern corner of Mali to the Black Volta River on the western edge of Ghana. The border was initially demarcated by French decree in October 1899, when French Sudan was broken up into Côte d’Ivoire and Haut-Senegal-Niger (Brownlie 1979).9
On the eastern part of the border area, the people living on both sides are ethnically Lobi; to the west, they are largely Senoufo. As was the case in the project described above, the division of these communities by the border was arbitrary and can thus be treated as a mechanism for the “random assignment” of the people living in the border region to two different country “treatments.” To the extent that the people on either side of the border are found to differ in their attitudes or social attachments, these differences can be attributed to the different social and political forces to which they have been exposed as a consequence of their “assignment” to residence in either Côte d’Ivoire or Burkina Faso. As we document below, the communities on either side of the border are largely indistinguishable from one another. Yet, as we also show, the members of these communities differ markedly in their degree of religious attachment: religion is both substantively and statistically significantly more important to people on the Côte d’Ivoire side of the border than it is to otherwise identical people living on the Burkina Faso side. Why might this be the case? How might we account for this difference in the salience of religious identifications on either side of the border?
To document the differences in religious identification in each country, McCauley administered a questionnaire to 195 respondents distributed across two pairs of research sites – one rural pair; one urban pair (see Figure 3). The two rural locations are the predominantly Lobi villages of Boussoukoula, Burkina Faso and Kalamon, Côte d’Ivoire. The villages are situated approximately 8 km apart, directly across the border from each other in the eastern section of the border zone, near Ghana. The two urban locations were the market towns of Niangoloko, Burkina Faso and Ouangolodougou, Côte d’Ivoire (populations roughly 30,000 each). Both towns lie on the main road connecting Côte d’Ivoire and Burkina Faso, approximately 300 km west of the two rural research sites. The populations of Niangoloko and Ouangolodougou are somewhat more ethnically mixed than in the two rural sites: Niangoloko, which is located 18 km north of the border, is predominantly Gouin and Mossi; Ouangolodougou, situated about 30 km south of the border, is predominatly Senoufo and Dioula. Approximately 50 respondents were recruited in each site via a random stratified sampling procedure, with stratification by age and
8 McCauley is a Ph.D. student at UCLA. His research was funded by the UCLA Globalization Research Center-Africa. 9 Haut-Senegal-Niger was divided in 1919 and the colony of Upper Volta was created (Upper Volta was renamed Burkina Faso in 1987). The border was shifted drastically between 1932 and 1947, when Upper Volta was abolished and then re-constituted. Because there was never a formal and detailed demarcation, the re-established border is simply an approximation of the original 1899 border.
10

African Borders as Sources of Natural Experiments Daniel N. Posner
gender. The surveys were administered in Dioula and/or French in the two urban sites and in Lobiri (and occasionally in French) in the two rural locations.
[Figure 3 Here] The Burkinabé and Ivoirian respondents in the four survey sites are almost identical in
most respects. As Table 2 shows, the two sub-samples are indistinguishable from one another with respect to urban/rural location, gender, and age (this was a direct product of the sampling protocol), and also years of schooling. The Burkinabé respondents had, on average, lived in their current village/town slightly longer than their Ivoirian counterparts (25.2 years vs. 20 years), were more likely to say that they vote in national elections (89% vs. 74%), were somewhat more likely to receive national news every day (46% vs. 39%), and were slightly more likely to have been coded as having a “medium” and less likely to have been coded as having a “high” living standard.10 However, these differences were relatively minor and suggest no reason to question the treatment of the cross-border comparison as a natural experiment.
[Table 2 Here] Given our interest in the strength of religious identification, however, a potentially more
worrisome difference is that Burkinabé respondents were significantly less likely than their Ivoirian counterparts to be Muslim (and significantly more likely to be Catholic or Animist).11 This would be a problem if Muslims were more likely than members of other religious communities to rank their religious identity as most important – a surmise for which the data provides at least some empirical support. We can deal with this difference in one of two ways. The first is to treat the different religious distributions across the Ivoirian and Burkinabé sub-samples as an exogenous “fact on the ground,” in which case we can control for it in our regressions (which we do) when we estimate the sources of religious identification. The second option is to treat the difference not as a potential confound but as an outcome of the Côte d’Ivoire or Burkina Faso “treatments” – in essence, as another dependent variable whose variation across the two countries is precisely what we seek to explain. Either way, the fact that Ivoirian respondents were more likely to be Muslim than their Burkinabé counterparts should not affect the main findings reported here.
Apart from these background questions, the questionnaire also asked four key additional
questions:
10 Living standards were coded into three categories (high, medium, and low) based on a combination of subjective characterizations by the enumerator and information gleaned from survey questions about asset ownership (e.g., radio, television, bicycle, cell phone, moped, car, animals, fields, etc.). Codings were not standardized across urban and rural sites, so a “high” status person in Boussoukoula or Kalamon might not be as well off as respondent coded similarly in Niangoloko or Ouangolodougou. 11 They also differed somewhat in their ethnic composition, particularly in Niangoloko or Ouangolodougou. In the former, the two largest groups in the sample were Gouin (44%) and Mossi (22%); in the latter, the two largest groups were Senoufo (40%) and Dioula (20%). The regressions presented in Table 3 below control for these differences.
11

African Borders as Sources of Natural Experiments Daniel N. Posner
• Each person has several ways of identifying him/herself: nationality, religion, ethnic
group, occupation, gender personality, point of view, etc. For you, what identity is most important?
• After that, what identity would you place in second position? • To whom do you feel closer: a person of your country who is not of your religion, or
a person of your religion who is not of your country? • Could you marry a person of a different religion?
Figure 4 presents the frequency distribution for answers to the “which identity is most important?” question as well as, at far right, the share of respondents in each country that ranked religious identity either first or second. As the Figure makes clear, Ivoirian respondents were far more likely than Burkinabé respondents to mention religion as their most (or first or second most) important identity, and less likely to mention nationality. These cross-country differences are statistically significant at least at p < .01 in a two-tailed test. The other differences (with respect to ethnicity, occupation, gender, and other identities) are not statistically significant.
[Figure 4 Here]
Clear differences were also evident across respondents from each country in their answers to the third and fourth questions. Respondents in Côte d’Ivoire were markedly less likely than their counterparts in Burkina Faso to say that they felt closer to a person who was from their country but not of their religion (40% vs. 77%). They were also less likely to say that they would be willing to marry a person from a different religion (57% vs. 74%). Again, a difference of means test reveals both of these differences to be statistically significant at p < .01 in a two-tailed test.
We revisit these findings in a regression framework in Table 3. Controlling for a number of other factors that might affect the importance attached to different social identities (including the respondent’s urban/rural location, gender, age, school attainment, religion, ethnicity, and standard of living), the country in which the respondent lives turns out to be statistically significantly related to whether or not the respondent identifies religion as his or her most important (column 1) or first or second most important social identity (column 2). The interpretation of the coefficient estimate for country in column 1 is that a respondent whose ancestors were arbitrarily assigned to the Côte d’Ivoire side of the border was 16% more likely than an otherwise identical respondent whose ancestors were arbitrarily assigned to the Burkina Faso side of the border to have ranked his or her religious identity as most important (calculation of marginal effects not shown). If we move to column 2, the interpretation of the coefficient estimate on country is that being randomly assigned to Côte d’Ivoire rather than to Burkina Faso would correspond with a 33% increase in the likelihood that one would identify religion as one’s first or second most important social identity (again, calculation of marginal effects not shown).
[Table 3 Here]
Whether the respondent lives in an urban or a rural environment (which in the context of this study means whether the respondent is from one of the market towns or from one of the villages) appears not to matter for how much importance he/she attaches to religion. A
12

African Borders as Sources of Natural Experiments Daniel N. Posner
respondent’s gender, level of schooling, and standard of living appears not to matter either. Age does seem to have an effect, with younger respondents statistically significantly more likely than respondents aged 46 years and older (the omitted category) to rank religion as their most important identity. A respondent’s religious background also appears to matter, but only when we broaden the definition of “most important identity” to include those social identities that were mentioned either first or second. The positive significant coefficients on Muslim and Catholic in column 2 suggests that, all else equal, Muslims and Catholics are more likely to identify religion as their first or second most important identity than are Animists (the omitted group).
The main finding – that a respondent’s arbitrary assignment generations ago to one side
of the border or the other matters for the importance they attach to religion today – is corroborated by the results in columns 3 and 4. In column 3, the dependent variable is whether the respondent feels closer to someone from his/her country who does not share his/her religion or to someone who shares his/her religion but is not from his/her country. Essentially, the question pits social ties to co-religionists against social ties to co-nationals. The results suggest unambiguously that, controlling for other potential determinants of the relative importance attached to these social memberships, Ivoirian respondents are significantly more likely than Burkinabé respondents to rank co-religionists first. The interpretation of the country coefficient in column 3 is that a respondent living on the Côte d’Ivoire side of the border was 35% less likely than an otherwise identical respondent living on the Burkina Faso side of the border to say that he or she felt closer to his or her co-nationals than to his or her co-religionists (calculation of marginal effects not shown).
When we turn to social distance along religious lines (measured, in column 4, in terms of
willingness to intermarry), we find, similarly, that Ivoirians respondents were less willing to marry people from other religious groups than were Burkinabé respondents. Not surprisingly, when it comes to marriage, gender matters here too (just as it did in the Zambia-Malawi analysis described earlier), with men significantly more willing than women to marry across group lines. Age and education also matter: younger and better educated respondents are significantly more willing to intermarry than older and less well educated respondents. Interestingly, Catholics are less willing to marry across group lines than members of other religious groups.12 But the main finding is, again, that the country in which one lives matters crucially. The interpretation of the coefficient estimate on country in column 4 is that a respondent from Côte d’Ivoire (i.e., a respondent exposed to the “Côte d’Ivoire treatment”) was 25% less likely than an otherwise identical respondent from Burkina Faso (i.e., a respondent exposed to the “Burkina Faso treatment”) to express a willingness to marry a person from a different religious community (calculation of marginal effects not shown).
How might we account for these differences? The objective social make-up of the
communities on either side of the border is (more or less) the same, but the subjective rankings of social identities among residents on each side is quite different. Why does a respondent’s physical – and, though I risk belaboring the point, from an historical perspective, entirely accidental – location on one side or the other of the border matter so much for the importance of 12 The coefficient estimates on the other religious categories are also negative and as large or larger than that for Catholics, but we cannot rule out that they are different from zero. So I only emphasize the finding with respect to Catholics.
13

African Borders as Sources of Natural Experiments Daniel N. Posner
religious identity? What is it about the “Côte d’Ivoire” and “Burkina Faso” treatments that can account for the different salience of religion that we observe among identical populations on either side of the border?
The most plausible explanation is that religion matters more in Côte d’Ivoire because it has been politicized. Under Félix Houphouët-Boigny, Côte d’Ivoire’s president from independence in 1960 until his death in 1993, Côte d’Ivoire was a country where religious and ethnic differences were largely unimportant. However, in the power struggles that erupted after his death, politicians seized upon ethnic and religious differences as a means of winning and maintaining themselves in power.13 The first major move in this direction came with the unveiling of the xenophobic policy of Ivoirité (Ivoirianness) by President Henri Konan Bédié, the former speaker of the National Assembly who succeeded Houphouët. Developed largely as a means to prevent opposition leader Alassane Ouattara (an economist whose father was born in what is now Burkina Faso and who is viewed by many Ivoirians as a foreigner) from competing in the 1995 presidential election, the policy distinguished sharply between Ivoirians of “authentic” native origin and those of mixed or foreign descent.14 In so doing, it opened deep fissures between southern (largely Christian) Ivoirians and northern (largely Muslim) Ivoirians, who were identified with the foreign migrants (who came predominantly from northern, and largely Muslim, countries) and who, like Ouattara, were often of mixed parentage themselves. Although the rhetoric of Ivoirité was always couched in terms of the distinction between “authentic” Ivoirians and foreigners, “at the street level ‘foreigners’ translated rather loosely into Dioula-Mossi-Muslim” (Daddieh 2001: 17-18). Hence the xenophobic appeals very easily led to divisions along religious lines. These divisions were only deepened by the coup that toppled Bédié in on Christmas eve 1999. The six years that followed witnessed the continued exclusion of Ouattara and ongoing strife, occasionally manifested in Christian-Muslim violence.15 By the time of McCauley’s field work in August-September 2005, Côte d’Ivoire had become a place where religious differences, along with north-south divisions, were the principal lens through which national politics was viewed.
Against this backdrop, it is perhaps not surprising that survey respondents in
Ouangolodougou and Kalamon were more likely than their counterparts across the border in Niangoloko and Boussoukoula to view religion as their most important social identity. Nor is it surprising that the Ivoirian respondents were much more likely than their Burkinabé counterparts to say that they feel closer to someone from their religious group than someone from their country, or that they were less willing to marry across religious lines. Suggestive evidence that these differences are, in fact, products of the post-Houphouët mobilization of religious identities comes in Figure 5, which charts answers to a question asking respondents whether they pray less, the same, or more today than ten years ago. Religiosity (as measured by how often people pray) 13 For useful summaries, see Daddieh (2001), Toungara (2001), and International Crisis Group (2003). The account in this paragraph draws heavily on these sources. 14 One of the hallmarks of Côte d’Ivoire’s economic development strategy under Houphouët-Boigny was the importation of unskilled laborers from neighboring countries (especially Burkina Faso, Guinea, Mali, and Niger) to work on the country’s cocoa and coffee plantations. A common estimate is that such migrants make up more than 25% of the Ivoirian population. 15 In October 2000, the bodies of 57 mostly Muslim men were found on the outskirts of Yopougon in what was widely interpreted as an anti-Muslim massacre. In December of that year, a church was set ablaze in the town of Kong (Daddieh 2001).
14

African Borders as Sources of Natural Experiments Daniel N. Posner
appears to be rising among respondents in both countries. But whereas Burkinabé respondents are roughly 2.5 times more likely to say they pray “more” than “less” (42% vs. 17%) compared with ten years ago, Ivoirian respondents are more than 4.5 times more likely to say this (55% vs 12%). If the respondents’ answers are to be trusted (and if whether one prays more today than ten years ago is a meaningful measure of increasing religiosity), then Ivoirians are becoming more religious faster than Burkinabé – a finding that is consistent with the differential politicization of religious differences in each country over the past ten years.
[Figure 5 Here] Responses to Natural Disasters The third project I will describe is still in its early stages. It uses satellite data on rainfall to identify exogenous negative shocks (in this case, droughts) across Africa between 1980 and 2001. Then it focuses on those rainfall shocks that span national boundaries to study the factors that affect the social impacts of and political responses to these shocks. In effect, the project treats the rainfall shock as an exogenous background condition and then uses the arbitrary nature of Africa’s country borders to study how responses to the drought vary across different institutional, social, and political settings.16 The set-up is analogous to an experiment in which subjects are first randomly selected for exposure to a common treatment and then, once exposed, randomly assigned to two different second stage treatments in order to study how the different treatments administered in the second stage affect subjects’ reactions to the first stage treatment. Given the rigorous (and unimpeachably exogenous) case selection procedures that the project involves, I have high hopes that it will eventually generate interesting results. At present, however, it is little more than a strategy for case selection with some ideas (which I describe below) for how to exploit instances where droughts are evident on either side of a national boundary.
To identify instances of drought, I use data from the Global Precipitation Climatology Project (GPCP), which estimates precipitation by combining rainfall gauge measures taken at on-the-ground weather stations (where they are available – the problem is that they quite frequently are not) with inferences made from satellite images of the density of cold cloud cover, which is closely related to actual precipitation.17 The GPCP data set provides monthly mean precipitation estimates for 327 nodes in Africa located at 2.5 degree longitude and latitude intersections for the period 1980 to 2001. To guard against both measurement error and minor year-to-year
16 Note that the project actually exploits two different natural experiments rather than just one. The first is provided by the rainfall shock, which is randomly assigned (by Mother Nature) to some regions and not others. This permits us to compare both drought affected areas with those receiving normal rainfall levels and drought affected areas before and after the rainfall shock. The second natural experiment is provided by Africa’s arbitrary borders and the random assignment that this provides of drought affected people to different political jurisdictions. 17 The GPCP data is also used in the pioneering paper by Miguel et al (2004). A key difference between these authors’ use of the data and my own is that they aggregate the rainfall data to the country level, whereas I retain the 2.5 degree longitude-latitude intersection (the node) as my unit of analysis. This makes it possible to explore variation in rainfall patterns across different regions of the same countries – something I do not do in the project described in this paper but plan to do in future work. It also makes it less likely that I will miss incidences of rainfall shocks that are limited to just one region of a country, and which might be obscured when rainfall levels are averaged across all nodes in the country. As the examples in Figures 8 and 9 make clear, these limited scope rainfall shortfalls can be a valuable source of natural experiments when they are located on or near national borders.
15

African Borders as Sources of Natural Experiments Daniel N. Posner
fluctuations in any single node-month estimate, I employ three month moving averages of estimated rainfall at each node.18 Thus, for example, my estimate for rainfall at a given node in March 1994 is the average of the values provided in the GPCP data set for rainfall at that node in February, March and April of that year. I define a rainfall shock as a shortfall in estimated precipitation at a given node that is more than two standard deviations less than the average estimated precipitation at that node during the same month across all years between 1980 and 2001.19 The reason I compare only with the same month (or, more accurately, with the same three month moving average) is to control for the fact that rainfall in Africa is highly variable across seasons. Comparing rainfall in a given location during the rainy season with rainfall in the same location during the dry season would obviously not be a good way to go about identifying precipitation shortfalls. The “greater than 2 standard deviation shortfall from the mean” threshold that I employ is somewhat arbitrary. But, if anything, it almost certainly under-counts rather than over-counts the incidence of drought. Given that my rationale for identifying rainfall shocks is to provide a means of selecting candidate cases for further analysis, this is a bias that I am comfortable with.20 Using this definition, I identify 607 cases of drought in the 86,328 node-months in the data set. I then superimpose these drought nodes onto a map of Africa to determine where they are physically located. Figures 6-9 provide examples of annual maps of rainfall shortfalls that were generated using from this procedure.21 I have chosen these particular years because they illustrate especially well that droughts do not respect country boundaries.
[Figures 6-9 Here]
Figures 6 and 7 provide maps of droughts in Africa in 1983 and 1990, respectively. In both years, significant droughts took place in large regions that affected multiple countries. The 1983 map (Figure 6) depicts the precipitation shortfalls during the first year of what ultimately became the major Sahelian famine that stretched from West Africa to Ethiopia in 1984. The 1990 map (Figure 7) depicts the rain shortfalls in Botswana and South Africa during the first year of what ultimately became the Southern African drought crisis of 1991-1992. Figures 8 and
18 The concern about year-to-year fluctuations in a given month’s rainfall stems from the possibility that the rains that ordinarily come in a particular month happen to come at the very beginning of the following month. If this were to happen, it might look like the month in question had abnormally low rainfall when what really happened is that the rains simply came a little late. Using the three month moving averages helps solve this potential problem. 19 I focus on precipitation shortfalls (i.e., droughts) rather than on both shortfalls and surpluses (i.e., floods) because floods, although equally devastating of crops and livelihoods, are very difficult to infer from precipitation rates. Significantly above average rainfall in an area with good drainage may actually improve people’s well-being, whereas the same level of precipitation in an area with poor drainage can precipitate a humanitarian crisis. Lacking detailed information on the topography or soil drainage capacity at each node, I have decided to focus exclusively on droughts (i.e., rainfall shortfalls), recognizing that this may lead to an undercounting of precipitation-related negative shocks. 20 If my goal were, instead, to sort all nodes in the data set into “crisis” and “non-crisis” categories, which I was then going to use to explain some crisis-dependent outcome (or which I was then planning to use as the dependent variable itself), then I would feel differently. 21 Although the data make it possible to draw monthly maps, these maps include all nodes in which a drought took place (i.e., all nodes at which estimated rainfall was more than two standard deviations below mean levels at that mode in that month) in the indicated year.
16

African Borders as Sources of Natural Experiments Daniel N. Posner
9 provide examples of much more geographically focused precipitation shortfalls that happen to fall on or near the boundaries between countries.
If we define a “case” as an instance of drought that affects the population on either side of a national border, and if we regard the arbitrary allocation of peoples to either side of such a border as a random assignment to different national treatments, then these four maps alone allow us to identify nearly two dozen distinct natural experiments. Some of them (for example the multi-country drought shown in Figure 6 or the drought at the Angola-Zambia-Congo tripoint and the and Zambia-Malawi-Tanzania-Mozambique rain shortfalls depicted in Figure 9) have the additional advantage of involving instances where the effects of the same negative shock can be explored across multiple countries (that is, across multiple treatments). My plan is to follow this procedure of case identification to identify all potentially exploitable natural experiments of this kind that occurred between 1980 and 2001.
Having identified my natural experiments, what hypotheses might they be used to test? Here are a few:
• It is well known that households in drought-prone environments engage in multiple strategies to hedge risk: they diversify their income sources by engaging in off-farm activities; they invest in political and social connections with people who control surplus capital; they enter credit markets; they invest in the education of their children, who, once educated, are sent off to find jobs in urban centers; they keep livestock as a buffer to insulate their consumption from negative rainfall shocks. Do households on different sides of the same border hedge risk differently? Can these differences be traced to political institutions, public policies, national credit markets, urban economic opportunities or other factors that differ on either side of the border? And do these different opportunities and strategies for risk hedging cause the same exogenous shock to have different effects on household incomes and well-being?
• Besley and Burgess (2002) have a well-known paper in which they show, using Indian
data, that state governments are more responsive to food production shortfalls and crop damage when newspaper circulation is higher and when electoral accountability is greater. Their finding reinforces Sen’s (1981) thesis that democracies (which are characterized by open elections and a free press) never have famines. Does this finding hold up in Africa? Will state responses to exogenous rainfall shocks differ on either side of a national border? And, if they do, will the degree of newspaper circulation and/or electoral accountability in each country predict the aggressiveness of the state response? More generally, what country-level characteristics cause sharp precipitation shortfalls to translate into famines, and what characteristics prevent them from doing so?
• Miguel (2005) and Oster (2004) both find an association between rainfall shocks and
witch killing. The logic is that rainfall shocks lead to food shortages which lead either to scapegoating (as Oster argues was responsible for the rash of witch killings in Renaissance Europe) or the strategic culling of unproductive and defenseless, but nonetheless food consuming, household members (as Miguel suggests is responsible for the branding, and killing, of elderly women as witches in rural Tanzania). Is the
17

African Borders as Sources of Natural Experiments Daniel N. Posner
connection between rainfall shocks and witch killing context dependent? Do identical communities located on either side of a national border and subject to the same rainfall shock generate the same patterns of scapegoating and/or strategic culling of old women? Or do other factors that may differ across national boundaries (for example, the strength of the rule of law, educational curricula, or the availability of relief food) affect the translation of economic crisis into witch killing?
• A fourth hypothesis is an outgrowth of the first. A common assumption – recently
challenged quite effectively by Kasara (2005) – is that, in Africa, people from the president’s ethnic group receive a greater share of state resources than people from other groups. To the extent that this is so, we would expect to see drought-affected regions that are from the same ethnic group as the country’s president (or that supported the president in the most recent election) experiencing a more aggressive response to the rainfall shock than drought-affected regions that are from a different ethnic group (or that supported the opposition).22 One of the benefits of using rainfall-induced crises to investigate patronage connections of this kind is that, given a sufficiently severe crisis, we can safely assume that the help being sought – food aid – is the only form of patronage that clients care about (at least at that moment). In most empirical studies that attempt to test assumptions about the ethnic basis of patronage flows, we can not rule out the possibility that the pattern of favoritism documented with respect to a particular patronage good – school funding, clinic building, road construction, the location of irrigation projects, tax rates, etc. – is offset by an opposite allocation of resources in an equally valued, but unexamined, policy domain. For example, a region that gets schools may not get roads. And if the researcher happens to have data on schools but not on roads, then the inference he/she will draw about which region benefits may be mistaken. Focusing on state responses to severe rainfall shocks helps sidestep this problem by allowing us to reasonably assume that, in the context of a food crisis, food aid will be the only patronage good that matters.23
While these are all fascinating hypotheses to investigate, my ability to test them will depend on data availability on the income sources, social networks, access to credit, asset ownership, and ethnic and political party affiliations of households in the drought affected areas, as well as information on newspaper circulation, electoral accountability, rule of law, educational curricula, and ethnic and party affiliations of presidents in the countries in which the drought affected regions are located. I will also, of course, need data from which I can make generalizations about the strength and impact of government policy responses to the crises. In many (perhaps most) of the cases that I identify, these data are likely to be unavailable. My next step, after generating my complete list of cases, is to create an inventory of all DHS, LSMS, and other data collected by the World Bank, ICRISAT, and other NGOs to match crisis nodes with the
22 Note that this is not a research question that requires cross-border comparisons. One could investigate this issue by comparing the aggressiveness of a state’s response across different regions within the same country. Nonetheless, a cross-border analysis has its advantages, as it ensures that the severity of the crisis (and thus the impetus for the state response) will be exactly equal across the units being compared. 23 One of the virtues of the Besley and Burgess (2002) paper is that, in focusing on the distribution of food aid and calamity relief expenditure in response to exogenous natural shocks (in their case, droughts, floods, earthquakes, and cyclones), it does precisely this.
18

African Borders as Sources of Natural Experiments Daniel N. Posner
necessary background information with which these hypotheses (and no doubt others) might be tested. Conclusion
Natural experiments are powerful tools in the social scientist’s tool kit, but they are hard to find. The vast number of African borders, and the arbitrary nature of most of them, makes Africa a particularly fruitful laboratory to exploit for this purpose. There is, however, a danger in natural experiments. As Achen (1986: 2) points out, “in a pure experiment [of which the natural experiments described in this paper are approximations] the researcher needs no deep understanding of the variables being studied. One can learn whether a cancer treatment is effective without understanding the nature of cancer.” Put slightly differently, “the natural experiment itself does not help answer the important question of what, exactly, is the treatment” (Dunning 2005). Thus, we may be able to conclude definitively that there is something about being exposed to the “Malawi treatment” that makes Chewas and Tumbukas less amicable or politically akin than those exposed to the “Zambia treatment” (or that there is something about being exposed to the “Côte d’Ivoire treatment” that increases the salience of religious identification). We may even be in a position to rule out a host of candidate explanations for these differences. But, absent further analysis and counterfactual argumentation, we do not know precisely what accounts for the variation in the outcomes we observe in each setting. We can suggest plausible arguments to account for the patterns of variation we uncover – and in the foregoing discussion I have tried to do this. But the evidentiary status of these arguments as “proof” is necessarily much weaker than the evidentiary status of the causal relationship that we are trying to account for. Users of natural experiments need to keep in mind that the method only gets them half way home. Natural experiments may establish the existence of a causal relationship but they leave unresolved the knotty issue of explaining why it exists. For that, the focus needs to shift from method back to theory.
19

African Borders as Sources of Natural Experiments Daniel N. Posner
Sources Cited
Achen, Christopher. 1986. The Statistical Analysis of Quasi-Experiments. Berkeley and Los
Angeles: University of California Press. Asiwaju, A. I. 1985. Partitioned Africans: Ethnic Relations and Africa’s International
Boundaries, 1884-1984. London: C. Hurst. Besley, Timothy and Robin Burgess. 2002. “The Political Economy of Government
Responsiveness: Theory and Evidence from India.” Quarterly Journal of Economics 117 (November): 1415-1451.
Brownlie, Ian. 1979. African Boundaries: A Legal and Diplomatic Encyclopedia. London: C.
Hurst. Chirwa, Wiseman C. 1998. “Democracy, Ethnicity and Regionalism: The Malawian Experience,
1992-1996.” In Democratization in Malawi: A Stocktaking, ed. Kings M. Phiri and Kenneth R. Ross. Blantyre: Kachere Books, 52-69.
Collier, David, Henry E. Brady, and Jason Seawright. 2004. “Sources of Leverage in Causal
Inference: Toward an Alternative View of Methodology.” In Henry E. Brady and David Collier. Rethinking Social Inquiry: Diverse Tools, Shared Standards. Lanham, MD: Rowman and Littlefield, 229-266.
Daddieh, Cyril K. 2001. “Elections and Ethnic Violence in Cote d’Ivoire: The Unfinished
Business of Succession and Democratic Transition.” African Issues 29 (1 & 2): 14-19. Dresang, Dennis. 1974. “Ethnic Politics, Representative Bureaucracy and Development
Administration: The Zambian Case.” American Political Science Review 68 (December): 1605-17.
Dunning, Thad. 2005. “Improving Causal Inference: Strengths and Limitations of Natural
Experiments.” Paper presented at the annual meeting of the American Political Science Association, Washington, DC, 31 August-5 September.
Elton, Catherine. 2005. “The Jivaro People Between Peru and Equador.” In Paul Ganster and
David Lorey, Borders and Border Politics in a Globalizing World. Lanham, MD: SR Books: 107-115.
Englebert, Pierre, Stacy Tarango, and Matthew Carter. 2002. “Dismemberment and Suffocation:
A Contribution to the Debate on African Boundaries.” Comparative Political Studies 35 (December): 1093-1118.
20

African Borders as Sources of Natural Experiments Daniel N. Posner
Gerber, Alan S., Donald P. Green, and Edward H. Kaplan. 2004. “The Illusion of Learning From
Observational Research.” In Ian Shapiro, Rogers M. Smith and Tarek Masoud. Problems and Methods in the Study of Politics. New York: Cambridge University Press: 251-273.
Gertzel, Cherry, Carolyn Baylies, and Morris Szeftel. 1984. The Dynamics of the One-Party
State in Zambia. Manchester, UK: Manchester University Press. International Crisis Group. 2003. “Côte d’Ivoire: The War is Not Yet Over.” ICG Africa Report
No. 72 (28 November). Kasara, Kimuli. 2005. “Tax Me If You Can: Ethnic Geography, Democracy, and the Taxation of
Agriculture in Africa.” Working Paper. Stanford University. Kaspin, Deborah. 1995. “The Politics of Ethnicity in Malawi’s Democratic Transition.” Journal
of Modern African Studies 33 (December): 595-620. Laitin, David D. 1986. Hegemony and Culture: Politics and Religious Change among the
Yoruba. Chicago: University of Chicago Press. McDermott, Rose. 2002. “Experimental Methods in Political Science.” Annual Review of
Political Science 5: 31-61. Miguel, Edward. 2004. “Tribe or Nation? Nation-building and Public Goods in Kenya versus
Tanzania.” World Politics 56 (April): 327-62. Miguel, Edward. 2005. “Poverty and Witch Killing.” Review of Economic Studies 72 (October):
1153-1172. Miguel, Edward, Shanker Satyanath and Ernest Sergenti. 2004. “Economic Shocks and Civil
Conflict: An Instrumental Variables Approach.” Journal of Political Economy 112 (August): 725-753
Miles, William F.S. 1994. Hausaland Divided: Colonialism and Independence in Nigeria and
Niger. Ithaca: Cornell University Press. Miles, William F.S., and David Rochefort. 1991. “Nationalism versus Ethnic Identity in Sub-
Saharan Africa.” American Political Science Review 85 (June): 393-403. Miles, William F.S. 2005. “Development, Not Division: Local Versus External Perceptions of
the Niger-Nigeria Boundary.” Journal of Modern African Studies 43 (June): 297-320. Oster, Emily. 2004. “Witchcraft, Weather and Economic Growth in Renaissance Europe.”
Journal of Economic Perspectives 18 (Winter): 215-228.
21

African Borders as Sources of Natural Experiments Daniel N. Posner
Passi, Anissi. 2005. “Boundaries as Social Practice and Discourse: The Finnish-Russian Border.”
In Paul Ganster and David Lorey, Borders and Border Politics in a Globalizing World. Lanham, MD: SR Books: 117-136.
Posner, Daniel N. 1995. “Malawi’s New Dawn.” Journal of Democracy 6 (January): 131-145. Posner, Daniel N. 2004. “The Political Salience of Cultural Difference: Why Chewas and
Tumbukas are Allies in Zambia and Adversaries in Malawi.” American Political Science Review 98 (November): 529-545.
Posner, Daniel N. 2005. Institutions and Ethnic Politics in Africa. New York: Cambridge
University Press. Sahlins, Peter. 1989. Boundaries: The Making of France and Spain in the Pyrenees. Berkeley
and Los Angeles: University of California Press. Sen, Amartya. 1981. Poverty and Famines. Oxford: Oxford University Press. Toungara, Jeanne Maddox. 2001. “Ethnicity and Political Crisis in Cote d’Ivoire.” Journal of
Democracy 12 (July): 63-72. Vail, Leroy, and Landeg White. 1989. “Tribalism in the Political History of Malawi.” In The
Creation of Tribalism in Southern Africa, ed. Leroy Vail. Berkeley and Los Angeles: University of California Press, 151-92.
22

African Borders as Sources of Natural Experiments Daniel N. Posner
Table 1. The Determinants of Chewa-Tumbuka Relations in Zambia and Malawi
Believes others in the area would not vote
for a presidential candidate from the
other group
Says they would not vote for a
presidential candidate from the
other group
Says they would not have married
(have considered marrying) a member
of the other group
Says that, in general, marriage to a person from the
other group is frowned upon
(1) (2) (3) (4) Country 2.05***
(0.37) 1.18*** (0.35)
1.61*** (0.38)
2.10*** (0.41)
Tribe 0.81** (0.36)
0.93*** (0.35)
1.78*** (0.38)
0.58 (0.37)
Gender -0.66* (0.36)
-0.79** (0.35)
-1.33*** (0.38)
-0.94** (0.38)
Age 0.33 (0.22)
0.04 (0.21)
0.16 (0.22)
-0.01 (0.22)
Number of Differences
0.06 (0.19)
-0.08 (0.19)
0.004 (0.19)
0.16 (0.20)
Constant -1.93*** (0.51)
-1.32*** (0.48)
-1.46*** (0.50)
-2.12*** (0.55)
Pseudo R2 0.19 0.11 0.22 0.18 N 176 176 176 176
Notes: Logit estimation with standard errors in parentheses. *p < .05; ** p < .01; *** p < .001. “Country” is coded 0 for Zambia, 1 for Malawi. “Tribe” is coded 0 for Chewa, 1 for Tumbuka. “Gender” is coded 0 for female, 1 for male.
23

African Borders as Sources of Natural Experiments Daniel N. Posner
Table 2: Descriptive Statistics for Burkinabé and Ivoirian Research Sites
Burkina Faso Côte d’Ivoire Sample size 100 97 Percent urban 50 52 Percent male 53 51 Percent age 18-27 35 35 Percent age 28-45 34 35 Percent age 46 and up 31 30 Avg. number of years of schooling 3.7 3.5 Avg. number of years spent living in survey village/town 25.2 20.0 Percent who say they vote in national elections 89 74 Percent who receive national news every day 46 39 Percent who receive national news 1-2 times/wk 11 10 Percent whose standard of living is “high” 8 15 Percent whose standard of living is “medium” 67 58 Percent whose standard of living is “low” 25 27 Percent Muslim 37 66 Percent Catholic 36 11 Percent Protestant 4 4 Percent Animist 22 14
24

African Borders as Sources of Natural Experiments Daniel N. Posner
Table 3: Determinants of Religious Identification in Burkina Faso and Côte d’Ivoire
Ranks religion
as most important identity
Ranks religion as 1st or 2nd most
important identity
Feels closer to someone from his/her country who is not of
his/her religion
Says he/she could marry a person of a different
religion (1) (2) (3) (4)
Country 1.19** (0.51)
1.50*** (0.42)
-1.55*** (0.40)
-1.22*** (0.46)
Urban/rural area 0.54 (0.65)
-0.05 (0.53)
0.02 (0.53)
0.83 (0.61)
Gender -0.25 (0.43)
-0.30 (0.36)
0.11 (0.35)
1.34*** (0.40)
Age 18-27 1.00* (0.59)
0.14 (0.45)
0.15 (0.46)
1.02** (0.51)
Age 28-45 1.27** (0.56)
0.67 (0.43)
0.35 (0.43)
0.48 (0.45)
Years of schooling
-0.04 (0.05)
-0.02 (0.04)
0.05 (0.04)
0.14** (0.06)
Muslim 1.11 (0.75)
1.48** (0.63)
-0.82 (0.60)
-1.01 (0.67)
Catholic 0.50 (0.76)
1.23** (0.60)
-0.33 (0.53)
-1.18** (0.57)
Protestant 1.24 (1.11)
0.49 (1.04)
-1.55 (1.00)
-1.58 (1.06)
Standard of living -0.22 (0.37)
0.20 (0.30)
0.26 (0.31)
0.46 (0.33)
Constant -4.02*** (1.25)
-3.12*** (1.00)
1.26 (0.89)
-0.23 (0.92)
Ethnic group fixed effects
Yes
Yes
Yes
Yes
Pseudo R2 0.14 0.14 0.15 0.24 N 195 195 184 194
Notes: Logit estimation with standard errors in parentheses. *p < .05; ** p < .01; *** p < .001. The omitted age category is 46 years and older. The omitted religious category is Animist. “Country” is coded 0 for Burkina Faso, 1 for Côte d’Ivoire. “Urban/rural” is coded 0 for rural, 1 for urban. “Gender” is coded 0 for female, 1 for male. “Standard of living” is coded 1 for “low,” 2 for “medium,” 3 for “high.” Ethnic group fixed effects includes dummy variables for membership in the Lobi, Gouin, Mossi, Senoufo, or Dioula tribes.
25

African Borders as Sources of Natural Experiments Daniel N. Posner
Figure 1: Research Sites on the Zambia-Malawi Border
TANZANIA
MOZAMBIQUE
Mkanda, Zambia
Mwase Lundazi Kapopo
Mkanda, Malawi
MALAWI
ZAMBIA
26

African Borders as Sources of Natural Experiments Daniel N. Posner
Figure 2: Chewa-Tumbuka Relations in Zambia and Malawi Compared
2
2124 24
6
61
45
55
38
14
0
10
20
30
40
50
60
70
percent making negativestatement about the othergroup when asked what, ifanything, makes Chewasdifferent from Tumbukas
percent saying others herewould not vote for a
Presidential candidate fromthe other group
percent saying they would not vote for a Presidentialcandidate from the other
group
percent saying they would not marry a person from the
other group
percent saying that marriageto members of the othergroup is frowned upon
perc
ent
Zambia Malawi
27

African Borders as Sources of Natural Experiments Daniel N. Posner
Figure 3: Research Sites on the Côte d’Ivoire-Burkina Faso Border
BURKINA FASO MALI
Niangoloko
Ouangolodougou
CÔTE D’IVOIRE
28
Boussoukoula
GHANA
Kalamon

African Borders as Sources of Natural Experiments Daniel N. Posner
Figure 4: Social Identifications in Burkina Faso and Côte d’Ivoire Compared
10
19
42
16
6 7
23
28
11
25
20
8 8
50
0
10
20
30
40
50
Religious Ethnic National Occupation Gender Other Religious (1stor 2nd)
perc
ent
Burkina Faso Cote d'Ivoire
29

African Borders as Sources of Natural Experiments Daniel N. Posner
Figure 5: Changes in Religiosity in Burkina Faso and Côte d’Ivoire Compared
17
41 42
12
33
55
0
10
20
30
40
50
60
Less Same More
perc
ent w
ho p
ray
less
, sam
e, o
r mor
eco
mpa
red
to te
n ye
ars a
go
Burkina Faso Cote d'Ivoire
30

African Borders as Sources of Natural Experiments Daniel N. Posner
Figure 6: Estimated Droughts in Africa, 1983
Note: Marked nodes had estimated rainfall that was > 2 standard deviations less than the mean estimated rainfall at that node during the same month over the 22 years (1980-2001) for which GPCP data are available.
31

African Borders as Sources of Natural Experiments Daniel N. Posner
Figure 7: Estimated Droughts in Africa, 1990
Note: Marked nodes had estimated rainfall that was > 2 standard deviations less than the mean estimated rainfall at that node during the same month over the 22 years (1980-2001) for which GPCP data are available. .
32

African Borders as Sources of Natural Experiments Daniel N. Posner
Figure 8: Estimated Droughts in Africa, 1993
Note: Marked nodes had estimated rainfall that was > 2 standard deviations less than the mean estimated rainfall at that node during the same month over the 22 years (1980-2001) for which GPCP data are available.
33

African Borders as Sources of Natural Experiments Daniel N. Posner
34
Figure 9: Estimated Droughts in Africa, 1999
Note: Marked nodes had estimated rainfall that was > 2 standard deviations less than the mean estimated rainfall at that node during the same month over the 22 years (1980-2001) for which GPCP data are available.