triarchic or septarchic? - uncovering the triarchic
TRANSCRIPT

Modeling the TriPM 1
Triarchic or Septarchic? - Uncovering the Triarchic Psychopathy Measure’s (TriPM) Structure
Sandeep Roy
University of North Texas
Colin Vize
Purdue University
Kasia Uzieblo
Ghent University, Ghent
De Forensische Zorgspecialisten, Utrecht
Josanne D. M. van Dongen
Erasmus University, Rotterdam
Joshua Miller
University of Georgia
Donald Lynam
Purdue University
Inti Brazil
Radboud University, Nijmegen
Dahlnym Yoon
FernUniversität in Hagen
Andreas Mokros
FernUniversität in Hagen
Nicola Gray
Swanses University
Robert Snowden
Cardiff University
Craig S. Neumann
University of North Texas
Author Note.
Sandeep Roy and Colin Vize are joint first authors. Correspondence: Sandeep Roy and Craig
Neumann, Psychology, University of North Texas, Denton, TX. 76203., or Colin Vize, Purdue
University, 703 3rd Street, West Lafayette, IN Email: [email protected];
[email protected]; [email protected];
In press, Dec. 2019, Personality Disorders: Theory, Research, Treatment

Modeling the TriPM 2
Abstract
The Triarchic Psychopathy Measure (TriPM) is based on a three-dimensional conceptual model,
though few studies have directly tested if it can be supported by a three-factor structure. The
current study used a large community sample (N=1,064, 53% males, mean age = 34) to test the
structure of the TriPM via exploratory and confirmatory factor analysis, along with four
community replication samples from North American and Europe (N’s = 511-603, 33-49%
males) and one European male offender sample (N = 150). Three of these samples were also
used to model the correlations between relevant external correlates and the original TriPM
factors versus emergent factors to examine the cost of mis-specifying TriPM structure. The
model analyses did not support a three-factor model (CFI = .76, RMSEA = .08), revealing a
number of items with limited statistical information, but uncovered a seven-factor structure
(CFI=.92, RMSEA=.04). From the majority of Boldness, Meanness, and Disinhibition scale
items, respectively, emerged three factors reflecting: Positive Self-image, Leadership, and Stress
Immunity; two factors tapping Callousness and Enjoy Hurting; and two factors involving trait
Impulsivity and overt Antisociality. Further, the Enjoy Hurting and overt Antisociality factors
were more strongly correlated with one another than with the other scales from their home
domains (Callousness and Impulsivity). All seven emergent factors were differentially associated
with the external correlates, suggesting that the three original TriPM factors do not optimally
represent the conceptual model underlying the TriPM.

Modeling the TriPM 3
Introduction
Psychopathy is a prominent focus of personality disorder research, with continuing debates on
which traits are essential to the construct. Thus, there are different conceptual and empirical
models of psychopathy and measures designed to operationalize the models (Hare & Neumann,
2008; Lynam et al., 2013; Patrick, Fowles, & Krueger, 2009). One recent model and measure is
Patrick and colleagues’ Triarchic Model along with the Triarchic Psychopathy Measure (TriPM;
Patrick et al., 2009; Patrick, 2010; Patrick & Drislane, 2015). In the triarchic conceptualization,
psychopathy is represented by three domains: Boldness, Meanness, and Disinhibition (Patrick &
Drislane, 2015; see Sleep, Weiss, Lynam, & Miller, 2019 for a meta-analytic review).
Disinhibition reflects a wide diversity of impulse control difficulties such as lack of planning and
foresight, impaired regulation of affect and urges, insistence on immediate gratification, and
difficulties with behavioral restraint (Patrick et al., 2009; Patrick & Drislane, 2015). Meanness is
proposed to index deficient empathy and lack of close attachments, as well as disdain for and
exploitation of others (Patrick et al., 2009), highlighting different types of ‘meanness’ (i.e., poor
empathy vs. exploitation). Boldness is thought to reflect traits involving confidence, social
assertiveness, fearlessness, emotional resiliency, and adventuresomeness (Patrick & Drislane,
2015). Given this wide array of item content, it is not surprising that new research raises
questions about the TriPM’s structural integrity (e.g., Shou et al., 2017; Somma et al., 2018), and
thus the viability of the TriPM conceptual model.
The TriPM was created by selecting items from two measures, the Boldness Inventory
(BI; Patrick et al., 2019), which was unpublished at that time, and the Externalizing Spectrum
Inventory (ESI: Krueger, Markon, Patrick, Benning, & Kramer, 2007). Both the ESI and the BI
were developed using parallel analytic approaches (e.g., multiple assessment waves, item-

Modeling the TriPM 4
response theory methods, confirmatory modeling). The 19-items of the TriPM-Boldness scale
were taken from the 130-item BI, which was developed to fully capture the boldness construct
and its boundaries, while also examining how a broader boldness construct related to other
operationalizations of boldness, such as the Fearless-Dominance (FD) factor within the
Psychopathic Personality Inventory-Revised (PPI-R; Lilienfeld & Widows, 2005). Patrick and
colleagues (2019) found a bifactor model best fit the BI with the nine subscales (e.g., Social
Assurance, Dominance, Persuasiveness, Self-confidence, Optimism, Resilience, Valor,
Intrepidness, and Tolerance for Uncertainty) loading onto a general Boldness factor with the
latter six subscales listed above also having residual loadings on two subfactors indexing
Emotional Stability and Venturesomeness. The general factor and subfactors evidenced small to
small-moderate correlations with the facets of the PCL-R in an offender sample (rs = -.04-.30)
and expectedly robust links with PPI-R FD scales (rs = .51-.84) in a student sample (Patrick et
al., 2019). The 19 items selected for the TriPM-Boldness scale were drawn from each of the 9
facets of the BI, with three items being drawn from the Persuasiveness facet and two items from
the remaining eight facet scales. The TriPM-Boldness scale was strongly related to the total BI
scale (r = .95; Patrick et al., 2019) and the FD factor of the PPI-R (r = .82; Patrick et al., 2019).
The 20-item Disinhibition and 19-item Meanness TriPM scales were created by selecting
items from subscales of the 415-item ESI, which was designed to assess the traits and behaviors
(e.g., substance use, aggression) that fell under the externalizing domain as identified in
hierarchical models of psychopathology. The seven subscales of the ESI that provided items for
the TriPM-Disinhibition scale were those that had their strongest loading on the general
disinhibition factor of the ESI’s bifactor model. The TriPM-Meanness scale was created using
items from the six ESI subscales that had notable loadings on both the general disinhibition
Modeling the TriPM 5
factor as well as the ESI callous-aggression subfactor. Of the 19 TriPM-Meanness items, 14 of
these items were selected from the two ESI subscales (Relational Aggression and Empathy) that
had their largest loadings on the callous-aggression subfactor. Patrick (2010) reported Meanness
and Disinhibition were moderately correlated (r = .45; Drislane, Patrick, & Arsal, 2014; see also
Patrick et al., 2013), though other studies find large correlations between TriPM Meanness and
Disinhibition (e.g., rs = .79 and .64; Patton, Smith, & Lilienfeld, 2019; Crego & Widiger, 2014).
Meta-analytic findings affirm these scales are strongly inter-related (meta r = .53; Sleep et al.,
2019). The TriPM Meanness and Disinhibition scales are more modestly correlated with
Boldness (rs of .23 and -.10, respectively; Drislane, Patrick, & Arsal, 2014).
The informative value of items in models of psychopathy
Item-level analyses of psychological inventories are essential considering that individuals
are responding to items that are empirically tied to theoretical latent constructs (Reise, 1999). For
psychopathy scales, item-level latent variable models provide quantitative information on how
well items discriminate individuals with different degrees of psychopathic propensity, and which
items that are essential for statistical representations of the conceptual domains they are designed
to tap (Hare & Neumann, 2008). A four-factor Psychopathy Checklist-based model (PCL-R;
Hare, 2003; Hare, Neumann, & Mokros, 2018) is strongly supported across different item sets,
assessment approaches, and sample types (Neumann, Hare & Pardini, 2015). A Five-Factor
Model (FFM) conceptualization of psychopathy (Collison, Miller, Gaughan, Widiger, & Lynam,
2016) and the Youth Psychopathic Inventory (YPI; Neumann & Pardini, 2014) have also
received support via item-level latent variable modeling. Relatedly, item-level models are
helping to uncover the structure of callous-unemotional traits (CU; Hawes et al., 2014), and
develop the Proposed Specifier for Conduct Disorder (PSCD; López-Romero et al., 2019).
Modeling the TriPM 6
Conversely, studies raise questions regarding the TriPM items (Shou et al., 2017), and the
PPI on which the TriPM is based in part (Neumann et al., 2013b). Moreover, with respect to BI
development (Patrick et al., 2019), from which TriPM Boldness items were selected, item-level
latent variable analyses were never conducted to assess the purported unidimensionality of the
Boldness facets. Confirmatory factor analytic (CFA) approaches have raised concerns regarding
the unidimensionality and clinical utility of the PPI FD factor, closely aligned with Boldness, and
the recent DSM-5 psychopathy specifier based FD/Bold traits (Miller, Lamkin, Maples-Keller,
Sleep, & Lynam, 2018; Neumann et al., 2013b). Items also provide information about
endorsement levels. Based on mean item scores, community studies, unsurprisingly, find
endorsement levels at the low end of the psychopathy spectrum (Colins, Fanti, Salekin, &
Andershed, 2017; van Dongen, Drislane, Nijman, Soe-Agnie, & van Marle 2017; Neumann &
Hare, 2008; Patton et al., 2018). However, low endorsement levels are also found in TriPM
studies with forensic (van Dongen et al., 2017) and offender samples (Stanley, Wygant, &
Sellbom, 2014). Such results could be due to the fact that some items provide little item
discrimination information, and thus add limited value to the overall scale. One of the benefits of
item-level modeling is that shorter tests can perform better than traditional assessments with
longer item sets, which is due to the amount of parametric information provided by the items
(Embretson, 1996). Thus, dropping poorer preforming items can enhance self-reports’ structural
properties (e.g., item discrimination).
TriPM item-level latent structure
Three studies have investigated the item-level properties of the TriPM and consistent
problems emerge (Latzman et al., 2018; Shou et al., 2017; Somma et al., 2018). In a Chinese
translation of the TriPM, the Boldness scale did not appear to be unidimensional, and the

Modeling the TriPM 7
Meanness and Disinhibition scales contained items that provided limited information (Shou et
al., 2017). Latzman and colleagues (2018) found evidence of TriPM item cross-loadings and
correlated residual error terms were required to fit an item-level three-factor model, suggesting
that additional underlying factors are present within the item set. Latzman et al. (2019) reported
that the use of correlated residuals was needed to account for “item co-dependencies” (p. 7) and
wrote TriPM items “may not be optimal… for modeling the triarchic model dimensions.” (p. 19).
Somma et al. (2018) sought to identify additional factors that exist within the TriPM item
set, some of which involve reversed keyed items. In their dimensionality analyses of each
separate TriPM domain, no scale evidenced unidimensionality; multiple dimensions were
evident in all three TriPM scales. These authors also tested single scale bifactor models, but did
not examine a bifactor model across the entire TriPM item set. Like Latzman et al. (2018),
Somma et al. also employed correlated residual errors within a correlated three-factor model in
order to achieve adequate fit. If, as reported, they allowed error correlations between items
loading .20 or greater on the same factor, to account for distinct subfactor loadings, then the final
model included 121 such error correlations; if the decision was based on loadings of |.20| or
greater then 174 such error correlations were estimated. Using model modifications (correlated
errors) to achieve ‘good’ fit is generally problematic (Gerbing & Anderson, 1984; Chou & Huh,
2012), particularly when this many are allowed. Moreover, correlated errors ‘hide’ sources of
meaningful covariance whose effects on other constructs are unknown. Finally, Somma et al.
(2018) did not consider limitations of the bifactor model (Bonifay, Lane, & Reise, 2017; Reise,
Kim, Mansolf, & Widaman, 2016), or test alternative multidimensional models.
Item-level modeling has advanced psychopathy research (Hare, Neumann, & Mokros,
2018). A soundly articulated latent structure provides evidence of internal construct validity and
Modeling the TriPM 8
understanding of the dimensions that underlie a given measure (Strauss & Smith, 2009). As
noted by Smith and colleagues (2009), “To the degree that one uses a single score from a target
measure that includes multiple dimensions … one’s construct validation/theory test has
theoretical uncertainty built in. Such a test is likely to have reduced scientific value.” (p. 273). In
other words, when multidimensional scales are treated as unidimensional, there is limited value
in embedding them within a nomological network, given that the veracity of the associations
with external correlates will be ambiguous.
The current study tested the structure of the TriPM via item-level exploratory and
confirmatory factor analyses (EFA, CFA) in multiple, large, online, community and offender
samples from North America and Europe. We expected the item-level three-factor model would
evidence poor fit based on previous research (Latzman et al., 2018; Shou et al., 2017; Somma et
al., 2018). Following the methodology of Somma et al. (2018), we initially examined the items
within each TriPM scale separately and expected multiple dimensions (factors) would emerge
from each of the three TriPM domains. In this way, we sought to replicate the Somma et al.
findings of TriPM scale multidimensionality, but also uncover the nature of these dimensions.
The individual scale analyses were followed-up with simultaneous analyses of all 58-items.
Consistent with model-based theory (Reise, 1999), we expected that the items within the new
emergent factors would evidence stronger discrimination parameters (i.e., factor loadings), and
this would help separate offender from non-offender participates. Also, given the diversity of
TriPM item content, we expected that the new factors would evidence differential associations
with external correlates. While our initial approach involved analysis of each separate TriPM
scale, our overall goal was to identify and test omnibus multidimensional models that entailed all
TriPM items with meaningful information, and thus CFA provided an optimal approach.
Modeling the TriPM 9
Method
Sample Descriptions. Six large U.S. or European samples were used for the study.
Sample 1. Sample 1 was made up of participants from Amazon’s Mechanical Turk
platform (MTurk) (N = 1064; 53% males). The mean age of the sample was 34.12 (SD = 10.49).
Participants were White (77%), African-American (7.4%), Hispanic (5%), Asian (6.2%) or other
(4.6%) with a 4-year college degree (38%), some college (30%), 2-year college degree (10%),
high school degree (9.3%) or graduate education (12.7%). To insure data quality, validity check
questions were embedded in the questionnaires. Participants’ data were only included if all four
validity questions were answered correctly which pertained to the majority of cases (98%).
Sample 2. An MTurk sample (N = 603; 37% males) with mean age 37.04 (SD = 11.74).
Race/ethnicity were reported non-exclusively as White (83%), African-American (9.8%), Asian
(7.8%), Native-American (3.5%), or other 0.8%. The majority had some form of college (53.3%)
or high school (36.8%) education or below (10%).
Sample 3. An MTurk sample (N = 591; 38% males) with mean age 36.95 (SD = 11.74)
and either a college (37.2%), high school (36.9%), or advanced (13.7%) education, and some
below high school education (10.2%).
Sample 4. A community sample (N = 511; 33% males) with mean age of 28.54 (SD =
13.03) and was predominantly Belgian (97%) with a small percent a different nationality (3%).
The majority of participants had a high school education (70%), followed by those with a
bachelor (21%), masters (6.5%) or more advanced/other degree (2.5%).
Sample 5. This community sample (N = 495; 49% males) was described in van Dongen
et al., (2017). Mean age was 27.70 (SD = 13.09). Participants were primarily European (95.2%)
or from Central/South America (2%), Middle East/Africa (1.7%), or Asia (1.1%).
Modeling the TriPM 10
Sample 6. This European offender sample (N = 150; 100% males) is part of an on-going
larger study described initially in research by Gray and colleagues (2019). The male offenders,
approximate mean age of 45, were primarily White (76%) or Black (5%) British citizens versus
mixed or other race/ethnicities (19%). In terms of education, 40% had achieved General
Certificate of Education (GCE) Ordinary Level, 7.1% achieved A-levels, 1.4% formal degree,
8.6% some other form of certificate through prison, and 42% had no formal certificate. The
majority of the sample (80%) was either single or separated/divorced. Based on index offenses,
the sample evidenced a range of criminal offenses including, murder, attempted murder, rape,
wounding, grievous bodily harm, robbery, and other offenses.
External Correlates. Samples 1-3 also contained a number of well-validated external
correlates that have been used in previous research. Positive and negative affect were assessed
with the PANAS (Watson et al., 1988). The Alcohol Use Disorders Identification Test (AUDIT;
Saunders et al., 1993) assessed alcohol use. The Trauma History Questionnaire (THQ; Green,
1996) assessed trauma experiences. General personality was assessed via the IPIP-NEO 120
(Maples et al., 2014). Antisociality was assessed via the Crime and Analogous Behavior scale
(CAB; Miller & Lynam, 2003) or the SRP-SF antisocial facet (Paulhus, Neumann, Hare, 2017).
Data Analytic Plan. Latent variable modeling (EFA/CFA) was carried out via Mplus
(Muthén & Muthén, 2013), using robust weighted least squares estimation (WLSMV) given the
ordinal TriPM items. First, in sample 1, a three-factor TriPM model with all 58 items was tested
via CFA. Items were specified to load directly onto their respective factor, and the factors were
allowed to freely correlate. Sample 1 was also used to run separate CFAs for each TriPM domain
(Boldness, Meanness, Disinhibition) to test if they were indeed unidimensional. Anticipating
poor fit for the three-factor model, and the single factor CFAs, sample 1 was used to follow-up
Modeling the TriPM 11
with separate item-based EFAs for each TriPM domain with geomin (oblique) rotation, a
preferred and the standard Mplus approach for arriving at clean factor structure solutions
(Schmitt & Sass, 2011). The goal of the three EFAs was to identify items that evidenced
substantial parametric information versus those with little information, similar to what Patrick et
al. (2013) did in their ESI research. Since factor loadings are comparable to IRT alpha
(discrimination) parameters (Reise, 1999), we identified items with large factor loadings and
dropped items with subpar loadings (i.e., only 16% or less of item variance accounted for),
and/or substantial cross-loadings onto other factors which significantly hamper interpretation of
factors (Reise et al., 2010). The EFAs were evaluated via standard model fit indices provided by
Mplus. The viability of the EFA results were checked via CFAs for each TriPM domain, using
sample 1, and without the poor performing items, specifying a model that corresponded to the
best EFA solution. We also employed exploratory structural equation modeling (ESEM), a
hybrid of EFA and CFA, to test whether the best fitting ESEM solution using all 58-items
corresponded with the aggregate total of factors extracted from the separate EFAs.
Next, an omnibus item-level CFA was specified with all identified emergent factors
extracted from EFAs. The empirically derived omnibus model was then tested with the
replication samples (#’s 2-6). For our penultimate CFAs, separate models were specified to
examine how Patrick’s (2010) original three TriPM factors versus the new factors derived from
our EFA/CFA analyses were associated with the external correlates (samples 1-3). In this way,
we examined the advantages of modeling the multidimensionality within the original TriPM
domains. Differences between latent correlations were tested via Steiger’s method (1980).
Finally, supplementary CFAs were tested to gauge the viability of potential alternative
TriPM models. Somma et al. (2018) only examined separate bifactor models for each TriPM
Modeling the TriPM 12
scale, and so we examined a full 58-item bifactor model. All items we set to load on a general
factor and items also loaded onto their respective TriPM specific (or group) subfactor, with the
general and specific factors set to be orthogonal. In addition, we used a formal modeling
approach to address potentially unique TriPM item covariances. Somma et al. (2018) used
correlated residual errors to accommodate “commonalities in substantive content and in keying
and wording of items” (p. 23). Following the approach of Podsakoff, MacKenzie, Lee, and
Podsakoff (2003) we controlled for the potential effect of the 17 reverse-coded TriPM items
through a latent method factor. This factor represented common method variance and was
orthogonal to the three common TriPM trait factors. 1
To assess model fit a two-index strategy was adopted (Hu & Bentler, 1999), using the
incremental Comparative Fit Index (CFI) and the absolute Root Mean Square Error of
Approximation (RMSEA) index. We relied on the traditional CFI > .90 and RMSEA < .08 as
indicative of acceptable model fit to avoid falsely rejecting viable latent variable models, since
model complexity increases the difficulty of achieving conventional fit (West, Taylor, & Wu,
2012). In terms of comparing models, we did not rely on the traditional approach of using
differences in X2 since large N’s can produce significant X2
values even when the discrepancies
between two models are trivial (West et al., 2012). West et al. suggest using guidelines laid out
by Cheung and Rensvold (2002) to assess statistical differences in model fit. If the incremental
change in the comparative fit index (ΔCFI) between one model and a nested, more-constrained,
model is ≤.01, then the two models do not differ in statistical fit. Lastly, Hedge’s g was used to
assess how offenders differed from non-offenders (aggregated sample) with respect to models.
1 Note that we also re-tested the originally proposed three-factor model without the poor performing items. Results
continued to show poor fit for this model. See Table 1, Reduced item set supplementary (CFA), 3-factor Omnibus.
Modeling the TriPM 13
Results
Descriptive statistics are displayed in Supplementary Table S1. The TriPM scale scores
are presented in mean item scale format to show average trait endorsement. Consistent with other
community studies, endorsement levels were at the low end of the psychopathic spectrum. Since
coefficient alpha is not an indicator of scale unidimensionality (Schmitt 1996), we relied on
mean inter-item correlations (MICs). Clark and Watson (1995) recommend MICs fall within .15-
.50. The Boldness and Disinhibition scales manifested relatively low scale homogeneity,
particularly for the three European samples.
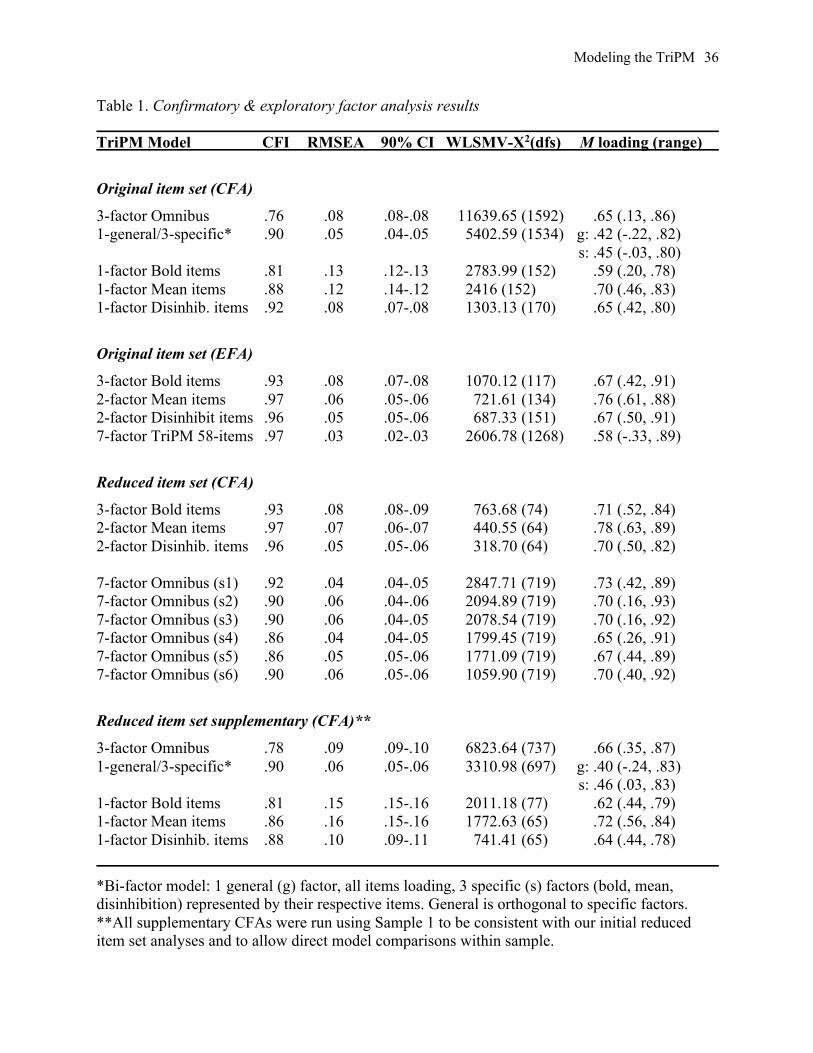
Original item set: TriPM three- and single-factor CFA results. Modeling results are
displayed in Table 1. As predicted, using the full 58 items and proposed item-to-factor
specifications, model fit for the three-factor TriPM did not reach acceptable fit for both indices
(see Table 1, 3-factor Omnibus). The same results were found with the replication samples
(CFI’s = .72-.75; RMSEA’s = .06-.07). Similar to Somma et al. (2018), there were a number of
items with poor factor loadings (e.g., Boldness items 4, 47; Meanness, 2, 17; Disinhibition, 3,
27). See also mean item loading range in Table 1. The overall mean factor loading indicated that
less than half of the item variance was accounted for by the latent factors (i.e., .652 = 42%),
indicating that the items provide low-moderate psychometric information. As displayed in Table
1, the single factor CFAs for the Boldness and Meanness factors also demonstrated poor fit. The
Disinhibition factor did show acceptable model fit, however, the mean item loading indicated
this factor was not able to account for the majority of item variance (i.e., 42%).
Initial EFA and revised TriPM CFA results. As shown in Table 1, using Sample 1, we
found three factors could be extracted from the Boldness items, with the solution providing
acceptable fit and factors reflecting Leadership, Stress Immunity, and Positive Self-image. The

Modeling the TriPM 14
initial EFAs revealed that two factors each were evident in the Meanness and Disinhibition item
sets, with each solution showing excellent fit. The Meanness factors reflected Callousness and
Enjoy Hurting. The two factors extracted from the Disinhibition item set reflected Impulsivity
and overt Antisociality.2 The EFA results revealed a number of items meeting criteria for being
dropped (#’s Boldness: 4, 7, 22, 25, 47; Meanness: 8, 17, 20, 39, 48, 55; Disinhibition: 9, 18, 27,
30, 37, 51, 56). These items provide little statistical information and limit the structural integrity
of the TriPM item set; many were similar to those reported in Somma et al. (2018, see Table 3).
As a check on the seven factor solution, an ESEM was conducted with all 58 items, which
indicated a 7-factor solution produced the best fit (CFI = .97, RMSEA = .03), better than a 6-
factor solution (ΔCFI = .02), and no difference from an 8-factor solution (ΔCFI = .00).
Supplementary Table S2 displays the ESEM item-to-factor results which were generally in-line
with the single factor EFAs, and also highlight the problematic nature of many items.
Finally, follow-up CFAs of the initial EFA results were conducted without the
problematic items. These CFAs showed good fit (see Reduced item set results Table 1). The
mean factor loadings indicated that the items had strong discrimination information and the new
factors accounted for approximately 50% or more of item variance. Figures 1-3 display item
content and standardized CFA parameters for the new seven factors.
Omnibus CFA, replication results, & group comparisons. The omnibus CFA, seven
new factors in one model, sans the poor performing items, resulted in good fit for sample 1, and
generally acceptable fit for the five replication samples (see Table 1, Revised item set results).3
2 The ΔCFI’s (.05-.09) provided evidence for our choice of EFA solutions. For Boldness items, EFA fit for 1- and 2-
factor solutions, and each 1-factor EFA solution for Meanness and Disinhibition items, were poor (CFI’s = .81-.88;
RMSEA’s = .13-.11). Extraction of additional factors for all scales increased item cross-loadings.
3 To allow direct comparison between the original three-factor TriPM model and the seven-factor model, we re-
tested the former without the poorer performing items, since these items were omitted from the seven-factor model.
As shown in Table 1, the seven-factor model outperformed the reduced item set three-factor model (i.e., ΔCFI =
Modeling the TriPM 15
Across samples, strong mean item loadings indicated this model structure resulted in items with
good discrimination by degree of psychopathic propensity. As expected, scale composites that
represented the seven factors versus the original three TriPM factors provided greater separation
of offenders from non-offenders (See Figure 4). Hedge’s g for the three-factor composites
(Boldness, Meanness, Disinhibition, respectively) were, .17, .58, 1.45, and the seven factor
composites (Leader, Stress-immune, Positive self-image; Callous, Enjoy hurting; Impulsivity,
Antisociality, respectively) were, .01, .01, .86; .31, .79; .43, 1.90. The results show offenders are
mostly strongly separated from non-offenders in terms of several of the seven-factor composites:
(poor) self-image, enjoyment in hurting others, and overt antisociality.
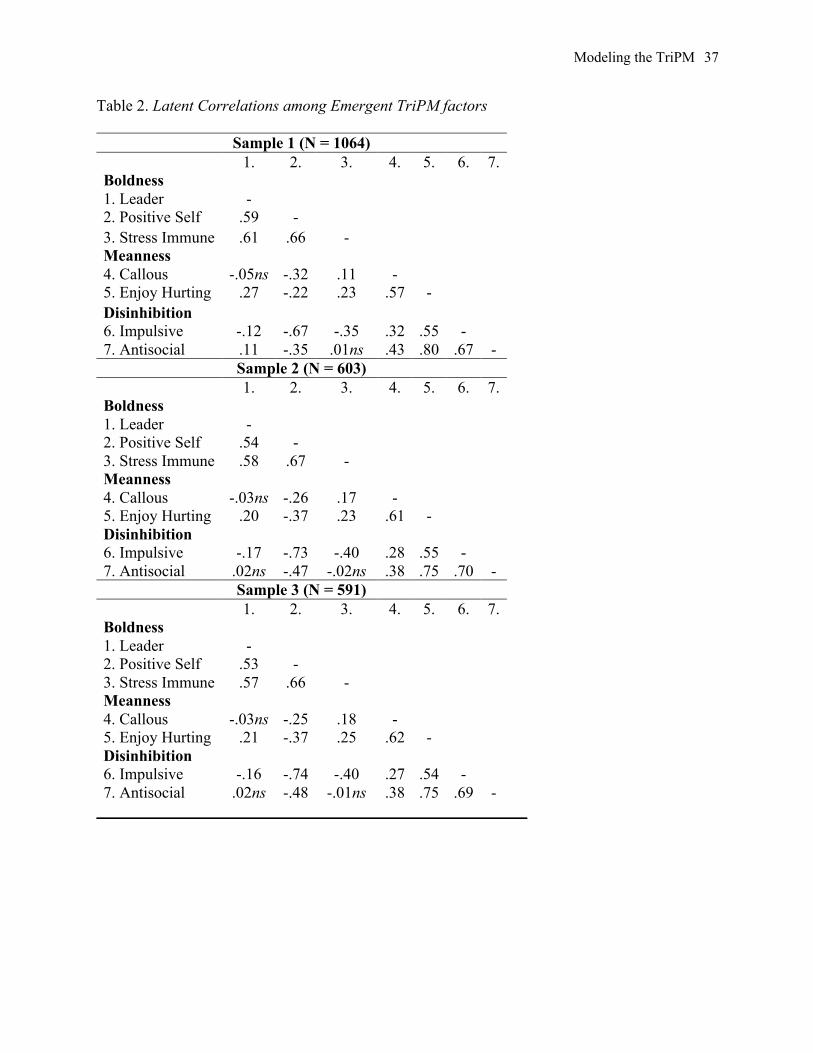
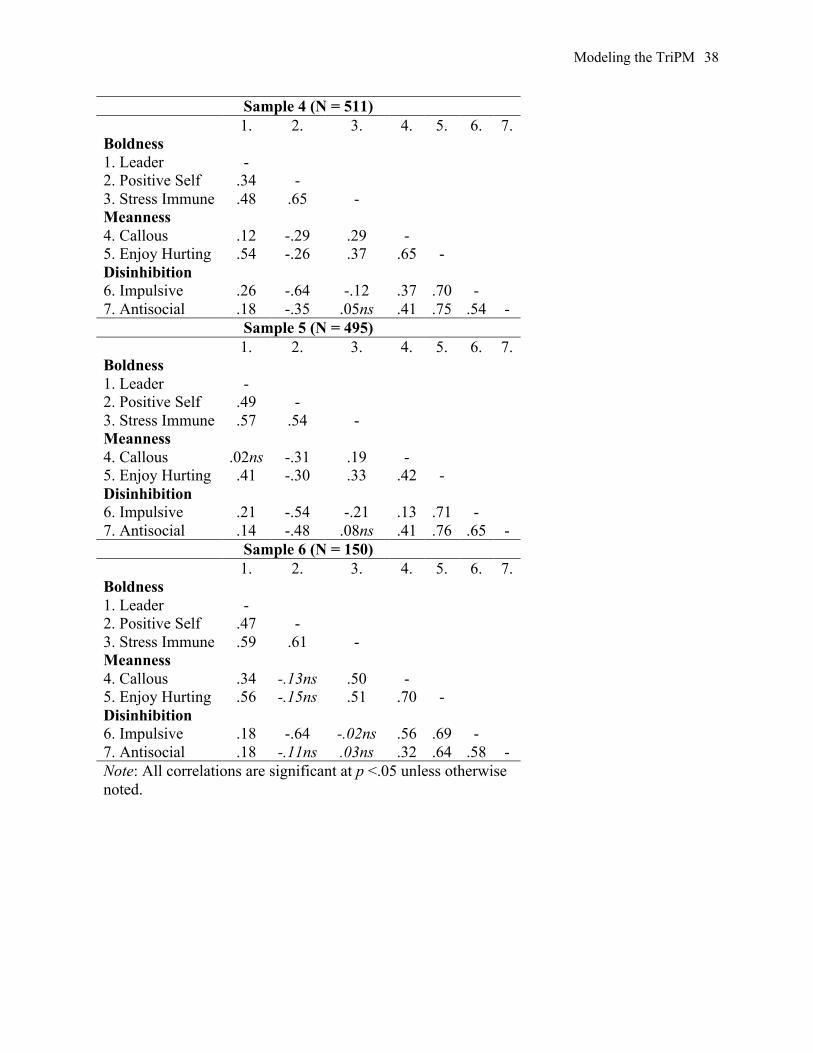
The latent correlations among the seven TriPM factors are displayed in Table 2. Except
for a few differences, there was remarkable uniformity in the pattern of correlations across
samples. Notably, the three factors extracted from the Boldness items (Leadership, Stress
Immunity, Positive Self-image) displayed a heterogeneous pattern of differential associations
with the two factors extracted from the Meanness items (Callous, Enjoy Hurting), and similarly
with the two factors extracted from the Disinhibition items (Impulsivity, Antisocial). However,
the three European samples had stronger correlations between the Leader and Enjoy Hurting
factors, compared to the U.S. samples, and also had positive associations between the Leader and
Impulsivity factors, suggest potential cultural differences with respect to the Leader factor.
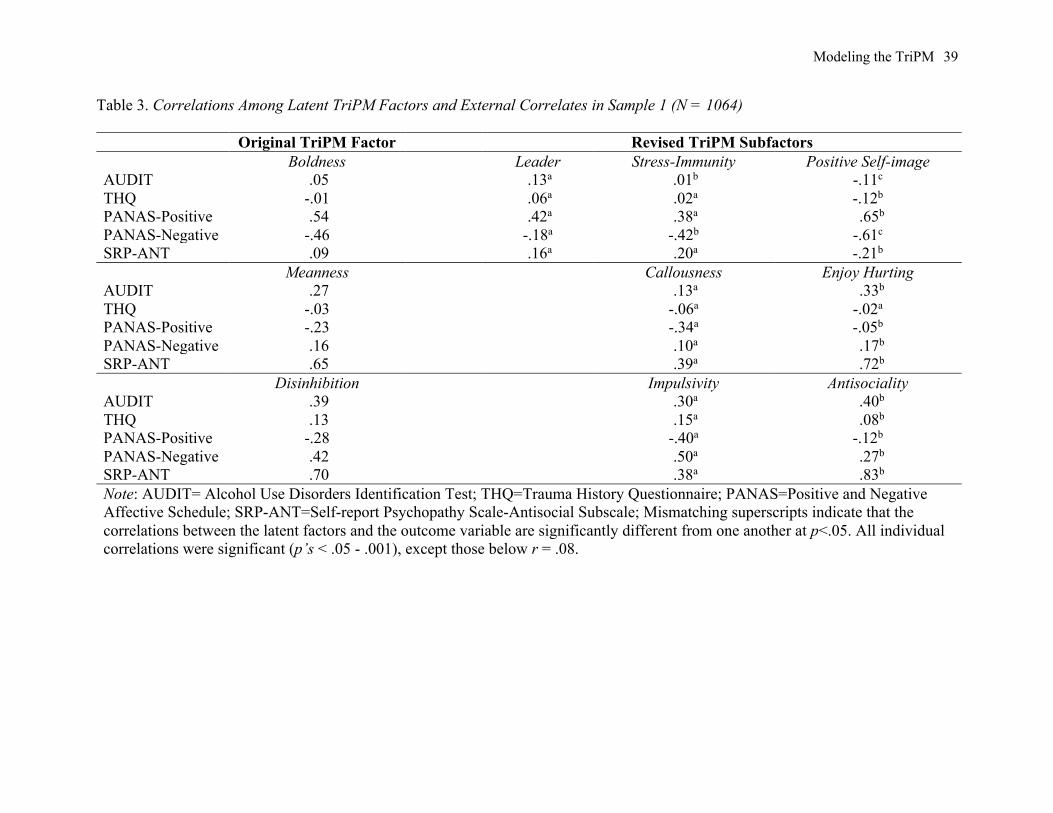
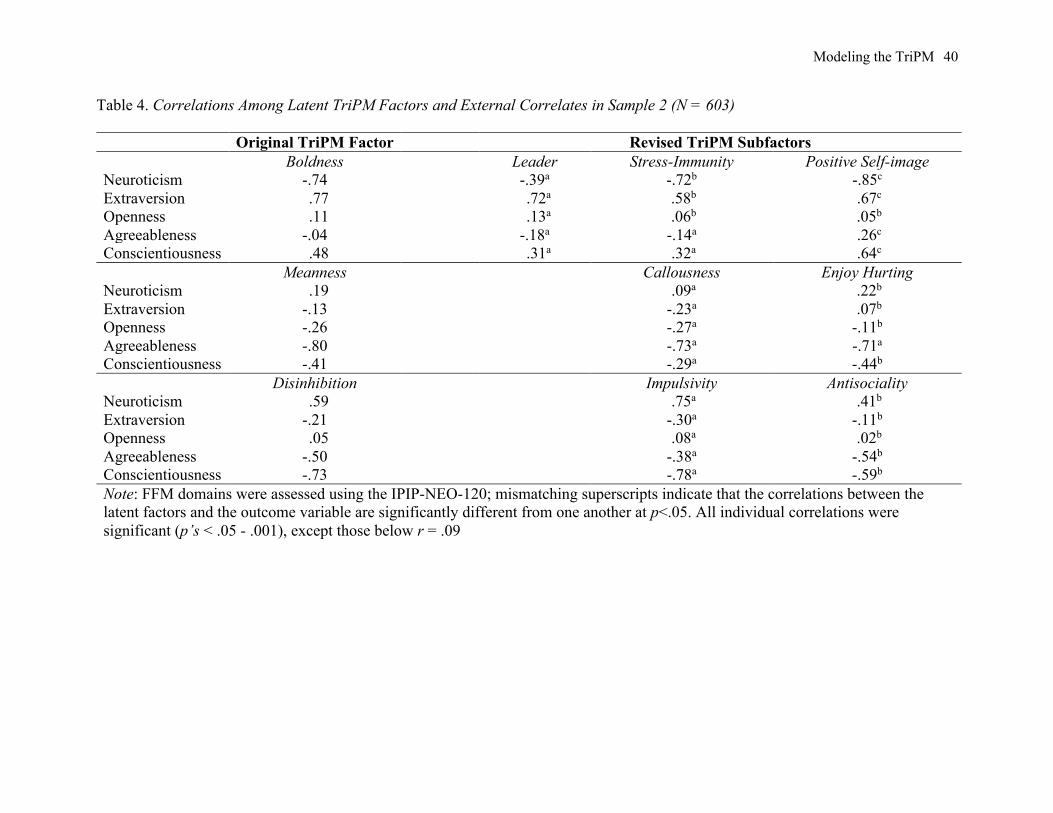
External correlate CFAs. Using samples 1-3, CFAs were specified to examine the
correlations between the external correlates and the respective TriPM original three- and new
seven-factors. Tables 3-5 present these correlation results.4 Comparisons of how the new seven
.14). Similar results were found with the single TriPM scales, dropping the poor performing items, compared to
multi-dimensional scales (ΔCFI’s = .04-.12).
4 Note the same substantive pattern of correlations were found when the three-factor model without the poor items
was examined with the external correlates
Modeling the TriPM 16
factors were associated with the external correlates revealed that the majority were statistically
different. Interpretation of these results our provided in the Discussion, though we note here the
significant number of heterogenous correlations between the new seven factors and all of the
external correlates, raising concerns about the structural validity of the original TriPM scales.
Supplementary CFAs. When testing a 58-item bifactor model, it achieved acceptable fit,
but a problem with this model, among others (see below), is that it results in poor item
discrimination parameters (see low mean loadings in Table 1), with some items loading
negatively on the general factor. We re-tested the bifactor model, after dropping the poor
performing items, and as before the model fit adequately but not as well as the seven-factor
model (ΔCFI = .02). Also, the model with a method factor to address reverse keyed items
resulted in poor model fit (CFI = .77; RMSEA = .08), indicating that problems with the original
three-factor model is not due to unique item covariances involving item keying, as suggested by
Somma et al. (2018). Lastly, we tested if the new seven factors might serve as indicators for
higher-order Boldness, Meanness, and Disinhibited factors. This model resulted in poorer model
fit (CFI = .84; RMSEA = .07), indicating that the seven correlated (first-order) factors model is
the better model (ΔCFI = .08) and that these seven factors do not serve as respective indicators
for three higher-order TriPM factors.
Discussion
The triarchic perspective and the TriPM have become increasing popular in recent years
(see Sleep et al., 2019 for a review), although some concerns have been raised (Gatner, Douglas,
& Hart, 2016; Shou et al. 2017; Sörman et al., 2016). Also, traits tied to the triarchic perspective
have been added as features of a psychopathy specifier in the DSM-5, though not without
critique (Miller et al., 2018). Surprisingly, research on the structure of the TriPM has been
Modeling the TriPM 17
relatively absent, though previous research has raised questions regarding TriPM scale validity
(Shou et al., 2017; Sleep et al., 2019). The current results raise significant concerns that the
TriPM may not accord sufficiently with the triarchic conceptual model of psychopathy.
There is now a “prominent focus on analyses of internal structure of measures in the
psychopathy literature” (Somma et al., 2018, p. 3). Structural equation modeling identifies items
with strong discrimination parameters (loadings), similar to IRT (Reise, 1999), but also can
provide multidimensional statistical representations of the conceptual psychopathy models that
assessments are designed to tap (Collison et al., 2016; Hare & Neumann, 2008), potentially
offering models that generalize across community and offender samples (Neumann et al., 2015;
Neumann & Pardini, 2014). Our current modeling results reveal that the triarchic domains
cannot be represented via an item-level three-factor model, given each TriPM scale is clearly
multidimensional, consistent with other research (Shou et al., 2017; Somma et al., 2018).
Conceptual models ultimately must have some form of measurement to conduct scientific
research, and it is not unreasonable to ask that such measures demonstrate internal construct
validity (e.g., latent structural models) in-line with their larger conceptual model (Strauss &
Smith, 2009). If it is possible to represent proposed concepts within a statistically rigorous
modeling framework, then it is provides far more support for the scientific endeavor. Take for
example latent variable modeling research uncovering the larger conceptual model of
psychopathology (Kotov et al., 2017). The TriPM conceptual model has considerable appeal
among some investigators, perhaps in part due to its parsimony, but there are 58 items used to
measure this simplified conceptual model. We believe it is critical to conduct item-level analyses
to test whether there is any support at the structural level for the ideas offered at the conceptual
level. The history of the FFM is a good example regarding the use of analytic strategies (factor
Modeling the TriPM 18
analysis) to empirically articulate the lexical Big Five (Dingman, 1997; John et al., 1988). In
similar fashion, Hare (2003) provided the leading-edge effort to articulate much of Cleckley’s
conceptual model of psychopathy via the PCL-R family of instruments which are supported by a
rigorous generalizable statistical model (Hare & Neumann, 2008; Neumann et al., 2015).
Although there was not support for a triarchic model, there was consistent support for a
seven-factor model across six different samples. The current results showed the seven-factor
model has strong item parameters, and thus offers an empirical basis to accurately differentiate
individuals with varying degrees of psychopathic propensity. The seven factors are significantly
correlated, though not at a level suggestive of factor redundancy.5 Relatedly, we showed that
composites representing the seven factors discriminated offenders from non-offenders in terms
of (low) Positive self-image, while the original Boldness scale missed this. Similarly, offenders
differed far more from the non-offenders in terms of Enjoy Hurting others rather than the
original Meanness scale. Also, offenders were notably more Antisocial than non-offenders, and
the two groups differed less in Impulsivity, which the Disinhibition scale misrepresented.
The current results also provide evidence of significant differential associations across
the seven factors and an array of relevant external correlates, raising further questions about the
original TriPM domains (Tables 3-5). We anticipated finding such evidence, given the diversity
of TriPM item content and the exposition by Smith et al. (2009) on the problems of
multidimensional single scale scores. Among the three factors that emerged from the TriPM
Boldness scale (Leader, Stress Immune, Positive Self), 84% of the correlations with the external
correlates were statistically different, and similarly 92% and 96%, respectively, differed among
5 Although we found support for a 7-factor model, there may be other viable solutions for the TriPM as well. In
other research, Collison, Miller, and Lynam (2019), despite using a different methodological approach and model
estimation procedure than the current study, found that 5-7 factors could be extracted from the TriPM and TriPM-
alternative scales.
Modeling the TriPM 19
the factors that emerged from the Meanness (Callous, Enjoy Hurting) and Disinhibition
(Impulsivity, Antisociality) scales. These results suggest that the three original TriPM scales are
misrepresenting important sources of covariation, and therefore, the triarchic model is mis-
specified (i.e., does not accurately account for the structure of TriPM item covariance).
The modeling results and the differential correlations uncovered have substantive
relevance for understanding of the nature of psychopathy. In particular, the three new factors
derived from the Boldness item set evidenced divergent correlations with the other four new
factors. Given this pattern of associations, along with heterogeneous associations with the
external correlates, it appears that the original Boldness factor is not sufficiently structurally
coherent, in-line with previous modeling of FD (Neumann et al., 2013b). The three factors that
emerged from the Boldness items displayed divergent associations with external correlates,
whereas the TriPM Boldness scale was essentially uncorrelated with a variety of constructs
traditionally associated with psychopathic personality (e.g., substance use, antisocial behaviors).
More generally, the most heterogeneous set of associations occurred with the Leader, Stress
Immune, and Positive Self factors. These three ‘bold’ factors displayed a diversity of positive
and negative correlations, as well as correlations differing significantly in strength, with the
external correlates, indicating that the original TriPM Boldness scale may have limited
theoretical and clinical utility (Smith et al., 2009). These results are consistent with findings
demonstrating divergent relationships between the scales of the DSM-5 psychopathy specifier
(i.e., FD/Bold) with external correlates (Miller et al., 2018).
The factors that emerged from the Boldness items were associated with high extraversion
and positive affect and low neuroticism, a pattern associated with positive adjustment (Marcus et
al., 2013; Miller & Lynam, 2012). In contrast, the Callous, Enjoy Hurting, Impulsivity, and

Modeling the TriPM 20
Antisocial factors were all uniformly associated with low levels of agreeableness and
conscientiousness, increased substance use, diverse antisocial behaviors, and high negative
affect, in-line with results of other structural psychopathy models (Marcus et al., 2013; Miller &
Lynam, 2012; Neumann & Hare, 2008).
The Enjoy Hurting and Callous factors showed notable differences in their associations
with most external correlates, particularly with antisocial behavior. Such divergent associations
may provide a lead in furthering research on the affective/interpersonal disturbances in
psychopathy. In particular, the Enjoy Hurting factor may be interpreted with respect to previous
(Neumann et al., 2007) and recent (Viding & McCrory, 2019) research highlighting atypical
affiliation in psychopathy. Also, the Enjoy Hurting and overt Antisociality factors were more
strongly correlated with one another than with their other factor from the same domain. For
example, in Sample 1, Enjoy Hurting and Antisociality correlated more highly (r = .80) than did
Enjoy Hurting with Callousness (r =.57) and Antisociality with Impulsivity (r = .67). The
association between the Enjoy Hurting and Antisocial factors accords well with studies that find
both affective and antisocial psychopathy factors are strong predictors of violence (Krstic et al.,
2017), and that these psychopathic domains both load onto a common genetic factor (Viding,
Frick, & Plomin, 2007). The Enjoy Hurting-Antisocial association is also consistent with
research suggesting psychopathic propensities are linked with enjoyment of negative social
interactions (Foulkes et al., 2014a, 2014b), as well as contemptuousness (Garofalo et al., 2018).
The links between the original TriPM Disinhibition scale and the external correlates
reflecting various antisocial behaviors can be better understood in the context of the scale being
composed of items that form distinct Impulsivity and Antisociality factors. Unsurprisingly, the
latter factor was more robustly associated with a variety of antisocial tendencies compared to the
Modeling the TriPM 21
Impulsivity factor. As such, use of the TriPM Disinhibition scale can create ambiguity regarding
the link between ‘disinhibition’ and antisocial behavior.
Consistent with other TriPM item-level modeling research (Shou et al., 2017), we
identified a number of items with poor model parameters, though we did not find as many
problematic items as reported in Latzman et al. (2018) or Somma et al., (2018). The presence of
poor performing items is not specific to the TriPM given such items are often found when item-
level modeling is carried out (Walton, Roberts, Krueger, Blonigen, & Hicks, 2008; Ray et al.,
2016). Certainly, it is important to identify good fitting models, without use of correlated errors,
or poor performing items, to precisely identify individuals with psychopathic propensities.
Although our initial model analyses did involve working from within a three-factor
framework to uncover evidence of multidimensional TriPM scales, it is critical to highlight that
the seven new factors are not lower-order indictors for three higher-order TriPM domains, given
that a hierarchical model did not fit the data adequately, along with pervasive differential
correlations among the seven first-order factors with the external correlates. Moreover, when
moving out of the three-factor framework and allowing items to load across factors (i.e., ESEM),
the results were in-line with the seven-factor CFA results. The results also indicated a bifactor
model could not account for the TriPM items as well as a seven-factor model. The bifactor
model is easy to fit, since it requires many estimated parameters, but nevertheless, there are
problem with it, such as suboptimal discrimination parameters, modeling embedded implausible
response patterns (Reise et al., 2016), doubts about accurate representation of underlying
neurobiological processes (Bonifay et al., 2017), and limits in deriving manifest variable scale
composites (Hare, Neumann, & Mokros, 2018). In light of these alternative model limitations,
Modeling the TriPM 22
our results support use of the seven first-order factors as a guide for forming new composites
with the TriPM items.6
Statistical models based on items from reliable and valid measures cannot be equated
with the larger construct they are designed to represent (Hare & Neumann, 2008). Nevertheless,
such models provide a basis for establishing a measure’s internal construct validity (Smith et al.,
2009; Strauss & Smith, 2009), and a viable statistical representation of the conceptual model
(Hoyle, 2012), which can then be tested across cultures (Neumann, Schmitt, Carter, Embley, &
Hare, 2012), and offender vs. non-offender samples (Neumann et al., 2015). At the most
practical level, modeling items reveals how they perform as indicators of their respective factors,
as well as how the items can be used to form coherent (measured) scale composites.
Conclusions and limitations. The current results provide evidence for a seven-factor
model that replicated across samples. The results did not support a three-factor triarchic model,
though some of the seven factors that emerged have parallels with other structural psychopathy
models (Collison et al., 2016; Neumann et al., 2015). The current results are limited to countries
from North America or Europe. Also, most of our samples were community-based but the results
did generalize to an offender sample. Finally, the primary CFA approach used in this study was
selected to help identify unidimensional and unambiguous factors, which has worked well in
other psychopathy research (Seara-Cardoso, Queirós, Fernandes, Coutinho, & Neumann, 2019).
As an alternative, investigators could use an ESEM approach and allow item cross-loadings, but
6 In supplementary analyses we also assessed the influence of reverse keyed items. We modeled a
factor that captured common method variance, but this model resulted in poor fit. Ray et al. (2016) did
IRT analysis of ICU items and showed positively and negatively keyed items differ in terms of parametric
information. A recent comparative IRT study by Tsang, Salekin, Coffey, and Cox (2018) echoed the Ray
et al. results. Zhang, Noor, and Savalei (2016) demonstrated that presentation of all-positively worded
items differed from a partially reverse worded version of a questionnaire and strongly cautioned against
use of reverse keyed items.

Modeling the TriPM 23
this then results in shared items across scales and creates ambiguities in terms of their
associations with external correlates. Despite these limitations, the findings of the current study
have implications for measures anchored in the theoretical framework of the TriPM. We
acknowledge the TriPM was not originally created to index a structural model and do not
confuse our analyses of the TriPM with the theoretical constructs. The current results, as well as
analytic results of various triarchic derivatives (Collison et al., 2019), indicate that triarchic items
or scales do not adhere to a triarchic model. Creation of a unique item set with clear conceptual
basis in the triarchic theory and sound psychometric properties may be a viable path forward for
researchers interested in this framework. However, the seven-factor structure that emerged from
the TriPM item set also provides a nuanced approach to assessing psychopathic personality that
may advance both research and clinical interventions with the construct. Specifically, the Enjoy
Hurting Others factor is not explicitly represented in current psychopathy measures and may
have implications for risk assessment and differentiating variants of psychopathy (e.g.,
manipulative vs. aggressive subtypes; Hare et al., 2018). Additionally, the clear explication of
unidimensional factors with some relevance to Boldness (Leader, Stress-immune, Positive self-
image) allows researchers to conduct person-centered analyses to explore the viability of the
proposed ‘bold’ psychopath. Use of all seven emergent factors from the current study would
provide an opportunity to uncover evidence for such a profile, if one exists. Overall, it appears
that continued use of the three original TriPM scales can lead to theoretical ambiguity and
statistical washout effects, which will hinder our understanding of a construct associated with
huge impact in mental health and criminal justice systems (Hare et al., 2018). Indeed, we believe
the multidimensionality of the three original TriPM scales should provide a big caution to
investigators who seek to uncover meaningful associations between the original TriPM scales

Modeling the TriPM 24
and critical external correlates, as well as the genetic basis of psychopathic features.
Furthermore, the seven factors that emerged from the current study can be used to integrate the
TriPM item set more closely to existing measures of psychopathy (e.g., callousness & overt
antisociality). Our results comparing offenders and non-offenders suggest that poor self-image,
enjoyment in hurting others, and overt antisociality may be a viable profile for understanding
individuals with psychopathic features. In contrast, our results revealed little differentiation
between offenders and non-offenders in terms of stress immunity and leadership capacities.
These latter results raise questions about the utility of such ‘adaptive’ features and whether they
reflect any aspect of psychopathic personality. Taken together, our overall findings are in
alignment with a statement by Crego and Widiger (2015), “It should go without saying that what
makes a personality disorder a disorder is the presence of maladjustment, not superior
adjustment” (p. 672). Enjoyment in hurting others, combined with overt antisociality, is most
definitely pathological given what we consider ourselves to be, a social species.
Modeling the TriPM 25
References
American Psychiatric Association. (2013). Diagnostic and statistical manual of mental
disorders-5th edition (DSM-5). Arlington, VA: American Psychiatric Association
Bonifay, W., Lane, S. P., & Reise, S. P. (2017). Three concerns with applying a bifactor model
as a structure of psychopathology. Clinical Psychological Science, 5, 184-186. doi:
10.1177/2167702616657069
Cleckley, H. (1976). The mask of sanity (5th ed.). St. Louis, MO: Mosby.
Clark L. A., & Watson D. (1995). Constructing validity: basic issues in objective scale
development. Psychological Assessment 7(3), 309–319. doi:10.1037/1040-3590.7.3.309
Chou, C.-P., & Huh, J. (2012). Model modification in structural equation modeling. In R. H.
Hoyle (Ed.), Handbook of structural equation modeling (pp. 232-246). New York, NY,
US: Guilford Press.
Colins, O. F., Fanti, K. A., Salekin, R. T., & Andershed, H. (2017). Psychopathic personality in
the general population: Differences and similarities across gender. Journal of Personality
Disorders, 31(1), 49-74. doi: 10.1521/pedi_2016_30_237
Collison, K. L., Miller, J. D., Gaughan, E. T., Widiger, T. A., & Lynam, D. R. (2016).
Development and validation of the super-short form of the Elemental Psychopathy
Assessment. Journal of Criminal Justice, 47, 143-150. doi: 10.1016/j.jcrimjus.2016.09.002
Collison, K., Miller, J., & Lynam, D. (2019). Factor structure and validity of the triarchic model
of psychopathy across measures. OSF Preprints, https://osf.io/5hf3z
Crego, C., & Widiger, T. A. (2014). Psychopathy, DSM-5, and a caution. Personality Disorders:
Theory, Research, and Treatment, 5(4), 335-347. doi: 10.1037/per0000078

Modeling the TriPM 26
Crego, C., & Widiger, T. A. (2015). Psychopathy and the DSM. Journal of Personality, 83(6),
665–677. doi: 10.1111/jopy.12115
Derefinko, K. J., & Lynam, D. R. (2006). Convergence and divergence among self-report
psychopathy measures: A personality-based approach. Journal of Personality Disorders,
20(3), 261-280. doi: 10.1521/pedi.2006.20.3.261
Digman, J. M. (1997). Higher-order factors of the Big Five. Journal of personality and social
psychology, 73(6), 1246.
Drislane, L. E., Patrick, C. J., Arsal, G. (2014). Clarifying the content coverage of differing
psychopathy inventories through reference to the Triarchic Psychopathy Measure.
Psychological Assessment, 26, 350-362. doi: 10.1037/a0035152.
Embretson, S. E. (1996). The new rules of measurement. Psychological Assessment, 8(4), 341-
349. doi: 10.1037/1040-3590.8.4.341
Foulkes, L., McCrory, E. J., Neumann, C. S., & Viding, E. (2014a). Inverted social reward:
Associations between psychopathic traits and self-report and experimental measures of
social reward. PloS one, 9(8), 1-10. doi: 10.1371/journal.pone.0106000
Foulkes, L., Seara-Cardoso, A., Neumann, C. S., Rogers, J. S., & Viding, E. (2014b). Looking
after number one: Associations between psychopathic traits and measures of social
motivation and functioning in a community sample of males. Journal of Psychopathology
and Behavioral Assessment, 36(1), 22-29. doi: 10.1007/s10862-013-9381-2
Garofalo, C., Neumann, C. S., Zeigler-Hill, V., & Meloy, J. R. (2019). Spiteful and
contemptuous: A new look at the emotional experiences related to psychopathy. Personality
Disorders: Theory, Research, and Treatment, 10(2), 173. doi.org/10.1037/per0000310

Modeling the TriPM 27
Gray, N. S., Blumenthal, S., Shuker, R., Wood, H., Fonagy, P., & Snowden, R. J. (2019). The
Triarchic Model of Psychopathy and Antisocial Behavior: Results from an Offender
Population with Personality Disorder. Journal of Interpersonal Violence, 1-23. doi:
10.1177/0886260519853404
Gatner, D. T., Douglas, K. S., & Hart, S. D. (2016). Examining the incremental and interactive
effects of boldness with meanness and disinhibition within the triarchic model of
psychopathy. Personality Disorders: Theory, Research, and Treatment, 7(3), 259-268. doi:
10.1037/per0000182
Gerbing, D. W., & Anderson, J. C. (1984). On the meaning of within-factor correlated
measurement errors. Journal of Consumer Research, 11(1), 572-580. doi: 10.1086/208993
Green, B. L. (1996). Trauma History Questionnaire. In B. H. Stamm (Ed.), Measurement of
stress, trauma, and adaptation (pp. 366-369). Lutherville, MD: Sidran Press.
Hare, R. D. (2003). The Hare Psychopathy Checklist–Revised (2nd ed.). Toronto, Ontario,
Canada: Multi-Health Systems.
Hare, R. D., & Neumann, C. S. (2008). Psychopathy as a clinical and empirical construct.
Annual Review of Clinical Psychology, 4, 217-46. doi:
10.1146/annurev.clinpsy.3.022806.091452
Hare, R. D., Neumann, C. S., & Mokros, A. (2018). The PCL-R assessment of psychopathy:
Development, structural properties, and new directions. In C. Patrick (Ed., 2nd
ed.),
Handbook of Psychopathy. New York: Guilford Press.
Hawes, S. W., Byrd, A. L., Henderson, C. E., Gazda, R. L., Burke, J. D., Loeber, R., & Pardini,
D. A. (2014). Refining the parent-reported Inventory of Callous–Unemotional Traits in boys
with conduct problems. Psychological assessment, 26(1), 256. DOI: 10.1037/a0034718
Modeling the TriPM 28
Hoppenbrouwers, S. S., Bulten, B. H., & Brazil, I. A., (2016). Parsing fear: A reassessment of
the evidence for fear deficits in psychopathy. Psychological Bulletin, 142(6), 573-600.doi:
10.1037/bul0000040
Hoyle, R. H. (2012). Handbook of Structural Equation Modeling. New York, NY: The Guilford
Press.
Hu, L., & Bentler, P. M. (1999). Cutoff criteria for fit indexes in covariance structure analysis:
Conventional criteria versus new alternatives. Structural Equation Modeling, 6(1), 1–55.
doi: 10.1080/10705519909540118
John, O. P., Angleitner, A., & Ostendorf, F. (1988). The lexical approach to personality: A
historical review of trait taxonomic research. European journal of Personality, 2(3), 171-
203.
Kotov, R., Krueger, R. F., Watson, D., Achenbach, T. M., Althoff, R. R., Bagby, R. M., ... &
Eaton, N. R. (2017). The Hierarchical Taxonomy of Psychopathology (HiTOP): a
dimensional alternative to traditional nosologies. Journal of abnormal psychology, 126(4),
454. doi.org/10.1037/abn0000258
Krstic, S., Neumann, C. S., Roy, S., Robertson, C. A., Knight, R. A., & Hare, R. D. (2017).
Using latent variable- and person-centered approaches to examine psychopathic traits in
sex offenders. Personality Disorders: Theory, Research, and Treatment, 9(3), 207-216.
doi: 10.1037/per0000249
Krueger, R. F., Markon, K. E., Patrick, C. J., Benning, S. D., & Kramer, M. D. (2007). Linking
antisocial behavior, substance use, and personality: An integrative quantitative model of the
adult externalizing spectrum. Journal of Abnormal Psychology, 116(4), 645–666. doi:
10.1097/OPX.0b013e3182540562.
Modeling the TriPM 29
Latzman, R. D., Palumbo, I. M., Sauvigné, K. C., Hecht, L. K., Lilienfeld, S. O., & Patrick, C. J.
(2018). Psychopathy and internalizing psychopathology: A triarchic model
perspective. Journal of personality disorders, 33(2), 1-26. doi: 10.1521/pedi_2018_32_347
Lilienfeld, S. O., Smith, S. F., Sauvigné, K. C., Patrick, C. J., Drislane, L. E., Latzman, R. D., &
Krueger, R. F. (2016). Is boldness relevant to psychopathic personality? Meta-analytic
relations with non-Psychopathy Checklist-based measures of psychopathy. Psychological
Assessment, 28(10), 1172 -1185. doi: 10.1037/pas0000244.
Lilienfeld, S. O., & Widows, M. R. (2005). Psychological assessment inventory-revised
(PPIR). Lutz, FL: Psychological Assessment Resources.
López-Romero, L., Romero, E., Colins, O. F., Andershed, H., Hare, R. D., & Salekin, R. T.
(2019). Proposed Specifiers for Conduct Disorder (PSCD): Preliminary validation of the
parent version in a Spanish sample of preschoolers. Psychological assessment.
Lynam, D. R., Sherman, E. D., Samuel, D., Miller, J. D., Few, L. R., & Widiger, T. A. (2013).
Development of a short form of the elemental psychopathy assessment. Assessment, 20(6),
659-669. doi: 10.1177/1073191113502072
Maples, J. L., Guan, L., Carter, N. T., & Miller, J. D. (2014). A test of the International
Personality Item Pool representation of the Revised NEO Personality Inventory and
development of a 120-item IPIP-based measure of the five-factor model. Psychological
Assessment, 26(4), 1070 -1084. http://dx.doi.org/10.1037/pas0000004.
Marcus, D. K., Fulton, J. J., & Edens, J. F. (2013). The two-factor model of psychopathic
personality: Evidence from the Psychopathic Personality Inventory. Personality
Disorders: Theory, Research, and Treatment, 4(1), 67-76. doi: 10.1037/a0025282
Modeling the TriPM 30
Miller, J. D., Lamkin, J., Maples-Keller, J. L., Sleep, C. E., & Lynam, D. R. (2018). A test of the
empirical profile and coherence of the DSM–5 psychopathy specifier. Psychological
Assessment, 30(7), 870-881. doi:10.1037/pas0000536
Miller, J. D., & Lynam, D. (2003). Psychopathy and the five-factor model of personality: A
replication and extension. Journal of Personality Assessment, 81(2), 168–178.
doi:10.1207/S15327752JPA8102_08
Miller, J. D. & Lynam, D. R. (2012). An examination of the Psychopathic Personality
Inventory’s nomological network: A meta-analytic review. Personality Disorders: Theory,
Research, and Treatment, 3(3), 305-326. doi: 10.1037/a0024567
Muthén, L. K., & Muthén, B. O. (1998-2012). Mplus [Computer software]. Los Angeles, CA:
Author.
Neumann, C. S., & Hare, R. D. (2008). Psychopathic traits in a large community sample: links to
violence, alcohol use, and intelligence. Journal of Consulting and Clinical
Psychology, 76(5), 893-899. doi: 10.1037/0022-006x.67.5.893
Neumann, C. S., Hare, R. D., & Newman, J. P. (2007). The super-ordinate nature of the
Psychopathy Checklist-Revised. Journal of personality disorders, 21(2), 102-117. doi:
10.1521/pedi.2007.21.2.102
Neumann, C. S., Hare, R. D., & Pardini, D. A., (2015). Antisociality and the construct of
psychopathy: Data from across the globe. Journal of Personality, 83(6), 678-92. doi:
10.1111/jopy.12127
Neumann, C. S., & Pardini, D. (2014). Factor structure and construct validity of the Self-Report
Psychopathy (SRP) Scale and the Youth Psychopathic Traits Inventory (YPI) in young
men. Journal of Personality Disorders, 28(3), 419-433. doi: 10.1521/pedi_2012_26_063

Modeling the TriPM 31
Neumann, C. S., Schmitt, D. S., Carter, R., Embley, I., & Hare, R. D. (2012). Psychopathic traits
in females and males across the globe. Behavioral Sciences & the Law, 30(5), 557-574. doi:
10.1002/bsl.2038
Neumann, C. S., Uzieblo, K., Crombez, G., & Hare, R. D. (2013b). Understanding the
Psychopathic Personality Inventory (PPI) in terms of unidimensionality, orthogonality,
and construct validity of PPI-I and -11. Personality Disorders: Theory, Research, and
Treatment, 4(1), 77-79. doi:10.1037/a0027196
Patrick, C. J. (2010). Operationalizing the triarchic conceptualization of psychopathy:
Preliminary description of brief scales for assessment of boldness, meanness, and
disinhibition. Unpublished test manual, Florida State University, Tallahassee, Florida.
Patrick, C. J. & Drislane, L. E. (2015). Triarchic Model of Psychopathy: Origins,
operationalizations, and observed linkages with personality and general psychopathology.
Journal of Personality, 83(6), 627-643. doi: 10.1111/jopy.12119
Patrick, C. J., Fowles, D. C., & Krueger, R. F. (2009). Triarchic conceptualization of
psychopathy: Developmental origins of disinhibition, boldness, and meanness. Development
and Psychopathology, 21, 913-938. doi: 10.1017/S0954579409000492
Patrick, C. J., Kramer, M. D., Krueger, R. F., & Markon, K. E. (2013). Optimizing efficiency of
psychopathology assessment through quantitative modeling: Development of a brief form of
the Externalizing Spectrum Inventory. Psychological assessment, 25(4), 1332-1348. doi:
10.1037/a0034864
Patrick, C. J., Kramer, M. D., Vaidyanathan, U., Benning, S. D., Hicks, B. M., & Lilienfeld, S.
O. (2019). Formulation of a measurement model for the boldness construct of
psychopathy. Psychological assessment. doi.org/10.1037/pas0000690
Modeling the TriPM 32
Patton, C. L., Smith, S. F., & Lilienfeld, S. O. (2018). Psychopathy and heroism in first
responders: Traits cut from the same cloth?. Personality Disorders: Theory, Research,
and Treatment, 9(4), 354-368. doi: 10.1027/per0000261
Paulhus, D.L., Neumann, C. S., & Hare, R.D. (2017). Manual for the Self-Report Psychopathy
scale 4th edition. Toronto: Multi-Health Systems.
Podsakoff, P. M., MacKenzie, S. B., Lee, J.-Y., & Podsakoff, N. P. (2003). Common method
biases in behavioral research: A critical review of the literature and recommended remedies.
Journal of Applied Psychology, 88, 879-903. doi:10.1037/0021-9010.88.5.879
Ray, J. V., Frick, P. J., Thornton, L. C., Steinberg, L., & Cauffman, E. (2016). Positive and
negative item wording and its influence on the assessment of callous-unemotional
traits. Psychological assessment, 28(4), 394-404. doi: 10.1037/pas0000183.
Reise, M. (1999). Personality measurement issues viewed through the eyes of IRT. In S.
Embretson & M. Reise (Eds.), The new rules of measurement (pp. 219–242) New York:
Erlbaum.
Reise, S. P., Kim, D. S., Mansolf, M., & Widaman, K. F. (2016). Is the bifactor model a better
model or is it just better at modeling implausible responses? Application of iteratively
reweighted least squares to the Rosenberg Self-Esteem Scale. Multivariate behavioral
research, 51(6), 818-838. doi: 10.1080/00273171.2016.1243461
Reise, S. P., Moore, T. M., & Haviland, M. G. (2010). Bifactor models and rotations: Exploring
the extent to which multidimensional data yield univocal scale scores. Journal of
Personality Assessment, 92, 544-559. doi: 10.1080/00223891.2010.496477
Saunders, J. B., Aasland, O. G., Babor, T. F., De la Fuente, J. R., Grant, M., (1993).
Development of the alcohol use disorders identification test (AUDIT): WHO
Modeling the TriPM 33
collaborative project on early detection of persons with harmful alcohol consumption II.
Addiction 88(6), 791–804. doi: 10.1111/j.1360-0443.1993.tb02093.x
Schmitt N. (1996). Uses and abuses of coefficient alpha. Psychological Assessment, 8(4), 350–
353. doi: 10.1037/1040-3590.8.4.350
Schmitt, T. A., & Sass, D. A. (2011). Rotation criteria and hypothesis testing for exploratory
factor analysis: Implications for factor pattern loadings and interfactor
correlations. Educational and Psychological Measurement, 71(1), 95-113. doi:
10.1177/0013164410387348
Seara-Cardoso, A., Queirós, A., Fernandes, E., Coutinho, J. & Neumann, C. S. (2019)
Psychometric properties and construct validity of the short version of the Self-Report
Psychopathy Scale in a Southern European sample. Journal of Personality Assessment.
Advance online publication. doi: 10.1080/00223891.2019.1617297
Sleep, C. E., Weiss, B., Lynam, D. R., & Miller, J. D. (2019). An examination of the Triarchic
Model of psychopathy's nomological network: A meta-analytic review. Clinical psychology
review. doi.org/10.1016/j.cpr.2019.04.005
Shou, Y., Sellbom, M., & Xu, J. (2017). Psychometric properties of the Triarchic Psychopathy
Measure: An item response theory approach. Personality Disorders: Theory, Research, and
Treatment, 9(3), 217-227. doi: 10.1037/per0000241
Smith, G. T., McCarthy, D. M., & Zapolski, T. C. B. (2009). On value of homogeneous
constructs for construct validation, theory testing, and description of psychopathology.
Psychological Assessment, 21(3), 272-284. doi: 10.1037/a0016699
Somma, A., Borroni, S., Drislane, L. E., Patrick, C. J., & Fossati, A. (2018). Modeling the
tructure of the triarchic psychopathy measure: Conceptual, empirical, and analytic
Modeling the TriPM 34
onsiderations. Journal of personality disorders. Advance online publication. doi:
10.1521/pedi_2018_32_354
Sörman, K., Edens, J. F., Smith, S. T., Clark, J. W., Kristiansson, M., & Svensson, O. (2016).
Boldness and its relation to Psychopathic Personality: Prototypicality analyses among
orensic mental health, criminal justice, and layperson raters. Law and Human Behavior,
40(3), 337–349. doi: 10.1037/lhb0000176
Stanley, J. H., Wygant, D. B., & Sellbom, M. (2014). Elaborating on the construct validity of the
Triarchic Psychopathy Measure in a criminal offender sample. Journal of Personality
Assessment, 95(4), 343-350. doi: 10.1080/00223891.2012.735302
Steiger, J. H. (1980). Tests for comparing elements of a correlation matrix. Psychological
Bulletin, 87(2), 245-251. doi: 10.1037/0033-2909.87.2.245
Strauss, M. E., & Smith, G. T. (2009). Construct validity: Advances in theory and
methodology. Annual review of clinical psychology, 5, 1-25. doi:
10.1146/annurev.clinpsy.032408.153639
Tsang, S., Salekin, R. T., Coffey, C. A., & Cox, J. (2018). A comparison of self-report measures
of psychopathy among nonforensic samples using item response theory analyses.
Psychological Assessment, 30, 311-327. doi:10.1037/pas0000481
van Dongen, J. D. M., Drislane, L. E., Nijman, H., Soe-Agnie, S. E., & van Marle, H. J. C.
(2017). Further evidence for the reliability and validity of the Triarchic Psychopathy
Measure in a forensic and a community sample. Journal of Psychopathology and
Behavioral Assessment, 39(1), 58-66. doi: 10.1007/s10862-016-9567-5
Modeling the TriPM 35
Viding, E., Frick, P. J., & Plomin, R. (2007). Aetiology of the relationship between callous-
unemotional traits and conduct problems in childhood. The British Journal of
Psychiatry, 190(S49), s33-s38.
Viding, E., & McCrory, E. (2019). Towards understanding atypical social affiliation in
psychopathy. The Lancet Psychiatry, 6(5), 437-444.
Walton, K. E., Roberts, B. W., Krueger, R. F., Blonigen, D. M., & Hicks, B. M. (2008).
Capturing abnormal personality with normal personality inventories: An item response
theory approach. Journal of personality, 76(6), 1623-1648. doi: 10.1111/j.1467-
6494.2008.00533.x
Watson, D., Clark, L. A., & Tellegen, A. (1988). Development and validation of brief measures
of positive and negative affect: the PANAS scales. Journal of Personality and Social
Psychology, 54(6), 1063-1070. doi: 10.1037/0022-3514.54.6.1063
West, S. G., Taylor, A. B., & Wu, W. (2012). Model fit and model selection in structural
equation modeling. Handbook of structural equation modeling, 1, 209-231.
Zhang, X., Noor, R., & Savalei, V. (2016). Examining the effect of reverse worded items on the
factor structure of the Need for Cognition Scale. PLOS ONE, 11(6). doi:
10.1371/journal.pone.0157795
Modeling the TriPM 36
Table 1. Confirmatory & exploratory factor analysis results
TriPM Model CFI RMSEA 90% CI WLSMV-X2(dfs) M loading (range)
Original item set (CFA)
3-factor Omnibus .76 .08 .08-.08 11639.65 (1592) .65 (.13, .86)
1-general/3-specific* .90 .05 .04-.05 5402.59 (1534) g: .42 (-.22, .82)
s: .45 (-.03, .80)
1-factor Bold items .81 .13 .12-.13 2783.99 (152) .59 (.20, .78)
1-factor Mean items .88 .12 .14-.12 2416 (152) .70 (.46, .83)
1-factor Disinhib. items .92 .08 .07-.08 1303.13 (170) .65 (.42, .80)
Original item set (EFA)
3-factor Bold items .93 .08 .07-.08 1070.12 (117) .67 (.42, .91)
2-factor Mean items .97 .06 .05-.06 721.61 (134) .76 (.61, .88)
2-factor Disinhibit items .96 .05 .05-.06 687.33 (151) .67 (.50, .91)
7-factor TriPM 58-items .97 .03 .02-.03 2606.78 (1268) .58 (-.33, .89)
Reduced item set (CFA)
3-factor Bold items .93 .08 .08-.09 763.68 (74) .71 (.52, .84)
2-factor Mean items .97 .07 .06-.07 440.55 (64) .78 (.63, .89)
2-factor Disinhib. items .96 .05 .05-.06 318.70 (64) .70 (.50, .82)
7-factor Omnibus (s1) .92 .04 .04-.05 2847.71 (719) .73 (.42, .89)
7-factor Omnibus (s2) .90 .06 .04-.06 2094.89 (719) .70 (.16, .93)
7-factor Omnibus (s3) .90 .06 .04-.05 2078.54 (719) .70 (.16, .92)
7-factor Omnibus (s4) .86 .04 .04-.05 1799.45 (719) .65 (.26, .91)
7-factor Omnibus (s5) .86 .05 .05-.06 1771.09 (719) .67 (.44, .89)
7-factor Omnibus (s6) .90 .06 .05-.06 1059.90 (719) .70 (.40, .92)
Reduced item set supplementary (CFA)**
3-factor Omnibus .78 .09 .09-.10 6823.64 (737) .66 (.35, .87)
1-general/3-specific* .90 .06 .05-.06 3310.98 (697) g: .40 (-.24, .83)
s: .46 (.03, .83)
1-factor Bold items .81 .15 .15-.16 2011.18 (77) .62 (.44, .79)
1-factor Mean items .86 .16 .15-.16 1772.63 (65) .72 (.56, .84)
1-factor Disinhib. items .88 .10 .09-.11 741.41 (65) .64 (.44, .78)
*Bi-factor model: 1 general (g) factor, all items loading, 3 specific (s) factors (bold, mean,
disinhibition) represented by their respective items. General is orthogonal to specific factors.
**All supplementary CFAs were run using Sample 1 to be consistent with our initial reduced
item set analyses and to allow direct model comparisons within sample.
Modeling the TriPM 37
Table 2. Latent Correlations among Emergent TriPM factors
Sample 1 (N = 1064) 1. 2. 3. 4. 5. 6. 7.
Boldness
1. Leader -
2. Positive Self .59 -
3. Stress Immune .61 .66 -
Meanness
4. Callous -.05ns -.32 .11 -
5. Enjoy Hurting .27 -.22 .23 .57 -
Disinhibition
6. Impulsive -.12 -.67 -.35 .32 .55 -
7. Antisocial .11 -.35 .01ns .43 .80 .67 -
Sample 2 (N = 603) 1. 2. 3. 4. 5. 6. 7.
Boldness
1. Leader -
2. Positive Self .54 -
3. Stress Immune .58 .67 -
Meanness
4. Callous -.03ns -.26 .17 -
5. Enjoy Hurting .20 -.37 .23 .61 -
Disinhibition
6. Impulsive -.17 -.73 -.40 .28 .55 -
7. Antisocial .02ns -.47 -.02ns .38 .75 .70 -
Sample 3 (N = 591) 1. 2. 3. 4. 5. 6. 7.
Boldness
1. Leader -
2. Positive Self .53 -
3. Stress Immune .57 .66 -
Meanness
4. Callous -.03ns -.25 .18 -
5. Enjoy Hurting .21 -.37 .25 .62 -
Disinhibition
6. Impulsive -.16 -.74 -.40 .27 .54 -
7. Antisocial .02ns -.48 -.01ns .38 .75 .69 -
Modeling the TriPM 38
Sample 4 (N = 511) 1. 2. 3. 4. 5. 6. 7.
Boldness
1. Leader -
2. Positive Self .34 -
3. Stress Immune .48 .65 -
Meanness
4. Callous .12 -.29 .29 -
5. Enjoy Hurting .54 -.26 .37 .65 -
Disinhibition
6. Impulsive .26 -.64 -.12 .37 .70 -
7. Antisocial .18 -.35 .05ns .41 .75 .54 -
Sample 5 (N = 495) 1. 2. 3. 4. 5. 6. 7.
Boldness
1. Leader -
2. Positive Self .49 -
3. Stress Immune .57 .54 -
Meanness
4. Callous .02ns -.31 .19 -
5. Enjoy Hurting .41 -.30 .33 .42 -
Disinhibition
6. Impulsive .21 -.54 -.21 .13 .71 -
7. Antisocial .14 -.48 .08ns .41 .76 .65 -
Sample 6 (N = 150) 1. 2. 3. 4. 5. 6. 7.
Boldness
1. Leader -
2. Positive Self .47 -
3. Stress Immune .59 .61 -
Meanness
4. Callous .34 -.13ns .50 -
5. Enjoy Hurting .56 -.15ns .51 .70 -
Disinhibition
6. Impulsive .18 -.64 -.02ns .56 .69 -
7. Antisocial .18 -.11ns .03ns .32 .64 .58 -
Note: All correlations are significant at p <.05 unless otherwise
noted.
Modeling the TriPM 39
Table 3. Correlations Among Latent TriPM Factors and External Correlates in Sample 1 (N = 1064) Original TriPM Factor Revised TriPM Subfactors Boldness Leader Stress-Immunity Positive Self-image AUDIT .05 .13a .01b -.11c
THQ -.01 .06a .02a -.12b PANAS-Positive .54 .42a .38a .65b PANAS-Negative -.46 -.18a -.42b -.61c SRP-ANT .09 .16a .20a -.21b Meanness Callousness Enjoy Hurting AUDIT .27 .13a .33b THQ -.03 -.06a -.02a PANAS-Positive -.23 -.34a -.05b PANAS-Negative .16 .10a .17b SRP-ANT .65 .39a .72b Disinhibition Impulsivity Antisociality AUDIT .39 .30a .40b THQ .13 .15a .08b PANAS-Positive -.28 -.40a -.12b PANAS-Negative .42 .50a .27b SRP-ANT .70 .38a .83b Note: AUDIT= Alcohol Use Disorders Identification Test; THQ=Trauma History Questionnaire; PANAS=Positive and Negative Affective Schedule; SRP-ANT=Self-report Psychopathy Scale-Antisocial Subscale; Mismatching superscripts indicate that the correlations between the latent factors and the outcome variable are significantly different from one another at p<.05. All individual correlations were significant (p’s < .05 - .001), except those below r = .08.
Modeling the TriPM 40
Table 4. Correlations Among Latent TriPM Factors and External Correlates in Sample 2 (N = 603) Original TriPM Factor Revised TriPM Subfactors Boldness Leader Stress-Immunity Positive Self-image Neuroticism -.74 -.39a -.72b -.85c
Extraversion .77 .72a .58b .67c Openness .11 .13a .06b .05b Agreeableness -.04 -.18a -.14a .26c Conscientiousness .48 .31a .32a .64c Meanness Callousness Enjoy Hurting Neuroticism .19 .09a .22b Extraversion -.13 -.23a .07b Openness -.26 -.27a -.11b Agreeableness -.80 -.73a -.71a Conscientiousness -.41 -.29a -.44b Disinhibition Impulsivity Antisociality Neuroticism .59 .75a .41b Extraversion -.21 -.30a -.11b Openness .05 .08a .02b Agreeableness -.50 -.38a -.54b Conscientiousness -.73 -.78a -.59b Note: FFM domains were assessed using the IPIP-NEO-120; mismatching superscripts indicate that the correlations between the latent factors and the outcome variable are significantly different from one another at p<.05. All individual correlations were significant (p’s < .05 - .001), except those below r = .09

Modeling the TriPM 41
Table 5. Correlations Among Latent TriPM Factors and External Correlates in Sample 3 (N = 591) Original TriPM Factor Revised TriPM Subfactors Boldness Leader Stress-Immunity Positive Self-image CAB-SU .04 .01a .15b -.06c
CAB-ASB .09 .13a .24b -.13c CAB-IPV -.09 .01a -.08b -.17c Meanness Callousness Enjoy Hurting CAB-SU .07 -.03a .16b CAB-ASB .33 .16a .43b CAB-IPV .09 .02a .11b Disinhibition Impulsivity Antisociality CAB-SU .32 .27a .37b CAB-ASB .48 .33a .53b CAB-IPV .32 .33a .29a Note: CAB-SU=Crime and Analogous Behaviors-Substance Use scale; CAB-ASB=Crime and Analogous Behaviors-Antisocial Behavior scale; CAB-IPV=Crime and Analogous Behaviors-Intimate Partner Violence scale; mismatching superscripts indicate that the correlations between the latent factors and the outcome variable are significantly different from one another at p<.05. All individual correlations were significant (p’s < .05 - .001), except those below r = .11

Running Head: LATENT VARIABLE ANALYSIS TRIPM 42
Figure 1. Boldness items: Three-factor model (Standardized parameters)
hard time making things turn out the way I want. [F]
don't stack up well against most others. [F]
optimistic more often than not
never worry about making a fool of myself with others
worry in unfamiliar situation without knowing all the details. [F]
easy to embarrass me. [F]
afraid of far fewer things than most people.
get over things that would traumatize others
scared easily. [F]
not very good at influencing people. [F]
convince people to do what I want
don’t like to take the lead in groups. [F]
born leader
knack for influencing people
Leader
StressImmune
PositiveSelf
.84
.81
.67
.77
.81
.62
.67
.59
.55
.77
.51
.68
.73
.81
.72
.66
.60

Running Head: LATENT VARIABLE ANALYSIS TRIPM 43
Figure 2. Meanness items: Two-factor model (Standardized parameters)
Things are more fun if a little danger is involved.
I've injured people to see them in pain.
I insult people on purpose to get a reaction from them.
I taunt people just to stir things up.
Not any point in worrying if what I do hurts someone else.
I enjoy a good physical fight.
I enjoy pushing people around sometimes.
I would enjoy being in a high-speed chase.
It’s easy for me to relate to other people’s emotions. [F]
I am sensitive to the feelings of others. [F]
I don't have much sympathy for people.
other people feel is important to me. [F]
I sympathize with others’ problems. [F]
Callous
EnjoyHurting
.69
.84
.89
.84
.76
.58
.80
.88
.79
.73
.83
.72
.72
.63

Running Head: LATENT VARIABLE ANALYSIS TRIPM 44
Figure 3. Disinhibition items: Two-factor model (Standardized parameters)
I have robbed someone.
I have taken items from a store without paying for them.
I have lost a friend because of irresponsible things I've done.
Taken money from someone's purse or wallet without asking.
I have conned people to get money from them.
I have missed work without bothering to call in.
I often get bored quickly and lose interest..
I have a hard time waiting patiently for things I want..
I jump into things without thinking.
I have good control over myself. [F].
often act on immediate needs.
often missed things I promised to attend.
I have stolen something out of a vehicle.
Impulsive
Antisocial
.50
.63
.78
.57
.70
.67
.80
.80
.69
.71
.78
.66
.82
.57

Running Head: LATENT VARIABLE ANALYSIS TRIPM 45
Figure 4 Discrimination between offender and Non-offender cases via three- versus seven-factor model
Note. Hedge’s g for the three-factor composites (Boldness, Meanness, Disinhibition, respectively) were, .17, .58, 1.45, and seven factor composites (Leader, Stress-immune, Positive self-image; Callous, Enjoyment in hurting; Impulsivity, Antisociality, respectively) were, .01, .01, .86; .31, .79; .43, 1.90.
0.00
0.50
1.00
1.50
2.00
2.50
3.00
Boldness Meanness Disinhibition
OffenderNon-offender
0.00
0.50
1.00
1.50
2.00
2.50
3.00
Leader Stressimmunity
Positive self Callous EnjoyHurting
Impulsivity Antisocial
OffenderNon-offender

Running Head: LATENT VARIABLE ANALYSIS TRIPM 46
Supplementary Material
Table S1 Sample Descriptive Statistics
Sample 1 (N = 1064) Mean Std. Dev. α MIC
Boldness 1.49 0.49 0.87 0.27 Meanness 0.59 0.48 0.90 0.33 Disinhibition 0.74 0.50 0.88 0.28 Emergent factors
Leader 1.51 0.76 0.83 0.50 Stress Immune 1.42 0.66 0.75 0.33 Positive Self 2.02 0.75 0.72 0.46 Callous 0.69 0.65 0.85 0.53 Enjoy Hurting 0.46 0.54 0.84 0.41 Impulsive 1.20 0.61 0.74 0.32 Antisocial 0.42 0.55 0.77 0.34
Sample 2 (N = 603) Mean Std. Dev. α MIC
Boldness 1.53 0.51 0.87 0.26 Meanness 0.58 0.45 0.89 0.32 Disinhibition 0.76 0.45 0.87 0.26 Emergent factors
Leader 1.51 0.73 0.84 0.51 Stress Immune 1.42 0.62 0.72 0.30 Positive Self 1.99 0.74 0.73 0.49 Callous 0.74 0.65 0.87 0.57 Enjoy Hurting 0.43 0.47 0.79 0.33 Impulsive 1.25 0.54 0.68 0.25 Antisocial 0.39 0.48 0.74 0.30
Sample 3 (N = 591) Mean Std. Dev. α MIC
Boldness 1.52 0.51 0.87 0.25 Meanness 0.59 0.45 0.89 0.33 Disinhibition 0.76 0.45 0.86 0.26 Emergent factors
Leader 1.51 0.73 0.84 0.50 Stress Immune 1.42 0.62 0.73 0.31 Positive Self 1.99 0.74 0.74 0.48 Callous 0.75 0.65 0.82 0.54 Enjoy Hurting 0.43 0.47 0.80 0.34 Impulsive 1.24 0.54 0.68 0.26 Antisocial 0.38 0.48 0.74 0.30

Running Head: LATENT VARIABLE ANALYSIS TRIPM 47
Sample 4 (N = 511) Mean Std. Dev. α MIC
Boldness 1.44 0.44 0.82 0.20 Meanness 0.57 0.40 0.86 0.27 Disinhibition 0.68 0.34 0.80 0.19 Emergent factors
Leader 1.37 0.66 0.79 0.43 Stress Immune 1.34 0.58 0.70 0.28 Positive Self 1.91 0.57 0.45 0.21 Callous 0.61 0.49 0.65 0.30 Enjoy Hurting 0.52 0.50 0.81 0.35 Impulsive 1.29 0.49 0.60 0.20 Antisocial 0.23 0.35 0.63 0.24
Sample 5 (N = 465) Mean Std. Dev. α MIC
Boldness 1.37 0.44 0.82 0.20 Meanness 0.63 0.40 0.83 0.22 Disinhibition 0.56 0.39 0.85 0.23 Emergent factors
Leader 1.41 0.63 0.79 0.42 Stress Immune 1.50 0.60 0.73 0.31 Positive Self 0.93 0.57 0.47 0.23 Callous 0.71 0.55 0.69 0.32 Enjoy Hurting 0.57 0.51 0.79 0.34 Impulsive 1.00 0.56 0.70 0.28 Antisocial 0.23 0.39 0.69 0.28
Sample 6 (N = 150) Mean Std. Dev. α MIC
Boldness 1.45 0.46 0.80 0.17 Meanness 0.73 0.56 0.91 0.36 Disinhibition 1.32 0.65 0.88 0.26 Emergent factors
Leader 1.27 0.74 0.82 0.47 Stress Immune 1.50 0.55 0.55 0.25 Positive Self 1.77 0.57 0.50 0.23 Callous 0.77 0.64 0.79 0.44 Enjoy Hurting 0.68 0.64 0.83 0.38 Impulsive 1.26 0.62 0.71 0.28 Antisocial 1.33 0.96 0.84 0.43 Note: TriPM means are presented in mean item format (i.e., sum scale total / number of scale items) to provide average endorsement level for scale items. TriPM items are scaled from 0 (false) – 3 (true); Std. Dev. = Standard Deviation; α = Cronbach’s alpha; MIC=mean inter-item correlation
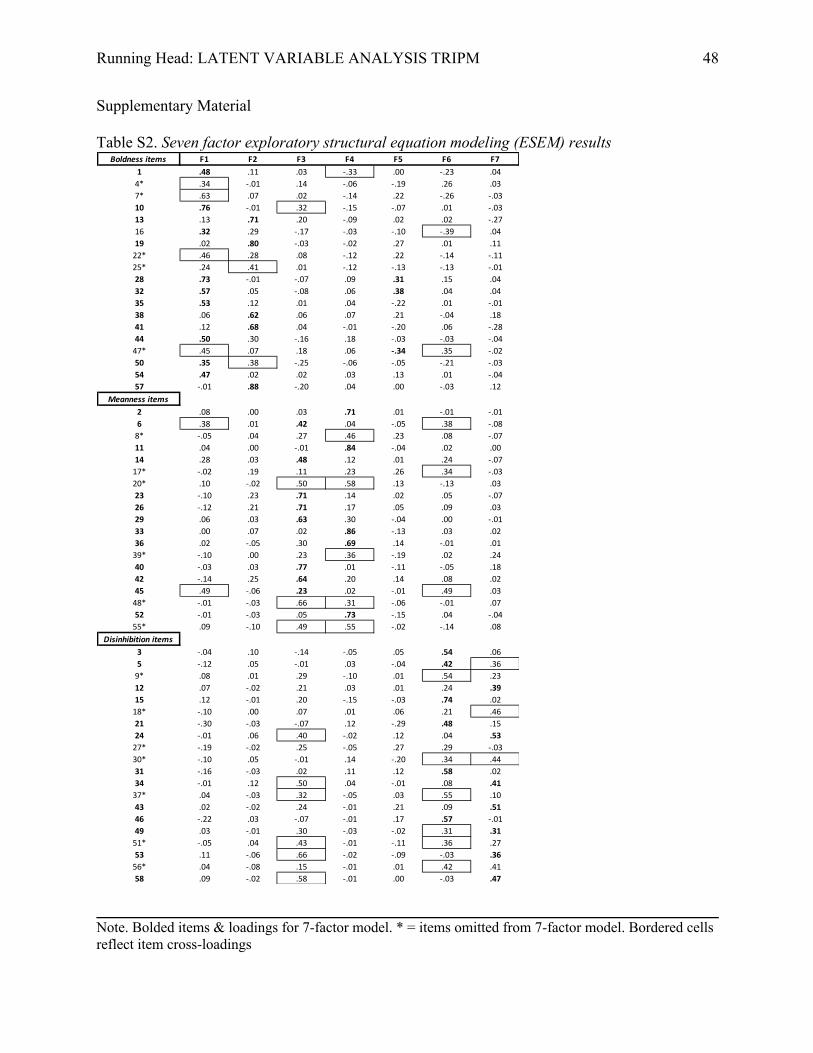
Running Head: LATENT VARIABLE ANALYSIS TRIPM 48
Supplementary Material Table S2. Seven factor exploratory structural equation modeling (ESEM) results
Note. Bolded items & loadings for 7-factor model. * = items omitted from 7-factor model. Bordered cells reflect item cross-loadings
Boldness items F1 F2 F3 F4 F5 F6 F71 .48 .11 .03 -.33 .00 -.23 .044* .34 -.01 .14 -.06 -.19 .26 .037* .63 .07 .02 -.14 .22 -.26 -.0310 .76 -.01 .32 -.15 -.07 .01 -.0313 .13 .71 .20 -.09 .02 .02 -.2716 .32 .29 -.17 -.03 -.10 -.39 .0419 .02 .80 -.03 -.02 .27 .01 .1122* .46 .28 .08 -.12 .22 -.14 -.1125* .24 .41 .01 -.12 -.13 -.13 -.0128 .73 -.01 -.07 .09 .31 .15 .0432 .57 .05 -.08 .06 .38 .04 .0435 .53 .12 .01 .04 -.22 .01 -.0138 .06 .62 .06 .07 .21 -.04 .1841 .12 .68 .04 -.01 -.20 .06 -.2844 .50 .30 -.16 .18 -.03 -.03 -.0447* .45 .07 .18 .06 -.34 .35 -.0250 .35 .38 -.25 -.06 -.05 -.21 -.0354 .47 .02 .02 .03 .13 .01 -.0457 -.01 .88 -.20 .04 .00 -.03 .12
Meanness items2 .08 .00 .03 .71 .01 -.01 -.016 .38 .01 .42 .04 -.05 .38 -.088* -.05 .04 .27 .46 .23 .08 -.0711 .04 .00 -.01 .84 -.04 .02 .0014 .28 .03 .48 .12 .01 .24 -.0717* -.02 .19 .11 .23 .26 .34 -.0320* .10 -.02 .50 .58 .13 -.13 .0323 -.10 .23 .71 .14 .02 .05 -.0726 -.12 .21 .71 .17 .05 .09 .0329 .06 .03 .63 .30 -.04 .00 -.0133 .00 .07 .02 .86 -.13 .03 .0236 .02 -.05 .30 .69 .14 -.01 .0139* -.10 .00 .23 .36 -.19 .02 .2440 -.03 .03 .77 .01 -.11 -.05 .1842 -.14 .25 .64 .20 .14 .08 .0245 .49 -.06 .23 .02 -.01 .49 .0348* -.01 -.03 .66 .31 -.06 -.01 .0752 -.01 -.03 .05 .73 -.15 .04 -.0455* .09 -.10 .49 .55 -.02 -.14 .08
Disinhibition items3 -.04 .10 -.14 -.05 .05 .54 .065 -.12 .05 -.01 .03 -.04 .42 .369* .08 .01 .29 -.10 .01 .54 .2312 .07 -.02 .21 .03 .01 .24 .3915 .12 -.01 .20 -.15 -.03 .74 .0218* -.10 .00 .07 .01 .06 .21 .4621 -.30 -.03 -.07 .12 -.29 .48 .1524 -.01 .06 .40 -.02 .12 .04 .5327* -.19 -.02 .25 -.05 .27 .29 -.0330* -.10 .05 -.01 .14 -.20 .34 .4431 -.16 -.03 .02 .11 .12 .58 .0234 -.01 .12 .50 .04 -.01 .08 .4137* .04 -.03 .32 -.05 .03 .55 .1043 .02 -.02 .24 -.01 .21 .09 .5146 -.22 .03 -.07 -.01 .17 .57 -.0149 .03 -.01 .30 -.03 -.02 .31 .3151* -.05 .04 .43 -.01 -.11 .36 .2753 .11 -.06 .66 -.02 -.09 -.03 .3656* .04 -.08 .15 -.01 .01 .42 .4158 .09 -.02 .58 -.01 .00 -.03 .47