triacylglycerol structures of
TRANSCRIPT
1. LIQ. CHROM. & REL. TECHNOL., 24(6), 837-854 (2001)
TRIACYLGLYCEROL STRUCTURES OFFOOD FATS HIGH IN SATURATED ACIDSBY HPLC AND MASS SPECTROMETRY
William E. Neff*, Wm. C. Byrdwellt , and Gary R. List
Food Quality and Safety Research, NCAUR, ARS, USDA,Peoria, IL 61604, USA
ABSTRACT
Triacylglycerol (TAG) compositions by area percent wereobtained by reverse-phase high-performance liquid chromatography (RP-HPLC) coupled with atmospheric pressure chemical ionization mass spectrometry (APCI-MS) of highly saturated fattyacid fats, such as coconut, cocoa butter, palm, randomized palm,palm olein, and randomized palm olein oils. Accurate identification and quantitation of these TAG compositions were obtainedand proved by comparison of the fatty acid composition calculatedfrom the TAG composition obtained by APCI-MS with the fattyacid composition obtained by gas chromatography of the methylesters of the transmethylated oils. Also, APCI-MS accuracy wasproved by comparison of the experimental TAG composition withthe predicted TAG composition for randomized oils. Averageabsolute errors, with respect to TAG quantitation and identification, were less than 1%. Our study identified and quantitated theseTAGs present at greater than 0.1 % (oil, number of TAGs):
*Corresponding author.tpresent address: Department of Chemistry and Biochemistry, Florida Atlantic University,Boca Raton, FL 33431.
837
Copyright [~, 1001 by Marcel Dekker, Inc. www.dekker.com
838 NEFF, BYRDWELL, AND LIST
coconut, 99; palm, 27: randomized palm, 28; palm olein, 28; randomized palm olein, 29, and cocoa butter, 19. Concentrations ofUUU, UUS, USS, and SSS TAGs, which can be determined accurately from RP-HPLC/APCI-MS of the actual TAG species,affected the physical properties of food formulation fats.
INTRODUCTION
Improvement of the functional properties of vegetable fats through thedevelopment of new fats with increased amounts of saturated fatty acids, such ashigh palmitic and stearic acid soybean and high stearic and lauric acid canola oils(1-5), or the chemical- or lipase-catalyzed modification oftraditional commodityoils (6-9) for food formulation products, such as margarine base stocks and confectionery products, has been in progress. However, traditional fats such ascoconut, cocoa butter, palm, randomized palm, palm olein, and randomized palmolein oils remain important (10).
The triacylglycerol (TAG) composition (i.e., kinds and quantities of individual TAGs) and TAG structure [i.e., kinds and quantities of individual fattyacids (FAs) located at the TAG glycerol moiety carbons] affect the food formulation product functional properties, such as melting point range, solid fat index,and crystal structure. These physical properties affect food properties from texture to taste (10, II ). Also, the fat oxidative stability is, in part, dependent on TAGcomposition and structure (12-15).
The oxidative stability affects the storage as well as the nutritional andsafety stability of the food product. Also, altered fats are investigated as substitutes for presently important commercial fats, such as coconut and cocoa butterin confectionery and other food formulation products (16). Thus, it is importantto know the TAG composition of the altered fats, compared to the TAG composition of coconut and cocoa butter. In summary, the knowledge of the kinds andquantities of individual TAGs in vegetable oils is important in food chemistry.
Previously, for qualitative TAG analysis, identification ofTAGs resolved byreverse-phase high-performance liquid chromatography (RP-HPLC) of fats, wasconducted by collection of HPLC fractions for subsequent gas chromatographyidentification of the TAG methyl esters after transmethylation or by matchingHPLC retention times or volumes with TAG equivalent carbon numbers withrespect to standard TAGs (17-19). Recently, RP-HPLC, coupled with atmospheric pressure chemical ionization mass spectrometry (APCI-MS), has beenused to conclusively identifY eluting TAGs during RP-HPLC offats (20,21).
MS of the TAGs through use of the APCI-MS method gave spectra whichcontained a simplified number of very distinctive fragment ions including diacylglyceroL protonated molecular ions, and molecular related ions that conclusively
TAG STRUCTURES OF FOOD FATS 839
identified individual TAGs in vegetable oil TAG mixtures. Thus, this newmethodology permitted the facile determination of the kinds of TAGs in manyvegetable oil mixtures (VGO).
For quantitative TAG analysis, the weakness has been the method of detection, since TAGs do not have strongly chromatophoric groups and the gradientsolvent system needed for RP-HPLC TAG resolution presents absorbance problems for the commonly used HPLC ultraviolet absorbance detector. Christie andothers (22-27) have written extensive reviews on possible HPLC detectors forquantitative TAG analysis. The consensus of these authors is, that while not perfect, the HPLC flame ionization detector (FlO) and evaporative light scatteringdetector (ELSD) are the preferred detectors for quantitative TAG analysis.
We have made extensive use of a FlO for quantitative HPLC analysis ofindividual TAGs in VGO mixtures (17,19). This detector allowed TAG quantitation without the need for detector response factors. Thus, TAG quantitation wasobtained as area percent, which for the FlO is related to weight percent, obtainedby computer integration of the RP-HPLC TAG chromatogram peak areas.Accuracy of the TAG composition could then be checked by comparison of theFA composition calculated from the experimental TAG composition againstexperimental FA composition obtained from gas chromatography (GC) analysisof the transmethylated VGO mixture.
We have also used APC1-MS as a quantitative detector for RP-HPLC ofVGO (20,21). This detector was determined to give quantitative results for TAGsthrough facile calculation of individual response factors of individual TAGsbased on the raw MS response and the FA composition previously obtained byGC of the VGO mixture.
Also, since a mass spectrometer is being used as the HPLC detector, selective ion monitoring can be used for identification and quantitation of unresolvedTAGs. Thus, RP-HPLC coupled with a quadrapole mass spectrometer through anatmospheric pressure chemical ionization source can more completely identifyand quantitate all TAGs present in a vegetable oil than other TAG identificationtechniques.
It is important to know accurately the TAG structure of coconut, cocoa butter, palm, randomized palm, palm olein, and randomized palm olein oils in thedevelopment of food formulation products for confectionery, shortening, margarine, and other food products. In this report, the TAG compositions ofthese oilswere obtained by RP-HPLC coupled with APCI-MS as a HPLC detector. Accurate identification and quantitation of these TAG compositions were obtainedand proved by comparison of the fatty acid composition calculated from the TAGcomposition obtained by APCI-MS with the fatty acid composition obtained byGC of the methyl esters of the transmethylated oils. Also, APCI-MS accuracywas proved by comparison of the experimental TAG composition with the predicted TAG composition for randomized oils.
840 NEFF, BYRDWELL, AND LIST
EXPERIMENTAL
Materials
The coconut, cocoa butter, palm olein, and palm oil samples were obtainedfrom either local market or industrial sources as refined, bleached, deodorizedfinished oils. Randomized oils were prepared in the presence of sodium methoxide as a catalyst (28).
HPLC mobile solvents, acetonitrile (ACN) and dichloromethane (DCM),were HPLC grade and were purchased from EM Science (Gibbstown, NJ, USA)and Fisher Scientific (Fairlawn, NJ, USA), respectively. They were used withoutfurther purification.
High-Performance Liquid Chromatography
The HPLC system used for RP-HPLC/APCI-MS, contained a LOC 4100mass spectrometer (Thermo Separation Products), and a quaternary pump withmembrane degasser, which was equipped with two in-series RP-HPLC columns[25 x 0.46 cm, with bonded silyl (CT8) ODS, 5-llm particle size, Inertsil OOS80A; GL Sciences, Keystone Scientific-Bellefonte Park, PA, USA).
The gradient used for separation of the TAG components was as follows:initial conditions 70% ACN/30% DCM; from 0 to 20 min, then linear from 20 to40 min to 60% ACN/40% DCM, kept at 60% ACN/40% DCM to 50 min, thanlinear to 40% ACN/60% DCM at 70 min, kept at 40% ACN/60% DCM to 75min, than linear to 30% ACN170% OCM at 80 min, kept at 30% ACNI70% DCMto 85 min, then linear return to initial conditions, 70% ACN/30 OCM at 99 min.The flow rate was 0.7 mL/min throughout. Flow was split, using a tee, so that-680 ilL/min went to an ELSD and -120 ilL/min went to the mass spectrometer.
A Varex MKlII ELSD detector (Alltech Associates, Deerfield, IL, USA)was used as an auxiliary detector for RP-HPLC/APCI-MS. The drift tube was setto 140°C. The gas flow was 2.0 standard L min. High purity N: was used as thenebulizer gas.
ELSO output was simultaneously directed to a stand-alone data systemwith 24-bit resolution (EZ-Chrome Elite; Scientific Software, Inc., Pleasanton,CA, USA). Injections of 10 mL were made using a series 1050 autosampler(Hewlett-Packard, Wilmington, DE, USA).
Atmospheric Pressure Chemical Ionization Mass Spectrometer Detector
Identification and quantitation of TAG components were performed withAPCI-MS. A MAT TSQ700 (Finnigan, San Jose, CA, USA) mass spectrometer
TAG STRUCTURES OF FOOD FATS 841
operating in Ql low-mass mode was used for acquisition of APCI-MS data. TheAPCI-MS vaporizer was operated at 400°C, the capillary heater was operated at265°C, and the corona voltage was set to 6.0 rnA. Sheath and auxiliary gaseswere set to 35 psi and 5 mUmin, respectively. Spectra were obtained from 400 to1100 amu with a scan time of 1.75-2.0 s.
Chromatograms were processed using three-point smoothing for graphicaloutput, but no smoothing was applied during quantitation of extracted ion chromatograms. All mass spectra shown represent an average of spectra over thebreath of a chromatographic peak. Nominal masses, shown in mass spectra, wereobtained by application of a mass defect of 0 mmu at 0 amu to 700 mmu at 1000amu.
Gas Chromatography
Fatty acid methyl esters (FAMEs) were prepared by 0.5 Nhydrochloric acidin methanol transmethylation of the TAG mixtures (29). For oils with shorterchain fatty acids (C:6, 8, and 10), such as coconut oil, to avoid loss of morevolatile acids, the benzene/methanol was only water-washed to remove thehydrochloric acid. Without further work, up to a 5-IlL portion of the benzenelayer was injected directly onto the gas chromatograph. The FAMEs were analyzed using calibrated GC according to this procedure. A 0.5-IlL FAME samplesolution (5 mg of sample per mL of hexane) was analyzed by direct injection capillary Gc. The capillary column was a SP2380 column, 30 m x·0.25 mm insidediameter with O.2-llm film thickness (Supelco, Inc., Bellefonte, PA, USA).
The gas chromatograph was a Star model 3400, equipped with a flame ionization detector (Varian, Inc., Walnut Creek, CA, USA). The GC column wasoperated at a starting temperature of 150°C, except for coconut oil, whichrequired a starting temperature of 75°C. The column was programmed at 150°C,held for 35 min, then heated at 2°C/min to 210°C, and then to 220°C and held at220°C for 5 min. The helium carrier gas had a column head pressure of 15 psi.The injector and detector were maintained at 240 and 280°C, respectively. GCcalibration mixtures were FAME mixture 20A for all oils, except coconut oil,which required FAME mixture 4°C (C:6, 8, 10, 12, and 14 FAMEs) (NU-CHEKPREP, Inc., Elysian, MN, USA).
The GC analyses were used to calibrate the crude mass spectrometric datato provide accurate quantitation ofTAG components.
Physical Property Tests
The solid fat index (SFI) and melting points were determined by theAmerican Oil Chemists' Society official methods (30).
842 NEFF, BYRDWELL,AND LIST
RESULTS AND DISCUSSION
TAG compositions by area percent were obtained by RP-HPLC/APCI-MSof highly saturated fatty acid fats, such as coconut, cocoa butter, palm, randomized palm, palm olein, and randomized palm olein oils. These fats, often in combination with corn, cottonseed, and soybean oils or their derivatives, such as cottonseed oil hard stock, are used in products for confectionery, shortening,margarine base stocks, and other food products. Accurate identification andquantitation of these saturated fatty acid TAG compositions are needed to understand the TAG effect on food lipid physical properties, such as solid fat contentand melting point (31).
Identification of individual TAGs was possible because MS with the APCIsource gave easy-to-interpret mass spectra with primarily TAG-identifyingdiglyceride fragments and molecular ion information. The simple appearance ofspectra and the use of extracted ion chromatograms of characteristic diglyceridefragments and molecular ions made qualitative and quantitative analysis straight+forward and facile.
The accuracy of TAG identification and quantitation was proved by comparison of the fatty acid composition calculated from the response factor-corrected TAG composition, obtained from APCI-MS of the oils, with the fatty acidcomposition obtained by GC of the methyl esters of the transmethylated oils.Also, APCI-MS accuracy was proved by comparison of the experimental TAGcomposition with the predicted TAG composition for randomized oils.
TAG identification from the APCI-MS spectra was based on mass spectra,which showed that minimal fragmentation occurred (32). The fragmentationresulted primarily in diglyceride [M-RCOOr ions and [M + I] protonated ions.The degree of fatty acid unsaturated in the TAGs had a marked effect on the proportion of diglyceride compared to protonated molecular ions. Mass spectra oftriglycerides, which contained fatty acids with two or three double bonds, showedprotonated molecular ions as the abundant ions with diglyceride peaks representing 13-25% of the base peak. The triglycerides, which contained fatty acids withone double bond, produced diglycerides as the base peak and [M + I] ions withintensity of 20-28% of the base peak. No [M + 1] ions were found in the spectraoftriglycerides that contained only saturated fatty acids, and only the characteristic TAGs identifying diglyceride pairs. Extracted ion chromatograms were usedto identify those TAGs that had the same RP-HPLC retention.
For TAG quantitation via APCI-MS data, the following procedure wasused. The total ionization chromatogram area count for each TAG was obtainedby the sum of the areas under all peaks of fragments arising from a particularTAG plus the area under the mass of the protonated molecular ion. This gave rawor uncorrected TAG composition per oil. The amount of fragmentation in APCIMS spectra has been shown to strongly depend on the degree of unsaturation in
TAG STRUCTURES OF FOOD FATS 843
the TAG. Because ofthis, quantitation ofTAGs by APCI-MS also has been shownto depend on the degree of unsaturation in the TAG. TAGs that contain a highdegree of unsaturation produced more molecular ion and give less overallresponse, while those TAGs that are more saturated give mostly [M-RCOOrfragments and larger chromatogram peak areas to represent these fragments. Thesaturates tend to be over-represented in percent compositions, while the unsaturates tend to be under-represented. To solve this, a method for calculation ofresponse factors for TAGs determined by APCI-MS was developed (33).
Response factors were calculated for each fatty acid by dividing the FAcomposition obtained by calibrated GC-FID of the transmethylated oil by the FAcomposition calculated from the uncorrected TAG composition. The responsefactors were thus, calculated for an oil TAG by calculating the ratio of the FAcomposition obtained by GC-FID to the FA composition calculated from the rawTAG composition obtained by APCI-MS.
These data were then normalized to one of the FAs set equal to 1.0, whichwas usually the FA with the least area percent (unless it was present at a very lowlevel, in which case the FA with the smallest area percent over 1% was used).Using these FA response factors, TAG response factors were calculated by multiplying the FA response factors together. For example, in the case of coconut oil,the TAG response factor for LaLaLa (trilaurin) was 1.0000, while that for LaLaOwas 1.1361. When the full set of TAG response factors was applied to the rawAPCI-MS data, the adjusted or corrected TAG area percent, given in Table I,resulted for coconut oil. This corrected TAG composition was possible becauseFA response factors were multiplied together to give TAG response factors, whichwhen applied to the uncorrected TAG composition gives a TAG composition,which has been demonstrated to have the lowest average relative error comparedto other methods (20,33). This method for TAG quantitative analysis is extendedto the present study of the triglyceride compositions of food formulation products.
Accuracy ofTAG identification and quantitation for each oil is indicated byagreement of the fatty acid composition calculated from the corrected TAG composition with the experimental fatty acid composition obtained by GC of themethyl esters obtained from the transmethylated oil.
Coconut Oil
This oil contained nine low to high boiling point FAs, which were 0.7%capric (Co), C6:0; 8.1% caprylic (Cy), C8:0; 6.3% caproic (Ca), C10:0; 48.3%lauric (La), CIO:O; 18.1% myristic (M), C14:0; 8.4% palmitic (P), C16:0; 1.8%linoleic (L), C18:2; 5.9% oleic (0), C18:1; and 2.4% stearic (S), C18:0 acids, asdetermined by calibrated GC of the FAMEs from the transmethylated oil.
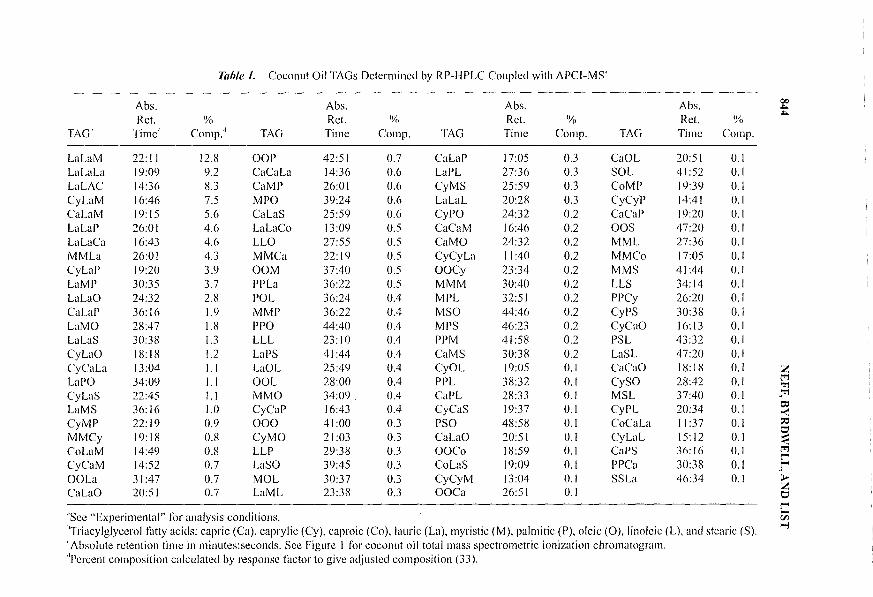
Table 1. Coconut Oil TAGs Dctcrmined by RP-HPLC Coupled with APCI-MS'
Abs. Abs. Abs. Abs. 00
""''Yl, Ret. 'Yl, ""'Ret. % Ret. Ret. %TAGh Time
,Comp:' TAG Time Compo TAG Time Compo TAG Time Compo
LaLaM 22:11 12.8 OOP 42:51 0.7 CaLaP 17:05 0.3 CaOL 20:51 0.1LaLaLa 19:09 9.2 CaCaLa 14:36 0.6 LaPL 27:36 0.3 SOL 41:52 0.1La LAC 14:36 8.3 CaMP 26:01 0.6 CyMS 25:59 0.3 CoMP 19:39 0.1CyLaM 16:46 7.5 MPO 39:24 0.6 LaLaL 20:28 0.3 CyCyP 14:41 0.1CaLaM 19:15 5.6 CaLaS 25:59 0.6 CyPO 24:32 0.2 CaCaP 19:20 0.1LaLaP 26:01 4.6 LaLaCo 13:09 0.5 CaCaM 16:46 0.2 OOS 47:20 0.1LaLaCa 16:43 4.6 LLO 27:55 0.5 CaMO 24:32 0.2 MML 27:36 0.1MMLa 26:01 4.3 MMCa 22:19 0.5 CyCyLa 11:40 0.2 MMCo 17:05 0.1CyLaP 19:20 3.9 OOM 37:40 0.5 OOCy 23:34 0.2 MMS 41:44 0.1LaMP 30:35 3.7 PPLa 36:22 0.5 MMM 30:40 0.2 LLS 34:14 0.1LaLaO 24:32 2.8 POL 36:24 0.4 MPL 32:51 0.2 PPCy 26:20 0.1CaLaP 36:16 1.9 MMP 36:22 0.4 MSO 44:46 0.2 CyPS 30:38 0.1LaMO 28:47 1.8 PPO 44:40 0.4 MPS 46:23 0.2 CyCaO 16:13 0.1LaLaS 30:38 1.3 LLL 23:10 0.4 PPM 41:58 0.2 PSL 43:32 0.1CyLaO 18:18 1.2 LaPS 41:44 0.4 CaMS 30:38 0.2 LaSL 47:20 0.1CyCaLa 13:04 1.1 LaOL 25:49 0.4 CyOL 19:05 0.1 CaCaO 18:18 0.1 ZLaPO 34:09 1.1 OOL 28:00 0.4 PPL 38:32 0.1 CySO 28:42 0.1
t'"j"f'l
CyLaS 22:45 1.1 MMO 34:09 0.4 CaPL 28:33 0.1 MSL 37:40 0.1 ."f'l
LaMS 36:16 1.0 CyCaP 16:43 0.4 CyCaS 19:37 0.1 CyPL 20:34 0.1 C'.:l><.
CyMP 22:19 0.9 000 41:00 0.3 PSO 48:58 0.1 CoCaLa II :37 0.1 E§MMCy 19:18 0.8 CyMO 21:03 0.3 CaLaO 20:51 0.1 CyLaL 15:12 0.1 ::ECoLaM 14:49 0.8 LLP 29:38 0.3 OOCo 18:59 0.1 CaPS 36:16 0.1 t"'1
t'""CyCaM 14:52 0.7 LaSO 39:45 0.3 CoLaS 19:09 0.1 PPCa 30:38 0.1 .rOOLa 31:47 0.7 MOL 30:37 0.3 CyCyM 13:04 0.1 SSLa 46:34 0.1 ;..
ZCaLaO 20:51 D.7 LaML 23:38 0.3 OOCa 26:51 D.I 0
t'"""See "Experimental" for analysis conditions. -VJ
hTriacylglyeerol Illtty acids: capric (Ca), caprylic (Cy), caproic (Co), lauric (La), myristic (M), palmitic (P), oleic (0), linoleic (L), and stearic (S).....,
'Absolute retention time in minutes:seconds. See Figure I for coconut oil total mass spectrometric ionization chromatogram."Percent composition calculated by response HlctOr to give adjusted composition (33).
TAG STRUCTURES OF FOOD FATS 845
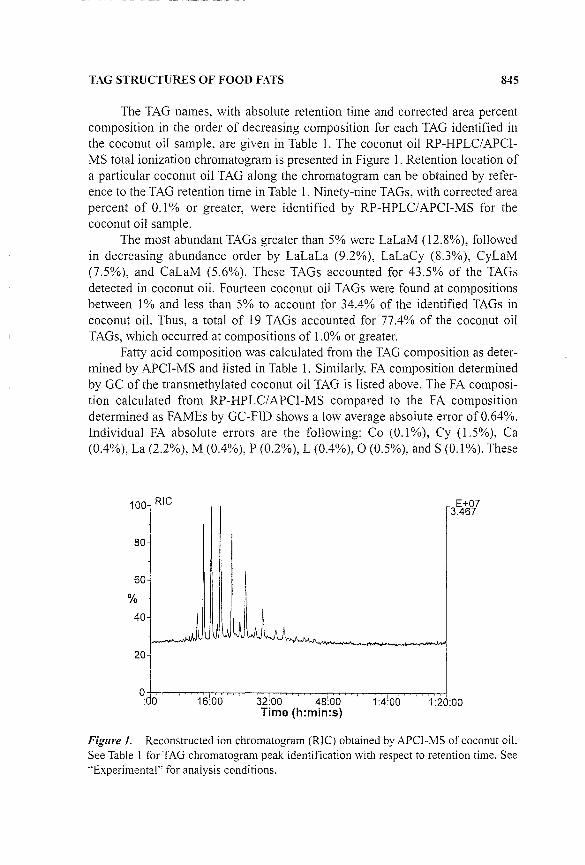
The TAG names, with absolute retention time and corrected area percentcomposition in the order of decreasing composition for each TAG identified inthe coconut oil sample, are given in Table 1. The coconut oil RP-HPLC/APCIMS total ionization chromatogram is presented in Figure I. Retention location ofa particular coconut oil TAG along the chromatogram can be obtained by reference to the TAG retention time in Table I. Ninety-nine TAGs, with corrected areapercent of 0.1% or greater, were identified by RP-HPLC/APCI-MS for thecoconut oil sample.
The most abundant TAGs greater than 5% were LaLaM (12.8%), followedin decreasing abundance order by LaLaLa (9.2%), LaLaCy (8.3%), CyLaM(7.5%), and CaLaM (5.6%). These TAGs accounted for 43.5% of the TAGsdetected in coconut oil. Fourteen coconut oil TAGs were found at compositionsbetween I% and less than 5% to account for 34.4% of the identified TAGs incoconut oil. Thus, a total of 19 TAGs accounted for 77.4% of the coconut oilTAGs, which occurred at compositions of 1.0% or greater.
Fatty acid composition was calculated from the TAG composition as determined by APCI-MS and listed in Table I. Similarly, FA composition determinedby GC of the transmethylated coconut oil TAG is listed above. The FA composition calculated from RP-HPLC/APCI-MS compared to the FA compositiondetermined as FAMEs by GC-FID shows a low average absolute error of 0.64%.Individual FA absolute errors are the following: Co (0.1 %), Cy (1.5%), Ca(0.4%), La (2.2%), M (0.4%), P (0.2%), L (0.4%), 0 (0.5%), and S (0.1 %). These
100 RIC
r'''.w! I80
~~60
%
40 J20
0:do 16~00 32~00 48:00 1:4l00 1:20:00
Time (h:min:s)
Figure 1. Reconstructed ion chromatogram (RIC) obtained by APCI-MS of coconut oil.See Table I for TAG chromatogram peak identification with respect to retention time. See"Experimental" for analysis conditions.
846 NEFF, BYRDWELL, AND LIST
results confirm the identification and quantitation here of complex TAGs mixture, such as coconut oil TAGs.
Palm Oil
This oil contained 1.1% M, 47.2% P, 38.8% 0, 8.9% L, and 3.9% S, asdetermined by calibrated GC of the FAMEs from the transmethylated oil. TheTAG composition obtained by RP-HPLCIAPCI-MS for palm oil is listed in Table2. The corrected TAG composition obtained by RP-HPLC/APCI-MS showed 27TAGs at 0.1 % or greater. The most abundant TAGs at 5.0% or greater were PPO(35.0%), followed by OOP (24.2%), PPL (9.6%), PLO, (8.8%), and POS (5.5%)to account for 83.1 % of the palm oil TAGs.
The FA composition, which was calculated from the TAG compositionlisted in Table 2 as determined by APCI-MS, is 1.0% M, 45.8 P, 9.3% L, 40.2%0, and 3.7% S. Comparison of this calculated FA composition with the experimental FA composition given above, determined by GC of the transmethylatedpalm oil, showed a low average absolute error of 0.7% with the values 0.1, 1.4,0.2, 1.4, and 0.2% for M, p, L, 0, and S, respectively. These results confirm theidentification and quantitation of the palm oil TAGs.
Retention data for individual TAGs, for which the composition data arelisted in Table 2, are given in the retention index values in Table 2. In the retentionindex file, mass spectrometric scan numbers are used instead of retention timesbecause results can be given to two significant figures. All scan numbers are referenced to PPO because it was one of the most abundant TAGs for all the oils,except for coconut oil. This retention index procedure gave the lowest standarddeviation (0.01-0.04) between all of the different runs of the different oil samples.
Randomized Palm Oil
This oil contained five FAs, which were 1.1% M, 45.7% P, 9.2% L, 39.8%0, and 4.2% S, as determined by calibrated GC of the FAMEs from the transmethylated oil. This oil contained, as expected, essentially the same FA composition as nonrandomized palm oil.
The TAG composition obtained by RP-HPLCIAPCI-MS for randomizedpalm oil is listed with the TAG retention index in Table 2. The corrected experimental TAG composition obtained by RP-HPLCIAPCI-MS detected 28 TAGs at0.1 % or greater. The most abundant TAGs PPO at 5.0% or greater were PPO(23.1%) followed by OOP (21.4%), PPP (10.8%), and 000 (7.9%) for a total of63.2% randomized palm oil TAGs. These data, compared with the statistically
TAG STRUCTURES OF FOOD FATS 847
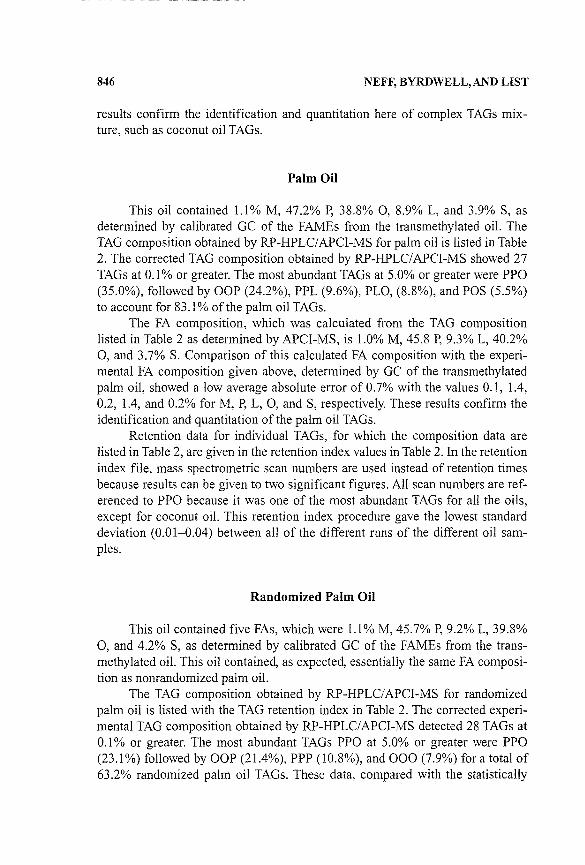
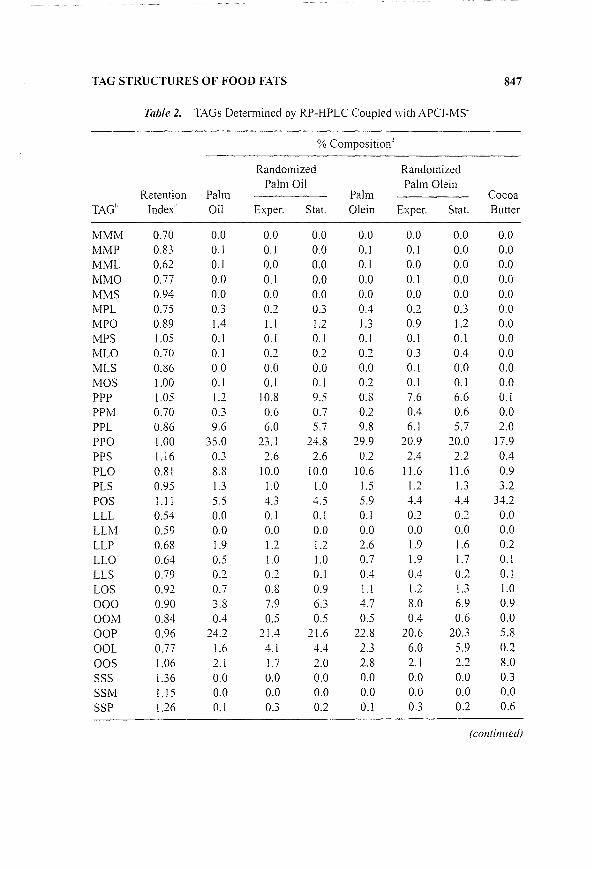
Table 2. TAGs Determined by RP-HPLC Coupled with APCI-MS'
% Composition"
Randomized RandomizedPalm Oil Palm Olein
Retention Palm Palm CocoaTAGb Index
,Oil Exper. Stat. Olein Exper. Stat. Butter
MMM 0.70 0.0 0.0 0.0 0.0 0.0 0.0 0.0MMP 0.83 0.1 0.1 0.0 0.1 0.1 0.0 0.0MML 0.62 0.1 0.0 0.0 0.1 0.0 0.0 0.0
MMO 0.77 0.0 0.1 0.0 0.0 0.1 0.0 0.0MMS 0.94 0.0 0.0 0.0 0.0 0.0 0.0 0.0MPL 0.75 0.3 0.2 0.3 0.4 0.2 0.3 0.0MPO 0.89 1.4 1.1 1.2 1.3 0.9 1.2 0.0MPS 1.05 0.1 0.1 0.1 0.1 0.1 0.1 0.0MLO 0.70 0.1 0.2 0.2 0.2 OJ 0.4 0.0MLS 0.86 0.0 0.0 0.0 0.0 0.1 0.0 0.0MaS 1.00 0.1 0.1 0.1 0.2 0.1 0.1 0.0PPP 1.05 1.2 10.8 9.5 0.8 7.6 6.6 0.1PPM 0.70 0.3 0.6 0.7 0.2 0.4 0.6 0.0PPL 0.86 9.6 6.0 5.7 9.8 6.1 5.7 2.0PPO 1.00 35.0 23.1 24.8 29.9 20.9 20.0 17.9PPS 1.16 0.3 2.6 2.6 0.2 2.4 2.2 0.4
PLO 0.81 8.8 10.0 10.0 10.6 11.6 11.6 0.9
PLS 0.95 1.3 1.0 1.0 1.5 1.2 1.3 3.2pas 1.11 5.5 4.3 4.5 5.9 4.4 4.4 34.2
LLL 0.54 0.0 0.1 0.1 0.1 0.2 0.2 0.0
LLM 0.59 0.0 0.0 0.0 0.0 0.0 0.0 0.0
LLP 0.68 1.9 1.2 1.2 2.6 1.9 1.6 0.2
LLO 0.64 0.5 1.0 1.0 0.7 1.9 1.7 0.1
LLS 0.79 0.2 0.2 0.1 0.4 0.4 0.2 0.1
LOS 0.92 0.7 0.8 0.9 1.1 1.2 1.3 1.0
000 0.90 3.8 7.9 6.3 4.7 8.0 6.9 0.9
OOM 0.84 0.4 0.5 0.5 0.5 0.4 0.6 0.0
OOP 0.96 24.2 21.4 21.6 22.8 20.6 20.3 5.8
OOL 0.77 1.6 4.1 4.4 1 ' 6.0 5.9 0.2•. j
OOS 1.06 2.1 1.7 2.0 2.8 2.1 2.2 8.0
SSS 1.36 0.0 0.0 0.0 0.0 0.0 0.0 0.3
SSM 1.15 0.0 0.0 0.0 0.0 0.0 0.0 0.0
SSP 1.26 0.1 0.3 0.2 0.1 0.3 0.2 0.6
(continued)
848 NEFF, BYRDWELL,AND LIST
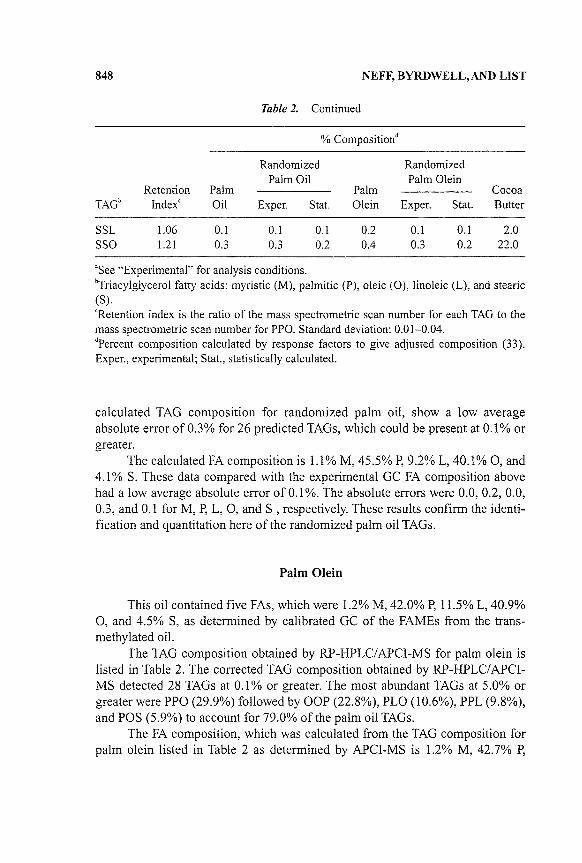
Table 2. Continued
% Composition'
RandomizedPalm Oil
RandomizedPalm Olein
TAGb
SSLSSO
Retention PalmIndex
,Oil
1.06 0.11.21 0.3
Palm CocoaExper. Stat. Olein Exper. Stat. Butter
0.1 0.1 0.2 0.1 0.1 2.00.3 0.2 0.4 0.3 0.2 22.0
'See "Experimental" for analysis conditions.bTriacylglycerol fatty acids: myristic (M), palmitic (P), oleic (0), linoleic (L), and stearic(S).'Retention index is the ratio of the mass spectrometric scan number for each TAG to themass spectrometric scan number for PPO. Standard deviation: 0.01-0.04.'Percent composition calculated by response factors to give adjusted composition (33).Exper., experimental; Stat., statistically calculated.
calculated TAG compositIOn for randomized palm oil, show a low averageabsolute error of 0.3% for 26 predicted TAGs, which could be present at 0.1 % orgreater.
The calculated FA composition is 1.1% M, 45.5% P, 9.2% L, 40.1% 0, and4.1 % S. These data compared with the experimental GC FA composition abovehad a low average absolute error of 0.1 %. The absolute errors were 0.0, 0.2, 0.0,0.3, and 0.1 for M, P, L, 0, and S , respectively. These results confirm the identification and quantitation here of the randomized palm oil TAGs.
Palm Olein
This oil contained five FAs, which were 1.2% M, 42.0% P, 11.5% L, 40.9%0, and 4.5% S, as determined by calibrated GC of the FAMEs from the transmethylated oil.
The TAG composition obtained by RP-HPLC/APCI-MS for palm olein islisted in Table 2. The corrected TAG composition obtained by RP-HPLC/APCIMS detected 28 TAGs at 0.1 % or greater. The most abundant TAGs at 5.0% orgreater were PPO (29.9%) followed by OOP (22.8%), PLO (10.6%), PPL (9.8%),and POS (5.9%) to account for 79.0% of the palm oil TAGs.
The FA composition, which was calculated from the TAG composition forpalm olein listed in Table 2 as determined by APCI-MS is 1.2% M, 42.7% P,
TAG STRUCTURES OF FOOD FATS 849
11.3% L, 40.4% 0, and 4.5% S. Comparison of this calculated FA compositionwith the experimental FA composition showed an average absolute error of 0.3%.Individual absolute errors for each FA were 0.0, 0.7, 0.3, 0.5, and 0.0% for M, P,L, 0, and S, respectively. The low average absolute error, obtained between calculated and experimental FA compositions and low or no absolute error per FA,confirmed the accuracy of the TAG identification and quantitation obtained byAPCI-MS for palm olein.
Randomized Palm Olein
This oil contained five FAs, which were 1.2% M, 41.1 % P, 11.9 L, 41.1 %0, and 4.6% S. The oil contained, as expected, essentially the same FA composition as nonrandomized palm olein.
For randomized palm olein, the corrected experimental TAG compositionobtained by RP-HPLC/APCI-MS is listed with the TAG retention index in Table2. The corrected TAG composition obtained by RP-HPLC/APCI-MS showed 29TAGs. The most abundant TAGs at above 5.0% were PPO (20.9%), OOP(20.6%), PLO (11.6%), 000 (8.0%%), PPP (7.6%), PPL (6.1 %), and OOL(6.0%), respectively, for a total 80.7% of the randomized palm olein TAGs. Thesedata compared with the statistically calculated composition listed in Table 2 forrandomized palm olein show a low average absolute error of 0.2% for 26 TAGs,which could be present at 0.1 % or greater.
The FA composition calculated from the corrected TAG compositionobtained by APCI-MS, compared to the experimental GC FA composition, had alow average absolute error of 0.1 %. Absolute errors per specific FA were the following: 0.2% M, 0.1 % P, 0.0% L, 0.2% 0, and 0.0%, S, respectively. These accuracy results confirm the identification and quantitation of the TAGs in the palmolein sample.
Cocoa Butter
This oil contained five FAs, which were 0.1% M, 28.7% P, 3.4% L, 35.6%0, and 32.2% S, as determined by calibrated GC of the FAMEs from the transmethylated oil.
The TAG composition obtained by RP-HPLC/APCI-MS with the TAGretention index for cocoa butter is listed in Table 2. The corrected TAG composition obtained by RP-HPLC/APCI-MS showed 19 TAGs at 0.1% or greater. Themost abundant TAGs at 5.0% or greater were POS (34.2%) followed by SSO(22.0%) and POP (17.9%). These three TAGs account for 74.1 % of the cocoa
850 NEFF, BYRDWELL, AND LIST
butter TAGs. The other TAGs at greater than 5.0% were SOO (8.0%) and OOP(5.8%) to account for 87.9% of the cocoa butter TAGs. The remaining 15 cocoabutter TAGs were detected at less than 5.0%.
The FA composition, which was calculated from the TAG compositionlisted in Table 2, as determined by APCI-MS, was 0.0% M, 28.7% P, 35.6% 0,3.4% L, and 32.3% S. Comparison of this calculated FA composition with theexperimental FA composition determined by GC of the transmethylated cocoabutter TAGs given above produced a low average absolute error of 0.1 %.Individual absolute errors were low for each FA, with the values 0.1, 0.0, 0.0, 0.0,and 0.1 % for M, P, L, 0, and S, respectively. The low average absolute errorobtained between calculated and experimental FA composition and low or noabsolute error per FA confirms the identification and quantitation of the cocoabutter TAGs.
TAG Physical Properties with Respect to TAG Composition
For food formulation products, what is usually the most important TAGdesignation with respect to food physical properties (such as melting point andsolid fat content given in Table 3) is not so much the TAG species itself, but thefood formulation TAG designation of saturated (S) and unsaturated (D) fattyacids (31). These data, along with total amount of saturated fatty acids, are listedfor each oil in Table 4.
For example, concentrating on the 19 TAGs that occur at 0.1 % or greater incoconut oil (after calculation from the TAG composition listed in Table 1), the
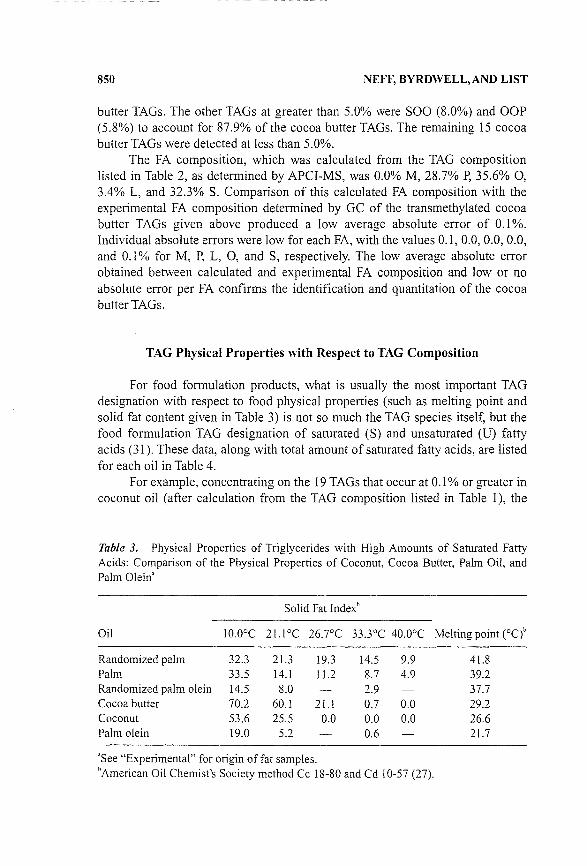
Table 3. Physical Properties of Triglycerides with High Amounts of Saturated FattyAcids: Comparison of the Physical Properties of Coconut, Cocoa Butter, Palm Oil, andPalm Olein'
Solid Fat Indexb
Oil 10.0°C 21.I °C 26.7°C 33.3°C 40.0°C Melting point (0C)b
Randomized palm 32.3 21.3 19.3 14.5 9.9 41.8Palm 33.5 14.1 11.2 8.7 4.9 39.2Randomized palm olein 14.5 8.0 2.9 37.7Cocoa butter 70.2 60.1 21.I 0.7 0.0 29.2Coconut 53.6 25.5 0.0 0.0 0.0 26.6Palm olein 19.0 5.2 0.6 21.7
'See "Experimental" for origin of fat samples."American Oil Chemist's Society method Cc 18-80 and Cd 10-57 (27).
TAG STRUCTURES OF FOOD FATS 851
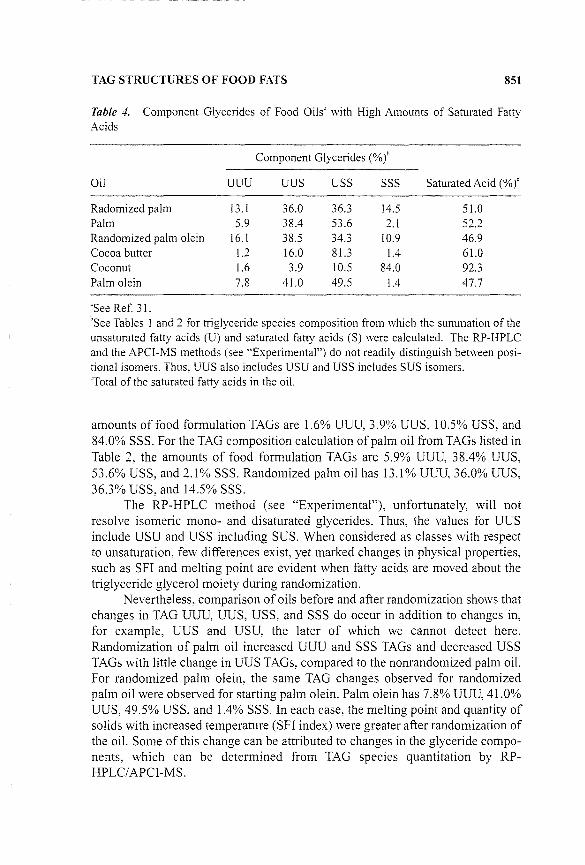
Table 4. Component Glycerides of Food Oils' with High Amounts of Saturated FattyAcids
Component Glycerides (%)b
Oil UUU UUS USS SSS Saturated Acid (%)'
Radomized palm 13.1 36.0 36.3 14.5 51.0Palm 5.9 38.4 53.6 2.1 52.2Randomized palm olein 16.1 38.5 34.3 10.9 46.9Cocoa butter 1.2 16.0 81.3 1.4 61.0Coconut 1.6 3.9 10.5 84.0 92.3Palm olein 7.8 41.0 49.5 1.4 47.7
'See Ref. 3 I .'See Tables I and 2 for triglyceride species composition from which the summation of theunsaturated fatty acids (U) and saturated fatty acids (S) were calculated. The RP-HPLCand the APCI-MS methods (see "Experimental") do not readily distinguish benveen positional isomers. Thus, UUS also includes USU and USS includes SUS isomers.'Total of the saturated fatty acids in the oil.
amounts of food formulation TAGs are 1.6% UUU, 3.9% UUS, 10.5% USS, and84.0% SSS. For the TAG composition calculation of palm oil from TAGs listed inTable 2, the amounts of food formulation TAGs are 5.9% UUU, 38.4% UUS,53.6% USS, and 2.1 % SSS. Randomized palm oil has 13.1 % UUU, 36.0% UUS,36.3% USS, and 14.5% SSS.
The RP-HPLC method (see "Experimental"), unfortunately, will notresolve isomeric mono- and disaturated glycerides. Thus, the values for UUSinclude USU and USS including SUS. When considered as classes with respectto unsaturation, few differences exist, yet marked changes in physical properties,such as SFI and melting point are evident when fatty acids are moved about thetriglyceride glycerol moiety during randomization.
Nevertheless, comparison of oils before and after randomization shows thatchanges in TAG UUU, UUS, USS, and SSS do occur in addition to changes in,for example, UUS and USU, the later of which we cannot detect here.Randomization of palm oil increased UUU and SSS TAGs and decreased USSTAGs with little change in UUS TAGs, compared to the nonrandomized palm oil.For randomized palm olein, the same TAG changes observed for randomizedpalm oil were observed for starting palm olein. Palm olein has 7.8% UUU, 41.0%UUS, 49.5% USS, and 1.4% SSS. In each case, the melting point and quantity ofsolids with increased temperature (SFI index) were greater after randomization ofthe oil. Some of this change can be attributed to changes in the glyceride components, which can be determined from TAG species quantitation by RPHPLCIAPCI-MS.
852 NEFF, BYRDWELL, AND LIST
Reference to Tables 3 and 4 shows that the observed SFI and melting pointfor each oil are less related to the total saturated FA than to glyceride components. For example, coconut oil, which had the greatest amount of total fattyacids of the oils, had next to the lowest melting point. Also, coconut oil had nosolids above 21.1. Randomized palm oil, with the balanced UUU = SSS to UUS= USS TAG composition, had the highest melting point and SFI of the oils studied. An increase in the SSS TAG may be, in part, responsible for lowering themelting point. Palm olein, which had the lowest melting point and SFI, had thehighest amount of UUS TAG. Concentrations of UUU, UUS, USS, and SSSTAGs, which can be determined accurately from RP-HPLC/APCI-MS, are obviously important with regard to physical properties offood formulation fats.
ACKNOWLEDGMENTS
Names are necessary to report factually on available data; however, the U.S.Department ofAgriculture (USDA) neither guarantees nor warrants the standardof the product, and the use of the name by USDA implies no approval of theproduct to the exclusion of others that may also be suitable.
REFERENCES
1. List, G.R.; Mounts, TL.; Orthoeter, E; Neff, WE. 1. Am. Oil Chem. Soc.1996, 73, 729-732.
2. Del Vecchio, AJ. Inform 1996, 7, 230-242.3. List, G.R.; Mounts, TL.; Orthoeter, E; Neff, WE. 1. Am. Oil Chem. Soc.
1997, 74,327-329.4. Haumann, B.E Inform 1997,8, 1004-1011.5. Loh, W Biotechnology and Vegetable Oils: First Generation Products in the
Marketplace. In Physical Properties ofFats, Oils, and Emulsifers; Widlak,N., Ed.; AOCS Press: Champaign, IL, 2000; 247-253.
6. List, G.R.; Warner, K.; Mounts, TL. In Proceedings of the InternationalSymposium on New Approaches to Functional Cereal and Oils, Exhibitionand Posters; Shizhong, S., Ruizheng, L., Eds.; Chinese Cereals and OilsAssociation Publishers: Beijing, P.R. China,1997; 694-706.
7. Allen, D. Lipid Techno!. 1998,53-57.8. List, G.R.; Mounts, TL.; Orthoefer, E; Neff, WE. 1. Am. Oil Chem. Soc.
1995, 72,379-382.9. Zeitoun, M.A.M.; Neff, WE.; List, G.R.; Mounts, TL. 1. Am. Oil Chem.
Soc. 1993, 70,467-471.
TAG STRUCTURES OF FOOD FATS 853
10. deMan, 1.M. Relationship Among Chemical, Physical, and TexturalProperties of Fats. In Physical Properties of Fats. Oils. and Emuls~fers;
Widlak, N., Ed.; AOCS Press: Champaign, IL 2000; 79-95.11. Neff, WE.; List, G.R.; Byrdwell, We. Lebensm.-Wiss. Techno!. 1999,32,
416--424.12. Neff, WE.; EI-Agaimy, M.A.; Mounts, 1.L 1. Am. Oil Chern. Soc. 1994, 71,
1111-1116.13. Neff, WE.; Mounts, 1.L.; Rinsch, WM.; Konishi, H.; EI-Agaimy M.A., 1.
Am. Oil Chern. Soc. 1994, 71,1101-1109.14. Neff, WE.; Mounts, 1.L; Rinsch, WM. Lebensm.-Wiss. Techno!. 1997,30,
793-799.15. Lampert, D. High-Stability Oils: What Are They? How Are They Made?
Why Do We Need Them? In Physical Properties of Fats. Oils. andEmuls~fers;Widlak, N. Ed.; AOCS Press: Champaign, IL, 2000.
16. Duurland, F.; Smith, K. Lipid Techno!. 1995,6-9.17. Neff, WE.; Adlof, R.O.; List, G.R.; EI-Agaimy, M. 1. Liq. Chromatogr.
1994, 17, 3951-3968.18. Neff, WE.; Adlof, R.O; Konishi, H.; Weisleder, D. 1. Am. Oil Chern. Soc.
1993, 70,449.19. Zeitoun, M.{\.~..;N~ff, WE.; Selke, E.; Mounts, 1.L 1. Liq. Chromatogr.
1991,14,2685-2698.20. Byrdwell, We.; Neff,W£ Qualitative and Quantitative Analysis of
Triacylglycerols Using Atmospheric Pressure Chemical Ionization MassSpectrometry. In New Techniques and Applications in Lipid Analysis;McDonald, R.E., Mossoba, M.M.. Eds.; American Oil Chemists SocietyPress: Champaign, IL, 1997; 45-79.
21. Byrdwell, We. Inform 1998, 9, 986-997.22. Christie, WW High-Pe/:formance Liquid Chromatography and Lipids;
Pergamon Press: Oxford, UK, 1987.23. Christie, WW Detectors for High-Performance Liquid Chromatography of
Lipids with Special Reference to Evaporative Light Scattering Detection. InAdvances in Lipid Methodology-One; Christie, WW, Ed.; The Oily PressLtd.: Ayr, Scotland, 1992; 239-271.
24. Christie, WW Lipid Techno!. 1993,68-70.25. Hammond, E.W High Performance Liquid Chromatography. In
Chromatography for the Analysis of Lipids; Hammond, E.W, Ed.; CRCPress: Boca Raton, FL, 1993; 113-153.
26. Moreau, R.A. Quantitative Analysis of Lipids by HPLC with a FlameIonization Detector or an Evaporative Light Scattering Detector. In LipidChromatography Analysis, Shibamoto, 1., Ed.; Marcel Dekker: New York,1994; 251-272.
27. Christie, WW Lipid Techno!. 1996, 140-142.
854 NEFF, BYRDWELL,AND LIST
28. List, G. R.; Ernken, E.A.; Kwolek, WE; Simpson, T.D. 1. Am. Oil Chern.Soc. 1977,54,408-413.
29. Christie, WW Lipid Analysis, 1st Ed.; Pergamon Press: New York, 1973;85-102.
30. Official Methods and Recommended Practices of The American OilChemists'Society; Firestore, D., Ed.; American Oil Chemists' Society:Champaign, IL, 1989; 10-57, Cc 18-80.
31. Neff, WE.; List, G.R.; Byrdwell, We. Lebensm.-Wiss. Technol. 1999,32,416-424.
32. Byrdwell, We.; Emken, E.A. Lipids 1994,30, 173-175.33. Byrdwell, WC.; Emken, E.A.; Neff, WE.; Adlof, R.O. Lipids 1996, 31,
919-935.
Received September 11, 2000Accepted September 28, 2000
Author's Revisions March 9, 2001Manuscript 5400
Suppheo by U.S. DeDl of AgricultureNational center tor Agricultural
Utihzat,on Research, Peona, Illinois