tri-county parkway location study · tri-county parkway location study ... be attributed to the...
TRANSCRIPT

Tri-County Parkway Location Study
SOCIOECONOMIC TECHNICAL REPORT
Prepared for:
The Virginia Department of Transportation
Prepared by:
Parsons Brinckerhoff Quade and Douglas, Inc.
21 October 2004

(This page left blank intentionally)

i Socioeconomic Technical Report
TABLE OF CONTENTS
S.0 EXECUTIVE SUMMARY ------------------------------------------------------------------------------------------S-1 1.0 INTRODUCTION----------------------------------------------------------------------------------------------------- 1-1
PROJECT DESCRIPTION AND HISTORY -------------------------------------------------------------------------- 1-1 PURPOSE AND NEED---------------------------------------------------------------------------------------------------- 1-4
2.0 ALTERNATIVES CONSIDERED-------------------------------------------------------------------------------- 2-1 ALTERNATIVES ELIMINATED FROM DETAILED STUDY------------------------------------------------------ 2-1 THE NO-BUILD ALTERNATIVE ---------------------------------------------------------------------------------------- 2-1 CANDIDATE BUILD ALTERNATIVES--------------------------------------------------------------------------------- 2-1
The Comprehensive Plan CBA -------------------------------------------------------------------------------------- 2-2 The West Two CBA----------------------------------------------------------------------------------------------------- 2-3 The West Four CBA ---------------------------------------------------------------------------------------------------- 2-3
3.0 AFFECTED ENVIRONMENT------------------------------------------------------------------------------------- 3-1 3.1 Population---------------------------------------------------------------------------------------------------------- 3-1 3.2 Household Income ----------------------------------------------------------------------------------------------- 3-2 3.3 Housing------------------------------------------------------------------------------------------------------------- 3-3 3.4 Environmental Justice------------------------------------------------------------------------------------------- 3-4
3.4.1 Minority Populations ----------------------------------------------------------------------------------------- 3-4 3.4.2 Low-Income Populations------------------------------------------------------------------------------------ 3-5
3.5 Employment ------------------------------------------------------------------------------------------------------- 3-8 4.0 ENVIRONMENTAL CONSEQUENCES ----------------------------------------------------------------------- 4-1
4.1 Relocations -------------------------------------------------------------------------------------------------------- 4-1 4.1.1 No Build and TSM Alternatives---------------------------------------------------------------------------- 4-1 4.1.2 Candidate Build Alternatives------------------------------------------------------------------------------- 4-1 4.1.3 Potential Mitigation ------------------------------------------------------------------------------------------- 4-1
4.2 Environmental Justice Consequences ---------------------------------------------------------------------- 4-2 4.2.1 No-Build and TSM Alternatives---------------------------------------------------------------------------- 4-2 4.2.2 Build Alternative----------------------------------------------------------------------------------------------- 4-2 4.2.3 Potential Mitigation ------------------------------------------------------------------------------------------- 4-3
4.3 Economic Consequences -------------------------------------------------------------------------------------- 4-3 4.3.1 No-Build Alternative ------------------------------------------------------------------------------------------ 4-3 4.3.2 Build Alternative----------------------------------------------------------------------------------------------- 4-3 4.3.3 Potential Mitigation ------------------------------------------------------------------------------------------- 4-4
5.0 REFERENCES ------------------------------------------------------------------------------------------------------- 5-1
ii Socioeconomic Technical Report
LIST OF TABLES
TABLE 3.1-1 POPULATION HISTORY AND FORECAST FOR JURISDICTIONS REPRESENTED BY THE PROJECT STUDY AREA------------------------------------------------------------ 3-1
TABLE 3.1-2 POPULATION FOR THE TRI-COUNTY STUDY AREA -------------------------------------------- 3-2 TABLE 3.2-1 MEDIAN HOUSEHOLD INCOME FOR JURISDICTIONS REPRESENTED
BY THE PROJECT STUDY AREA----------------------------------------------------------------------------------- 3-2 TABLE 3.2-2 STUDY AREA MEDIAN HOUSEHOLD INCOME---------------------------------------------------- 3-3 TABLE 3.3-1 HOUSING DATA FOR TRI-COUNTY STUDY AREA ----------------------------------------------- 3-3 TABLE 3.4-1 MINORITY POPULATIONS IN THE STUDY AREA ------------------------------------------------- 3-4 TABLE 3.4-2 LOW INCOME AND POVERTY CHARACTERISTICS FOR THE STUDY AREA------------ 3-5 TABLE 3.5-1 EMPLOYMENT FOR THE STUDY AREA-------------------------------------------------------------- 3-8 TABLE 4.1-1 RESIDENTIAL UNITS DISPLACEMENTS BY ALTERNATIVE ---------------------------------- 4-1 TABLE 4.2-1 MINORITY RELOCATIONS BY ALTERNATIVE----------------------------------------------------- 4-2 TABLE 4.2-2 LOW-INCOME RELOCATIONS BY ALTERNATIVE------------------------------------------------ 4-2 TABLE 4.3-1 SUMMARY OF ECONOMIC OPPORTUNITY AREAS BY CBA --------------------------------- 4-4
LIST OF FIGURES
FIGURE 1.1-1 REGIONAL LOCATION MAP---------------------------------------------------------------------------- 1-2 FIGURE 1.1-2 STUDY AREA ----------------------------------------------------------------------------------------------- 1-3 FIGURE 2.4-1 GENERAL DESIGN SEGMENTS TYPICAL SECTIONS ----------------------------------------- 2-4 FIGURE 2.4-2 CANDIDATE BUILD ALTERNATIVES ---------------------------------------------------------------- 2-5 FIGURE 3.4-1 STUDY AREA MINORITY POPULATIONS ---------------------------------------------------------- 3-6 FIGURE 3.4-2 STUDY AREA LOW INCOME POPULATIONS ----------------------------------------------------- 3-7
LIST OF APPENDICES
APPENDIX A - Socioeconomic GIS Analysis

S-1 Socioeconomic Technical Report
S.0 EXECUTIVE SUMMARY
Project History and Overview
The Tri-County Parkway Location Study evaluates a new north/south transportation link in northern Virginia that will connect the City of Manassas with Interstate 66 (I-66) and the Dulles corridor. The corridor begins in the north at the intersection of US 50 and Route 606 (Old Ox Road) and extends to the south at the interchange of VA 28/VA 234 Bypass. It is approximately 15 miles long and traverses portions of the counties of Prince William, Fairfax, and Loudoun along with the cities of Manassas and Manassas Park. The three counties that the Tri-County Parkway will traverse are among the top ten fastest growing counties in the Commonwealth of Virginia. The City of Manassas and the City of Manassas Park have also experienced substantial population growth over the last ten years. Much of the growth in Northern Virginia can be attributed to the emergence of high-tech industries near the Washington Dulles International Airport. A second rapid growth corridor within the region is the I-66 corridor. The primary problem the Tri-County Parkway is intended to address is the lack of adequate north-south transportation facilities linking the I-66 corridor with the Dulles area and VA 267. East of US 15 and west of the I-495 (Capital Beltway), only three principal urban arterials link the spokes together - VA 28 (Sully Road), Route 7100 (Fairfax County Parkway), and VA 123. These north-south facilities are heavily congested and will deteriorate further by the year 2025.
Purpose and Need
The study area presently lacks adequate north-south transportation facilities linking the I-66 corridor with the Dulles area and VA 267. The purpose and need for the Tri-County Parkway is comprised of four key elements, namely:
1. Improve transportation mobility and capacity and, by doing so, improve access and reduce congestion.
2. Enhance the linkage of communities and the transportation system that serves those communities. 3. Accommodate social demands, environmental goals, and economic development needs. 4. Improve safety and, by doing so, reduce the average crash, injury, and accident rates on the
roadway network.
Each of the elements has equal value and importance in the overall transportation, environmental, economic, and quality of life objectives for the communities being served under the proposed action.
Alternatives
In accordance with NEPA requirements, alternatives initially considered for the Tri-County Location Study included the No-Build, Mass Transit, Transportation System Management (TSM), and Candidate Build Alternatives (CBAs). Each alternative was evaluated with respect to its potential impacts and its ability to address the project’s purpose and need.
Alternatives Eliminated from Detailed Study
Assessments conducted as part of the Tri-County Parkway Location Study determined that the nature of the study area makes the identification of a mass transit alternative that can address the corridor’s purpose and need problematic. No transit authority exists whose service area covers or would cover the entire study area, nor are there plans to establish such an authority. In addition, the development patterns and traffic patterns and volumes within the study corridor do not favor north-south through movement along the corridor. The majority of trips and greatest volumes are to points outside the study area or along only a portion of the corridor (i.e., from the Manassas and Centerville areas to I-66 and points east, from the South Riding area to the Dulles corridor). The through volumes are by far the weakest in the study area and would not attract sufficient transit riders to make such service viable; therefore, the mass transit alternative was eliminated from further consideration.
There are no practicable Transportation System Management (TSM) measures beyond those already proposed in the CLRP and VDOT Six Year Plan which could reasonably be implemented to satisfy the

S-2 Socioeconomic Technical Report
purpose and need for the Tri-County Parkway. TSM-type improvements programmed into the aforementioned plans do not satisfy the project’s purpose and need when considered as a stand-alone alternative; therefore, the TSM Alternative was eliminated from further consideration.
The No-Build Alternative
The No-Build Alternative includes currently programmed committed and funded roadway and transit projects in the Virginia Department of Transportation (VDOT) Six Year Plan and the CLRP developed by the MWCOG. The No-Build Alternative, while having no direct construction costs, would result in other economic, environmental, and quality of life impacts that can be expected from the continuation of roadway system deficiencies. While the No-Build alternative does not meet the project needs for traffic, safety, and roadway infrastructure improvements, it provides a baseline condition with which to compare the improvements and consequences associated with the Candidate Build Alternatives.
Candidate Build Alternatives (CBAs)
Three Candidate Build Alternatives (CBAs) have been identified for further evaluation in a Draft Environmental Impact Statement (EIS). These CBAs are referred to hereinafter as: (1) the “Comprehensive Plan” CBA, (2) the “West Two” CBA, and (3) the “West Four” CBA. Each of the CBAs is expected to be comprised of two or more facility types according to localized needs and goals. To assess environmental effects associated with a particular facility type along each CBA, three general design segments were developed. These general design segments and their relationship to each alternative assessed are described in the body of this Technical Report.
The Comprehensive Plan CBA
The Comprehensive Plan CBA would be located east of the Manassas National Battlefield. The Comprehensive Plan CBA would provide a new urban principal arterial roadway from the northern terminus at the intersection of US 50 and Route 606 (Old Ox Road) and the southern terminus at the Route 28 and Route 234 Bypass Interchange, and would consist of Segments F’, F, and E. Segment F’ between Route 50 and Route 620 would be comprised of improvements along an existing four-lane divided facility within an existing right-of-way on an existing alignment. Segment F’ south of Route 620 would be a new four-lane divided facility within a new right-of-way on a new alignment. Three separate sections characterize segment E. The portion of Segment E between I-66 and the Fairfax/Prince William county line would be a new six-lane divided facility within a new right-of-way on a new alignment. The portion of segment E from the Fairfax/Prince William county line south to VA 234 would be a new six-lane divided facility within an existing right-of-way on an existing alignment. The portion of Segment E from VA 234 to the VA 234 Bypass would be comprised of improvements along an existing four-lane divided facility called Godwin Drive and would be widened to a six-lane divided facility within the existing right-of-way and on an existing alignment.
The West Two CBA
The West Two CBA is located west of the Manassas National Battlefield. The West Two CBA would provide a new urban principal arterial roadway from the northern terminus near the intersection of US 50 and Route 877 (Racefield Lane) and the southern terminus at the I-66 and Route 234 Interchange. The West Two CBA would be a new four-lane divided facility within a new right-of-way and on a new alignment, and would consist of Segments D and C.
The West Four CBA
The West Four CBA is also located west of the Manassas National Battlefield. The West Four CBA would provide a new urban principal arterial roadway from the northern terminus at the intersection of US 50 and Route 606 (Old Ox Road) and the southern terminus at the I-66 and Route 234 Interchange. The West Four CBA would consist of Segments F’, G, and C. Segment F’ between Route 50 and Route 620 (Braddock Road) would be comprised of improvements along an existing four-lane divided facility within an existing right-of-way on an existing alignment. Segment F’ south of Route 620 would be comprised of a new four-lane divided facility within a new right-of-way on a new alignment.

S-3 Socioeconomic Technical Report
Affected Environment
Rapid population growth has been experienced throughout the Tri-County Parkway project corridor and is expected to continue in the future. Table S-1 provides past and forecast population for jurisdictions represented by the study area and the Commonwealth of Virginia. According to the U.S. Census, Loudoun County was the fastest growing jurisdiction in the area - with a 1990 to 2000 population increase of 96.8 percent. Virginia, by comparison, grew by 14.4 percent. The population of Fairfax County increased the least during this time period (18.5 percent), but continues to be the most populated jurisdiction in the Commonwealth. Prince William County has moved up from the fifth to the third most populous jurisdiction in the Commonwealth between the two decennial censuses.
TABLE S-1 POPULATION HISTORY AND FORECAST FOR JURISDICTIONS REPRESENTED
Jurisdiction 1990 2000 2030 Percent change from 2000 to 2030
Virginia 6,187,358 7,078,515 8,791,520* 42.09%*
Fairfax County 818,584 969,749 1,211,980 48.06%
Loudoun County 86,129 169,599 411,036 377.23%
Prince William County 215,686 280,813 430,734 99.70%
Manassas Park City 6,734 10,290 15,798 134.60%
Manassas City 27,957 35,135 36,919 32.06%
Source: U.S. Census (1990 and 2000; State Level 2025); MWCOG (Jurisdiction Level 2025, 2030); *Parsons Brinckerhoff (interpolation of 2025 data)
Table S-2 presents the 1990, 2000, and 2030 data for residents in the Tri-County Parkway study area. From 1990 to 2000, the study area’s population increased by 40 percent and an annual average increase of 2,962 persons per year. The 2030 forecast represents an even greater annual increase over the next 35 years. The study area’s 2000 population of 102,908 represents 1.45 percent of the Commonwealth’s total population. A population base of this size is larger than most cities in Virginia. Out of the jurisdictions represented by the study area, Loudoun County shows the largest percentage increase in population from 2000 to 2030 (with about an 800 percent increase), followed by Fairfax County (with a 91.8 percent increase), then Prince William County (with a 57.4 percent increase), and Manassas (with a 5.1 percent increase). Manassas Park is the only jurisdiction in the study area to show a decline in population. Within the study area, Manassas Park is generally built-out causing limited potential for a major increase in the number of households.
TABLE 1.1-1 POPULATION FOR THE TRI-COUNTY STUDY AREA
Jurisdiction 1990 2000 2030 Percent change from 2000 to 2030
Fairfax County 4,538 8,018 15,376 91.77%
Loudoun County 1,288 7,421 67,167 805.09%
Prince William County 34,509 47,033 71,661 52.36%
Manassas City 27,957 35,135 36,919 5.08%
Manassas Park City 4,999 5,301 5,163 -2.60%
Study Area Total 73,291 102,908 196,286 90.74%
Source: U.S. Census (1990 and 2000); MWCOG (2030); Parsons Brinckerhoff
Table S-3 illustrates income data for the jurisdictions represented in the study area for 1989 and 1999. Northern Virginia, as a whole, tends to have higher median household incomes due to the large amount of technical and government employees working in and around the Washington D.C. metropolitan area.
S-4 Socioeconomic Technical Report
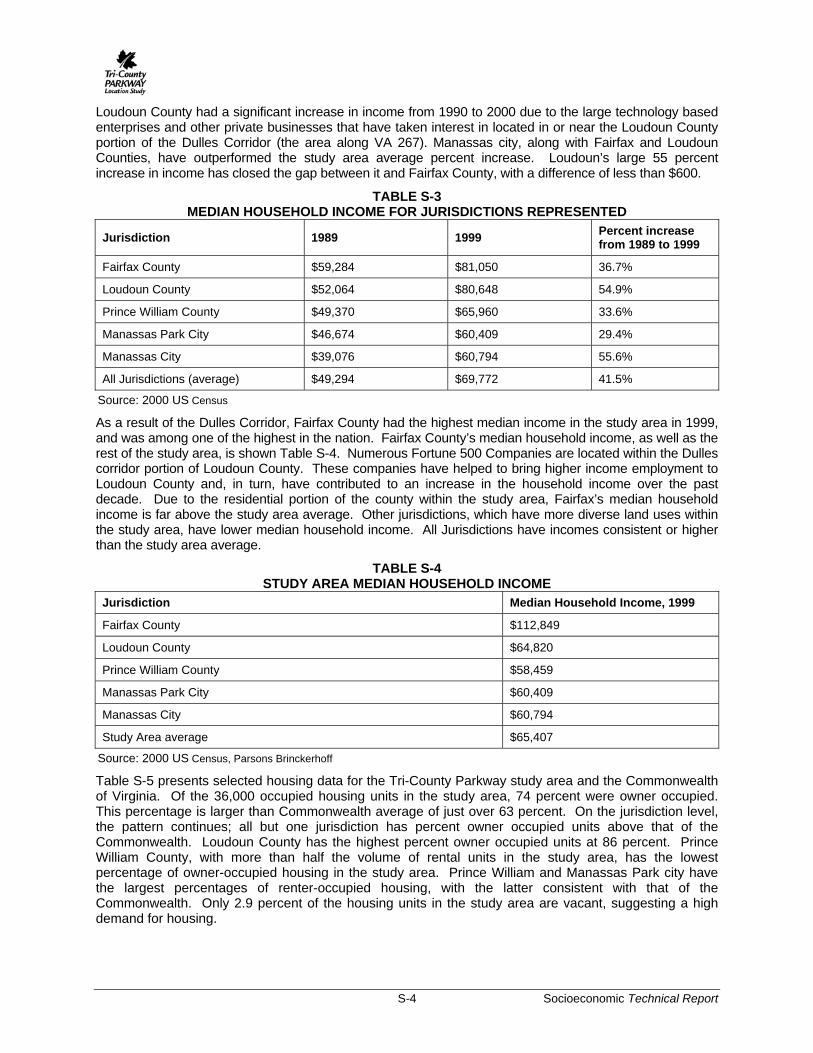
Loudoun County had a significant increase in income from 1990 to 2000 due to the large technology based enterprises and other private businesses that have taken interest in located in or near the Loudoun County portion of the Dulles Corridor (the area along VA 267). Manassas city, along with Fairfax and Loudoun Counties, have outperformed the study area average percent increase. Loudoun’s large 55 percent increase in income has closed the gap between it and Fairfax County, with a difference of less than $600.
TABLE S-3 MEDIAN HOUSEHOLD INCOME FOR JURISDICTIONS REPRESENTED
Jurisdiction 1989 1999 Percent increase from 1989 to 1999
Fairfax County $59,284 $81,050 36.7%
Loudoun County $52,064 $80,648 54.9%
Prince William County $49,370 $65,960 33.6%
Manassas Park City $46,674 $60,409 29.4%
Manassas City $39,076 $60,794 55.6%
All Jurisdictions (average) $49,294 $69,772 41.5%
Source: 2000 US Census
As a result of the Dulles Corridor, Fairfax County had the highest median income in the study area in 1999, and was among one of the highest in the nation. Fairfax County’s median household income, as well as the rest of the study area, is shown Table S-4. Numerous Fortune 500 Companies are located within the Dulles corridor portion of Loudoun County. These companies have helped to bring higher income employment to Loudoun County and, in turn, have contributed to an increase in the household income over the past decade. Due to the residential portion of the county within the study area, Fairfax’s median household income is far above the study area average. Other jurisdictions, which have more diverse land uses within the study area, have lower median household income. All Jurisdictions have incomes consistent or higher than the study area average.
TABLE S-4 STUDY AREA MEDIAN HOUSEHOLD INCOME
Jurisdiction Median Household Income, 1999
Fairfax County $112,849
Loudoun County $64,820
Prince William County $58,459
Manassas Park City $60,409
Manassas City $60,794
Study Area average $65,407
Source: 2000 US Census, Parsons Brinckerhoff
Table S-5 presents selected housing data for the Tri-County Parkway study area and the Commonwealth of Virginia. Of the 36,000 occupied housing units in the study area, 74 percent were owner occupied. This percentage is larger than Commonwealth average of just over 63 percent. On the jurisdiction level, the pattern continues; all but one jurisdiction has percent owner occupied units above that of the Commonwealth. Loudoun County has the highest percent owner occupied units at 86 percent. Prince William County, with more than half the volume of rental units in the study area, has the lowest percentage of owner-occupied housing in the study area. Prince William and Manassas Park city have the largest percentages of renter-occupied housing, with the latter consistent with that of the Commonwealth. Only 2.9 percent of the housing units in the study area are vacant, suggesting a high demand for housing.

S-5 Socioeconomic Technical Report
TABLE S-5 HOUSING DATA FOR TRI-COUNTY STUDY AREA
Jurisdiction Total Housing Units
Owner Occupied
Percent of Owner
Occupied Renter
Occupied Percent of
Renter Occupied
Vacant Percent Vacant
Virginia 2,904,192 1,837,939 63.2 % 861,234 29.7 % 205,019 7.1%
Fairfax County 2,456 1,945 79.2 % 486 19.8 % 25 1.0%
Loudoun County 2,669 2,285 85.6 % 285 10.6 % 99 3.7%
Prince William Co 17,061 10,146 59.5 % 6,340 37.2 % 575 3.4%
Manassas Park 12,114 8,203 67.8 % 3,554 29.3 % 357 2.9%
Manassas City 1,699 1,338 78.7 % 302 17.8 % 59 3.5%
Study Area Total 35,999 23,917 74.2% 10,967 22.9% 1,115 2.9%
Source: 2000 US Census
Table S-6 provides a summary of minority populations for the jurisdictions represented by the Tri-County Parkway project area. The majority of the overall population in the study area is white non-Hispanic, with 27 percent of the study area’s population being classified as minority. The study area’s percentage of minority is slightly below the Commonwealth average of 28 percent.
TABLE S-6 MINORITY POPULATIONS IN THE STUDY AREA
Jurisdiction Total Population White Non-Hispanic Minority1 Percent
Minority
Virginia 7,078,515 5,120,110 1,958,405 28%
Fairfax County 8,018 6,207 1,811 23%
Loudoun County 6,918 5,982 936 14%
Prince William County 46,350 32,887 13,452 29%
Manassas Park 5,301 4,167 1,134 21%
Manassas City 35,135 25,316 9,819 28%
Study Area Total 101,722 74,559 27,152 24%
Source: 2000 U.S. Census 1 Total minority is the sum of all persons other than white-non-Hispanic. Hispanics may be of any race.
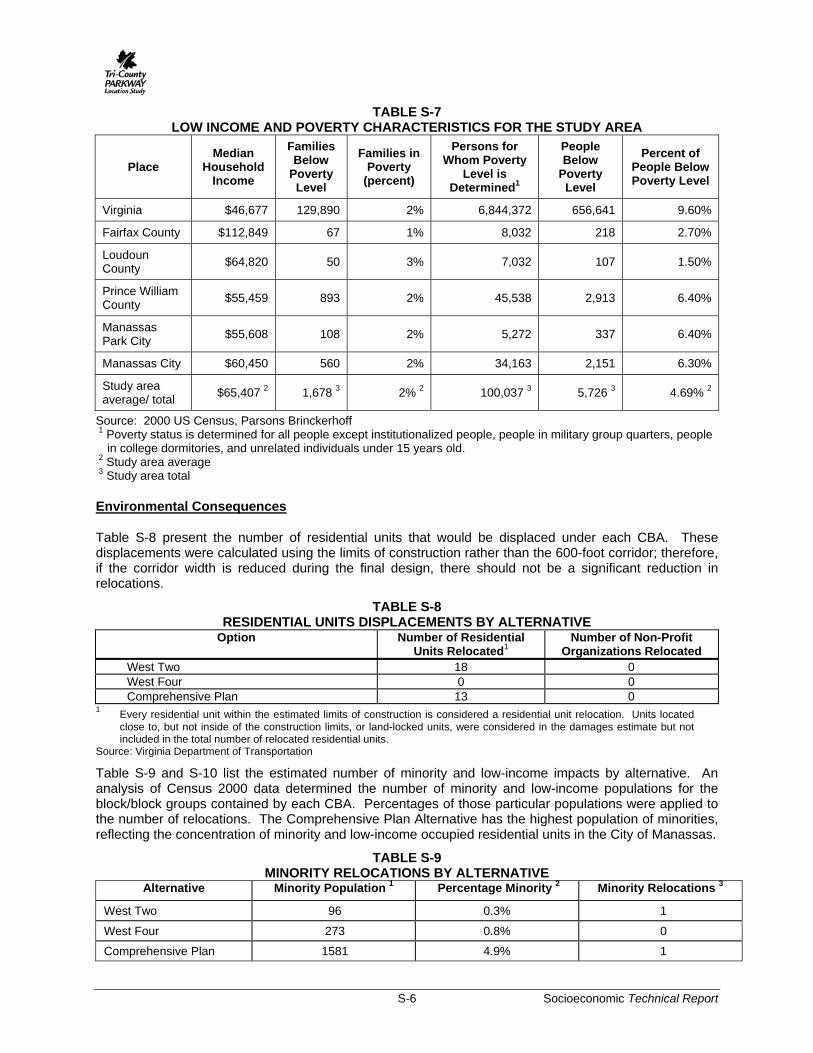
Table S-7 present the 2000 Census data for the populations of low-income families and individuals in the Tri-County Parkway study area. The median household incomes for the individual jurisdictions represented in the study area are considerably higher than the Commonwealth, thus the percent of people below the poverty level are well below the 9.6 percent value for Virginia. Prince William County and the City of Manassas Park have the highest percentage of persons below the poverty level (6.4 percent), still notably lower than the Commonwealth’s average. There are incidences of families that qualify for Section 8 housing, as well as those that qualify for affordable housing. From interviews conducted, the numbers of low-income populations are relatively low. The Social Services Department of the City of Manassas has a number of families that qualify for affordable housing (Manassas, 2004). In the City of Manassas Park, the western portion of the City (this portion is within the study area) contains all of the City’s lower-income areas (Manassas Park, 2004). Moving away from the more urbanized areas, the low-income populations drop significantly. The Loudoun County portion of the study area, for example, is rural and in the process of converting to suburban land uses. With the majority of the housing in the area ranges from $350,000 to $850,000 (Toll Brothers), the low-income population is small.
S-6 Socioeconomic Technical Report
TABLE S-7 LOW INCOME AND POVERTY CHARACTERISTICS FOR THE STUDY AREA
Place Median
Household Income
Families Below
Poverty Level
Families in Poverty
(percent)
Persons for Whom Poverty
Level is Determined1
People Below
Poverty Level
Percent of People Below Poverty Level
Virginia $46,677 129,890 2% 6,844,372 656,641 9.60%
Fairfax County $112,849 67 1% 8,032 218 2.70%
Loudoun County $64,820 50 3% 7,032 107 1.50%
Prince William County $55,459 893 2% 45,538 2,913 6.40%
Manassas Park City $55,608 108 2% 5,272 337 6.40%
Manassas City $60,450 560 2% 34,163 2,151 6.30%
Study area average/ total $65,407 2 1,678 3 2% 2 100,037 3 5,726 3 4.69% 2
Source: 2000 US Census, Parsons Brinckerhoff 1 Poverty status is determined for all people except institutionalized people, people in military group quarters, people
in college dormitories, and unrelated individuals under 15 years old. 2 Study area average 3 Study area total
Environmental Consequences
Table S-8 present the number of residential units that would be displaced under each CBA. These displacements were calculated using the limits of construction rather than the 600-foot corridor; therefore, if the corridor width is reduced during the final design, there should not be a significant reduction in relocations.
TABLE S-8 RESIDENTIAL UNITS DISPLACEMENTS BY ALTERNATIVE
Option Number of Residential Units Relocated1
Number of Non-Profit Organizations Relocated
West Two 18 0 West Four 0 0 Comprehensive Plan 13 0
1 Every residential unit within the estimated limits of construction is considered a residential unit relocation. Units located close to, but not inside of the construction limits, or land-locked units, were considered in the damages estimate but not included in the total number of relocated residential units.
Source: Virginia Department of Transportation
Table S-9 and S-10 list the estimated number of minority and low-income impacts by alternative. An analysis of Census 2000 data determined the number of minority and low-income populations for the block/block groups contained by each CBA. Percentages of those particular populations were applied to the number of relocations. The Comprehensive Plan Alternative has the highest population of minorities, reflecting the concentration of minority and low-income occupied residential units in the City of Manassas.
TABLE S-9 MINORITY RELOCATIONS BY ALTERNATIVE
Alternative Minority Population 1 Percentage Minority 2 Minority Relocations 3
West Two 96 0.3% 1
West Four 273 0.8% 0
Comprehensive Plan 1581 4.9% 1

S-7 Socioeconomic Technical Report
TABLE S-10 LOW-INCOME RELOCATIONS BY ALTERNATIVE
Alternative Low-Income population 1 Percentage of population with Low-Income 2 Relocations 3
West Two 93 1.6% 1
West Four 197 3.4% 0
Comprehensive Plan 1,611 28% 5 1 Total of blocks/block groups that contained the alternative 2 Percentage of population in block/block groups that contained the alternative 3 Percentages applied to the total displaced residential units Source: US Census, Virginia Department of Transportation, Parsons Brinckerhoff
Table S-11 presents economic opportunity area summaries by option. The combined effects of individual segments result in a regional snapshot of what would benefit and what would not benefit if Tri-County Parkway were introduced. Activity centers in this study area include the termini of the Tri-County Parkway corridor (the Dulles Corridor to the north, and extensive centers—such as Potomac Mills—to the south and east). The economic effects expected from the CBAs include a tradeoff between the loss of fewer existing businesses with the proximity of a proposed options to existing and planned industrial and commercial growth areas. Improvement in travel time within the study area is expected. The traffic and transportation technical memorandum provides a regional and interstate travel time saving analysis for the No-Build and a generic Build Alternative. Lost tax revenue for each option is considered a temporary effect. All impacted businesses will be compensated for search, moving, and reestablishment expenses or be given an in-lieu of payment if they prefer.
TABLE S-11 SUMMARY OF ECONOMIC OPPORTUNITY AREAS BY CBA
CBA Number of
Activity Centers
Growth Areas Tourist Attractions Number of
Businesses Relocated
Lost Tax Revenue
West Two 2 Office parks along VA 234-Business
Manassas Battlefield, Conway Robinson Memorial State Forest, Sudley Park
0 $210,206
West Four 2 South Riding Manassas Battlefield, Sudley Park 0 $194,641
Comprehensive Plan 3 South Riding
Manassas Battlefield, Bull Run Regional Park, Ben Lomond Regional Park
3 $399,509
Potential Mitigation
The following mitigation is recommended to be applicable to all Build Alternative options.
• Relocation impacts on low income or minority populations are not disproportionate to the general low income or minority population in the study area. No specific mitigation strategies, therefore, are being considered at this time to address impacts to low-income and minority populations. Consistent with mitigation procedures applied to all populations in the study area, the following is proposed: sound barriers, landscaping, and temporary relocation (U.S. Department of Transportation, 21 June 2004).
• VDOT’s right-of-way acquisition and relocation program will be conducted in accordance with the Federal Uniform Relocation Assistance and real Property Acquisition Act of 1970, as amended and with the STURRA. Relocation resources will be available without discrimination.
• Impacts to economic consequences may vary depending on the Build Alternative option. Minimization of the effects has been evaluated but specific mitigation recommendations will not be developed until an alternative is selected by the Commonwealth Transportation Board. Once a decision is made, specific mitigation recommendations will be more fully addressed in the Final EIS.

(This page left blank intentionally)

1-1 Socioeconomic Technical Report
1.0 INTRODUCTION
1.1 PROJECT DESCRIPTION AND HISTORY
The Tri-County Parkway Location Study evaluates a new north/south transportation link in northern Virginia that will connect the City of Manassas with Interstate 66 (I-66) and the Dulles corridor. The corridor begins in the north at the intersection of US 50 and Route 606 (Old Ox Road) and extends to the south at the interchange of VA 28/VA 234 Bypass. It is approximately 15 miles long and traverses portions of the counties of Prince William, Fairfax, and Loudoun along with the cities of Manassas and Manassas Park.
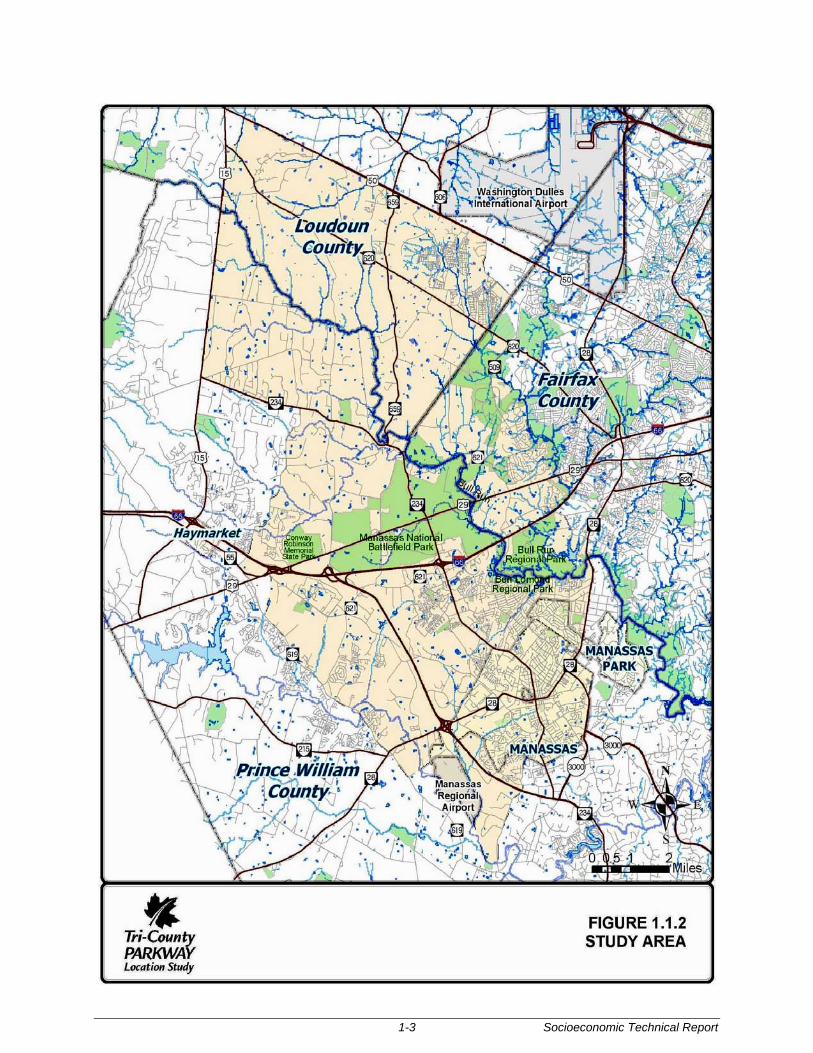
The Tri-County Parkway was first identified during the development of the transportation element of the comprehensive plans for Prince William, Fairfax, and Loudoun counties. The Tri-County Parkway has been the subject of many local studies and plans and has been known by many names throughout the years. In Prince William County, it has been referred to as the “Route 28 Bypass” and, in Loudoun County, the Tri-County Parkway has been known as the “Loudoun County Parkway”. Several conceptual alignments were considered through Fairfax County even before it was first proposed in their comprehensive plan. The Tri-County Parkway has been incorporated in the three counties’ comprehensive plans for over ten years. The Tri-County Parkway was adopted by the Metropolitan Washington Council of Governments (MWCOG) and included in their Constrained Long-Range Plan (CLRP) and Transportation Improvement Program (TIP) in the early to mid 1990s. Figure 1.1-1 illustrates the Tri-County Parkway project from a regional perspective, while Figure 1.1-2 depicts the study area within which Tri-County Parkway alternatives will be evaluated.
The three counties that the Tri-County Parkway will traverse are among the top ten fastest growing counties in the Commonwealth of Virginia. According to the 2000 Census, Loudoun County’s population grew by 97 percent from 1990 to 2000. Prince William County’s and Fairfax County’s population grew by 30 percent and 19 percent, respectively, during those same years. The City of Manassas and the City of Manassas Park are also located within the Tri-County Parkway study area. Both of these cities have experienced substantial population growth over the last ten years. The City of Manassas had a population growth of 26 percent and the City of Manassas Park grew by 53 percent.
Much of the growth in Northern Virginia can be attributed to the emergence of high-tech industries near the Washington Dulles International Airport. By the year 2025, employment in the Dulles/Tysons corridor is expected to reach 280,000 jobs - 71 percent more than current conditions. The Dulles/Tysons corridor will become the second largest employer in the Washington Metropolitan region, second only to downtown Washington D.C. Prince William County and the City of Manassas have also experienced significant high-tech industry growth. The Dulles area consists of the Dulles Greenway, VA 7, VA 28, and US Route 50.
A second rapid growth corridor within the region is the I-66 corridor. Transportation improvements for the I-66 corridor from Interstate 495 (I-495) to the Gainesville area were evaluated in January 1999 as part of a comprehensive study entitled “The I-66 Corridor Major Investment Study (I-66 MIS).” Information from that study revealed that population in the I-66 corridor located within Fairfax, Prince William, and Loudoun counties is projected to increase from 269,000 persons in 1999 to 466,000 persons in 2020. This represents a 73 percent increase in population over the 22-year time frame. Employment is estimated to increase 83 percent in this same time period (from 162,000 jobs in 1999 to 296,000 jobs in 2020).
The primary problem the Tri-County Parkway is intended to address is the lack of adequate north-south transportation facilities linking the I-66 corridor with the Dulles area and VA 267. East of US 15 and west of the I-495 (Capital Beltway), only three principal urban arterials link the spokes together - VA 28 (Sully Road), Route 7100 (Fairfax County Parkway), and VA 123. These north-south facilities are heavily congested and will deteriorate further by the year 2025.
Level of service on VA 28 is currently deficient in the a.m. and p.m. peak periods. By 2025, most segments of VA Route 28 northbound in the a.m. and southbound in the p.m. are expected to operate at LOS F or G (a severely congested state). Traveling south in the p.m. between the Fairfax County line

1-2 Socioeconomic Technical Report
Figure 1.1-1 REGIONAL LOCATION MAP
1-3 Socioeconomic Technical Report
Figure 1.1-2 STUDY AREA
1-4 Socioeconomic Technical Report
and I-66, speeds are estimated to drop along VA 28 from an already slow 18 miles per hour (mph) to 13 mph between 2000 and 2025. The posted speed limit in this area is 45 mph. By 2025 the peak periods for a.m. and p.m. traffic on VA 28 could extend for over three hours each; however, improvements to VA 28 have been proposed under the Virginia Public-Private Transportation Act (VPPTA) of 1995 to convert the 14-mile stretch of VA 28 between I-66 and Route 7 to a limited access freeway. That project would involve widening VA 28 to an eight-lane section, as well as replacing up to ten signalized intersections with grade-separated interchanges. If the VA 28 improvements project is completed as planned, the added capacity should increase speeds and reduce congestion along VA 28 - in effect improving operating speeds in the a.m. and p.m. peak periods.
1.2 PURPOSE AND NEED
The study area presently lacks adequate north-south transportation facilities linking the I-66 corridor with the Dulles area and VA 267. The purpose and need for the Tri-County Parkway is comprised of four key elements. Each of the elements is a critical and salient factor to be addressed by the transportation alternatives. There is no attempt to weight one element over the others. Each of the elements has equal value and importance in the overall transportation, environmental, economic, and quality of life objectives for the communities being served under the proposed action. The four elements are listed below and are further elaborated in Sections 1.3 through 1.7 of the associated document titled Purpose and Need Statement (VDOT, 2003):
1. Improve transportation mobility and capacity and, by doing so, improve access and reduce congestion.
2. Enhance the linkage of communities and the transportation system that serves those communities.
3. Accommodate social demands, environmental goals, and economic development needs.
4. Improve safety and, by doing so, reduce the average crash, injury, and accident rates on the roadway network.
(This area left blank intentionally)

2-1 Socioeconomic Technical Report
2.0 ALTERNATIVES CONSIDERED
2.1 INTRODUCTION
In accordance with NEPA requirements, alternatives initially considered for the Tri-County Location Study included the No-Build, Mass Transit, Transportation System Management (TSM), and Candidate Build Alternatives (CBAs). Each alternative was evaluated with respect to its potential impacts and its ability to address the project’s purpose and need.
2.2 ALTERNATIVES ELIMINATED FROM DETAILED STUDY
Assessments conducted as part of the Tri-County Parkway Location Study determined that the nature of the study area makes the identification of a mass transit alternative that can address the corridor’s purpose and need problematic. No transit authority exists whose service area covers or would cover the entire study area, nor are there plans to establish such an authority. In addition, the development patterns and traffic patterns and volumes within the study corridor do not favor north-south through movement along the corridor. The majority of trips and greatest volumes are to points outside the study area or along only a portion of the corridor (i.e., from the Manassas and Centerville areas to I-66 and points east, from the South Riding area to the Dulles corridor). The through volumes are by far the weakest in the study area and would not attract sufficient transit riders to make such service viable; therefore, the mass transit alternative was eliminated from further consideration.
There are no practicable Transportation System Management (TSM) measures beyond those already proposed in the CLRP and VDOT Six Year Plan which could reasonably be implemented to satisfy the purpose and need for the Tri-County Parkway. TSM-type improvements programmed into the aforementioned plans do not satisfy the project’s purpose and need when considered as a stand-alone alternative; therefore, the TSM Alternative was eliminated from further consideration.
2.3 THE NO-BUILD ALTERNATIVE
Consistent with the requirements of the NEPA and related FHWA guidelines, full consideration is given to the environmental consequences of taking no action to meet future travel demand (hereinafter referred to as the “No-Build Alternative”). The No-Build Alternative includes currently programmed committed and funded roadway and transit projects in the Virginia Department of Transportation (VDOT) Six Year Plan and the CLRP developed by the MWCOG. The No-Build Alternative, while having no direct construction costs, would result in other economic, environmental, and quality of life impacts that can be expected from the continuation of roadway system deficiencies. While the No-Build alternative does not meet the project needs for traffic, safety, and roadway infrastructure improvements, it provides a baseline condition with which to compare the improvements and consequences associated with the Candidate Build Alternatives. The following is a list of major projects identified in the CLRP which influence the Tri-County Parkway study area:
● Dulles/VA 7 Corridor ● VA 28 Corridor ● Prince William Parkway (VA 3000) Corridor ● Fairfax County Parkway (VA 7100) Corridor ● I-66/US 29/US 50 Corridor ● I-495 (Beltway) Corridor ● Manassas National Battlefield Park Bypass ● Western Transportation Corridor
2.4 CANDIDATE BUILD ALTERNATIVES
Three Candidate Build Alternatives (CBAs) have been identified for further evaluation in a Draft Environmental Impact Statement (EIS). These CBAs are referred to hereinafter as: (1) the “Comprehensive Plan” CBA, (2) the “West Two” CBA, and (3) the “West Four” CBA. The process leading
2-2 Socioeconomic Technical Report
to the identification of these three CBAs is discussed in greater detail in the associated document tilted Alternatives Identification, Development, and Screening Technical Report (VDOT, 2004). The northern and southern termini for these CBAs have been selected in accordance with FHWA Technical Guidelines for termini development and are discussed in greater detail in the associated document titled Logical Termini Technical Memorandum (VDOT, 2003).
Each of the CBAs is expected to be comprised of two or more facility types according to localized needs and goals. To assess environmental effects associated with a particular facility type along each CBA, three general design concepts have been developed:
• General Design Segment 1 (hereinafter referred to as “Segment 1”). • General Design Segment 2 (hereinafter referred to as “Segment 2”). • General Design Segment 3 (hereinafter referred to as “Segment 3”).
The process leading to the development of these general design segments is presented in the associated document tilted Study Location Report (VDOT, 2004). The three general design segments developed for purposes of this assessment are depicted in Figure 2.3-1 and are described as follows:
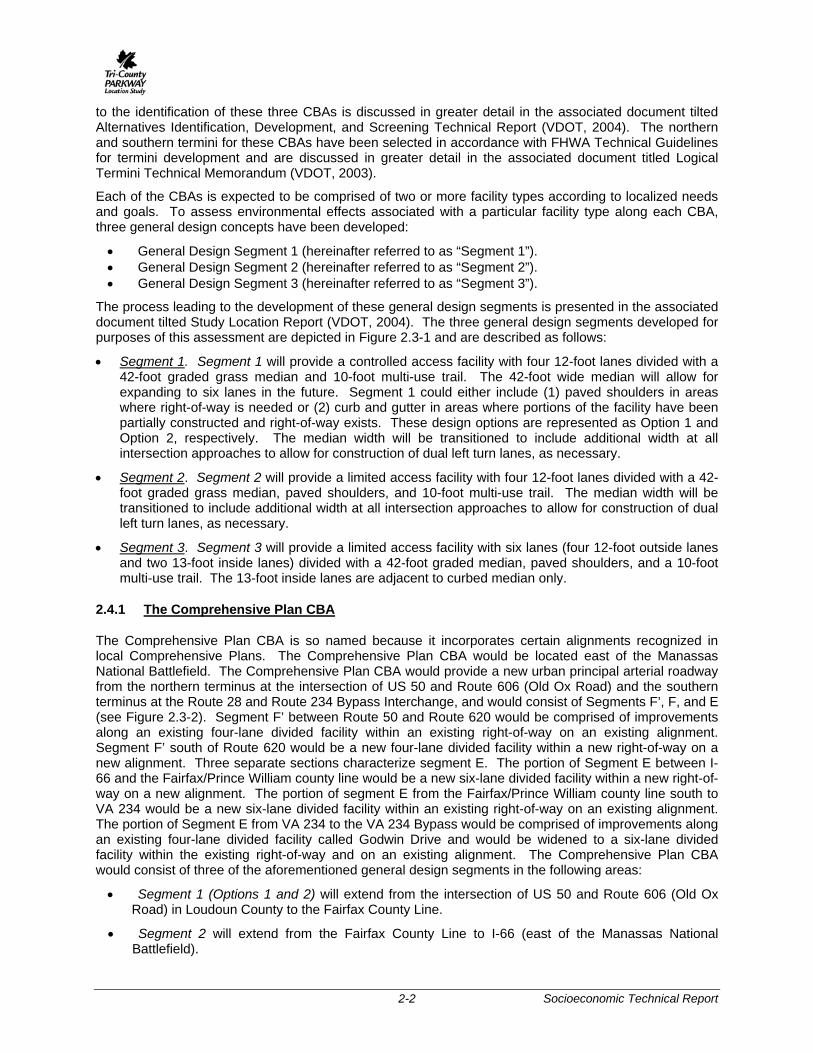
• Segment 1. Segment 1 will provide a controlled access facility with four 12-foot lanes divided with a 42-foot graded grass median and 10-foot multi-use trail. The 42-foot wide median will allow for expanding to six lanes in the future. Segment 1 could either include (1) paved shoulders in areas where right-of-way is needed or (2) curb and gutter in areas where portions of the facility have been partially constructed and right-of-way exists. These design options are represented as Option 1 and Option 2, respectively. The median width will be transitioned to include additional width at all intersection approaches to allow for construction of dual left turn lanes, as necessary.
• Segment 2. Segment 2 will provide a limited access facility with four 12-foot lanes divided with a 42-foot graded grass median, paved shoulders, and 10-foot multi-use trail. The median width will be transitioned to include additional width at all intersection approaches to allow for construction of dual left turn lanes, as necessary.
• Segment 3. Segment 3 will provide a limited access facility with six lanes (four 12-foot outside lanes and two 13-foot inside lanes) divided with a 42-foot graded median, paved shoulders, and a 10-foot multi-use trail. The 13-foot inside lanes are adjacent to curbed median only.
2.4.1 The Comprehensive Plan CBA
The Comprehensive Plan CBA is so named because it incorporates certain alignments recognized in local Comprehensive Plans. The Comprehensive Plan CBA would be located east of the Manassas National Battlefield. The Comprehensive Plan CBA would provide a new urban principal arterial roadway from the northern terminus at the intersection of US 50 and Route 606 (Old Ox Road) and the southern terminus at the Route 28 and Route 234 Bypass Interchange, and would consist of Segments F’, F, and E (see Figure 2.3-2). Segment F’ between Route 50 and Route 620 would be comprised of improvements along an existing four-lane divided facility within an existing right-of-way on an existing alignment. Segment F’ south of Route 620 would be a new four-lane divided facility within a new right-of-way on a new alignment. Three separate sections characterize segment E. The portion of Segment E between I-66 and the Fairfax/Prince William county line would be a new six-lane divided facility within a new right-of-way on a new alignment. The portion of segment E from the Fairfax/Prince William county line south to VA 234 would be a new six-lane divided facility within an existing right-of-way on an existing alignment. The portion of Segment E from VA 234 to the VA 234 Bypass would be comprised of improvements along an existing four-lane divided facility called Godwin Drive and would be widened to a six-lane divided facility within the existing right-of-way and on an existing alignment. The Comprehensive Plan CBA would consist of three of the aforementioned general design segments in the following areas:
• Segment 1 (Options 1 and 2) will extend from the intersection of US 50 and Route 606 (Old Ox Road) in Loudoun County to the Fairfax County Line.
• Segment 2 will extend from the Fairfax County Line to I-66 (east of the Manassas National Battlefield).

2-3 Socioeconomic Technical Report
• Segment 3 will extend from I-66 in Fairfax County to Route 234 in Prince William County.
2.4.2 The West Two CBA
The West Two CBA is located west of the Manassas National Battlefield. The West Two CBA would provide a new urban principal arterial roadway from the northern terminus near the intersection of US 50 and Route 877 (Racefield Lane) and the southern terminus at the I-66 and Route 234 Interchange. The West Two CBA would be a new four-lane divided facility within a new right-of-way and on a new alignment, and would consist of Segments D and C (see Figure 2.3-2). The West Two CBA would consist of two of the aforementioned general design segments in the following areas:
• Segment 1 (Option 1) will extend from the intersection of US 50 and 877(Racefield Road) in Loudoun County to the Prince William County Line.
• Segment 2 will extend from the Prince William County Line to the interchange of I-66 and Route 234 (west of the Manassas National Battlefield).
The West Four CBA
The West Four CBA is also located west of the Manassas National Battlefield. The West Four CBA would provide a new urban principal arterial roadway from the northern terminus at the intersection of US 50 and Route 606 (Old Ox Road) and the southern terminus at the I-66 and Route 234 Interchange. The West Four CBA would consist of Segments F’, G, and C (see Figure 2.3-2). Segment F’ between Route 50 and Route 620 (Braddock Road) would be comprised of improvements along an existing four-lane divided facility within an existing right-of-way on an existing alignment. Segment F’ south of Route 620 would be comprised of a new four-lane divided facility within a new right-of-way on a new alignment. The West Four CBA would consist of two of the aforementioned general design segments in the following areas:
• Segment 1 (Option 1) will extend from the intersection of US 50 and Route 606 (Old Ox Road) in Loudoun County to the Prince William County Line.
• Segment 2 will extend from the Prince William County Line to the interchange of I-66 and Route 234 (west of the Manassas National Battlefield).
(This area left blank intentionally)

2-4 Socioeconomic Technical Report
Figure 2.3-1 GENERAL DESIGN SEGMENTS TYPICAL SECTIONS

2-5 Socioeconomic Technical Report
Figure 2.3-2 CANDIDATE BUILD ALTERNATIVES

3-1 Socioeconomic Technical Report
3.0 AFFECTED ENVIRONMENT
This section describes the current population and trends to the year 2030. The rapid growth shows no sign of slowing down. The minority and low income populations are small, but significant.
3.1 POPULATION
Rapid population growth has been experienced throughout the Tri-County Parkway project corridor and is expected to continue in the future. Table 3.1-1 provides past and forecast population for jurisdictions represented by the study area and the Commonwealth of Virginia. According to the U.S. Census, Loudoun County was the fastest growing jurisdiction in the area - with a 1990 to 2000 population increase of 96.8 percent. Virginia, by comparison, grew by 14.4 percent. The population of Fairfax County increased the least during this time period (18.5 percent), but continues to be the most populated jurisdiction in the Commonwealth. Prince William County has moved up from the fifth to the third most populous jurisdiction in the Commonwealth between the two decennial censuses.
The 2030 figures are based on MWCOG projections that have not been revised based on the 2000 Census. Although Loudoun County will continue to be the fastest growing jurisdiction in the area, Fairfax County will still have the larger population.
Table 3.1-1 POPULATION HISTORY AND FORECAST FOR JURISDICTIONS REPRESENTED
BY THE PROJECT STUDY AREA
Jurisdiction 1990 2000 2030 Percent change from 2000 to 2030
Virginia 6,187,358 7,078,515 8,791,520* 42.09%*
Fairfax County 818,584 969,749 1,211,980 48.06%
Loudoun County 86,129 169,599 411,036 377.23%
Prince William County 215,686 280,813 430,734 99.70%
Manassas Park City 6,734 10,290 15,798 134.60%
Manassas City 27,957 35,135 36,919 32.06%
Source: U.S. Census (1990 and 2000; State Level 2025); MWCOG (Jurisdiction Level 2025, 2030); *Parsons Brinckerhoff (interpolation of 2025 data)
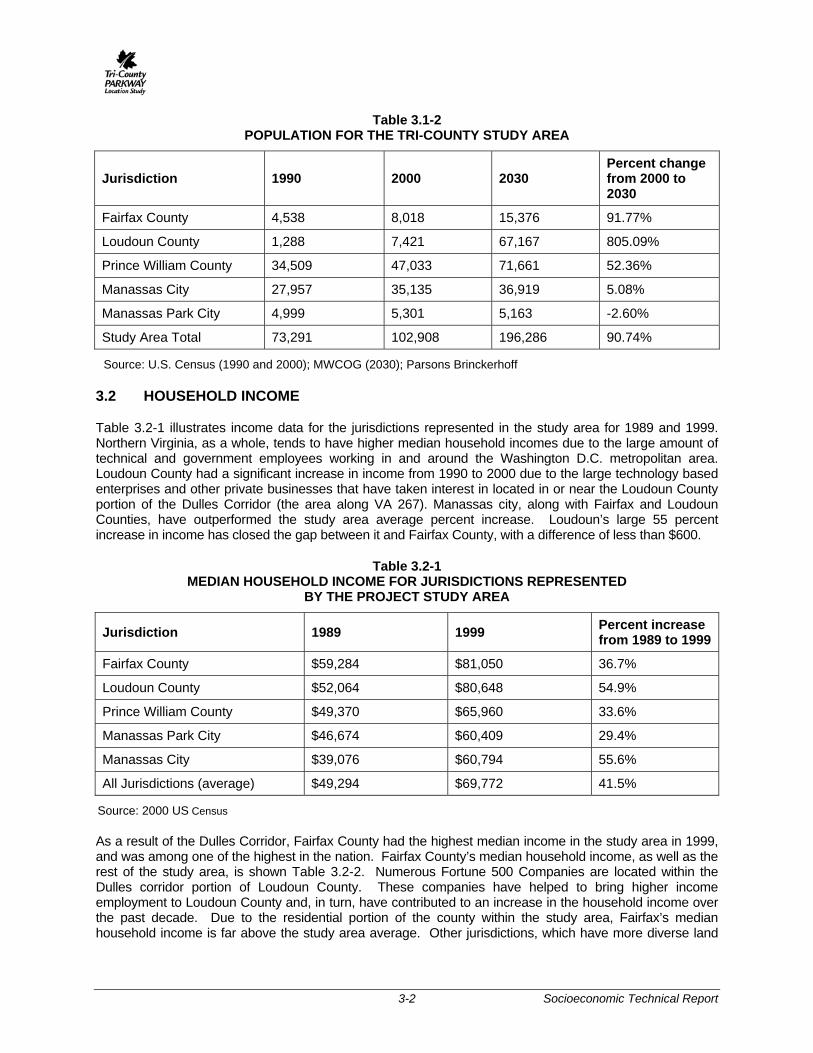
Table 3.1-2 presents the 1990, 2000, and 2030 data for residents in the Tri-County Parkway study area. From 1990 to 2000, the study area’s population increased by 40 percent and an annual average increase of 2,962 persons per year. The 2030 forecast represents an even greater annual increase over the next 35 years. The study area’s 2000 population of 102,908 represents 1.45 percent of the Commonwealth’s total population. A population base of this size is larger than most cities in Virginia.
Out of the jurisdictions represented by the study area, Loudoun County shows the largest percentage increase in population from 2000 to 2030 (with about an 800 percent increase), followed by Fairfax County (with a 91.8 percent increase), then Prince William County (with a 57.4 percent increase), and Manassas (with a 5.1 percent increase). Manassas Park is the only jurisdiction in the study area to show a decline in population. Within the study area, Manassas Park is generally built-out causing limited potential for a major increase in the number of households.
3-2 Socioeconomic Technical Report
Table 3.1-2 POPULATION FOR THE TRI-COUNTY STUDY AREA
Jurisdiction 1990 2000 2030 Percent change from 2000 to 2030
Fairfax County 4,538 8,018 15,376 91.77%
Loudoun County 1,288 7,421 67,167 805.09%
Prince William County 34,509 47,033 71,661 52.36%
Manassas City 27,957 35,135 36,919 5.08%
Manassas Park City 4,999 5,301 5,163 -2.60%
Study Area Total 73,291 102,908 196,286 90.74%
Source: U.S. Census (1990 and 2000); MWCOG (2030); Parsons Brinckerhoff
3.2 HOUSEHOLD INCOME
Table 3.2-1 illustrates income data for the jurisdictions represented in the study area for 1989 and 1999. Northern Virginia, as a whole, tends to have higher median household incomes due to the large amount of technical and government employees working in and around the Washington D.C. metropolitan area. Loudoun County had a significant increase in income from 1990 to 2000 due to the large technology based enterprises and other private businesses that have taken interest in located in or near the Loudoun County portion of the Dulles Corridor (the area along VA 267). Manassas city, along with Fairfax and Loudoun Counties, have outperformed the study area average percent increase. Loudoun’s large 55 percent increase in income has closed the gap between it and Fairfax County, with a difference of less than $600.
Table 3.2-1 MEDIAN HOUSEHOLD INCOME FOR JURISDICTIONS REPRESENTED
BY THE PROJECT STUDY AREA
Jurisdiction 1989 1999 Percent increase from 1989 to 1999
Fairfax County $59,284 $81,050 36.7%
Loudoun County $52,064 $80,648 54.9%
Prince William County $49,370 $65,960 33.6%
Manassas Park City $46,674 $60,409 29.4%
Manassas City $39,076 $60,794 55.6%
All Jurisdictions (average) $49,294 $69,772 41.5%
Source: 2000 US Census
As a result of the Dulles Corridor, Fairfax County had the highest median income in the study area in 1999, and was among one of the highest in the nation. Fairfax County’s median household income, as well as the rest of the study area, is shown Table 3.2-2. Numerous Fortune 500 Companies are located within the Dulles corridor portion of Loudoun County. These companies have helped to bring higher income employment to Loudoun County and, in turn, have contributed to an increase in the household income over the past decade. Due to the residential portion of the county within the study area, Fairfax’s median household income is far above the study area average. Other jurisdictions, which have more diverse land

3-3 Socioeconomic Technical Report
uses within the study area, have lower median household income. All Jurisdictions have incomes consistent or higher than the study area average.
Table 3.2-2 STUDY AREA MEDIAN HOUSEHOLD INCOME
Jurisdiction Median Household Income, 1999
Fairfax County $112,849
Loudoun County $64,820
Prince William County $58,459
Manassas Park City $60,409
Manassas City $60,794
Study Area average $65,407
Source: 2000 US Census, Parsons Brinckerhoff
3.3 HOUSING
Table 3.3-1 presents selected housing data for the Tri-County Parkway study area and the Commonwealth of Virginia. Of the 36,000 occupied housing units in the study area, 74 percent were owner occupied. This percentage is larger than Commonwealth average of just over 63 percent. On the jurisdiction level, the pattern continues; all but one jurisdiction has percent owner occupied units above that of the Commonwealth. Loudoun County has the highest percent owner occupied units at 86 percent. Prince William County, with more than half the volume of rental units in the study area, has the lowest percentage of owner-occupied housing in the study area. Prince William and Manassas Park city have the largest percentages of renter-occupied housing, with the latter consistent with that of the Commonwealth. Only 2.9 percent of the housing units in the study area are vacant, suggesting a high demand for housing.
Table 3.3-1 HOUSING DATA FOR TRI-COUNTY STUDY AREA
Jurisdiction Total
Housing Units
Owner Occupied
Percent of Owner
OccupiedRenter
OccupiedPercent of
Renter Occupied
Vacant Percent Vacant
Virginia 2,904,192 1,837,939 63.2 % 861,234 29.7 % 205,019 7.1%
Fairfax County 2,456 1,945 79.2 % 486 19.8 % 25 1.0%
Loudoun County 2,669 2,285 85.6 % 285 10.6 % 99 3.7%
Prince William Co 17,061 10,146 59.5 % 6,340 37.2 % 575 3.4%
Manassas Park 12,114 8,203 67.8 % 3,554 29.3 % 357 2.9%
Manassas City 1,699 1,338 78.7 % 302 17.8 % 59 3.5%
Study Area Total 35,999 23,917 74.2% 10,967 22.9% 1,115 2.9%
Source: 2000 US Census

3-4 Socioeconomic Technical Report
3.4 ENVIRONMENTAL JUSTICE
Executive Order 12898, “Federal Actions to Address Environmental Justice in Minority Populations and Low Income Populations,” focused the attention of federal agencies on human environmental conditions in minority and low-income communities. In June 1995, the USDOT published its Final Strategy on Environmental Justice. The 1995 Proposed Federal Order identifies minorities as Black, Hispanic, Asian American, American Indians, and Alaskan Natives. The 1995 Proposed Federal Order identifies low-income as “a person whose median household income is below the Department of Health and Human Services poverty guidelines.”
3.4.1 Minority Populations
Figure 3.4-1 and Table 3.4-1 provides a summary of minority populations for the jurisdictions represented by the Tri-County Parkway project area. The study area for this analysis was previously defined in section 3.1. Several sources were used for this analysis – mainly, information gathered from the jurisdictions’ comprehensive plans and the 2000 Census data. When possible, interviews with representatives of study area jurisdiction were also conducted to gather information about minority enclaves. The majority of the overall population in the study area is white non-Hispanic, with 27 percent of the study area’s population being classified as minority. The study area’s percentage of minority is slightly below the Commonwealth average of 28 percent.
All jurisdictions represented in the study area have a lower percentage of minority residents - except for Prince William County which, at a rate of 29 percent, is slightly above the Commonwealth’s percentage of minority population. Among the minority groups, the Latino population is the most prevalent. This is especially true in the City of Manassas, where their numbers have increased over the past few years (Manassas, 2004). Not only has the Hispanic/Latino population grown, but the populations tend to cluster. Georgetown South, Bristoe Station, and Point of Woods are neighborhoods with high Hispanic populations in Manassas. The western half of the City of Manassas Park (the portion within the study area) is more diverse than the eastern half, but there are no clusters of one specific race or ethnicity (Manassas Park, 2004). Other minorities, such as African-Americans and Asian-Americans, are also located within and immediately outside the study area in smaller numbers. Loudon County, for example, has several neighborhoods with a majority African-American population in census tracts too large to be noticed. These neighborhoods, Aldie Mountain and Blue Mountain, are located just outside the study area (Loudoun County, 2004).
Table 3.4-1 MINORITY POPULATIONS IN THE STUDY AREA
Jurisdiction Total Population White Non-Hispanic Minority1 Percent
Minority
Virginia 7,078,515 5,120,110 1,958,405 28%
Fairfax County 8,018 6,207 1,811 23%
Loudoun County 6,918 5,982 936 14%
Prince William County 46,350 32,887 13,452 29%
Manassas Park 5,301 4,167 1,134 21%
Manassas City 35,135 25,316 9,819 28%
Study Area Total 101,722 74,559 27,152 24%
Source: 2000 U.S. Census 1 Total minority is the sum of all persons other than white-non-Hispanic. Hispanics may be of any race.

3-5 Socioeconomic Technical Report
3.4.2 Low-Income Populations
Figure 3.4-2 and Table 3.4-2 present the 2000 Census data for the populations of low-income families and individuals in the Tri-County Parkway study area. The Department of Health and Human Services (HHS) poverty guidelines (USDOT, 2000) are consistent with the US Census guidelines. Poverty, for a single person, is defined as a household income below $8,980. Each additional family member raises the family poverty threshold by $3,140. For example a family of four would have a poverty level of $18,400 ($8,890 + 3($3,140)). The US Census Bureau identifies a household as all the persons who occupy a housing unit. A family is a unit that consists of a householder and one or more other persons living in the same household who are related to the householder by birth, marriage or adoption.
The median household incomes for the individual jurisdictions represented in the study area are considerably higher than the Commonwealth, thus the percent of people below the poverty level are well below the 9.6 percent value for Virginia. Prince William County and the City of Manassas Park have the highest percentage of persons below the poverty level (6.4 percent), still notably lower than the Commonwealth’s average. There are incidences of families that qualify for Section 8 housing, as well as those that qualify for affordable housing. From interviews conducted, the numbers of low-income populations are relatively low. The Social Services Department of the City of Manassas has a number of families that qualify for affordable housing (Manassas, 2004). In the City of Manassas Park, the western portion of the City (this portion is within the study area) contains all of the City’s lower-income areas (Manassas Park, 2004). Moving away from the more urbanized areas, the low-income populations drop significantly. The Loudoun County portion of the study area, for example, is rural and in the process of converting to suburban land uses. With the majority of the housing in the area ranges from $350,000 to $850,000 (Toll Brothers), the low-income population is small.
Table 3.4-2 LOW INCOME AND POVERTY CHARACTERISTICS FOR THE STUDY AREA
Place Median
Household Income
Families Below
Poverty Level
Families in Poverty
(percent)
Persons for Whom Poverty
Level is Determined1
People Below
Poverty Level
Percent of People Below Poverty Level
Virginia $46,677 129,890 2% 6,844,372 656,641 9.60%
Fairfax County $112,849 67 1% 8,032 218 2.70%
Loudoun County $64,820 50 3% 7,032 107 1.50%
Prince William County
$55,459 893 2% 45,538 2,913 6.40%
Manassas Park City $55,608 108 2% 5,272 337 6.40%
Manassas City $60,450 560 2% 34,163 2,151 6.30%
Study area average/ total
$65,407 2 1,678 3 2% 2 100,037 3 5,726 3 4.69% 2
Source: 2000 US Census, Parsons Brinckerhoff 1 Poverty status is determined for all people except institutionalized people, people in military group quarters, people
in college dormitories, and unrelated individuals under 15 years old. 2 Study area average 3 Study area total

!"a$
!"a$
!"a$
I¥
I¥
I¥
Aæ
Aæ
Aæ
?b
?b
?b
?b
I©
I©
Ix
?b
AÔ
?Ä
?Ä
?t
?t
?u
?u
?¡
?s
Ix
?s
?u
?i
?f
?t
!"a$
I¥!"a$
Aæ
Aæ
LoudounCounty
Prince WilliamCounty
FairfaxCounty
MANASSAS
MANASSASPARK
Washington DullesInternational Airport
Haymarket
Socioeconomic Technical Report3-6
.0 1 20.5
Miles
FIGURE 3.4-1MINORITY POPULATIONS
Source: 2000 Census Blocks
Block
Minority Population Exceeds Study Area Average (>24.2%)
Minority Population Exceeds State Average (>27.7%)
Study Area

!"a$
!"a$
!"a$
I¥
I¥
I¥
Aæ
Aæ
Aæ
?b
?b
?b
?b
I©
I©
Ix
?b
AÔ
?Ä
?Ä
?t
?t
?u
?u
?¡
?s
Ix
?s
?u
?i
?f
?t
!"a$
I¥!"a$
Aæ
Aæ
LoudounCounty
Prince WilliamCounty
FairfaxCounty
MANASSAS
MANASSASPARK
Washington DullesInternational Airport
Haymarket
Socioeconomic Technical Report3-7
0 1 20.5Miles
FIGURE 3.4-2LOW INCOME POPULATIONS
Source: 2000 Census Block Groups
.Block Group
Population Below Poverty Level Exceeds Study Area Average (>4.7%)
Population Below Poverty Level Exceeds State Average (>9.6%)
Study Area

3-8 Socioeconomic Technical Report
3.5 EMPLOYMENT
In addition to significant population growth, employment in the study area is also anticipated to grow considerably in the future. Table 3.5-1 contains current and future employment projections for the study area and shows the forecasted growth for employment in the Commonwealth. Because the Tri-County Parkway study area is in close proximity to Metropolitan Washington DC and the Dulles Corridor, the study area has some of the largest employment centers in Virginia.
Fairfax County has the largest number of jobs (517,734) and the largest labor force (532,000) out of the jurisdictions being represented by the Tri-County Parkway study area. This is mostly due to the strategic location of the county, being located on the Mid Atlantic Seaboard, and within close proximity to neighboring Metropolitan Washington DC. With more than 400 technology firms in Fairfax County, incomes are increased and very competitive. Some of the larger companies in Fairfax County are outside of the project area, and are generally in the information technology sector, internet, energy, global and international trade, and retail sectors. Those larger employers include: American Management Systems, Comprehensive Technologies International, Computer Sciences Corporation, DynCorp, EDS, Netcom Solutions International, Netplex, Reliable Integration Services, Science Applications International Corporation (SAIC), Signal Corporation, CareerBuilder.com, FOLIOfn, Road Runner Group, Streampipe.com, Tyson’s Corner, and Exxon Mobile Corporation.
Loudoun County’s labor market overall has increased dramatically in the last ten years. According to the Virginia Employment Commission, resident labor force increased by 78.9 percent, while employment by Loudoun County residents increased by 80 percent. In 2000, Loudoun County had 93,862 residents employed. Most of the employment in Loudoun County is focused in the Dulles corridor. Some of those large employers include: America Online, MCI (formerly World Com), Com Search, NLX, and Independence Air (formerly Atlantic Coast Airlines).
Prince William County has had a steady increase in employment over the past decade. According to the 2000 Census, 84,569 residents were employed in Prince William County. The majority of the large employers in Prince William County are outside of the project area. Those employers include: Didlake Inc., Micron Technology, Potomac Hospital, Quantico Marine Corp Base, S.W. Rodgers Company, and Vulcan Construction Materials.
The study area employment is projected to increase significantly (by 111.0 percent) by 2030, which is high in comparison to the Commonwealth projected increase of 43.0 percent. With a 327.3 percent increase, Fairfax County employment is projected to increase the most out of the jurisdictions represented. Loudoun County (with a 289.4 percent increase) follows, with Prince William (150.2 percent), Manassas Park (44.4 percent), and Manassas (21 percent) remaining.
Table 3.5-1 EMPLOYMENT FOR THE STUDY AREA
Jurisdiction 2000 2030 Percent change from 2000 to 2030
Virginia 4,413,620 6,311,948* 43.01%*
Fairfax County 1,079 4,611 327.34%
Loudoun County 2,621 10,205 289.36%
Prince William County 26,373 65,983 150.19%
Manassas Park City 730 1,054 44.38%
Manassas City 19,912 24,095 21.01%
Study Area Total 50,215 105,948 110.99%
Source: 2000 Woods and Poole 2000 and 2025 employment forecast (Virginia); MWCOG (Study Area); *Parsons Brinckerhoff interpolation of 2025 data.

4-1 Socioeconomic Technical Report
4.0 ENVIRONMENTAL CONSEQUENCES
Aside from the No-Build Alternative, all alternatives have physical impacts that will affect residences, businesses, minorities, and low-income families. Residential displacements are the highest with the West Two alterative; the Comprehensive Plan alternative may have the highest environmental justice impacts. Likewise, the Comprehensive Plan alternative has the largest number (three) of business relocations. Specific details of these impacts follow.
4.1 RELOCATIONS
4.1.1 No Build and TSM Alternatives
No direct social consequences are identified for the No-Build and TSM Alternatives.
4.1.2 Candidate Build Alternatives
Table 4.1-1and Table 4.2-1 present the number of residential units that would be displaced under each Candidate Build Alternative. As indicated, the lowest amount of displacements would occur with the West Four Alternative and the greatest number of displacements would occur with the West Two Alternative. These displacements were calculated using the limits of construction rather than the 600’ corridor. Therefore, if the corridor width is reduced during the final design, there should not be a significant reduction in relocations.
Data from Census 2000 indicates that most of the houses taken are owner occupied. The average number of owner occupied houses is approximately 80 percent for Fairfax County, 86 percent for Loudoun County, 60 percent for Prince William County, and 79 percent for the City of Manassas.
Impacts to social groups as a result of the Build Alternative, under any of the candidates, would fall into several general categories: displacements of residential units; noise, altered views; loss of public services or facilities; and altered access.
Table 4.1-1 RESIDENTIAL UNITS DISPLACEMENTS BY ALTERNATIVE
Option Number of Residential Units Relocated1
Number of Non-Profit Organizations Relocated
West Two 18 0 West Four 0 0 Comprehensive Plan 13 0
1 Every residential unit within the estimated limits of construction is considered a residential unit relocation. Units located close to, but not inside of the construction limits, or land-locked units, were considered in the damages estimate but not included in the total number of relocated residential units.
Source: Virginia Department of Transportation
4.1.3 Potential Mitigation
Due to minimal impacts, no social consequences mitigation is proposed for the No-Build or the TSM Alternative. The following mitigation is recommended to be applicable to Candidate Build Alternatives.
• The Virginia Department of Transportation’s right-of-way acquisition and relocation program will be conducted in accordance with the Federal Uniform Relocation Assistance and real Property Acquisition Act of 1970, as amended and with the Surface Transportation and Uniform Relocation and Assistance Act of 1987 (STURRA). A relocation assistance and payment program is available through VDOT to aid displaced residents. Relocation payments and advisory assistance are offered in addition to the state's payment for real property. The construction authorization for this project will not be granted until VDOT is satisfied that there is sufficient decent, safe, and sanitary housing in the area available to the families and that they have been informed of its availability. Also, VDOT must be satisfied that supplemental payments, if any, have been made available, that the affected

4-2 Socioeconomic Technical Report
occupants have received sufficient time to obtain possession of housing which is within their financial means, and that replacement housing is open and fair to all persons regardless of race, color, religion, sex or national origin.
• Impacts to social consequences may vary depending on the Build Alternative option. Minimization of the effects has been evaluated but specific mitigation recommendations will not be developed until an alternative is selected by the Commonwealth Transportation Board. Once a decision is made, specific mitigation recommendations will be more fully addressed in the Final EIS.
4.2 ENVIRONMENTAL JUSTICE CONSEQUENCES
Executive Order 12898 requires Federal agencies to “achieve environmental justice by identifying and addressing disproportionately high and adverse human health and environmental effects, including the interrelated social and economic effects of their programs, policies, and activities on minority populations and low-income populations in the United States.” According to Federal guidelines, disproportionately high and adverse effect means “an adverse effect that (1) is predominately borne by a minority population and/or a low-income population; or (2) will be suffered by the minority population and/or low-income population and is appreciably more severe or greater in magnitude than the adverse effect that will be suffered by the non-minority population and/or non-low-income population.”
4.2.1 No-Build and TSM Alternatives
No direct effects on low-income or minority populations have been identified for the No-Build or TSM Alternatives.
4.2.2 Build Alternative
Table 4.2-1and Table 4.2-2 list the estimated number of minority and low-income impacts by alternative. An analysis of Census 2000 data determined the number of minority and low-income populations for the block/block groups contained by each Candidate Build Alternative. Percentages of those particular populations were applied to the number of relocations. In most cases, the number of relations was less than one; therefore the number was rounded off to one. The number of minority and low-income relocations is an estimate and should only be used a guideline. The Comprehensive Plan Alternative has the highest population of minorities, reflecting the concentration of minority and low-income occupied residential units in the City of Manassas.
Table 4.2-1 MINORITY RELOCATIONS BY ALTERNATIVE
Alternative Minority Population 1 Percentage Minority 2 Minority Relocations 3
West Two 96 0.3% 1
West Four 273 0.8% 0
Comprehensive Plan 1581 4.9% 1
Table 4.2-2 LOW-INCOME RELOCATIONS BY ALTERNATIVE
Alternative Low-Income population 1 Percentage of population with Low-Income 2 Relocations 3
West Two 93 1.6% 1
West Four 197 3.4% 0
Comprehensive Plan 1,611 28% 5 1 Total of blocks/block groups that contained the alternative 2 Percentage of population in block/block groups that contained the alternative 3 Percentages applied to the total displaced residential units Source: US Census, Virginia Department of Transportation, Parsons Brinckerhoff

4-3 Socioeconomic Technical Report
4.2.3 Potential Mitigation
Due to minimal impacts, no environmental justice consequences mitigation is proposed for the No-Build or the TSM Alternative. The following mitigation is recommended to be applicable to all Build Alternative options.
• Relocation impacts on low income or minority populations are not disproportionate to the general low income or minority population in the study area. No specific mitigation strategies, therefore, are being considered at this time to address impacts to low-income and minority populations. Consistent with mitigation procedures applied to all populations in the study area, the following is proposed: sound barriers, landscaping, and temporary relocation (U.S. Department of Transportation, 21 June 2004).
• VDOT’s right-of-way acquisition and relocation program will be conducted in accordance with the Federal Uniform Relocation Assistance and real Property Acquisition Act of 1970, as amended and with the STURRA. Relocation resources will be available without discrimination.
4.3 ECONOMIC CONSEQUENCES
4.3.1 No-Build Alternative
The No-Build Alternative would not improve regional access to any of the identified activity centers, industrial parks, enterprise zones, tourist attractions or other economic incentive areas within the study area. No relocation or loss of local property tax revenues would occur as a result of the No-Build Alternative. Travel time between economic growth incentive areas will increase because of increased congestion.
4.3.2 Build Alternative
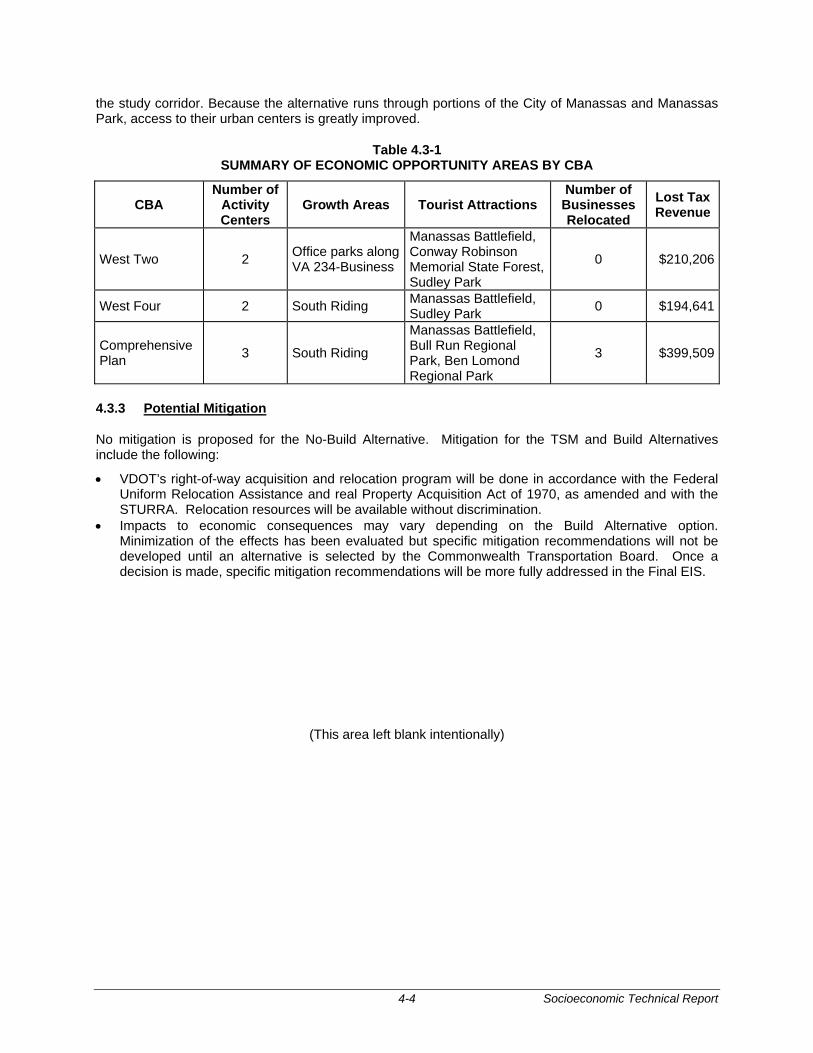
Segment effects were aggregated for each Build Alternative option. Table 4.3-1 presents economic opportunity area summaries by option. The combined effects of individual segments result in a regional snapshot of what would benefit and what would not benefit if Tri-County Parkway were introduced. Activity centers in this study area include the termini of the Tri-County Parkway corridor (the Dulles Corridor to the north, and extensive centers—such as Potomac Mills—to the south and east).
The economic effects expected from the Build Alternative options include a tradeoff between the loss of fewer existing businesses with the proximity of a proposed options to existing and planned industrial and commercial growth areas. Improvement in travel time within the study area is expected. The traffic and transportation technical memorandum provides a regional and interstate travel time saving analysis for the No Build and a generic Build Alternative.
Lost tax revenue for each option is considered a temporary effect. All impacted businesses will be compensated for search, moving, and reestablishment expenses or be given an in-lieu of payment if they prefer.
West Two Build Alternative: West Two would not require the relocation of businesses but accesses only two of the three activity centers. The West Two Alternative does not pass through the main urban areas in Manassas or Manassas Park. The Manassas National Battlefield Park, the Conway Robinson Memorial State Forest, and Sudley Park are accessible with this alternative.
West Four Build Alternative: West Four would not require the relocation of businesses. The Alternative goes through the South Riding community, giving the area improved access to activity centers, but did not pass through the cities on the southern portion of the study area. The Manassas National Battlefield Park, the Conway Robinson Memorial State Forest, and Sudley Park are accessible with this alternative.
Comprehensive Plan Build Alternative: This alternative would relocate three businesses. At the time of publication, the natures of the business requiring relocation were not identified. This alternative, like West Two, links South Riding and the Dulles Corridor. It also provides access to several parks, including Bull Run Regional Park. These options would also provide access to the greatest amount of activity centers in
4-4 Socioeconomic Technical Report
the study corridor. Because the alternative runs through portions of the City of Manassas and Manassas Park, access to their urban centers is greatly improved.
Table 4.3-1 SUMMARY OF ECONOMIC OPPORTUNITY AREAS BY CBA
CBA Number of
Activity Centers
Growth Areas Tourist Attractions Number of
Businesses Relocated
Lost Tax Revenue
West Two 2 Office parks along VA 234-Business
Manassas Battlefield, Conway Robinson Memorial State Forest, Sudley Park
0 $210,206
West Four 2 South Riding Manassas Battlefield, Sudley Park 0 $194,641
Comprehensive Plan 3 South Riding
Manassas Battlefield, Bull Run Regional Park, Ben Lomond Regional Park
3 $399,509
4.3.3 Potential Mitigation
No mitigation is proposed for the No-Build Alternative. Mitigation for the TSM and Build Alternatives include the following:
• VDOT’s right-of-way acquisition and relocation program will be done in accordance with the Federal Uniform Relocation Assistance and real Property Acquisition Act of 1970, as amended and with the STURRA. Relocation resources will be available without discrimination.
• Impacts to economic consequences may vary depending on the Build Alternative option. Minimization of the effects has been evaluated but specific mitigation recommendations will not be developed until an alternative is selected by the Commonwealth Transportation Board. Once a decision is made, specific mitigation recommendations will be more fully addressed in the Final EIS.
(This area left blank intentionally)

5-1 Socioeconomic Technical Report
5.0 REFERENCES
Loudoun County, Department of Economic Development, County of Loudoun. 2001 Annual Growth Summary. May 2002. Information accessed at www.loudon.gov/business
Loudoun County, Department of Economic Development, County of Loudoun. Telephone interview with Clark Draper. 21 September 2004.
Manassas Virginia, City of. Department of Social Services. Telephone interview with Brenda Knowles. 16 September 2004.
Manassas Park, City of. Department of Planning. Telephone interview with Dan Painter. 21 September 2004.
Toll Brothers, Inc. “The Homes [of South Riding].” South Riding By Toll Brothers…Your New Home Town. www.southriding.com/homes. Accessed 5 June 2004.
Virginia Department of Conservation and Recreation, Division of Planning and Recreation Resources. The 2002 Virginia Outdoors Plan. Commonwealth of Virginia. February 2002.
Virginia Department of Transportation. The I-66 Corridor Major Investment Study (I-66 MIS). January 1999.

APPENDIX A
Socioeconomic GIS Analysis

(This page left blank intentionally)

A-1 Socioeconomic Technical Report
The Methodology
The study area is based on block group areas as defined by the US Census Bureau to simplify the ability to acquire data. Block data was the preferred area size because it was the smallest unit and contains the most specific data. Block data was available for all Census 2000 information, which includes information from Summary Tape Files for population (STF1) and for housing characteristics (STF3). Block data was also available for the 1990 Census STF1 files. Only block group data was available for the 1990 STF3 files.
Information on the state level was also acquired from the Census’ STF1 and STF3 files.
Information from the Census was downloaded from the bureau’s website (www.census.gov) and joined with GIS shapefiles. ArcGIS was the software program used to acquire shapefiles with block and block group polygons associated with the study area. A “join” function attaches the data with the respective polygon.
Additional Calculations
Several calculations were preformed with ArcGIS. The first was a percentage of the area with minority populations. “Minority” includes all persons other than White, Not of Hispanic Origin. The second was a percentage of families with income below the poverty level. Another calculation determined the study area’s average for minority and low-income percentages.
Additional columns were placed in the shapefile’s corresponding data sheet (.dbf file). One additional column was created to reflect if the minority or low-income population percentages were higher than the study area average. Another column was created to reflect if the minority or low-income population percentages were higher than the Commonwealth average. In both cases, the Commonwealth average was higher than the study area average. Thus, in the column for the minority population comparison or the low-income population comparison, the field could either be:
• blank (below the study area and Commonwealth average) • “study area” (above the study area average, but below Commonwealth average) • or “state” (above both the study area and Commonwealth average)
Creation of Maps for Figures
Graphics for figures displaying the minority and low-income areas were created in ArcGIS. Areas that were either above the study area or Commonwealth average were shaded in.
Out-liers had to be eliminated. For example, there were areas with a 100% minority population. Upon further examination, the census block had a population of one. One block reports one African-American in a block where the Manassas National Battlefield is located. This block was not shaded.
Another exception was taken. In portions of the city of Manassas, there were small areas with large population and percentages below the study area. However, the minority populations were so high compared to the blocks/block groups in the study area, they were shaded in, even though they had below-average concentrations.