trendspotting: helping you make sense of large information sources
TRANSCRIPT
Trendspotting:
Helping you make sense of large
information sources
Marieke Guy, QAA
Data Matters #HEDataMatters17
3rd November 2017
Your facilitator for the session…
• Founded in 1997
• Offices in England, Scotland
& Wales
• Our mission is to safeguard
standards and improve the
quality of UK higher
education, wherever
it is delivered around the
world
• http://www.qaa.ac.uk/
About QAA
To begin to….
• Help you better organise and make sense of large
information sources
• Help you carry out language-based research and
development
• Help you with market research
• Help you with business enhancement
• Help you with report planning
• Help you write better, more engaging reports
Aims for the session
“To understand is to
perceive patterns.”
Isaiah Berlin
Practical: Thinking
about order & organising

• One willing volunteer should empty their purse,
wallet or bag on the table
• Arrange and cluster the content into categories
• Label each pile
• Discuss
In small groups (5 minutes)
Presentation: Introduction
to qualitative data &
thematic analysis
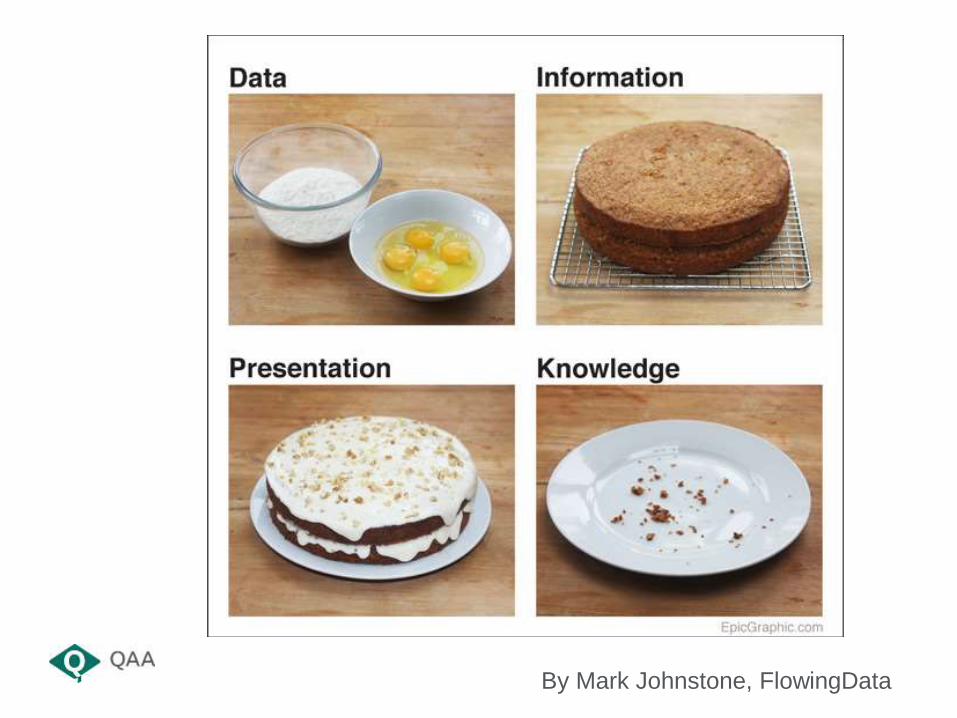
By Mark Johnstone, FlowingData
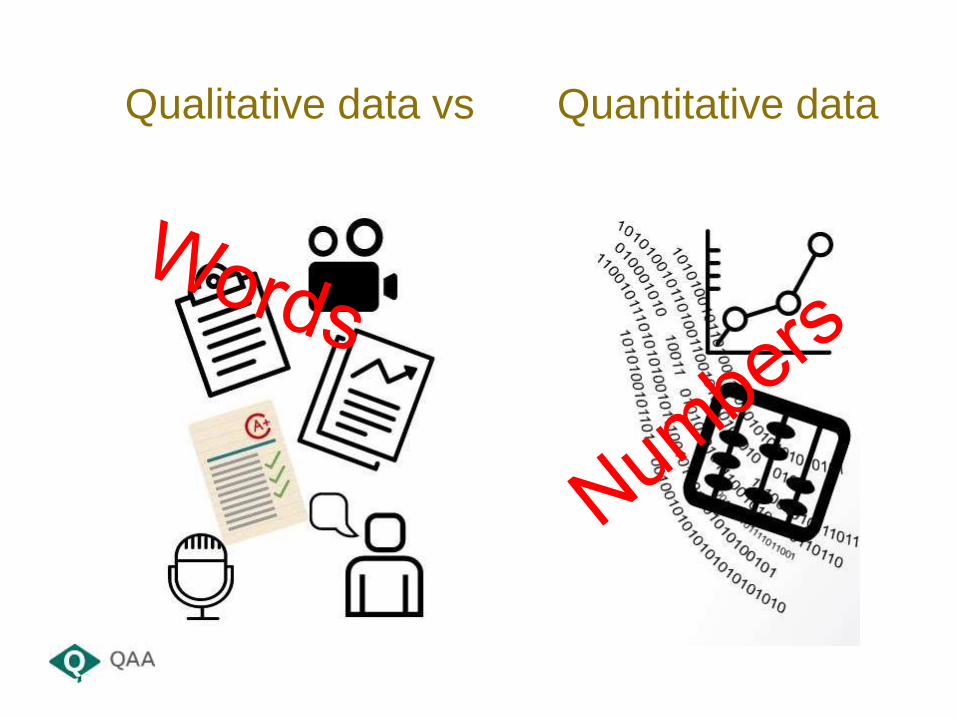
Qualitative data vs Quantitative data
• Information that is not in a numerical form i.e.
language-based data, descriptive data…
• Examples include: survey responses, diary
accounts, open-ended questionnaires,
unstructured interviews, unstructured
observations, collections of reports
• Often about interactions and relationships
• Analysis of such data tends to be more difficult
than looking at quantitative data (numbers)
Qualitative data
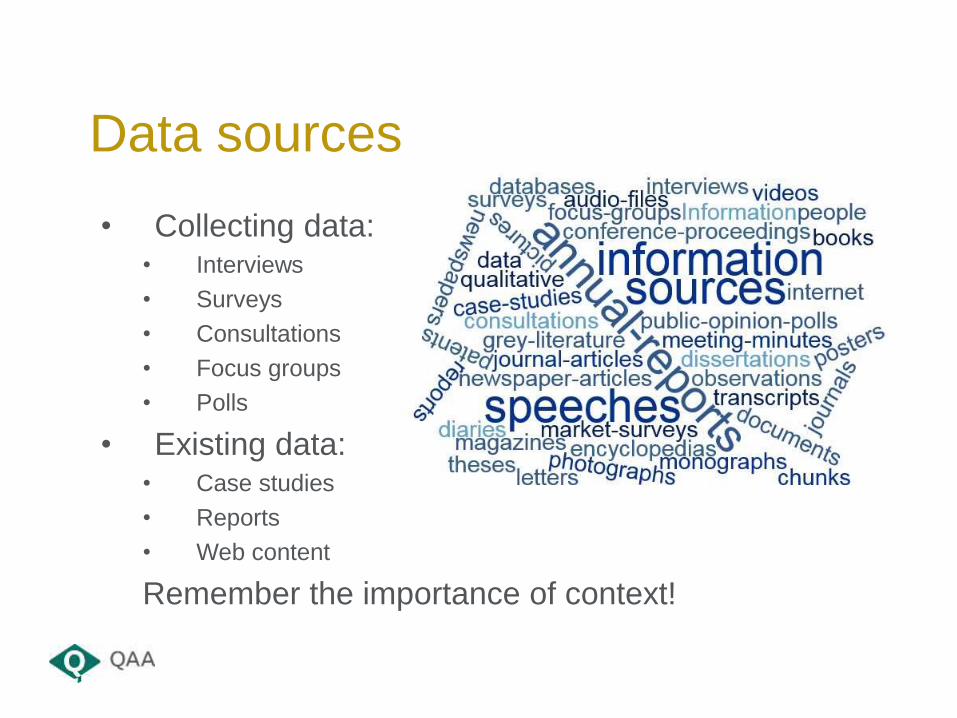
• Collecting data:• Interviews
• Surveys
• Consultations
• Focus groups
• Polls
• Existing data:• Case studies
• Reports
• Web content
Remember the importance of context!
Data sources
• To identify themes and patterns and share in the
form of reports
• To answer particular questions (or theories)
• To help inform decision making and business
planning
How is it used?
• Using data that you have access to as an
organisation to help guide decisions that improve
success
• Informed because should be based on more than
just numbers – contextualised and use staff
intelligence
• Important part of strategic planning
• Important to have data that backs up the decisions
that are being made
Data-informed decision making
• Anything more than you can easily read during the
work time available
• Perhaps more than 20 pages?
• It’s all about organisation and process
• It’s also about reproducibility and reuse
• Big data – volume, velocity, variety
• Tools, tools, tools…
What are large volumes??
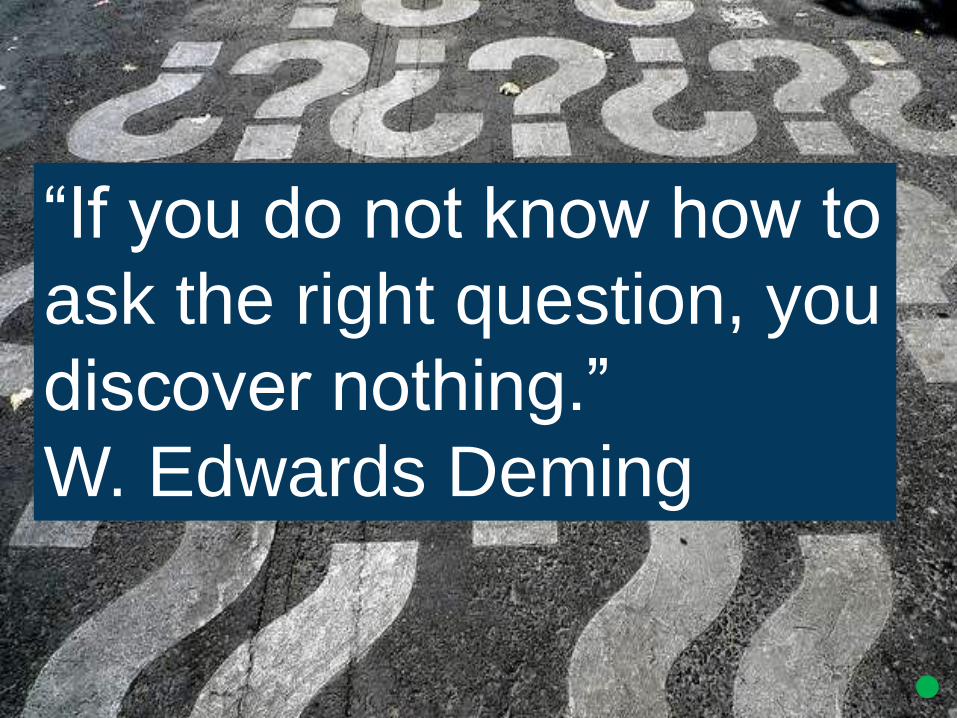
“If you do not know how to
ask the right question, you
discover nothing.”
W. Edwards Deming
• Why have you been asked to do this work?
• Who is it for? Who will see it? Where will it go?
• Is there an agenda behind it? Where are the
sensitivities?
• Who is leading on the work? What about sign off?
• What will be the output?
• What is the business enhancement purpose?
• How will success be measured?
Starting point
• What do you need to produce?
• Who is it for?
• Is it for internal or external viewing?
• When should it be delivered?
• How long should it be?
• How can it be promoted?
End point
Presentation: Carrying
out data analysis

What is a code?
“A word or short phrase that
symbolically assigns a summative,
salient, essence-capturing, and/or
evocative attribute for a portion of
language-based or visual data.” Saldaña, J (2009). The Coding Manual for Qualitative Researchers.
• Gathering all the information about a topic together
for further exploration – you code into nodes
• Nodes can be topics, people, places, sections of a
report, positive feedback etc.
• Coding is heuristic
• Different projects require different approaches
• Need for consistency across projects
• Can be carried out in cycles
• Note that a theme is the outcome of coding
Coding
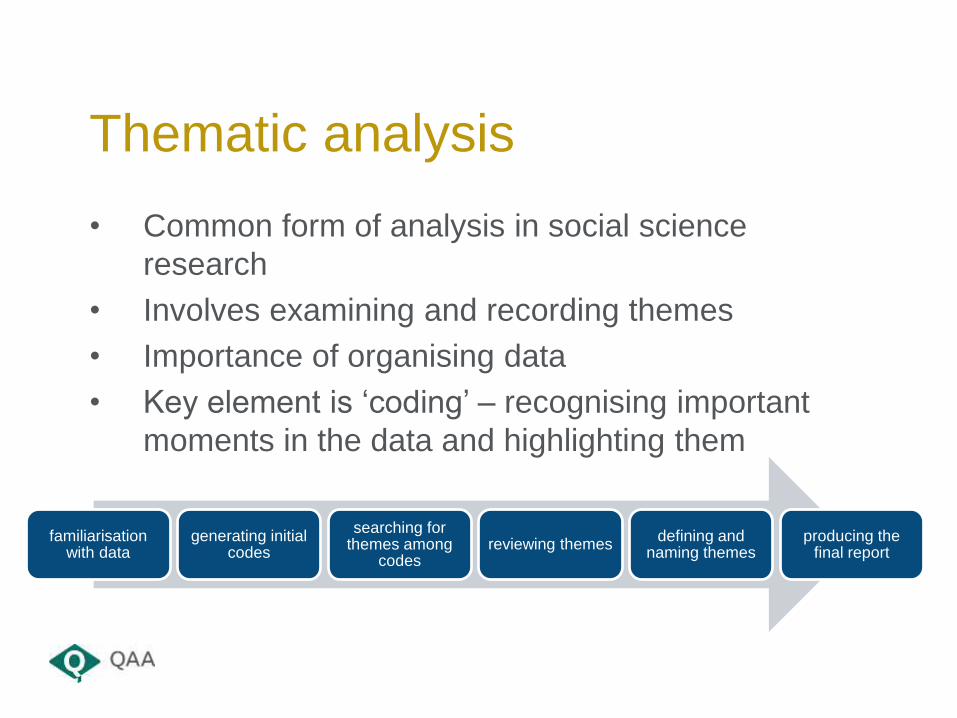
• Common form of analysis in social science
research
• Involves examining and recording themes
• Importance of organising data
• Key element is ‘coding’ – recognising important
moments in the data and highlighting them
Thematic analysis
familiarisation with data
generating initial codes
searching for themes among
codesreviewing themes
defining and naming themes
producing the final report

• Occur numerous times across the data – but
frequency not always related to importance
• Researcher judgement is key tool
• Try to avoid preconceptions
• Semantic and latent themes – look beyond what
people say – underlying ideas
• Themes and codes are different
Themes
• Trends are the general direction of travel: “our
customers are starting to prefer…”
• Patterns are series of data that repeats: “Time has
shown that customers like x”
• Start to actively look for patterns
• Look at how information is structured
• Look for relationships between different pieces of
information
• Think about cause and effect relationships
Trends and patterns
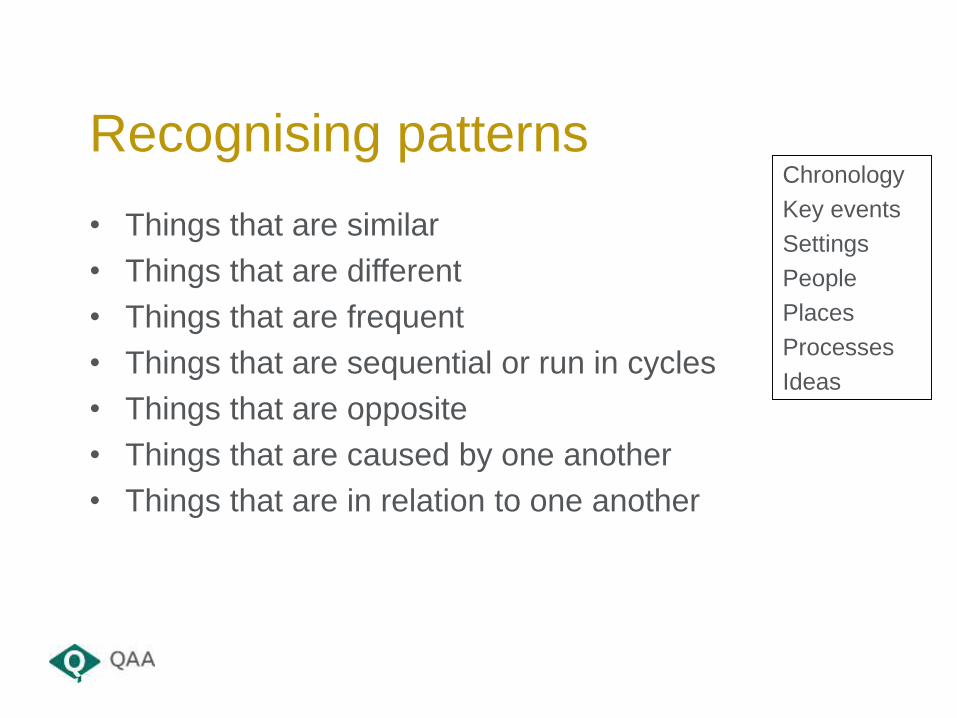
• Things that are similar
• Things that are different
• Things that are frequent
• Things that are sequential or run in cycles
• Things that are opposite
• Things that are caused by one another
• Things that are in relation to one another
Recognising patternsChronology
Key events
Settings
People
Places
Processes
Ideas
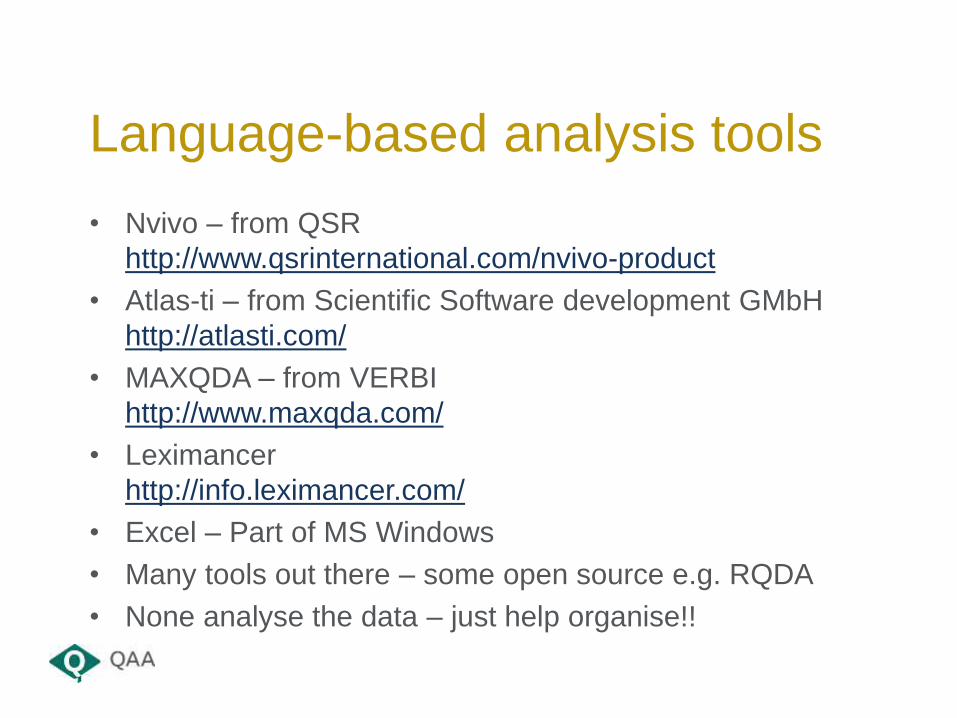
• Nvivo – from QSR
http://www.qsrinternational.com/nvivo-product
• Atlas-ti – from Scientific Software development GMbH
http://atlasti.com/
• MAXQDA – from VERBI
http://www.maxqda.com/
• Leximancer
http://info.leximancer.com/
• Excel – Part of MS Windows
• Many tools out there – some open source e.g. RQDA
• None analyse the data – just help organise!!
Language-based analysis tools
Practical: Thematic
analysis and ‘coding’

• Look at the source material given
• Decide on your coding approach
• Start to code the text using the highlighter pens
• Write a list of the codes you have identified
• Feed back to the wider group
• Compare
Individually (5 minutes)
Presentation: Outputs of
language-based analysis
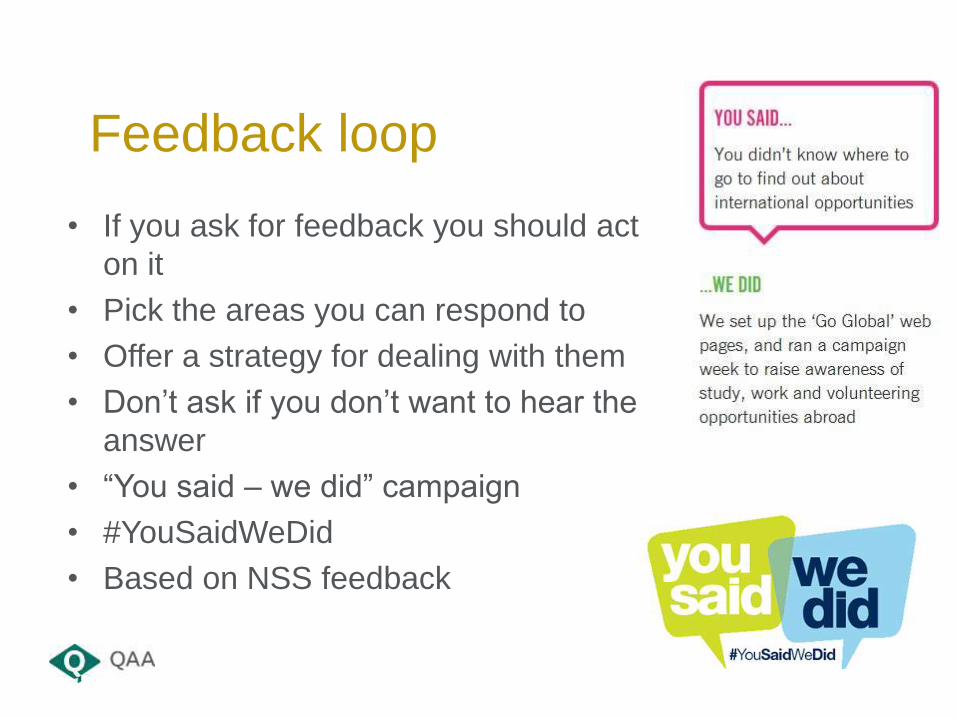
• If you ask for feedback you should act
on it
• Pick the areas you can respond to
• Offer a strategy for dealing with them
• Don’t ask if you don’t want to hear the
answer
• “You said – we did” campaign
• #YouSaidWeDid
• Based on NSS feedback
Feedback loop
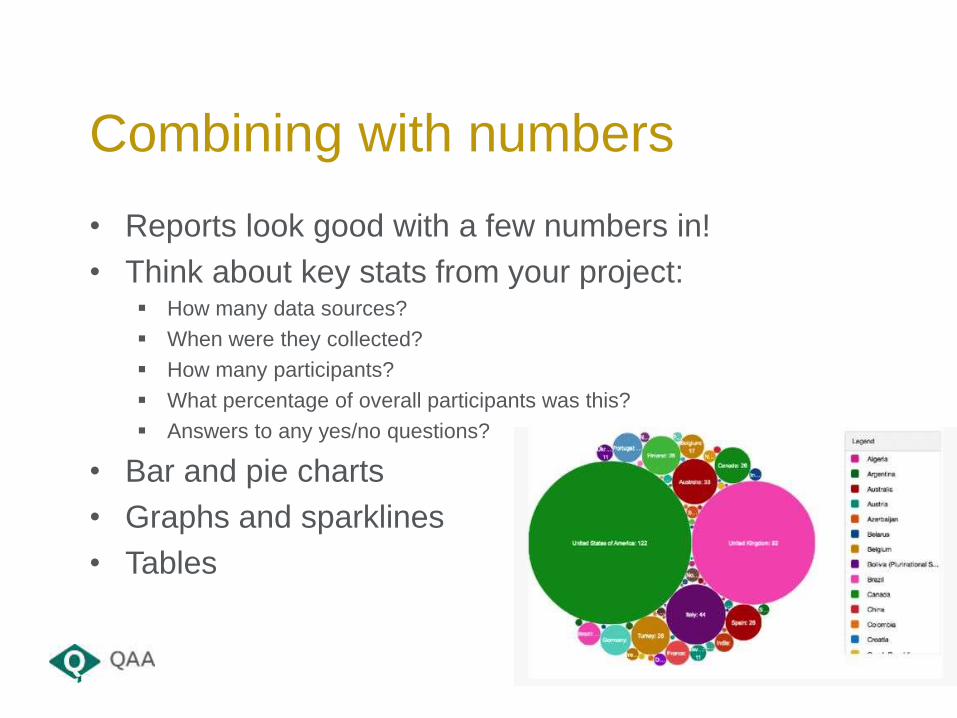
• Reports look good with a few numbers in!
• Think about key stats from your project: How many data sources?
When were they collected?
How many participants?
What percentage of overall participants was this?
Answers to any yes/no questions?
• Bar and pie charts
• Graphs and sparklines
• Tables
Combining with numbers
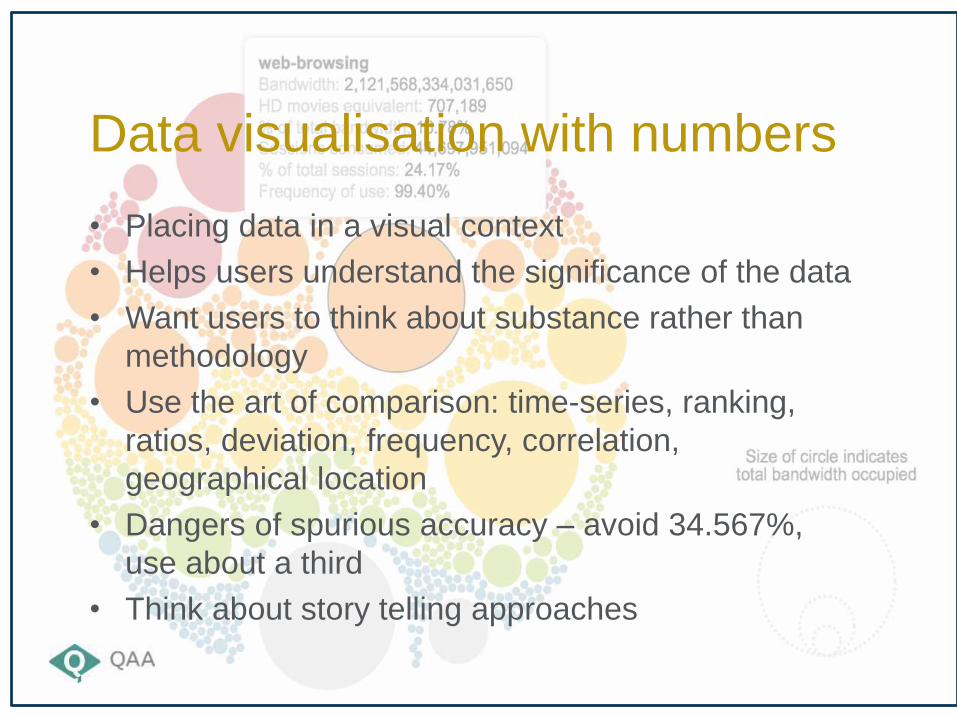
• Placing data in a visual context
• Helps users understand the significance of the data
• Want users to think about substance rather than
methodology
• Use the art of comparison: time-series, ranking,
ratios, deviation, frequency, correlation,
geographical location
• Dangers of spurious accuracy – avoid 34.567%,
use about a third
• Think about story telling approaches
Data visualisation with numbers
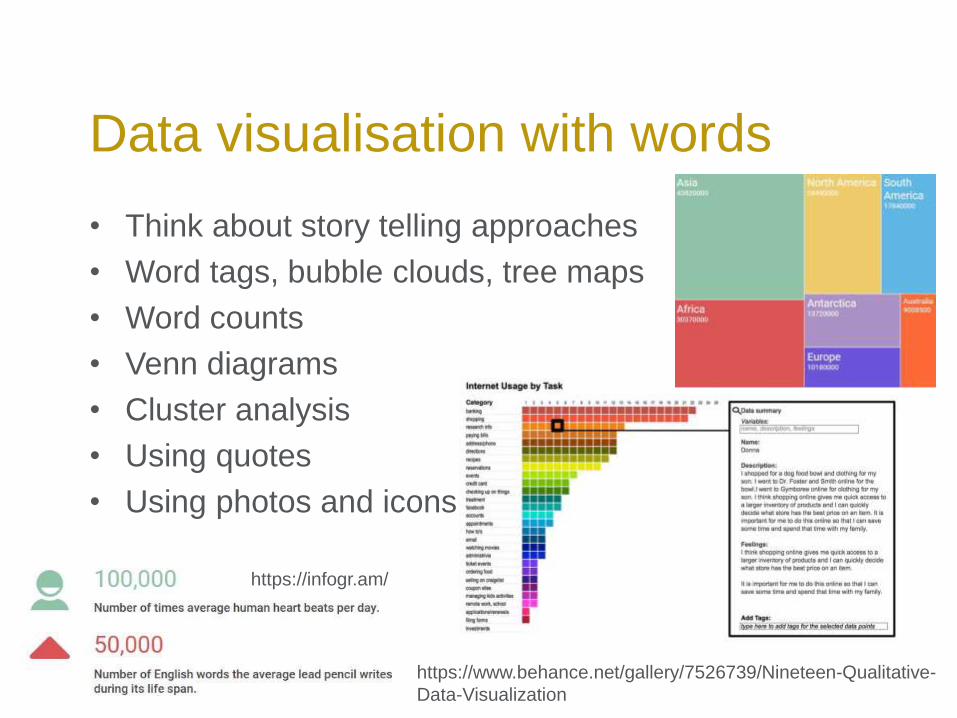
• Think about story telling approaches
• Word tags, bubble clouds, tree maps
• Word counts
• Venn diagrams
• Cluster analysis
• Using quotes
• Using photos and icons
Data visualisation with words
https://www.behance.net/gallery/7526739/Nineteen-Qualitative-
Data-Visualization
https://infogr.am/
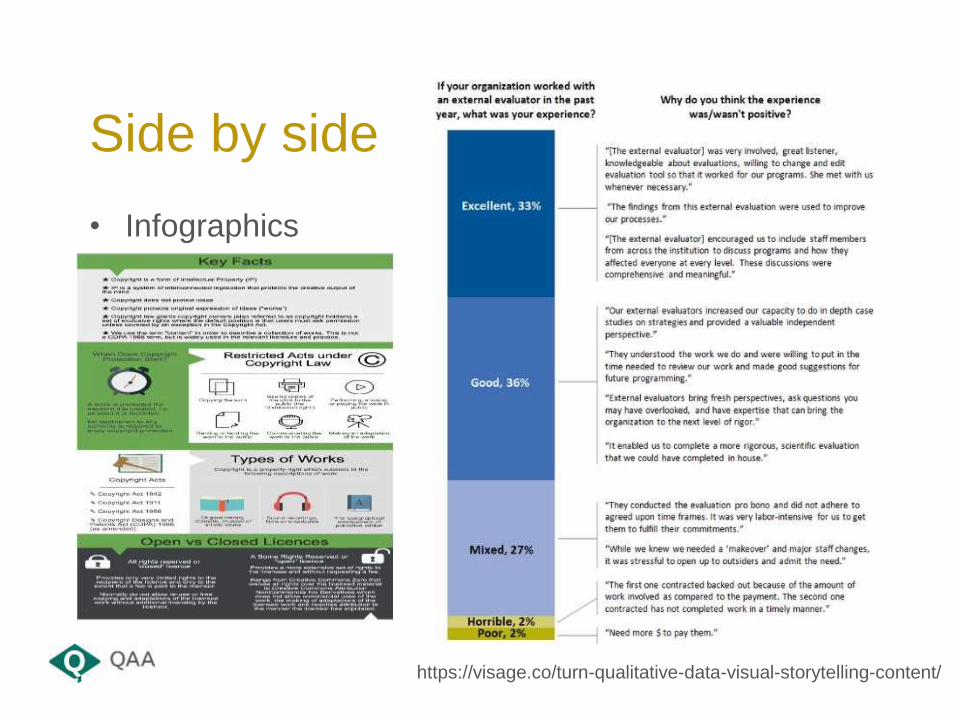
• Infographics
Side by side
https://visage.co/turn-qualitative-data-visual-storytelling-content/
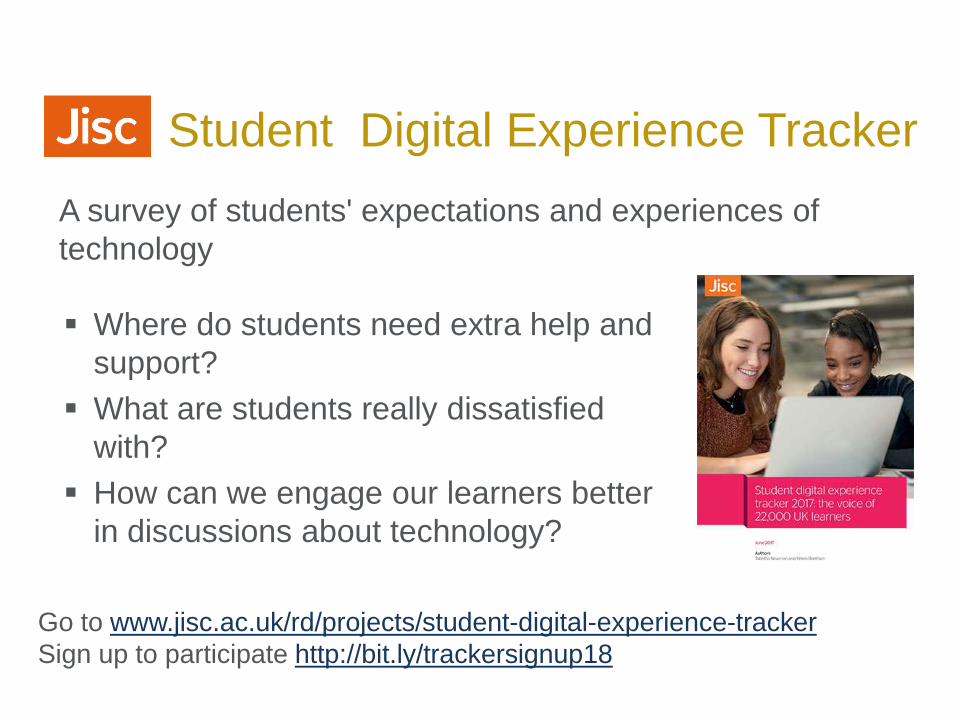
Where do students need extra help and
support?
What are students really dissatisfied
with?
How can we engage our learners better
in discussions about technology?
Jisc Student Digital Experience Tracker
Go to www.jisc.ac.uk/rd/projects/student-digital-experience-tracker
Sign up to participate http://bit.ly/trackersignup18
A survey of students' expectations and experiences of
technology

Resources
• Thematic analysis:
http://designresearchtechniques.com/casestudies/thematic-analysis/
• An introduction to Codes and Coding - .
https://www.sagepub.com/sites/default/files/upm-
binaries/24614_01_Saldana_Ch_01.pdf
• HEA PTES survey responses
https://www.heacademy.ac.uk/resource/their-own-words
• Data visualisation beyond numbers:
https://www.techchange.org/2015/05/27/data-visualization-beyond-numbers-tools-for-
qualitative-data-visualization/
• Visualising data:
http://www.visualisingdata.com/
• Thematic coding – video with Graham Gibbs
https://www.youtube.com/watch?v=B_YXR9kp1_o
• Better Evaluation – thematic coding:
http://betterevaluation.org/en/evaluation-options/thematiccoding
Useful resources

• All images from: Pixabay – CC0 - pixabay.com/
or author’s own
Or url given
Credits

qaa.ac.uk
+44 (0) 1452 557050
© The Quality Assurance Agency for Higher Education 2017
Registered charity numbers: 1062746 and SC037786
Thank you