trends since 1900 in the yield potential of italian-bred durum wheat cultivars
TRANSCRIPT

A
i‘ftgcbia©
K
1
tSho(1itpwpi1t
1d
Europ. J. Agronomy 27 (2007) 12–24
Trends since 1900 in the yield potential ofItalian-bred durum wheat cultivars
Francesco Giunta ∗, Rosella Motzo, Giovanni PrunedduDipartimento di Scienze Agronomiche e Genetica Vegetale Agraria, Facolta di Agraria, Universita di Sassari,
Via De Nicola, 07100 Sassari, Italy
Received 7 December 2006; received in revised form 8 January 2007; accepted 8 January 2007
bstract
Changes in yield potential brought about by durum wheat breeding in Italy can be used to define future breeding objectives for durum improvementn Mediterranean environments. The grain yield of 20 durum wheat cultivars, grouped according to their period of release, into ‘old’ (up to 1950),intermediate’ (1950–1973) and ‘modern’ (1974–2000), was compared in an irrigated 2-year field trial, in which two sowing dates and two nitrogenertilisation rates were imposed. The grain yield of the intermediate cultivars was 39% higher than that of those in the old group, but 18% lesshan that of the modern material. This increase was associated with earliness, kernel number, harvest index and total nitrogen uptake. Total above-round biomass and individual kernel weight, on the other hand, were largely unaffected by breeding. Sowing date did not affect the ranking ofultivars, although the more modern cultivars benefited most from the availability of more soil nitrogen. By accessing syriacum germplasm, Italian
reeders achieved a substantial improvement in the earliness and productivity of durum wheat well before the introduction of Rht genes. Thentroduction of dwarfing genes reduced lodging susceptibility, increased harvest index, and marginally delayed flowering time. Modern cultivarslso out-performed their predecessors both when sown later and when provided with suboptimal levels of N fertiliser.2007 Elsevier B.V. All rights reserved.
tttwst1gRsac
f
eywords: Breeding; Durum wheat; Yield potential
. Introduction
Durum wheat (Triticum turgidum L. var. durum) is tradi-ionally the main crop in southern peninsular Italy, Sicily andardinia. Given its major economic importance, it has a longistory of breeding in Italy, which has generated a numberf cultivars widely grown both inside and outside the countryBagnara and Scarascia Mugnozza, 1975). During the period900–1920, several landraces, most from southern Italy, butncluding some representation from other Mediterranean coun-ries, dominated the crop, which was used for both bread andasta production (De Cillis, 1927). After this time, pure linesere selected, so that almost all the cultivars released during theeriod 1920–1950 belonged to either the ‘mediterraneum typ-
cum’ or the ‘syriacum typicum’ group (Grignac, 1965; Bozzini,970). The more numerous mediterraneum types (among whichhe cultivar Senatore Cappelli was the most widespread) were∗ Corresponding author. Tel.: +39 079 229353; fax: +39 079 229222.E-mail address: [email protected] (F. Giunta).
ibcFivt
161-0301/$ – see front matter © 2007 Elsevier B.V. All rights reserved.oi:10.1016/j.eja.2007.01.009
aller and later-flowering than the syriacum ones, tended toiller less profusely and had longer awns. Italian breeders begano make intraspecific crosses around 1950, the first of whichere mediterraneum × syriacum types, which generated earlier,
horter types. A prominent example was “Capeiti 8”, a selec-ion from the cross “Senatore Cappelli” × “Eiti 6” released in955 and profusely used as a parent in subsequent breeding pro-rammes. After 1970 the focus shifted to the exploitation of theht genes, which cause a drastic reduction in stature and a con-equent increase in the harvest index. “Creso”, released in 1974nd still grown today, was the first significant semi-dwarf Italianultivar.
Comparisons between old and modern cultivars have beenrequently used to identify the physiological basis of yieldncrease. Moreover, the progressive broadening of the land raceackground carried out by CIMMYT breeders has been suc-essful in increasing the yield potential of wheat (Evans and
ischer, 1999), demonstrating the value of landraces for breed-ng. Genetic advance with respect to yield can be achievedia either the improvement of inherent yield potential and/orhe development of enhanced resistance to biotic and abiotic

. Agr
sppo1
tnw(ramwe
gptt(vv8latiw(afSce
prosa
2
2
a8daw(c5bw
cwr
aaqcI1agc
tbpgea
2
0d31iaNgc
2
a5dafeadc1
(tat
F. Giunta et al. / Europ. J
tresses. Yield potential has the particular advantage of beingredictive of varietal performance in suboptimal environments,rovided that yield reduction suffered is no more than about 50%f the level achieved under non-stressed conditions (Sayre et al.,995; Cooper et al., 1996; Blum, 2006).
Yield potential is defined as the yield of an adapted cul-ivar in an environment in which neither nutrient availabilityor water supply are limiting, and in which pests, diseases,eeds, lodging, and other stresses are effectively controlled
Evans, 1993). A narrower definition considers that lodgingesistance is one of the traits contributing to the yield potential ofcultivar (Feil, 1992; Paulsen, 1987). Accordingly, all manage-ent practices aimed at minimising lodging should be avoidedhere the contribution of yield potential to actual yield is being
valuated.In comparisons between genetically diverse cultivars, any
enotype × environment interactions will bias the estimates ofrogress in yield potential. These can best be limited by applyinghe agronomic practices used at the time of release of each cul-ivar or group of cultivars (Evans and Fischer, 1999). Fertiliserpredominantly N) rate and sowing date are the two most relevantariables. The optimal nitrogen rate for old durum wheat culti-ars grown in a Mediterranean environment ranges from 60 to0 kg N ha−1 (Deidda and Marras, 1976), whereas the improvedodging resistance of modern semi-dwarf cultivars permits thepplication of a much higher rate. Optimal sowing time is criticalo secure the yield advantage of semi-dwarf over tall cultivars;n general, an earlier sowing date favours semi-dwarf cultivars,hich respond by the development of more kernels per unit area
Anderson and Smith, 1990). In contrast, tall cultivars producehigher harvest index when sown late, since they are prevented
rom accumulating such a high vegetative biomass (Amir andinclair, 1994). Furthermore, a delay in sowing of only 2 weeksan result in a reduction of lodging incidence of up to 30% (Berryt al., 2004).
We report here an analysis of the genetic progress in yieldotential of 20 key durum wheat Italian landraces and cultivarseleased between 1900 and 1999, in order to gather informationf relevance to the planning of durum wheat breeding. The mea-urement of yield potential was carried out under various N ratesnd sowing dates.
. Materials and methods
.1. Treatments and experimental design
Experiments were carried out in 2003/2004 and 2004/2005t the experimental station in Ottava, Sardinia (Italy) (41◦N;◦E; 80 m asl). The soil at the site is a sandy-clay-loam ofepth about 0.6 m overlaid on limestone (Xerochrepts), withn average N content of 0.76‰, and a C/N ratio of 12. The soilater content was 22.4% on a weight basis at field capacity
−0.02 MPa), and 11.9% at −1.5 MPa. The climate is typi-
ally Mediterranean, with a long-term average annual rainfall of38 mm. In 2003/2004, the first sowing was made on 20 Novem-er and the second on 16 February, in 2004/2005, the first sowingas made on 5 January and the second on 17 March.fSdw
onomy 27 (2007) 12–24 13
N was applied at 60 kg ha−1 (N60) or 100 kg ha−1 (N100),hosen because N60 suits the tall lines of the ‘old’ group,hereas N100 is optimal for the other two groups in this envi-
onment.A set of 20 durum wheat accessions (Table 1), grouped
ccording to three distinct different eras of Italian breeding wasssembled. This grouping was adopted to highlight the conse-uences of breeding, above any differences between individualultivars. Group 1 includes ten entries commonly grown intaly from 1920 to 1950. All are mediterraneum types (Grignac,965). Group 2 comprises four cultivars released between 1950nd 1970; all are shorter in stature and flower earlier than theroup 1 cultivars. Group 3 contains six semi-dwarf cultivarsarrying Rht genes released post-1974.
In both seasons, two adjacent fields were assigned to thewo sowing dates and divided into three blocks. Within eachlock, N rate represented the main plots, and cultivars the sub-lots. The cultivars within each replication and main plot wererouped as in Table 1 in order to minimise the large competitionffects expected between plants of contrasting stature (Gomeznd Gomez, 1984).
.2. Management
The sowing bed was prepared by ploughing to a depth of.25 m, followed by a surface cultivation. For each sowingate, the cultivars were sown with a 8-row planter at a rate of50 seeds m−2 (groups 2 and 3) and of 200 seeds m−2 (group). Each 10 m2 plot consisted of eight 8.9 m rows, with annter-row distance of 0.14 m. Nitrogenous fertiliser was applieds urea and ammonium bi-phosphate according to the relevant
treatments. Sprinkler irrigation was given to ensure optimalrowing conditions. Weeds, pests and diseases were chemicallyontrolled.
.3. Measurements
Booting (awns emerged 1 cm beyond the flag leaf sheath) andnthesis (anthers exerted from the spikelets) were timed when0% of the ears were at this stage. Seedling emergence and theate at which the kernels reached the hard ripening stage werelso recorded. All developmental stages were expressed in theorm of days after emergence (DAE) and thermal time (TT) frommergence. Thermal time was calculated from daily minimumnd maximum temperatures at the site, according to the methodescribed by Weir et al. (1984). A base temperature of 0 ◦C washosen for both the periods before and after anthesis (Ritchie,991).
The SunScan Canopy Analysis System SS1-UM-1.05Delta-T Devices) was used to measure the interception of pho-osynthetically active radiation (PAR) by the canopy. Mean PARt the soil level was assessed by aligning the probe at right angleso the row direction and parallel to the soil surface at three dif-
erent points along the plot. At the same time, the Beam Fractionensor monitored the light incident at the canopy surface. Theerived fraction of intercepted radiation (FIR) was measuredhen flag leaf from latest-flowering cultivars was completely
14 F. Giunta et al. / Europ. J. Agronomy 27 (2007) 12–24
Table 1Landraces and cultivars included in the three varietal groups
Geographic or genetic origin Year of release
Group 1, ‘old’: landraces (before 1910) and genealogical selections (1910–1950)Calabria Calabria –Mahmoudi Tunisy –Saragolla Apulia –Taganrog Russia –Trigu murru Sardinia –Biancale or Trigu biancu Sardinia 1910–1950Triminia Sicily 1910–1950Dauno Segregating population from unknown parents 1914Senatore Cappelli Nord-african landrace Jean Retifah 1915Russello Selection from the homonim landrace 1936
Group 2, ‘intermediate’: selections from intraspecific crosses (1950–1973)Ichnusa Biancale × Capeiti 8 1968Maristella Dauno III × Capeiti 8 1968Trinakria B14 × Capeiti 8 1970Appulo (Cappelli × Grifoni 235) × Capeiti 8 1973
Group 3, ‘modern’: cultivars with Rht genes (1974–2000)Creso Cpb144 × [(Yt54-N10-B)Cp2 63 Te3] 1974Simeto Capeiti 8 × Valnova 1988Iride Altar 84 × Ares sib 1996Svevo Sel. CIMMYT × Zenit sib 1996
Dura
eatilsqltttwkos1
o1aftigufEg(of
cm
2
a(SvGNbp1qaayle
3
3
Claudio (Sel. Cimmyt ×Pietrafitta Grazia × Isa
merged, and the earliest cultivars were at the booting stage (2nd 21 April in the first and second sowing of 2004, respec-ively, and 27 April and 11 May in 2005). The amount of PARntercepted daily during the booting–anthesis period was calcu-ated by multiplying the daily values of FIR by half the daily totalolar radiation recorded at the site. The cumulative photothermaluotient (Q) for the period booting–anthesis was then calcu-ated by dividing the daily intercepted PAR by the daily meanemperature less 4.5 ◦C (Fischer, 1985). A mean Q value overhe same period was obtained by dividing the cumulative Q byhe duration of the booting–anthesis period. As suggested else-here (Savin and Slafer, 1991; Ortiz-Monasterio et al., 1994),ernel number was related to the specific developmental periodf rapid ear growth, rather than to a fixed time period, as it istrongly affected by the length of the phase (Fischer and Maurer,976).
Plant height at the tip of the ear, awns excluded, was measuredn three random plants per plot before harvest. At maturity, twolinear meter samples per plot from different rows were cut
t the ground level, air-dried and weighed. Ears were separatedrom the rest of the sample, counted and threshed. The weight ofhe grains divided by the total weight of biomass gave the harvestndex (HI). Kernel weight (KW) was estimated from two 250rain sub-samples. The above-ground dry matter (AGDM) pernit area, and the number of ears per unit surface were derivedrom the total biomass and the number of ears per 0.30 m2.ar fertility was expressed by the ratio between the number of
rains and the number of ears m−2. The number of kernels m−2KN) was calculated by multiplying ear fertility by the numberf ears m−2. Grain yield was calculated on a whole plot basis,ollowing mechanical harvesting. The kernel and straw N per-
edr1
ngo) × (IS193B × Grazia) 19981999
entages on a dry matter basis were determined by the Kjeldhalethod.
.4. Data analysis
Data from the two seasons were subjected to separatenalyses of variance, using software from SAS Institute Inc.1989), according to the model: y = sowing date (SD) + block +D × block + nitrogen rate (N) + SD × N + SD × N × block +arietal group (G) + SD × G + N × G + SD × N × G + SD × N ×× block + cultivar(group) (CG) + SD × CG + N × CG + SD ×× CG + residual. Means differing significantly, as indicated
y an F test, were separated by the Bonferroni test at 5%robability, using the appropriate error (Steel and Torrie,980). The year of varietal release was taken as a continuousuantitative variable and was used for a linear regressionnalysis to calculate the genetic gain for potential grain yieldnd other traits. The year 1910 was assigned arbitrarily as theear of release for the landraces, while 1920 was assigned to theandrace derivatives “Biancale” and “Triminia”, since which noxact year of their release is available from the literature.
. Results and discussion
.1. Thermo-photoperiodic conditions
Due to irrigation, the most important environmental differ-
nces distinguishing the two sowing dates in both seasons wereaylength and temperature. The daylengths at emergence were,espectively, 10.4 and 10.8 h for the first sowings, and 12.3 and3.4 h for the second. The mean sowing–anthesis periods (first
F. Giunta et al. / Europ. J. Agronomy 27 (2007) 12–24 15
Fig. 1. Rainfall (bars), maximum (solid symbols) and minimum (empty sym-bao
sa(1mwsmstra
3
aildsp3gaddisbaM
Frs
da(
ssdcsoeRhJR1toIl2s
3
B43giaT(
ols) temperatures and solar radiation (line) from 1 October to 31 July in 2004nd 2005. Rainfall values are sums, and temperature and radiation values means,ver 10-day periods. Arrows indicate sowing dates.
owing) were similar with respect to both minimum (7.7 in 2004nd 7.4 ◦C in 2005) and maximum temperatures (15.3, 15.9 ◦C)Fig. 1), while for the second sowing, both the minima (8.7,1.2 ◦C) and maxima (17.2, 21.0 ◦C) were higher in 2005. Theean minimum temperatures over the anthesis–maturity periodsere 12.5 ◦C in 2004 and 15.7 ◦C in 2005, and increased in the
econd sowing by, respectively, 2.3 and 2.4 ◦C. Similarly, theean temperature maxima were higher in 2005 (26.5 ◦C ver-
us 22.3 ◦C in the first sowing, and 29.4 ◦C versus 25.7 ◦C inhe second). The maximum absolute temperatures in this periodeached 30.3 and 30.6 ◦C in the first and second 2004 sowings,nd 32.0 and 39.6 ◦C in the 2005 ones.
.2. Development
Mean flowering date was 29 April in the first sowing of 2004,nd 10–11 May in the first sowing of 2005. For the second sow-ng, flowering was at the end of May in both years. Thus, theength of the emergence–anthesis period ranged from 150 to 107ays (2004 and 2005 first sowings) to 82 and 59 days (secondowings) (Table 2). In the first sowing in both years, floweringroceeded from the earliest group 2 cultivars, to those in group, and finally to those in group 1. The differences between theroups were reduced from the second sowing in both years, whengain the group 1 cultivars were the last to flower, but the anthesisates of accessions in groups 2 and 3 were similar. These sameifferences were retained when the flowering time was expressedn TT, and are the result of the interaction between variable sen-
itivity to photoperiod and changes in the photoperiod imposedy manipulation of the sowing date. The late-flowering char-cteristic of group 1 cultivars was previously documented byotzo et al. (2004). The same genetic basis underlies the larger3Tol
ig. 2. Length of the emergence–anthesis period as a function of the year ofelease of individual cultivars. White symbols, first sowing; black symbols,econd sowing. Data are means over the two seasons.
ifferences among groups manifested in the first 2004 sowing,s this was associated with the shortest daylength at emergence10.4 h).
The between group variation in flowering time resulted in aignificant negative relationship between thermal time to anthe-is and the year of release of individual cultivars at each sowingate, in spite of the later-flowering behaviour of the group 3ultivars “Creso” (at both sowing dates) and “Claudio” (secondowing only), whose flowering times were comparable to thosef group 1 members (Fig. 2). A significant shortening of flow-ring time was therefore achieved before the introgression ofht genes. Italian bread wheats (T. aestivum L.), on the otherand, only experienced a substantial gain in earliness when theapanese semi-dwarf cultivar “Akagomugi”, carrying Rht8 andht9, was widely used as a crossing parent (Canevara et al.,994). Note that, from the conventional sowing date (typified byhe first sowings in the present experiments), the introgressionf Rht genes appears to have delayed flowering time (Table 2).n both years and sowing dates, the group 1 cultivars were theast to reach maturity (by 7 and 4 days, respectively from the004 and 2005 first sowings; by 5 and 3 days from the secondowings). No effect of N treatment on phenology was detectable.
.3. Grain yield
Grain yield was higher from the first sowing in both years.oth produced similar grain yields (first sowing: respectively,.5 and 4.4 t ha−1 in 2004 and 2005; second sowing 3.7 and.8 t ha−1). Group 3 cultivars produced 65% more grain thanroup 1 ones in 2004, and 57% more in 2005, with no detectablenteraction with sowing date (Table 3). Lodging occurred afternthesis and was confined to the first sowing in each season.hough negligible among group 3 cultivars, it affected 64%
2004) and 24% (2005) of plants belonging to group 1, and
1% (2004) of plants belonging to group 2 varieties (Fig. 3).hese differences in lodging incidence might have impactedn yield potential, as about 0.5% of the yield potential can beost for each day of the grain filling period that a bread wheat
16 F. Giunta et al. / Europ. J. Agronomy 27 (2007) 12–24
Table 2Developmental stages: booting (BOOT), anthesis (ANTH) and ripening (MAT) expressed in days after emergence (DAE) and in thermal time (TT) from emergence,for the various treatments (G, Group; SD, Sowing Date)
BOOT (DAE) ANTH (DAE) MAT (DAE) BOOT (TT) ANTH (TT) MAT (TT)
Groupa
2004 *** *** *** *** *** ***Old 110ab 121a 160a 982a 1130a 1709aIntermediate 97c 110c 153b 846c 991c 1607bModern 99b 112b 153b 862b 1011b 1603b
2005 *** *** *** *** *** ***Old 77a 86a 121a 772a 913a 1491aIntermediate 70b 80c 118b 677b 820c 1435bModern 71b 81b 117b 684b 835b 1427b
Sowing date × group2004 *** *** * *** *** **
FirstOld 144a 156a 199a 1185a 1345a 1949aIntermediate 127c 142c 192b 1008c 1181c 1830bModern 129b 145b 192b 1038b 1213b 1836b
SecondOld 76a 86a 120a 780a 916a 1468aIntermediate 68b 78b 115b 684b 802b 1385bModern 69b 78b 114b 685b 808b 1369b
2005 ns *** ns ns *** nsFirst
Old 100 110a 147 853 1006a 1610Intermediate 94 103c 143 762 897c 1547Modern 94 104b 143 769 916b 1539
SecondOld 53 61a 95 691 819a 1371Intermediate 47 57b 92 593 742b 1324Modern 47 57b 92 599 754b 1315
Cultivar (G)2004 *** *** *** *** *** ***2005 *** *** *** *** *** ***
Cultivar (G) × SD2004 *** *** *** *** *** ***
*
0.05from
csot2l(wsdwt
atayi
aiN(imAdctofiwy
2005 *** ***
a ***, significant at P ≤ 0.001; **, significant at P ≤ 0.01; *, significant at P ≤b Means within each group sharing the same letter do not differ significantly
rop is lodged flat (Stapper and Fischer, 1990). In spite of aignificant cultivar × sowing date interaction in both years, andf the differential impact of lodging on the varietal groups inhe two sowings, the mean increase in grain yield per year of3.9 kg ha−1 for the first sowing was not significantly (P < 0.05)ess than that of 27.3 kg ha−1 recorded for the second sowingFig. 4a). The greatest grain yield in group 1 was for “Biancale”,hich produced 4.4 t ha−1 from the first sowing and 3.4 from the
econd. “Simeto” was the highest yielding group 3 cultivar, pro-ucing 6.1 t ha−1 from the first sowing and 5.5 from the second,hereas neither “Creso” nor “Svevo” yielded significantly better
han the group 2 entries.The highest grain yield was expressed by the group 3 entries,
nd the lowest by the group 1 ones at both levels of N fer-
ilisation, but they benefited differentially when provided withhigher supply of N (Table 3). In 2004, N100 only enhancedield in group 3 entries (from 5.1 to 5.6 t ha−1), whereas in 2005,t increased yield by 0.9 t ha−1 (group 3), 0.7 t ha−1 (group 2),
hcwc
** *** *** ***
; ns, not significant at the analysis of variance.one another (Bonferroni test at P ≤ 0.05).
nd 0.5 t ha−1 (group 1). As a consequence, the rate of increasen grain yield per year since release of 29.1 ± 0.02 kg ha−1 at100 was significantly higher than at N60 (22.2 ± 0.02 kg ha−1)
Fig. 4b). This result concurs with Austin et al.’s (1993) find-ng that modern bread wheat cultivars benefit proportionately
ore from high fertility than do older genotypes. Note that inustin et al.’s experiments, the benefit was apparent indepen-ently of whether or not the lodging of the older materials wasontrolled by physical support of the plants. On the other hand,he more recently released cultivars performed better than thelder ones also under condition of lower N availability, con-rming the observations of Brancourt-Hulmel et al. (2003),ho showed that some modern bread wheat cultivars can outield older ones even under low input conditions. On the other
and, Canevara et al. (1994) could not demonstrate any signifi-ant advantage of modern bread wheat cultivars over landraces,hen the materials were grown under primitive husbandryonditions.

F. Giunta et al. / Europ. J. Agronomy 27 (2007) 12–24 17
Table 3Grain and straw yield, plant height (awns excluded) and yield components for the various treatments (G, Group; SD, Sowing Date)
Grain yield(t ha−1)
Straw(t ha−1)
AGDM(t ha−1)
HI Kernelweight (mg)
Ears m−2
(n)Kernels ear−1
(n)Kernels m−2
(n)Plant height(cm)
Groupa
2004 *** *** ** *** *** *** *** *** ***Old 3.2cb 10.1a 13.4a 0.25c 46.0b 289b 24.8b 7148b 141aIntermediate 4.2b 8.1b 12.4b 0.35b 44.5c 354a 27.4a 9663a 105bModern 5.3a 8.4b 13.7a 0.39a 49.3a 348a 28.0a 9752a 83c
2005 *** *** ** *** *** *** ns *** ***Old 3.3c 8.4a 11.7b 0.28c 48.7b 245b 23.6 5794c 131aIntermediate 4.7b 8.0ab 12.7a 0.38b 48.9b 330a 22.8 7523b 97bModern 5.2a 7.4b 12.6a 0.42a 51.8a 348a 23.4 8135a 74c
Sowing date × group2004 ns ** ** ** ** ns ** ns ***
FirstOld 3.7 12.2a 16.0a 0.24c 47.8b 281 26.4a 7357 142aIntermediate 4.4 9.3b 13.7b 0.33b 43.4c 354 26.9a 9511 112bModern 5.7 9.7b 15.3a 0.37a 50.5a 356 27.2a 9634 90c
SecondOld 2.7 8.1a 10.8b 0.25c 44.7b 296 23.7b 6991 140aIntermediate 4.1 7.0b 11.1ab 0.37b 45.6ab 353 27.8a 9815 98bModern 5.0 7.1b 12.1a 0.41a 48.0a 341 28.8a 9869 76c
2005 ns ns ns ns ** ns * ns **First
Old 3.6 9.5 13.1 0.28 50.5b 241 25.2a 6024 139aIntermediate 5.0 8.9 13.9 0.37 50.2b 332 22.8b 7556 102bModern 5.5 8.2 13.7 0.40 54.3a 349 23.0b 8078 78c
SecondOld 2.9 7.4 10.3 0.28 47.1b 249 22.1b 5581 124aIntermediate 4.4 7.0 11.5 0.39 47.7b 327 22.8ab 7489 92bModern 5.0 6.6 11.6 0.43 49.0a 348 23.9a 8199 70c
Nitrogen rate2004 ns ** * *** ns ** ns ns ns
60 4.0 8.8 12.8 0.32 47.2 307 26.6 8217 116100 4.1 9.7 13.8 0.30 46.3 334 26.2 8810 115
2005 ** * ** ns *** * ** ** *60 3.8 7.5 11.3 0.34 50.8 285 21.8 6208 106100 4.5 8.5 13.0 0.34 48.7 301 25.0 7595 109
Nitrogen rate × group2004 * ns ns * ns ns *** * ns
Old60 3.3a 9.8 13.2 0.26a 46.9 279 25.9a 7177a 142100 3.1a 10.4 13.5 0.23b 45.2 299 23.8b 7121a 141
Intermediate60 4.2a 7.4 11.6 0.36a 44.4 335 28.3a 9459a 104100 4.3a 8.9 13.2 0.33b 44.5 372 26.5a 9867a 106
Modern60 5.1b 7.8 12.9 0.39a 49.3 334 26.4b 8863b 82100 5.6a 9.0 14.5 0.39a 49.2 363 29.6a 10640a 83
2005 ns ns ns ns *** ns ns ns nsOld
60 3.0 7.9 10.9 0.28 50.6a 230 22.3 5039 130100 3.5 9.0 12.5 0.28 46.9b 261 24.9 6550 132
Intermediate60 4.4 7.4 11.8 0.38 49.1a 327 21.4 6965 95100 5.1 8.5 13.6 0.38 48.8a 332 24.2 8081 99
Modern60 4.8 7.1 11.8 0.41 52.2a 348 21.4 7425 72100 5.7 7.7 13.4 0.43 51.4a 349 25.6 8888 76
18 F. Giunta et al. / Europ. J. Agronomy 27 (2007) 12–24
Table 3 (Continued )
Grain yield(t ha−1)
Straw(t ha−1)
AGDM(t ha−1)
HI Kernelweight (mg)
Ears m−2
(n)Kernels ear−1
(n)Kernels m−2
(n)Plant height(cm)
Cultivar (G)2004 *** *** *** *** *** *** *** *** ***2005 *** *** * *** *** *** *** *** ***
Cultivar (G) × SD2004 *** *** *** *** *** ns ns ns ***2005 *** ns ns ns *** ns ** ns ns
Cultivar (G) × N2004 ns ns ns ns ns ns ns ns **
0.05from
3
sf2ctwdgtIgc3mi
F2w
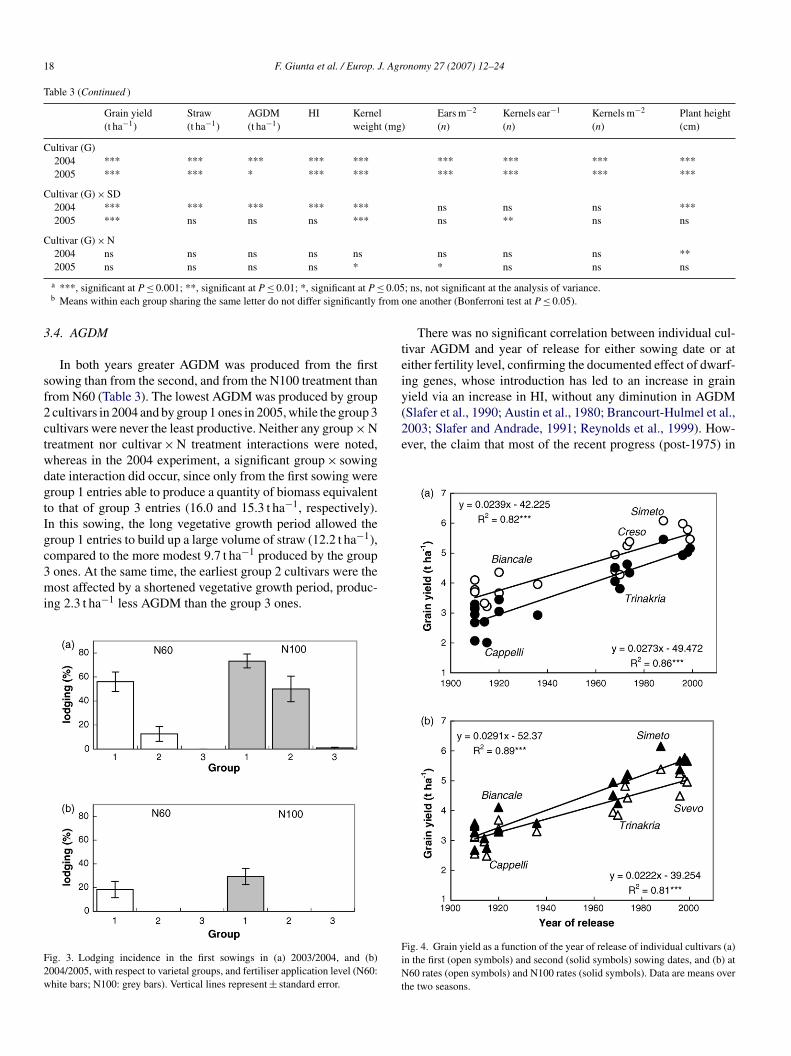
teiy(Slafer et al., 1990; Austin et al., 1980; Brancourt-Hulmel et al.,2003; Slafer and Andrade, 1991; Reynolds et al., 1999). How-ever, the claim that most of the recent progress (post-1975) in
2005 ns ns ns ns *
a ***, significant at P ≤ 0.001; **, significant at P ≤ 0.01; *, significant at P ≤b Means within each group sharing the same letter do not differ significantly
.4. AGDM
In both years greater AGDM was produced from the firstowing than from the second, and from the N100 treatment thanrom N60 (Table 3). The lowest AGDM was produced by groupcultivars in 2004 and by group 1 ones in 2005, while the group 3ultivars were never the least productive. Neither any group × Nreatment nor cultivar × N treatment interactions were noted,hereas in the 2004 experiment, a significant group × sowingate interaction did occur, since only from the first sowing wereroup 1 entries able to produce a quantity of biomass equivalento that of group 3 entries (16.0 and 15.3 t ha−1, respectively).n this sowing, the long vegetative growth period allowed theroup 1 entries to build up a large volume of straw (12.2 t ha−1),
−1
ompared to the more modest 9.7 t ha produced by the groupones. At the same time, the earliest group 2 cultivars were theost affected by a shortened vegetative growth period, produc-ng 2.3 t ha−1 less AGDM than the group 3 ones.
ig. 3. Lodging incidence in the first sowings in (a) 2003/2004, and (b)004/2005, with respect to varietal groups, and fertiliser application level (N60:hite bars; N100: grey bars). Vertical lines represent ± standard error.
FiNt
* ns ns ns
; ns, not significant at the analysis of variance.one another (Bonferroni test at P ≤ 0.05).
There was no significant correlation between individual cul-ivar AGDM and year of release for either sowing date or atither fertility level, confirming the documented effect of dwarf-ng genes, whose introduction has led to an increase in grainield via an increase in HI, without any diminution in AGDM
ig. 4. Grain yield as a function of the year of release of individual cultivars (a)n the first (open symbols) and second (solid symbols) sowing dates, and (b) at60 rates (open symbols) and N100 rates (solid symbols). Data are means over
he two seasons.

. Agr
dfb
3
p(1(biibtRalfb
paa“oopwdoewr00t
Fcr
gvr(A
atbt
3
oeiMiaAbyrqntttb(Iik
F. Giunta et al. / Europ. J
urum wheat yield has arisen from increased biomass rather thanrom increased HI (Waddington et al., 1987) was not supportedy the performance of the group 3 cultivars.
.5. Harvest index
A steady increase in HI was obtained in both years in therogression from the old to intermediate to modern cultivarsTable 3). The increase was most pronounced between groupsand 2 (by 10% in both years), than between groups 2 and 3
4% in both years). Thus, a notable increase in HI was achievedefore the introgression of Rht genes, thanks to the reductionn height introduced through crossing mediterraneum with syr-acum germplasm. The height of group 2 materials was reducedy more than 30 cm compared to the group 1 materials. A fur-her reduction of about 20 cm was attained by the introduction ofht genes (Table 3). On the other hand, the reduction in heightnd increase in HI of group 2 cultivars could not overcome theirodging susceptibility, the incidence of which was lower thanor group 1 cultivars, but higher than that of modern cultivars atoth nitrogen treatments (Fig. 3).
At the cultivar level, the pattern in HI translated into a strong,ositive correlation between HI and year of release (Fig. 5),nd into a strong, negative correlation between plant heightnd HI (R2 = 0.90***). Only the HI’s of “Iride”, “Claudio” andSimeto” were above 0.40 and significantly different from thosef the group 2 cultivars. The estimated average increase in HIf 0.19 ± 0.017% per year is comparable to the 0.2% increaseer year calculated by Brancourt-Hulmel et al. (2003) in breadheat cultivars released in France from 1946 to 1992. Sowingate did not affect either this general pattern in HI, nor the ratef increase with year of release, whereas the nitrogen treatmentxerted differential effects on the groups, particularly in 2004,hen the greater amount of available N at N100 significantly
educed group 1 mean HI from 0.26 to 0.23, and group 2 from.36 to 0.33, whereas group 3 mean HI remained constant at.39 across both N treatments. In 2005, on the other hand, the Nreatment did not affect groups 1 and 2 HI’s, whereas the HI of
ig. 5. Harvest index as a function of the year of release of individualultivars. Data are means over all treatments and seasons. Vertical lines rep-esent ± standard error.
tnbs22atw
2Ned
3
gdiap
onomy 27 (2007) 12–24 19
roup 3 cultivars increased from 0.41 to 0.43. Individual culti-ar variation in HI explained 96% of the variation in grain yield,eminiscent of its strong influence on bread wheat grain yieldAustin et al., 1980; Brancourt-Hulmel et al., 2003; Slafer andndrade, 1991; Reynolds et al., 1999; Sayre et al., 1997).In order to understand whether these observed differences
mong group HI’s were a consequence of their differing abilityo accumulate dry matter in single grains, or whether the majorasis was in the control of the number of grains set, these tworaits were analysed and correlated with HI.
.6. Kernel weight
There was no correlation between kernel weight and yearf release, as a result of the wide variation present withinach group. Nevertheless, group 3 cultivar grains were heav-er than those from the other two groups in both years (Table 4).
ean kernel weight within group 1 ranged from 33 mg (“Trim-nia”) to 54–55 mg (“Mahmoudi”, “Calabria” and “Cappelli”),nd within group 3 from 41 mg (“Iride”) to 57 mg (“Simeto”).lthough kernel weight has rarely been under direct selection,reeders have tended to prefer larger grains when selecting forield, not because of any correlation of grain size with yield, butather because small grains are associated with lesser end-useuality. The variation in kernel weight at both sowing dates wasot associated with the number of kernels m−2 (KN), indicatinghat the total available assimilate was large enough to supplyhe larger kernels characteristic of modern cultivars. Althoughhese two yield components (KN and kernel size) have frequentlyeen reported to physiologically compensate for one anotherSlafer and Andrade, 1991; Fischer, 1993), it appears that thetalian durum wheat breeders have been successful in generat-ng cultivars having both a greater number as well as heavierernels (Fischer and HilleRisLambers, 1978). Note, however,hat McNeal et al. (1978) found that wheat kernel weight wasot negatively affected by selection for higher ear fertility, whenoth characters were simultaneously targeted. In the first 2004owing, the lowest kernel weight (43 mg) was recorded in group, whereas no difference was observed between groups 1 andaverages from the other sowings. Irrigation, and hence the
bsence of water stress, probably served to avoid any differen-ial effect of water stress between intermediate and old cultivars,hich generally differ significantly in their phenology.No effect of N treatment on kernel weight was recorded in
004, whereas in 2005, kernel weight was less at N100 than at60 only in group 1 cultivars. Finally, no relationship could be
stablished between kernel weight and HI from either sowingate, or from either N treatment.
.7. Kernel number m−2 (KN)
In both years, group 1 cultivars exhibited the lowest, androup 3 ones the highest KN. The KN of group 2 entries was not
ifferent from that of those in group 3 in 2004, but was lowern 2005 (Table 3). As a consequence, KN increased per yeart 35.3 ± 7.3 m−2, substantially lower than the 155 grains m−2er year estimated by Brancourt-Hulmel et al. (2003) for bread

20 F. Giunta et al. / Europ. J. Agronomy 27 (2007) 12–24
Table 4Straw and grain nitrogen percentage and amount per unit area for the various treatments (G, Group; SD, Sowing Date)
Total nitrogen (kg ha−1) Nitrogen in straw Nitrogen in grains
% kg ha−1 % kg ha−1
Groupa
2004 *** ns * *** ***Old 103cb 0.30 31.1a 2.23a 71.7cIntermediate 116b 0.31 25.9b 2.15b 91.0bModern 131a 0.31 27.0ab 1.93c 103.4a
2005 *** ns ns *** ***Old 101c 0.34 28.6 2.21a 71.9cIntermediate 132b 0.36 28.5 2.20ab 103.7bModern 141a 0.37 27.6 2.18b 113.8a
Sowing date × group2004 ns ns ns ns ns
FirstOld 117 0.28 35.1 2.21 82.4Intermediate 121 0.29 27.4 2.16 94.6Modern 142 0.31 30.8 1.94 110.8
SecondOld 89 0.32 27.2 2.25 61.3Intermediate 112 0.34 24.5 2.14 87.4Modern 120 0.32 23.0 1.92 96.2
2005 ns ns ns *** nsFirst
Old 107 0.29 28.4 2.19ab 78.3Intermediate 139 0.31 28.1 2.20a 110.6Modern 147 0.32 27.0 2.18b 120.0
SecondOld 94 0.39 28.9 2.24a 65.4Intermediate 126 0.40 28.8 2.19b 96.9Modern 136 0.42 28.3 2.18b 107.6
Nitrogen rate2004 * ** ** * ns
60 107 0.26 24.1 2.08 83.0100 121 0.35 33.6 2.17 87.2
2005 * ns ns *** **60 111 0.35 26.3 2.22 84.6100 128 0.36 30.3 2.18 97.1
Nitrogen rate × group2004 ns ns ns ns *
Old60 100 0.26 27.4 2.18 72.8a100 105 0.34 35.0 2.28 70.5a
Intermediate60 109 0.27 20.6 2.11 88.1a100 124 0.36 31.5 2.19 93.8a
Modern60 118 0.26 21.0 1.90 96.8b100 143 0.37 32.7 1.96 109.8a
2005 ns ns ns ** nsOld
60 93 0.33 25.7 2.23a 67.3100 108 0.35 31.6 2.20b 76.5
Intermediate60 125 0.37 27.5 2.23a 97.6100 139 0.35 29.4 2.16b 109.9
Modern60 131 0.36 26.5 2.21a 104.8100 152 0.37 28.8 2.15b 122.9

F. Giunta et al. / Europ. J. Agronomy 27 (2007) 12–24 21
Table 4 (Continued )
Total nitrogen (kg ha−1) Nitrogen in straw Nitrogen in grains
% kg ha−1 % kg ha−1
Cultivar (G)2004 *** ns ns *** ***2005 *** ** *** *** ***
Cultivar (G) × SD2004 ** ns * ns ***2005 ns ns ns ns ***
Cultivar (G) × N2004 ns ns ns ns ns2005 ns ns ns *** ns
0.05from o
wywitafpa2ab
aaKqtiai(7ens2ogirkw1cQ
e“wd
awbya
3
tDl2lwcultivar means of N accumulation against year of release ledto an estimated increment of 44 ± 0.05 kg ha−1 per year in Naccumulation (Fig. 8). Among the group 1 cultivars, “Tagan-rog” and “Cappelli” accumulated the least N, while among the
Fig. 6. Kernel number m−2 as a function of the average photothermal quo-
a ***, significant at P ≤ 0.001; **, significant at P ≤ 0.01; *, significant at P ≤b Means within each group sharing the same letter do not differ significantly
heat. No sowing date × group interaction was present in eitherear. The more nitrogen available, on the other hand, the greateras KN in all varietal groups in 2005, but only in group 3 entries
n 2004. Therefore, the ability of group 3 cultivars to maintainhe same HI at both N60 and N100 in 2004 was probably guar-nteed by an increase in their KN, which in turn was derivedrom an improved level of ear fertility (from 26.4 to 29.6 grainser ear), in spite of a simultaneous increase in ear density ofbout 30 ears m−2. In group 1 cultivars, on the other hand, the0 ears m−2 increase induced by a higher N regime negativelyffected both kernel weight and ear fertility, which diminishedy about 2 grains per ear.
Given the marked differences in phenology among groups,nd the profound impact of the environmental conditions beforenthesis in determining KN (Fischer, 1985), the observed lowerN of group 1 cultivars was hypothesised as being a conse-uence of their late flowering. The photothermal quotient (Q) forhe booting–anthesis period was calculated, using the fraction ofntercepted photosynthetically active radiation (FRI) measuredround the flag leaf stage. Groups did not differ from one anothern their FRI at this stage, with means of 0.86 (2004) and 0.822005). FRI was affected by N level, with values boosted by% in both years at N100. Variation in Q induced by the differ-nt phenology of the three groups within each sowing date wasegligible, ranging from 0.2 MJ m−2 day−1 ◦C−1 in the secondowing of 2004 to 0.6 MJ m−2 day−1 ◦C−1 in the first sowing of005. Fig. 6 depicts the relationship between KN and Q devel-ped by Fischer (1985) for bread wheat cultivars carrying Rhtenes. The relationship holds for the group 3 and 2 cultivars, butn the group 1 cultivars, a less ‘efficient’ use of environmentalesources available pre-anthesis leads to the production of fewerernels m−2 at similar Q values. Considering semi-dwarf breadheat cultivars carrying Rht1 or Rht2 genes released between962 and 1988, Sayre et al. (1997) also noticed that the newerultivars were the more efficient in the way in which available
was utilized to produce kernels.Overall, KN accounted for 67% of the variation in HI. Fig. 7
vidences the aberrant behaviour of cultivars “Triminia” andIride”, which combine the highest KN with the lowest kerneleight of their group. Without these entries, the coefficient ofetermination between HI and KN rises to 84%.
tsos(
; ns, not significant at the analysis of variance.ne another (Bonferroni test at P ≤ 0.05).
The strong correlations established between grain yield, HInd KN are consistent with much of the bread wheat literature, inhich increases in HI and the associated increase in kernel num-er have been key to determining the dramatic increase in grainield achieved by consistent breeding (Fischer, 1993; Sayre etl., 1997; Abbate et al., 1995; Reynolds et al., 2004).
.8. Nitrogen uptake
The varietal groups differed significantly with respect tohe accumulation of N in the above-ground biomass (Table 4).espite the longer duration of nitrogen uptake available to the
ater-flowering group 1 cultivars, in 2004, they accumulated8 kg ha−1 less N than the group 3 cultivars and 13 kg ha−1
ess than the group 2 ones; while in 2005, these differencesere 40 kg ha−1 and 31 kg ha−1. The regression of individual
ient of the booting–anthesis period. Black symbols, group 1 cultivars; greyymbols, group 2 cultivars; white symbols, group 3 cultivars. Data are meansf group × sowing date × season. Vertical lines represent ± standard error. Theolid line represents the relationship for bread wheat cultivars carrying Rht genesFischer, 1985).

22 F. Giunta et al. / Europ. J. Agr
F1D
gcNb
ti3caapotTag(
N
Fa
t2mdc1fbpaigtcaNfcg
ittNcia((asioaga
ig. 7. Relationship between HI and kernel number m−2. Black symbols, groupcultivars; grey symbols, group 2 cultivars; white symbols, group 3 cultivars.ata are means over all treatments and seasons.
roup 3 cultivars, “Simeto” and “Pietrafitta” were the most effi-ient accumulators. This breeding progress with respect to total
uptake contrasts with suggestion that little such progress haseen made in bread wheat (Calderini et al., 1995).
An increase in crop N uptake is implied by the progress overhe breeding period in yield and HI, because the N concentrationn the kernel was 6.0 (group 1), 6.5 (group 2) and 7.0 (group) times that in the straw. Thus, the breeding progress in HIould not have been achieved without an enhancement in Nccumulation. These observed differences in total N were notconsequence of variation in the total amount of AGDM, as
roposed by Austin et al. (1977). Rather, the different amountsf N accumulated in the grain – increasing by 44% (group 1o group 3) in 2004, and by 58% in 2005 – were responsible.he amount of straw N was higher in the group 1 group (2004)nd not different among groups (2005). As a result, total N andrain N were highly significantly correlated with one another
R2 = 0.97***).The greater ability of the group 3 cultivars to accumulate graincannot be explained by the concentration of grain N itself, as
ig. 8. Relationship between total N present in the above-ground biomass m−2
nd year of release. Vertical lines represent ± standard error.
oip
4
eagI3slfpidvio
onomy 27 (2007) 12–24
hey exhibited the lowest %grain N in both years (just 1.9% in004). Instead, it must reflect the greater quantity of grain dryatter that they are able to accumulate (note the coefficient of
etermination of 0.99*** between grain yield and grain N). As aonsequence, the nitrogen harvest index rose from 0.71 (group) to 0.78 (group 2) and 0.80 (group 3), mirroring the time trendor HI (R2 = 0.94***). For these correlations to be causal, it haseen hypothesized that a crop with a high N status at anthesis ishysiologically primed to set a large number of kernels (Sinclairnd Jamieson, 2006). Assuming harvested kernel N to be a goodndicator of N status at anthesis (Sinclair and Jamieson, 2006),roup 3 cultivars were able to set more kernels m−2 in responseo their enjoying a better level of N at anthesis. This model isonsistent with the significant observed correlation between KNnd harvested kernel N (R2 = 0.56***). The dependence of KN onavailability is also supported by the non-significant differences
ound in the amount of N accumulated in each kernel. Group 1ultivars accumulated 1.1 ± 0.01 mg N per kernel, group 2 androup 3 ones accumulated 1.0 ± 0.01.
The total N accumulated was larger in the first sowing thann the second, and more at N100 than at N60, but neitherhe groups × sowing date nor the group × N treatment interac-ions were statistically significant. In spite of the non-significant× cultivar and N × group interactions, in 2004 the group 3
ultivars accumulated 21% more N in the N100 treatment thann the N60 one, and the group 1 ones only 5% (Table 4). As
result, the rate of increase of total N per year was greaterP < 0.05) at N100 (0.51 ± 0.06 kg ha−1 per year) than at N600.37 ± 0.06 kg ha−1 per year). In 2004, the greater uptake of Nt N100 was due to a rise in the amount of N accumulated in thetraw, brought about by an increase in both straw mass and %Nn the straw. This is consistent with the parallel decrease in thebserved HI. The higher kernel N percentage in this same yeart N100 resulted in the kernel N content increasing only for theroup 3 cultivars (which was also the only group experiencingn increased grain yield; Table 3). In 2005, the greater uptakef N at N100 was achieved by an enhanced accumulation of Nn the kernel, in spite of a simultaneous decrease in kernel Nercentage.
. Conclusions
The testing of cultivars bred at different times in a commonnvironment provides a direct estimate of breeding progress,lthough it cannot completely isolate genetic effects from thoseenerated by improvements in husbandry. We have shown thattalian breeders have raised the potential yield of durum wheat by7% by crossing mediterraneum with syriacum lines. This firsttep produced shorter and earlier-flowering cultivars, althoughodging susceptibility still represented a problem, particularlyrom early sowing and at high rates of N fertilisation. The yieldrogress achieved with the introduction of Rht genes resultedn an additional 19% increase in yield potential but in a slight
elay in flowering time. Thus, syriacum germplasm can beiewed as a good alternative source of earliness and height reduc-ng, provided that the residual susceptibility to lodging can bevercome.
. Agr
odywwwcbitwNatgyd
iricismaps
A
tep
R
A
A
A
A
A
A
B
B
B
B
B
C
C
C
D
D
E
E
F
F
F
F
F
G
G
M
M
O
P
R
R
F. Giunta et al. / Europ. J
Temporal trends in the yield components responsible for thebserved increase in yield potential are in part similar to thoseocumented in bread wheat: in both, the first factor to assureield gain was a reduction in plant height, leading to a rise in HI,ithout changes in AGDM. The increase in HI was associatedith an increase in the number of kernels m−2 of the crop, a traithich exerts no negative effects on individual kernel weight (a
ontributor to durum wheat quality and hence taken into accounty durum breeders). The remarkable increase in total N uptakenduced by breeding in durum wheat is the most distinctive fea-ure in comparison with bread wheat breeding, although thisork could not tell whether this difference was due to a greateruptake of modern cultivars in the pre- and/or in the post-
nthesis period. This increase in N uptake was needed to sustainhe improvement of yield and HI. It is therefore possible to sug-est that N accumulation plays a crucial role in both limitingield and contributing to the determination of grain number inurum wheat.
Modern cultivars out-yielded old ones at both sowing dates,n spite of the changes made in the length of the vegetative andeproductive growth periods. The cultivar × N fertilization ratenteraction contributed in part to the superiority of the modernultivars, as these are generally more suitable and responsive toncreased N inputs than were their predecessors, in part a con-equence of their greater lodging resistance. At the same time,odern cultivars out-yielded old ones even at the lower N rate,
n important result in light of the sought after shift in Euro-ean agricultural practices towards a more extensive productionystem using lower inputs.
cknowledgements
We thank Antonio Biddau, Mario Sanna and Fabio Masia forheir technical assistance in field management. We also acknowl-dge the linguistic help of http://www.smartenglish.co.uk in thereparation of this mss.
eferences
bbate, P.E., Andrade, F.H., Culot, P.J., 1995. The effects of radiation andnitrogen on number of grains in wheat. J. Agric. Sci. (Cambridge) 124,352–360.
mir, J., Sinclair, T.R., 1994. Cereal grain yield: biblical aspirations and modernexperience in the middle east. Agron. J. 86, 362–364.
nderson, W.K., Smith, W.R., 1990. Yield advantage of two semi-dwarf com-pared with two tall wheats depends on sowing time. Aust. J. Agric. Res. 41,811–826.
ustin, R.B., Ford, M.A., Edrich, J.A., Blackwell, R.D., 1977. The nitro-gen economy of winter wheat. J. Agric. Sci. (Cambridge) 88, 159–167.
ustin, R.B., Ford, M.A., Morgan, C.L., Yeoman, D., 1993. Old and modernwheat cultivars compared on the Broadbalk wheat experiment. Eur. J. Agron.2, 141–147.
ustin, R.B., Bingham, J., Blackwell, R.D., Evans, L.T., Ford, M.A., Morgan,C.L., Taylor, M., 1980. Genetic improvements in winter wheat yields since
1900 and associated physiological changes. J. Agric. Sci. (Cambridge) 94,675–689.agnara, D., Scarascia Mugnozza, G.T., 1975. Outlook in breeding for yield indurum wheat. In: Scarascia Mugnozza, G.T. (Ed.), Genetics and Breedingof Durum Wheat, pp. 249–274.
R
onomy 27 (2007) 12–24 23
erry, P.M., Sterling, M., Spink, J.H., Baker, C.J., Sylvester-Bradley, R.,Mooney, S.J., Tams, A.R., Ennos, A.R., 2004. Understanding and reducinglodging in cereals. Adv. Agron. 84, 218–263.
lum, A., 2006. Drought adaptation in cereal crops: a prologue. In: Ribaut, J.M.(Ed.), Drought Adaptation in Cereals. Haworth Press, NY, pp. 3–15.
ozzini, A., 1970. Genetica e miglioramento genetico dei frumenti duri. Genet-ica Agraria 24, 145–193.
rancourt-Hulmel, Doussinault, G., Lecomte, C., Berard, P., Le Buanec, B.,Trottet, M., 2003. Genetic improvement of agronomic traits of winter wheatcultivars released in France from 1946 to 1992. Crop Sci. 43, 37–45.
alderini, D.F., Torres-Leon, S., Slafer, G., 1995. Consequences of wheatbreeding on nitrogen and phosphorus yield, grain nitrogen and phosphorusconcentration and associated traits. Ann. Bot. 76, 315–322.
anevara, M.G., Romani, M., Corbellini, M., Perenzin, M., Borghi, B., 1994.Evolutionary trends in morphological, physiological, agronomical and qual-itative traits of Triticum aestivum L. cultivars bred in Italy since 1900. Eur.J. Agron. 3, 175–185.
ooper, M., Delacy, I.H., Basford, K.E., 1996. Relationships among analyti-cal methods used to analyse genotypic adaptation in multi-environmentaltrials. In: Cooper, M., Hammer, G.L. (Eds.), Plant Adaptation and CropImprovement. CAB International, Wallingford, UK.
e Cillis, E., 1927. I grani d’Italia. Tipografia della Camera dei Deputati, Roma,p.173.
eidda, M., Marras, G.F., 1976. Effetti della concimazione azotata su frumentoduro in un tipico ambiente mediterraneo. Studi Sassaresi 24, 318–330.
vans, L.T., 1993. Crop evolution, adaptation and yield. Cambridge UniversityPress.
vans, L.T., Fischer, R.A., 1999. Yield potential: its definition, measurement,and significance. Crop Sci. 39, 1544–1551.
eil, B., 1992. Breeding progress in small grain cereals. A comparison of oldand modern cultivars. Plant Breed. 108, 1–11.
ischer, R.A., 1985. Number of kernels in wheat crops and the influence of solarradiation and temperature. J. Agric. Sci. (Cambridge) 100, 447–461.
ischer, R.A., 1993. Irrigated spring wheat and timing and amount of nitro-gen fertilizer II. Physiology of grain yield response. Field Crops Res. 33,57–80.
ischer, R.A., HilleRisLambers, D., 1978. Effect of environment and culti-var on source limitation to grain weight in wheat. Aust. J. Agric. Res. 29,433–458.
ischer, R.A., Maurer, R., 1976. Crop temperature modification and yield poten-tial in a dwarf spring wheat. Aust. J. Agric. Res. 29, 443–458.
omez, K.A., Gomez, A.A., 1984. Statistical Procedures for AgriculturalResearch, second en. Wiley, New York.
rignac, P., 1965. Contribution a l’etude de Triticum durum Desf, These doc-torat, Toulouse, p. 151.
cNeal, F.H., Qualset, C.O., Baldridge, D.E., Stewart, V.R., 1978. Selection foryield and yield components in wheat. Crop Sci. 18, 795–799.
otzo, R., Fois, S., Giunta, F., 2004. Relationship between grain yield andquality of durum wheats from different eras of breeding. Euphytica 140,147–154.
rtiz-Monasterio, J.I., Dhillon, S.S., Fischer, R.A., 1994. Date of sowing effectsin grain yield and yield components of spring wheat cultivars and theirrelationship with radiation and teperature in Ludhiana. India Field CropsRes. 37, 169–184.
aulsen, G.M., 1987. Wheat stand establishment. In: Heyne, E.G. (Ed.), Wheatand Wheat Improvement, second en. ASA/CSSA/SSSA, Madison, Wiscon-sin, pp. 384–389.
eynolds, M., Condon, A.J., Rebetzke, G.J., Richards, R.A., 2004. Evidenceof excess photosynthetic capacity and sink limitation to yield and biomassin elite spring wheat. In: Proceedings of the 4th International Crop ScienceCongress, Brisbane.
eynolds, M.P., Rajaram, S., Sayre, K.D., 1999. Physiological and geneticchanges of irrigated wheat in the post-green revolution period and
approaches for meeting projected global demand. Crop Sci. 39, 1611–1621.itchie, J.T., 1991. Wheat phasic development. In: Hanks, J., Ritchie, J.T. (Eds.),Modeling Plant and Soil Systems. ASA/CSSA/SSSA, Madison, Wisconsin,USA, pp. 31–54.

2 . Agr
S
S
S
S
S
S
S
S
S
W
4 F. Giunta et al. / Europ. J
AS Institute Inc., 1989. SAS/STAT user’s guide Version 6. SAS Institute Inc.,Cary, NC.
avin, R., Slafer, G.A., 1991. Shading effects on the yield of an Argentinianwheat cultivar. J. Agric. Sci. (Cambridge) 166, 1–7.
ayre, K.D., Acevedo, E., Austin, R.B., 1995. Carbon isotope discriminationand grain yield for three bread wheat germplasm groups grown at differentlevels of water stress. Field Crops Res. 41, 45–54.
ayre, K.D., Rajaram, S., Fischer, R.A., 1997. Yield potential progress in shortbread wheats in Northern Mexico. Crop Sci. 37, 36–42.
inclair, T.R., Jamieson, P.D., 2006. Grain number, wheat yield, and bottling
beer: an analysis. Field Crops Res. 98, 60–67.lafer, G.A., Andrade, F.H., 1991. Changes in physiological attributes on thedry matter economy of bread wheat (Triticum aestivum) through geneticimprovement of grain yield potential at different regions of the world. Rev.Euphy. 58, 37–49.
W
onomy 27 (2007) 12–24
lafer, G.A., Andrade, F.H., Satorre, E.H., 1990. Genetic improvement effectson pre-anthesis physiological attributes related to wheat grain yield. FieldCrops Res. 23, 255–263.
tapper, M., Fischer, R.A., 1990. Genotype, sowing date and plant spac-ing influence on high-yielding irrigated wheat in Southern New SouthWales. II. Growth, yiled and nitrogen use. Aust. J. Agric. Res. 41, 1021–1041.
teel, R.G.D., Torrie, J.H., 1980. Principles and Procedures of Statistics. ABiometrical Approach. McGraw-Hill Publishing Company, New York.
addington, J.K., Osmanzai, M., Yoshida, M., Ransom, J.K., 1987. The yields
of durum wheats released in Mexico between 1960 and 1984. J. Agric. Sci.(Cambridge) 108, 469–477.eir, A.H., Bragg, P.L., Porter, J.R., Rayner, J.H., 1984. A winter wheat cropsimulation model without water or nutrient limitations. J. Agric. Sci. (Cam-bridge) 102, 371–382.