trends motivating successful innovations in retail multi
TRANSCRIPT

Jonna Parker
Team Lead, Fresh Center of Excellence
March 10, 2021
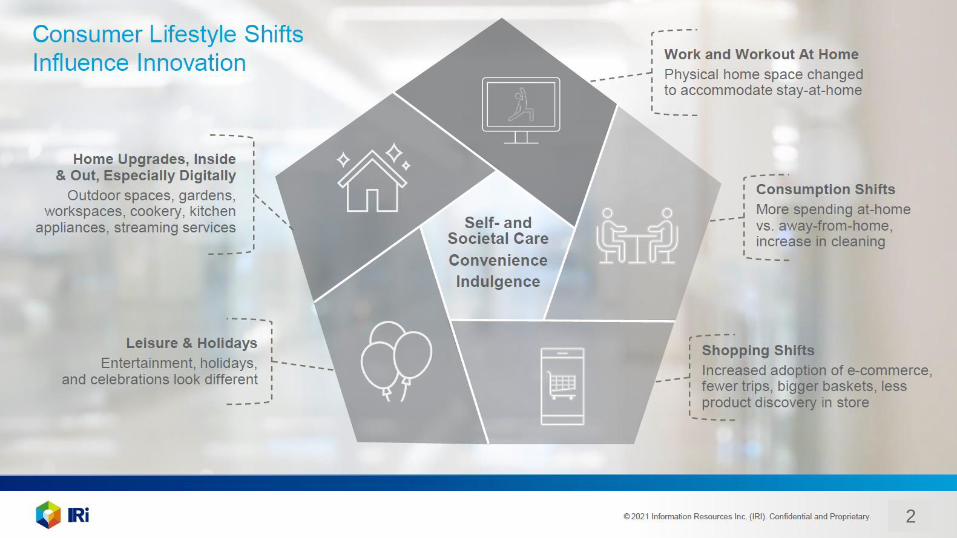
Trends MotivatingSuccessful Innovations inRetail Multi-Outlet 2020
United Fresh BRANDSTORM
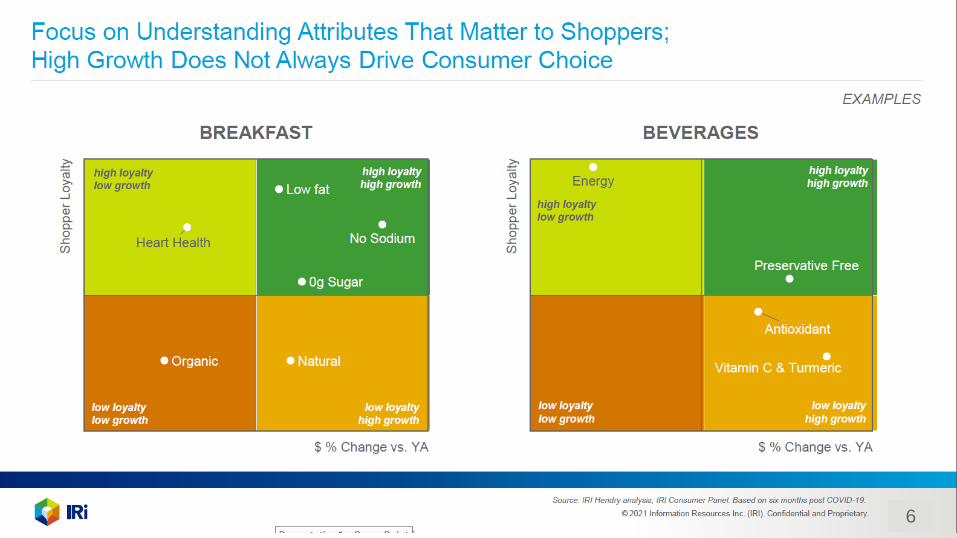
“Our Strongest Selling Point- Product Claims”
© 2021 Information Resources Inc. (IRI). Confidential and Proprietary. 22
© 2021 Information Resources Inc. (IRI). Confidential and Proprietary. 33
© 2021 Information Resources Inc. (IRI). Confidential and Proprietary. 4
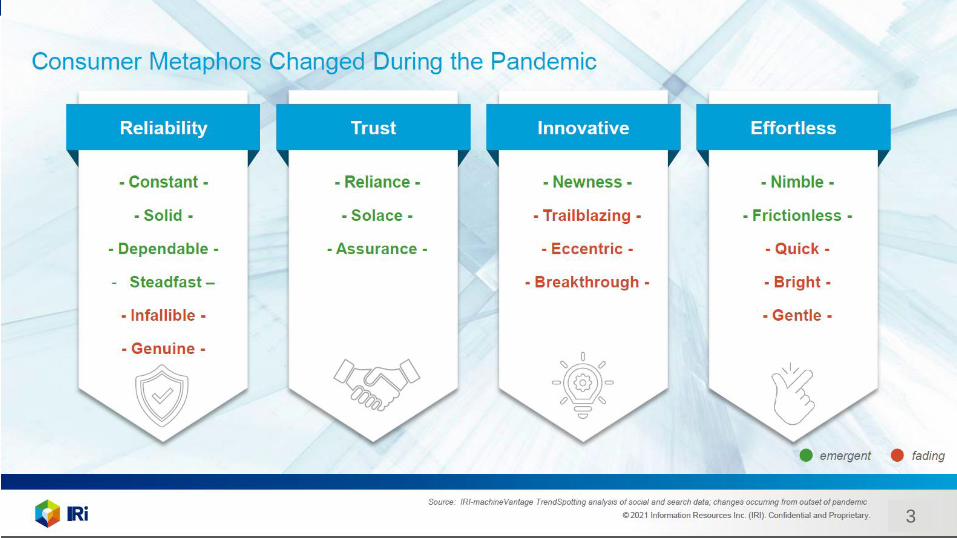
Claims that are Trending in 2020
4
© 2021 Information Resources Inc. (IRI). Confidential and Proprietary. 55
© 2021 Information Resources Inc. (IRI). Confidential and Proprietary. 66
© 2021 Information Resources Inc. (IRI). Confidential and Proprietary. 77
© 2021 Information Resources Inc. (IRI). Confidential and Proprietary. 8
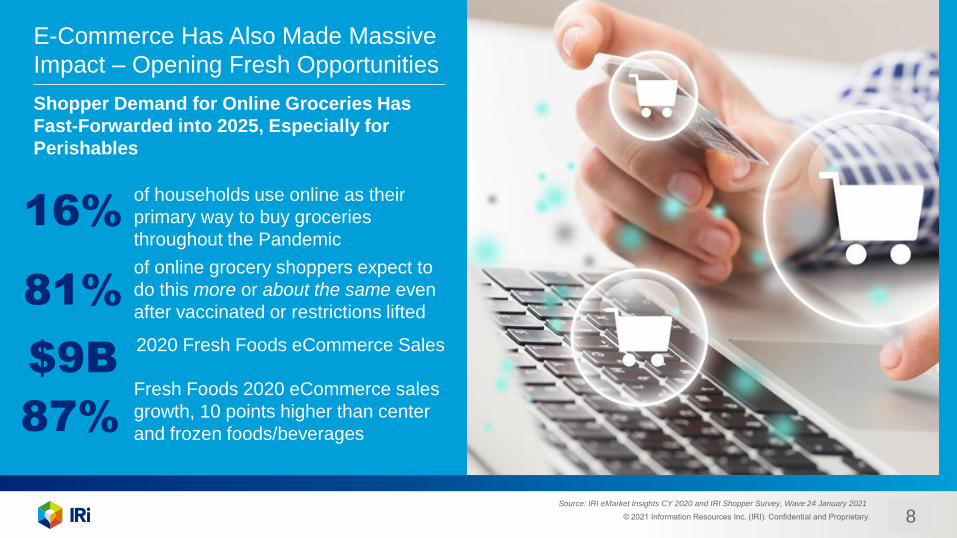
E-Commerce Has Also Made Massive
Impact – Opening Fresh Opportunities
Shopper Demand for Online Groceries Has
Fast-Forwarded into 2025, Especially for
Perishables
Source: IRI eMarket Insights CY 2020 and IRI Shopper Survey, Wave 24 January 2021
16%of households use online as their
primary way to buy groceries
throughout the Pandemic
81%
of online grocery shoppers expect to
do this more or about the same even
after vaccinated or restrictions lifted
$9B2020 Fresh Foods eCommerce Sales
87%
Fresh Foods 2020 eCommerce sales
growth, 10 points higher than center
and frozen foods/beverages
8
© 2021 Information Resources Inc. (IRI). Confidential and Proprietary. 9
Source: Italicized Text (6 point)
9
© 2021 Information Resources Inc. (IRI). Confidential and Proprietary. 10
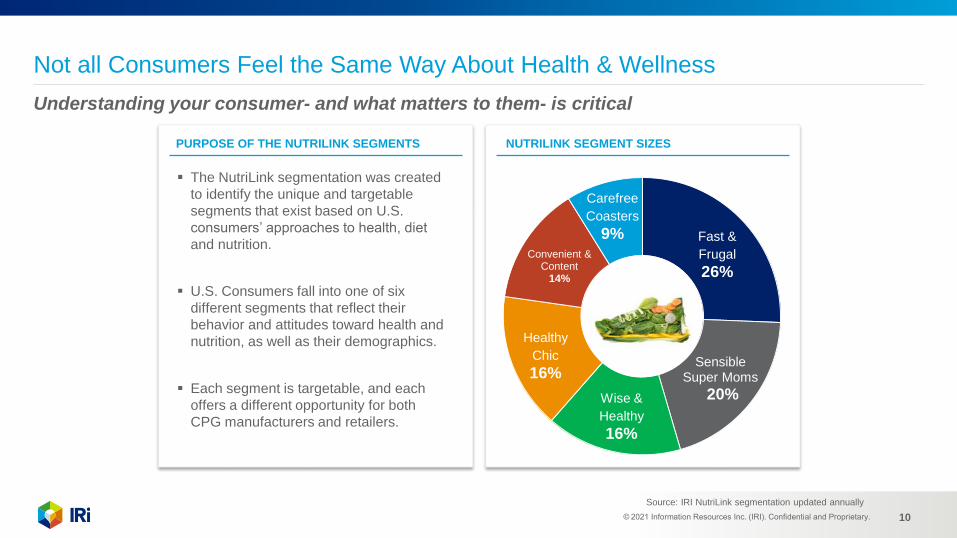
Not all Consumers Feel the Same Way About Health & Wellness
Understanding your consumer- and what matters to them- is critical
Fast &
Frugal
26%
SensibleSuper Moms
20%Wise &
Healthy
16%
Healthy
Chic
16%
Convenient & Content
14%
Carefree
Coasters
9%
NUTRILINK SEGMENT SIZESPURPOSE OF THE NUTRILINK SEGMENTS
▪ The NutriLink segmentation was created
to identify the unique and targetable
segments that exist based on U.S.
consumers’ approaches to health, diet
and nutrition.
▪ U.S. Consumers fall into one of six
different segments that reflect their
behavior and attitudes toward health and
nutrition, as well as their demographics.
▪ Each segment is targetable, and each
offers a different opportunity for both
CPG manufacturers and retailers.
Source: IRI NutriLink segmentation updated annually
© 2021 Information Resources Inc. (IRI). Confidential and Proprietary. 11
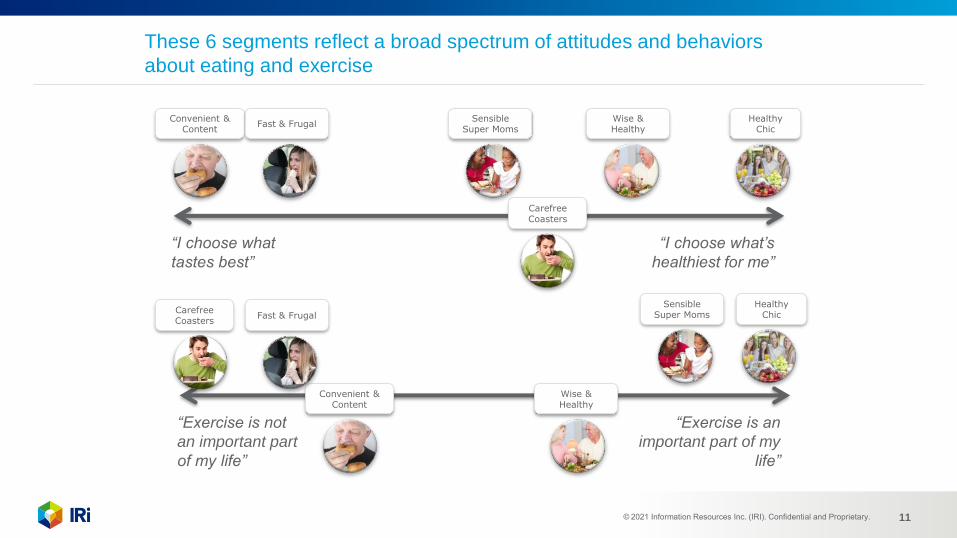
These 6 segments reflect a broad spectrum of attitudes and behaviors
about eating and exercise
“I choose what
tastes best”
“I choose what’s
healthiest for me”
Sensible Super Moms
Convenient & Content
Wise & Healthy
Fast & FrugalHealthy
Chic
Carefree Coasters
“Exercise is not
an important part
of my life”
“Exercise is an
important part of my
life”
Healthy Chic
Sensible Super Moms
Wise & Healthy
Convenient & Content
Fast & FrugalCarefree Coasters
© 2021 Information Resources Inc. (IRI). Confidential and Proprietary. 12
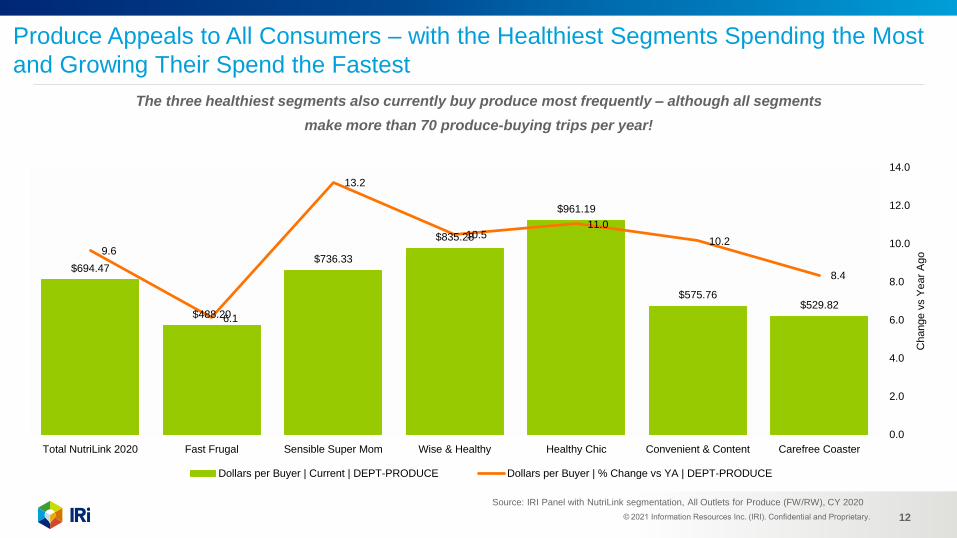
Produce Appeals to All Consumers – with the Healthiest Segments Spending the Most
and Growing Their Spend the Fastest
The three healthiest segments also currently buy produce most frequently – although all segments
make more than 70 produce-buying trips per year!
$694.47
$488.20
$736.33
$835.28
$961.19
$575.76$529.82
9.6
6.1
13.2
10.511.0
10.2
8.4
0.0
2.0
4.0
6.0
8.0
10.0
12.0
14.0
Total NutriLink 2020 Fast Frugal Sensible Super Mom Wise & Healthy Healthy Chic Convenient & Content Carefree Coaster
Change v
s Y
ear
Ago
Dollars per Buyer | Current | DEPT-PRODUCE Dollars per Buyer | % Change vs YA | DEPT-PRODUCE
Source: IRI Panel with NutriLink segmentation, All Outlets for Produce (FW/RW), CY 2020
© 2021 Information Resources Inc. (IRI). Confidential and Proprietary. 13
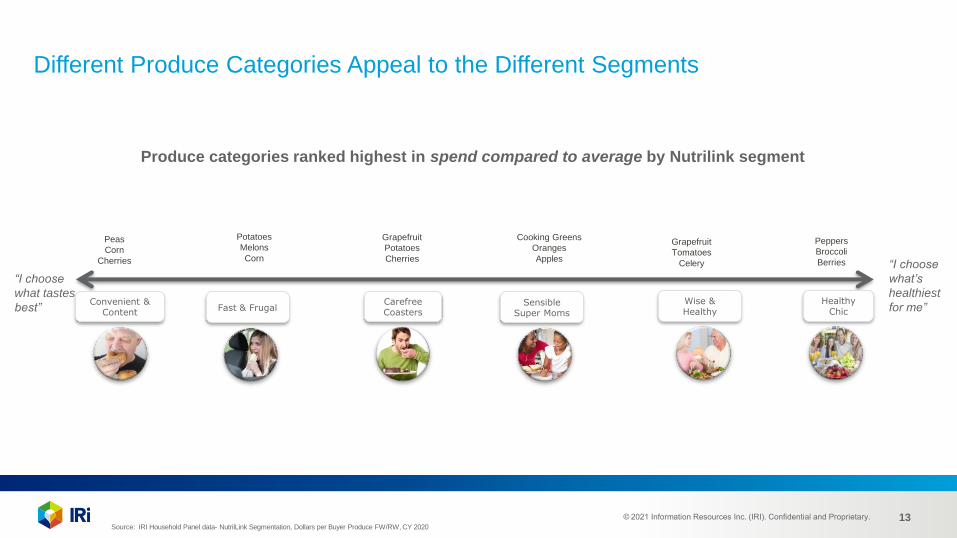
Different Produce Categories Appeal to the Different Segments
Produce categories ranked highest in spend compared to average by Nutrilink segment
“I choose
what tastes
best”
“I choose
what’s
healthiest
for me”Sensible
Super Moms
Convenient & Content
Wise & HealthyFast & Frugal
Healthy Chic
Carefree Coasters
Potatoes
Melons
Corn
Grapefruit
Potatoes
Cherries
Grapefruit
Tomatoes
Celery
Peas
Corn
Cherries
Cooking Greens
Oranges
Apples
Peppers
Broccoli
Berries
Source: IRI Household Panel data- NutrilLink Segmentation, Dollars per Buyer Produce FW/RW, CY 2020
FRESH PRODUCE IN 2020
Sales Performance Background
© 2021 Information Resources Inc. (IRI). Confidential and Proprietary. 15
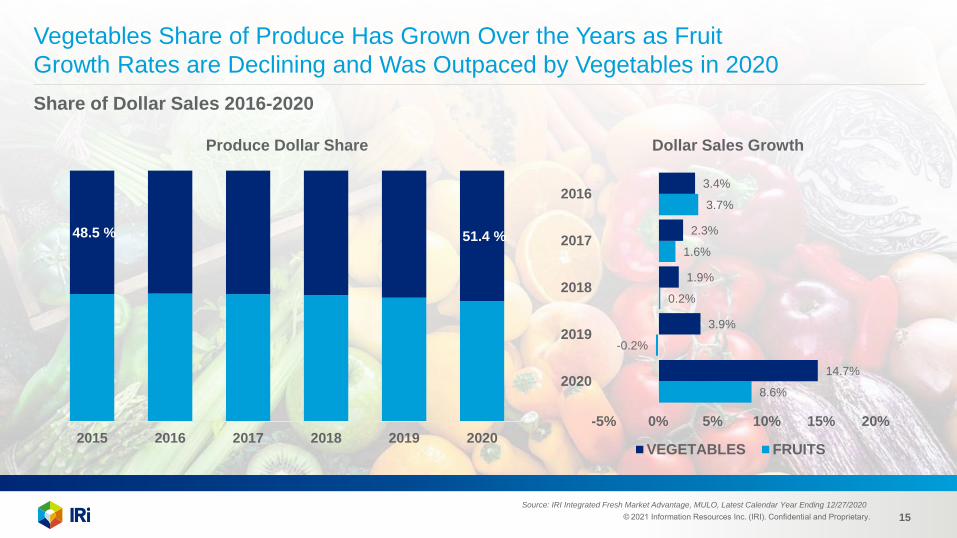
8.6%
-0.2%
0.2%
1.6%
3.7%
14.7%
3.9%
1.9%
2.3%
3.4%
-5% 0% 5% 10% 15% 20%
2020
2019
2018
2017
2016
Dollar Sales Growth
VEGETABLES FRUITS
48.5 % 51.4 %
2015 2016 2017 2018 2019 2020
Produce Dollar Share
Vegetables Share of Produce Has Grown Over the Years as Fruit
Growth Rates are Declining and Was Outpaced by Vegetables in 2020
Share of Dollar Sales 2016-2020
Source: IRI Integrated Fresh Market Advantage, MULO, Latest Calendar Year Ending 12/27/2020
© 2021 Information Resources Inc. (IRI). Confidential and Proprietary. 16
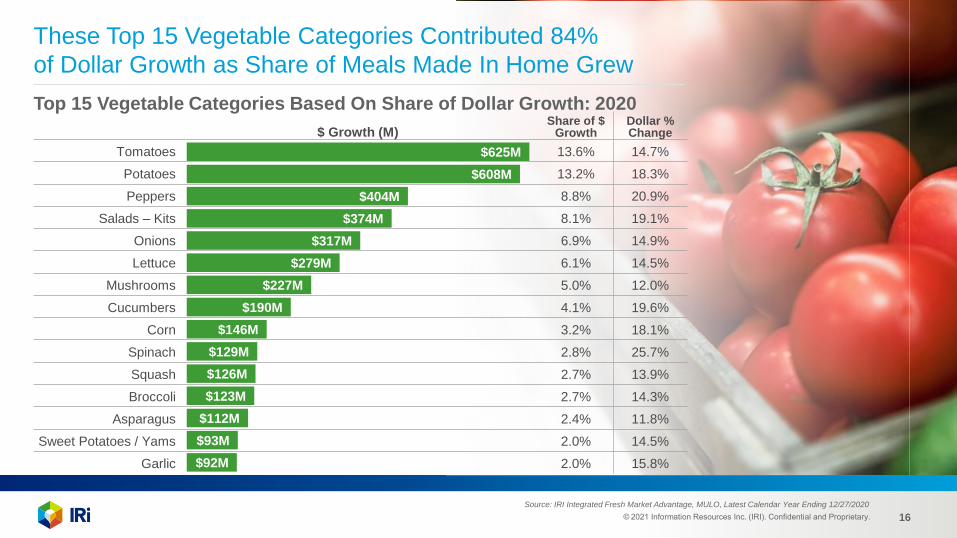
These Top 15 Vegetable Categories Contributed 84%
of Dollar Growth as Share of Meals Made In Home Grew
Top 15 Vegetable Categories Based On Share of Dollar Growth: 2020
$ Growth (M)Share of $
GrowthDollar % Change
Tomatoes 13.6% 14.7%
Potatoes 13.2% 18.3%
Peppers 8.8% 20.9%
Salads – Kits 8.1% 19.1%
Onions 6.9% 14.9%
Lettuce 6.1% 14.5%
Mushrooms 5.0% 12.0%
Cucumbers 4.1% 19.6%
Corn 3.2% 18.1%
Spinach 2.8% 25.7%
Squash 2.7% 13.9%
Broccoli 2.7% 14.3%
Asparagus 2.4% 11.8%
Sweet Potatoes / Yams 2.0% 14.5%
Garlic 2.0% 15.8%
Source: IRI Integrated Fresh Market Advantage, MULO, Latest Calendar Year Ending 12/27/2020
$625M
$608M
$404M
$374M
$317M
$279M
$227M
$190M
$146M
$129M
$126M
$123M
$112M
$93M
$92M
© 2021 Information Resources Inc. (IRI). Confidential and Proprietary. 17
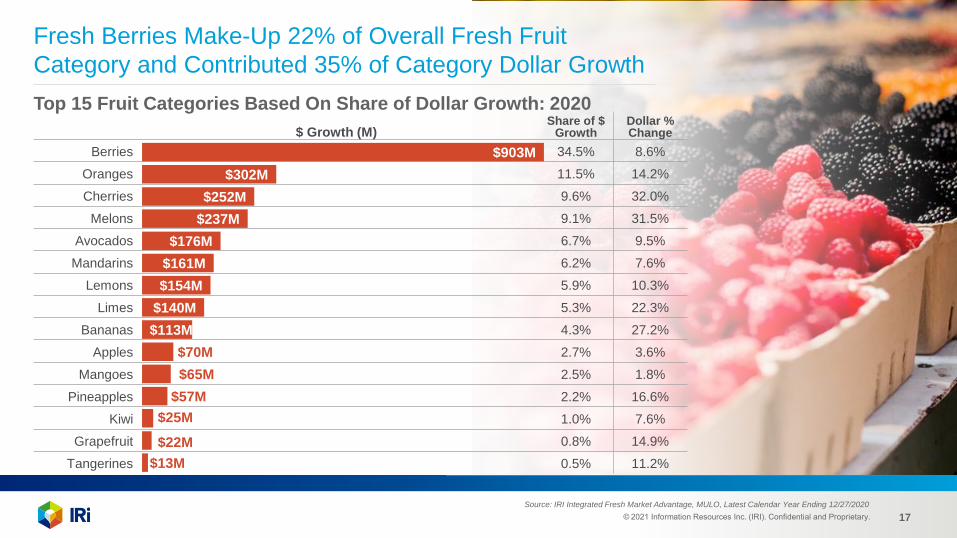
$ Growth (M)Share of $
GrowthDollar % Change
Berries 34.5% 8.6%
Oranges 11.5% 14.2%
Cherries 9.6% 32.0%
Melons 9.1% 31.5%
Avocados 6.7% 9.5%
Mandarins 6.2% 7.6%
Lemons 5.9% 10.3%
Limes 5.3% 22.3%
Bananas 4.3% 27.2%
Apples 2.7% 3.6%
Mangoes 2.5% 1.8%
Pineapples 2.2% 16.6%
Kiwi 1.0% 7.6%
Grapefruit 0.8% 14.9%
Tangerines 0.5% 11.2%
Fresh Berries Make-Up 22% of Overall Fresh Fruit
Category and Contributed 35% of Category Dollar Growth
Top 15 Fruit Categories Based On Share of Dollar Growth: 2020
Source: IRI Integrated Fresh Market Advantage, MULO, Latest Calendar Year Ending 12/27/2020
$903M
$302M
$252M
$237M
$176M
$161M
$154M
$140M
$113M
$70M
$65M
$57M
$25M
$22M
$13M
© 2021 Information Resources Inc. (IRI). Confidential and Proprietary. 18
Jonna Parker
IRI, Fresh Center of Excellence
© 2021 Information Resources Inc. (IRI). Confidential and Proprietary. 19
These were just a snapshot of what’s available from IRI on
Marketing, Innovation and Fresh Foods!
Resources to Learn More
© 2021 Information Resources Inc. (IRI). Confidential and Proprietary. 20
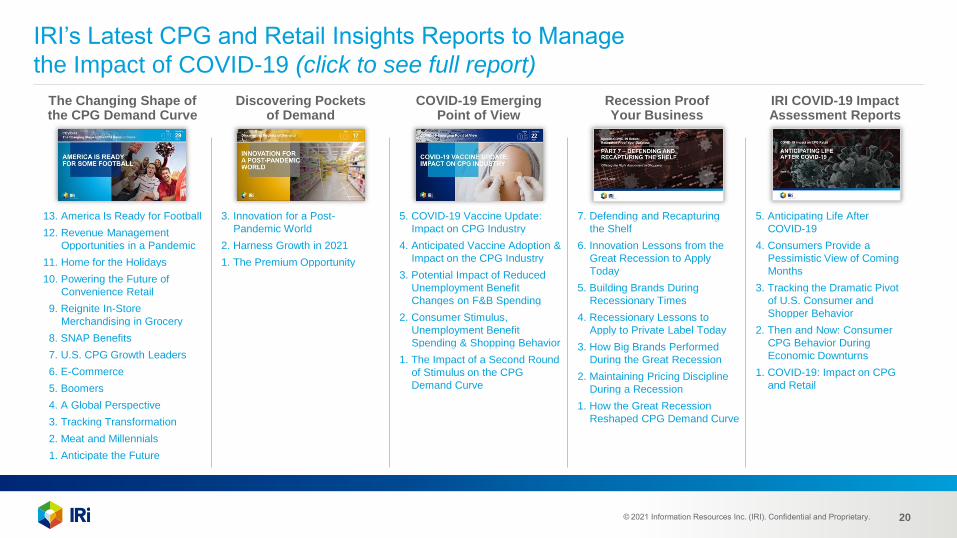
IRI’s Latest CPG and Retail Insights Reports to Manage
the Impact of COVID-19 (click to see full report)
The Changing Shape of the CPG Demand Curve
Discovering Pockets of Demand
COVID-19 Emerging Point of View
Recession Proof Your Business
IRI COVID-19 Impact Assessment Reports
13. America Is Ready for Football
12. Revenue Management
Opportunities in a Pandemic
11. Home for the Holidays
10. Powering the Future of
Convenience Retail
9. Reignite In-Store
Merchandising in Grocery
8. SNAP Benefits
7. U.S. CPG Growth Leaders
6. E-Commerce
5. Boomers
4. A Global Perspective
3. Tracking Transformation
2. Meat and Millennials
1. Anticipate the Future
3. Innovation for a Post-
Pandemic World
2. Harness Growth in 2021
1. The Premium Opportunity
5. COVID-19 Vaccine Update:
Impact on CPG Industry
4. Anticipated Vaccine Adoption &
Impact on the CPG Industry
3. Potential Impact of Reduced
Unemployment Benefit
Changes on F&B Spending
2. Consumer Stimulus,
Unemployment Benefit
Spending & Shopping Behavior
1. The Impact of a Second Round
of Stimulus on the CPG
Demand Curve
7. Defending and Recapturing
the Shelf
6. Innovation Lessons from the
Great Recession to Apply
Today
5. Building Brands During
Recessionary Times
4. Recessionary Lessons to
Apply to Private Label Today
3. How Big Brands Performed
During the Great Recession
2. Maintaining Pricing Discipline
During a Recession
1. How the Great Recession
Reshaped CPG Demand Curve
5. Anticipating Life After
COVID-19
4. Consumers Provide a
Pessimistic View of Coming
Months
3. Tracking the Dramatic Pivot
of U.S. Consumer and
Shopper Behavior
2. Then and Now: Consumer
CPG Behavior During
Economic Downturns
1. COVID-19: Impact on CPG
and Retail
© 2021 Information Resources Inc. (IRI). Confidential and Proprietary. 21
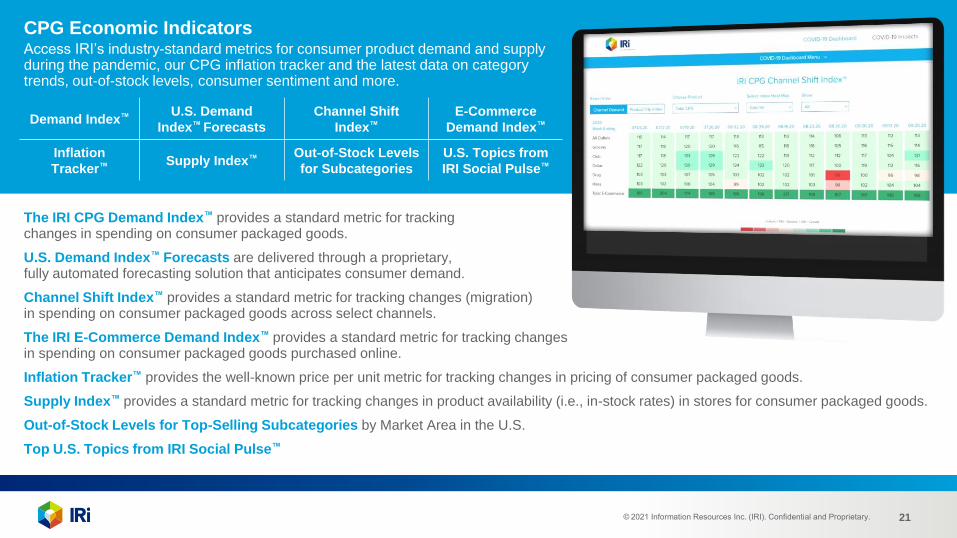
The IRI CPG Demand Index™ provides a standard metric for tracking changes in spending on consumer packaged goods.
U.S. Demand Index™ Forecasts are delivered through a proprietary, fully automated forecasting solution that anticipates consumer demand.
Channel Shift Index™ provides a standard metric for tracking changes (migration) in spending on consumer packaged goods across select channels.
The IRI E-Commerce Demand Index™ provides a standard metric for tracking changes in spending on consumer packaged goods purchased online.
Inflation Tracker™ provides the well-known price per unit metric for tracking changes in pricing of consumer packaged goods.
Supply Index™ provides a standard metric for tracking changes in product availability (i.e., in-stock rates) in stores for consumer packaged goods.
Out-of-Stock Levels for Top-Selling Subcategories by Market Area in the U.S.
Top U.S. Topics from IRI Social Pulse™
CPG Economic IndicatorsAccess IRI’s industry-standard metrics for consumer product demand and supply during the pandemic, our CPG inflation tracker and the latest data on category trends, out-of-stock levels, consumer sentiment and more.
Demand Index™ U.S. Demand
Index™ Forecasts
Channel Shift
Index™
E-Commerce
Demand Index™
Inflation
Tracker™ Supply Index™ Out-of-Stock Levels
for Subcategories
U.S. Topics from
IRI Social Pulse™

© 2021 Information Resources Inc. (IRI). Confidential and Proprietary. 22
Want to Be the First to Know?
Registered Users Get New Thought Leadership
from IRI’s Research, Data & Analytics Experts
www.iriworldwide.com/en-US/Insights/Subscribe