trends in u.s. and arizona agriculture. trends in u.s. agriculture – a 20 th century time capsule...
TRANSCRIPT
TRENDS IN U.S. AND ARIZONA AGRICULTURE
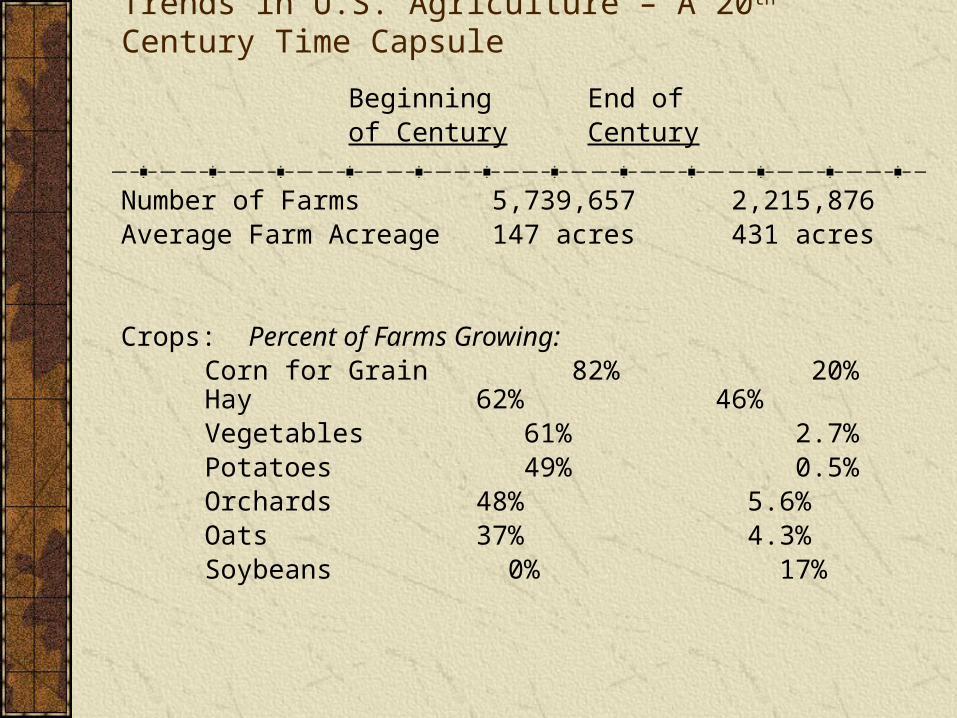
Trends in U.S. Agriculture – A 20th Century Time Capsule
Beginning End of of Century Century
Number of Farms 5,739,6572,215,876
Average Farm Acreage 147 acres 431 acres
Crops: Percent of Farms Growing:Corn for Grain 82% 20%
Hay 62% 46%Vegetables 61%
2.7%Potatoes 49%
0.5%Orchards 48%
5.6%Oats 37%
4.3%Soybeans 0%
17%
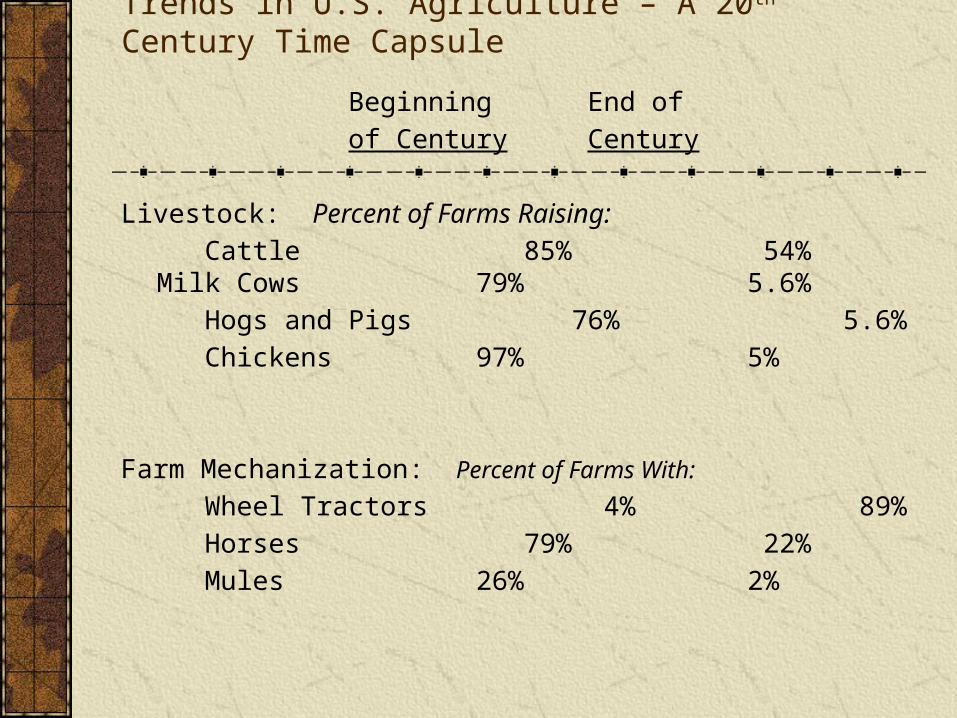
Trends in U.S. Agriculture – A 20th Century Time Capsule
Beginning End of
of Century Century
Livestock: Percent of Farms Raising:
Cattle 85% 54%Milk Cows 79%
5.6%
Hogs and Pigs 76% 5.6%
Chickens 97% 5%
Farm Mechanization: Percent of Farms With:
Wheel Tractors 4% 89%
Horses 79% 22%
Mules 26% 2%
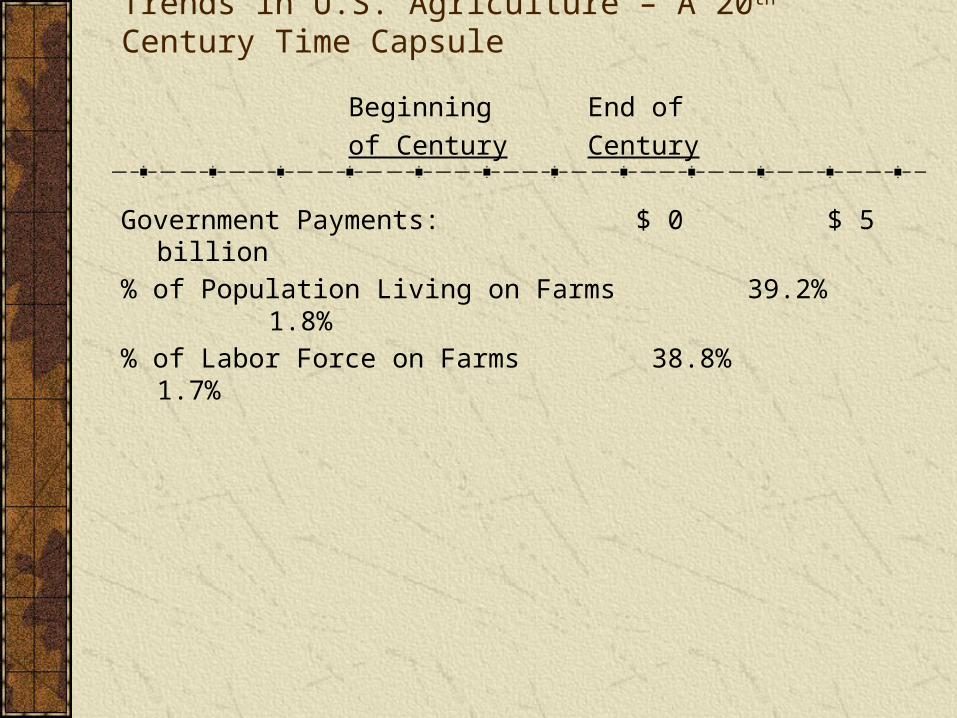
Trends in U.S. Agriculture – A 20th Century Time Capsule
Beginning End of
of Century Century
Government Payments: $ 0 $ 5 billion
% of Population Living on Farms 39.2% 1.8%
% of Labor Force on Farms 38.8% 1.7%
1982
1984
1986
1988
1990
1992
1994
1996
1998
2000
2002
2004
2006
2008
2010
0
50,000
100,000
150,000
200,000
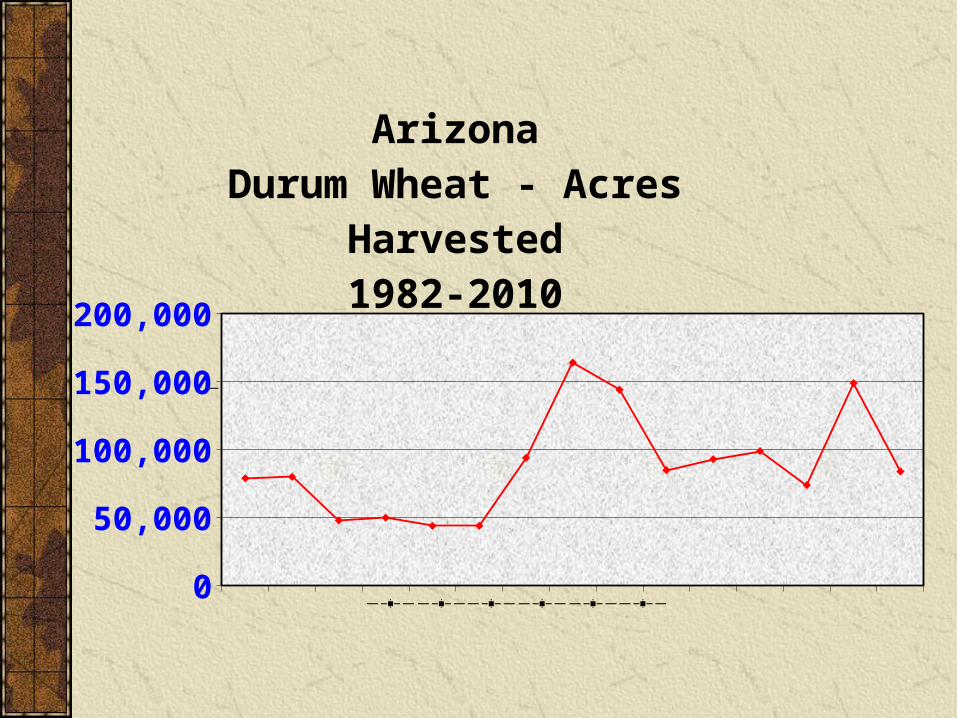
ArizonaDurum Wheat - Acres Harvested
1982-2010
1982
1984
1986
1988
1990
1992
1994
1996
1998
2000
2002
2004
2006
2008
2010
010,00020,00030,00040,00050,00060,000
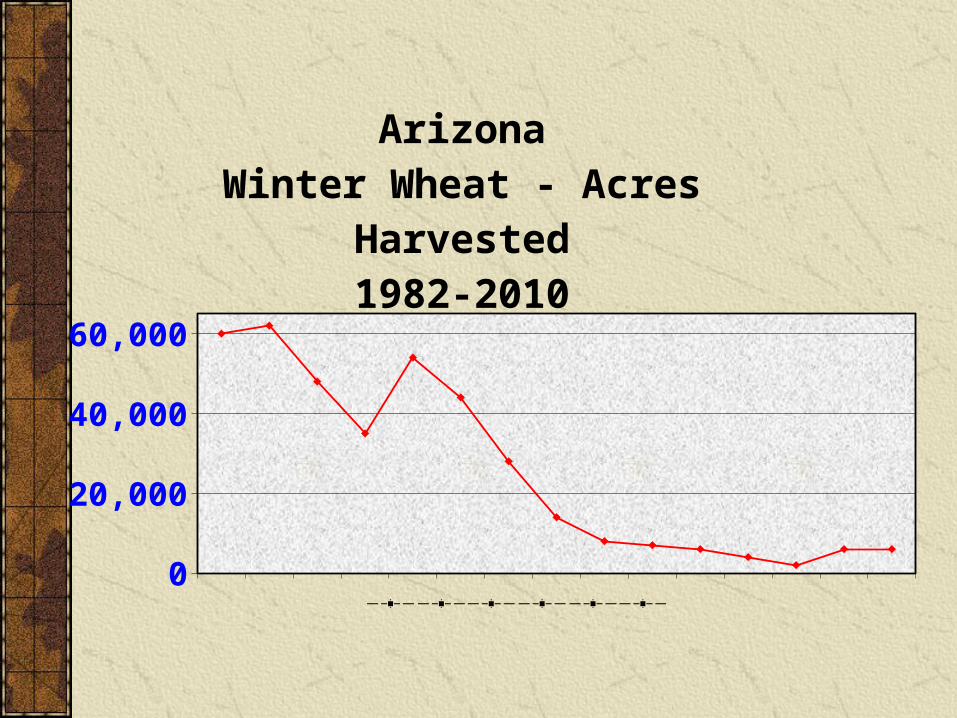
ArizonaWinter Wheat - Acres Harvested
1982-2010
1982
1984
1986
1988
1990
1992
1994
1996
1998
2000
2002
2004
2006
2008
2010
0
5,000
10,000
15,000
20,000
25,000
30,000
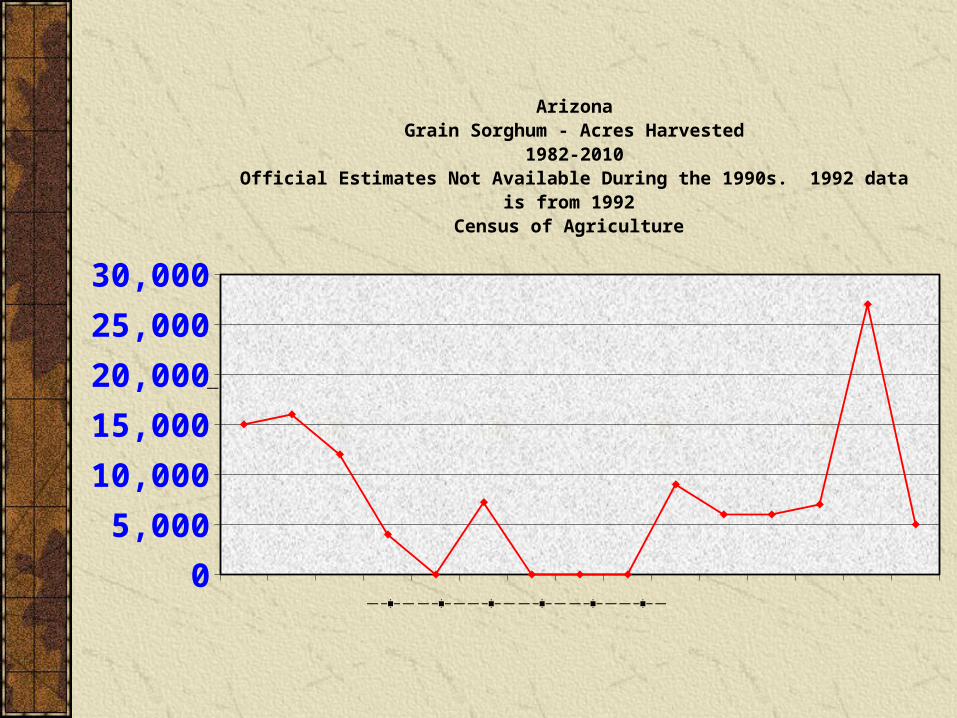
ArizonaGrain Sorghum - Acres Harvested
1982-2010Official Estimates Not Available During the 1990s. 1992 data is from 1992
Census of Agriculture
1981
1982
1983
1984
1985
1986
1987
1988
1989
1990
1991
1992
1993
1994
1995
1996
1997
1998
1999
2000
2001
2002
2003
2004
2005
2006
2007
2008
2009
0
10,000
20,000
30,000
40,000
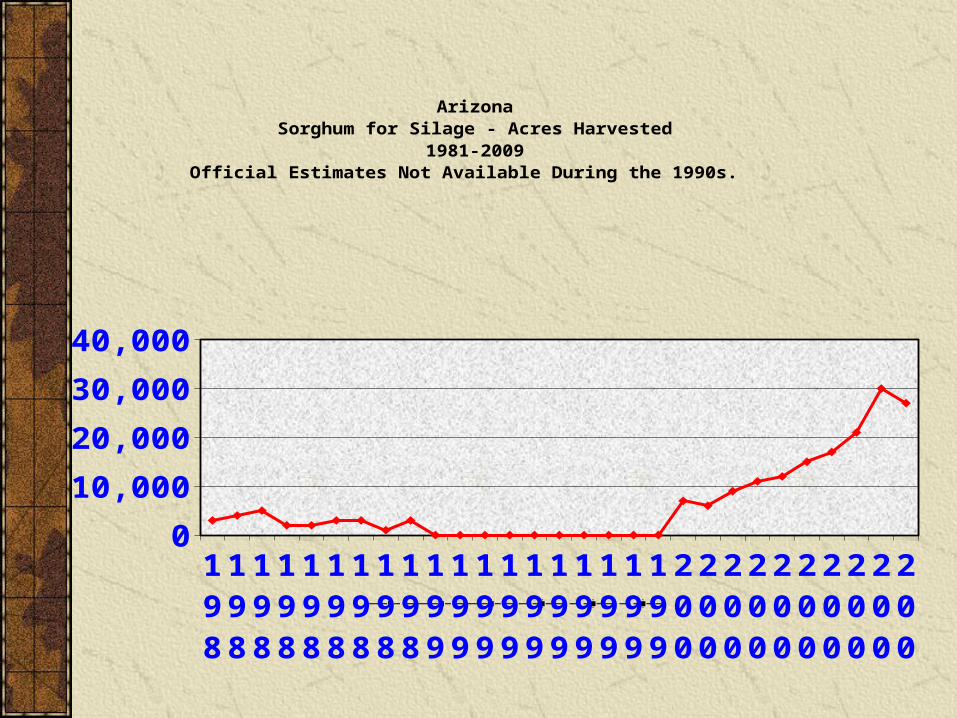
ArizonaSorghum for Silage - Acres Harvested
1981-2009Official Estimates Not Available During the 1990s.
1981
1983
1985
1987
1989
1991
1993
1995
1997
1999
2001
2003
2005
2007
2009
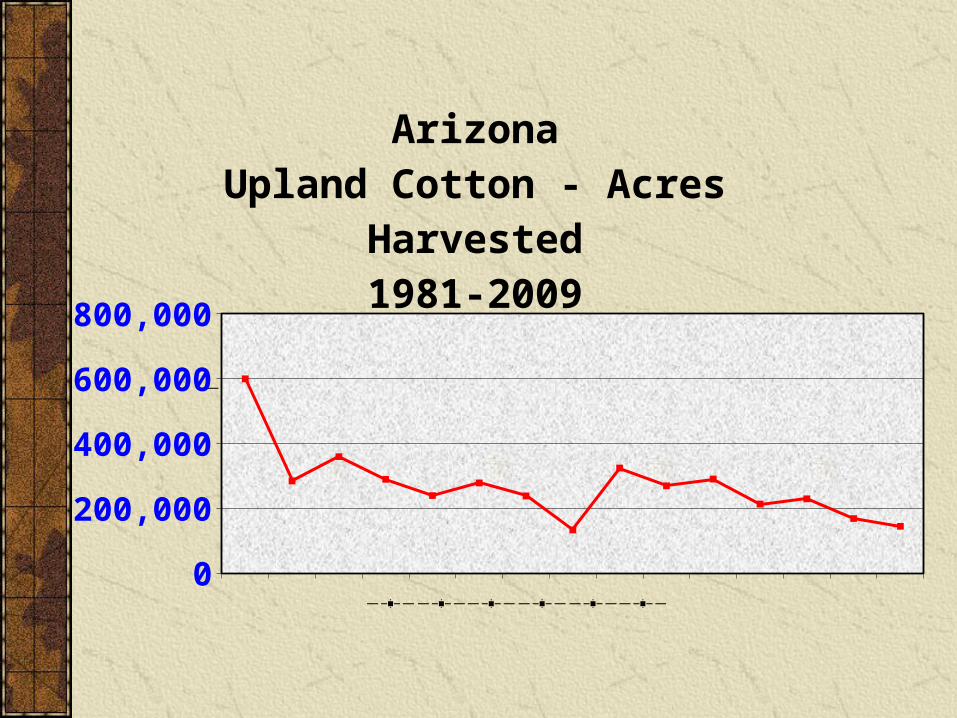
0100,000200,000300,000400,000500,000600,000700,000
ArizonaUpland Cotton - Acres Harvested
1981-2009
1981
1983
1985
1987
1989
1991
1993
1995
1997
1999
2001
2003
2005
2007
2009
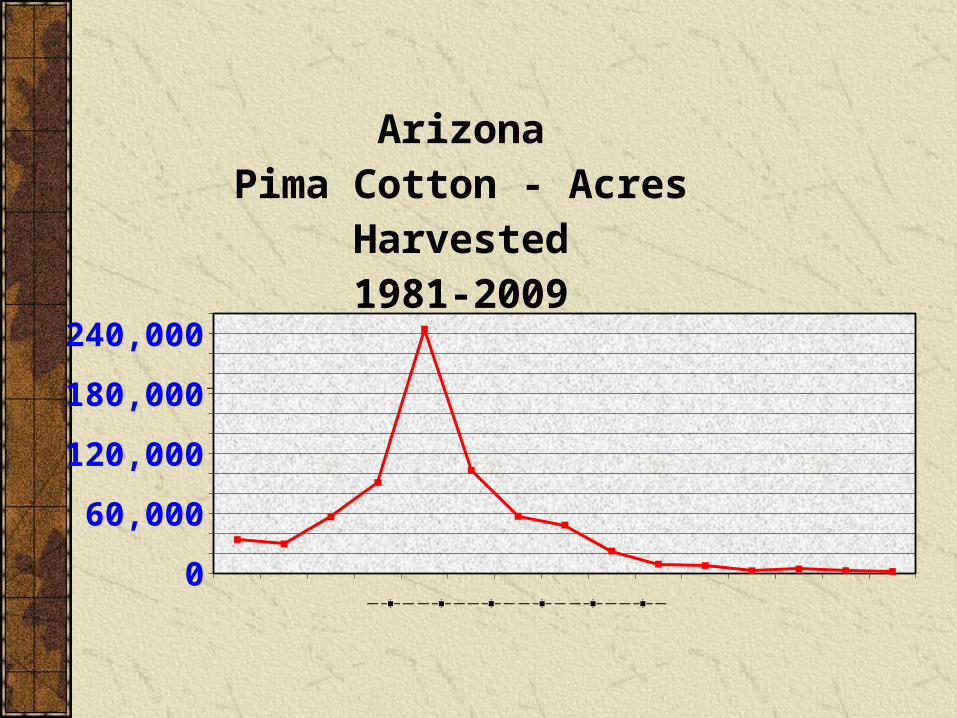
040,00080,000
120,000160,000200,000240,000
ArizonaPima Cotton - Acres Harvested
1981-2009
1982
1984
1986
1988
1990
1992
1994
1996
1998
2000
2002
2004
2006
2008
2010
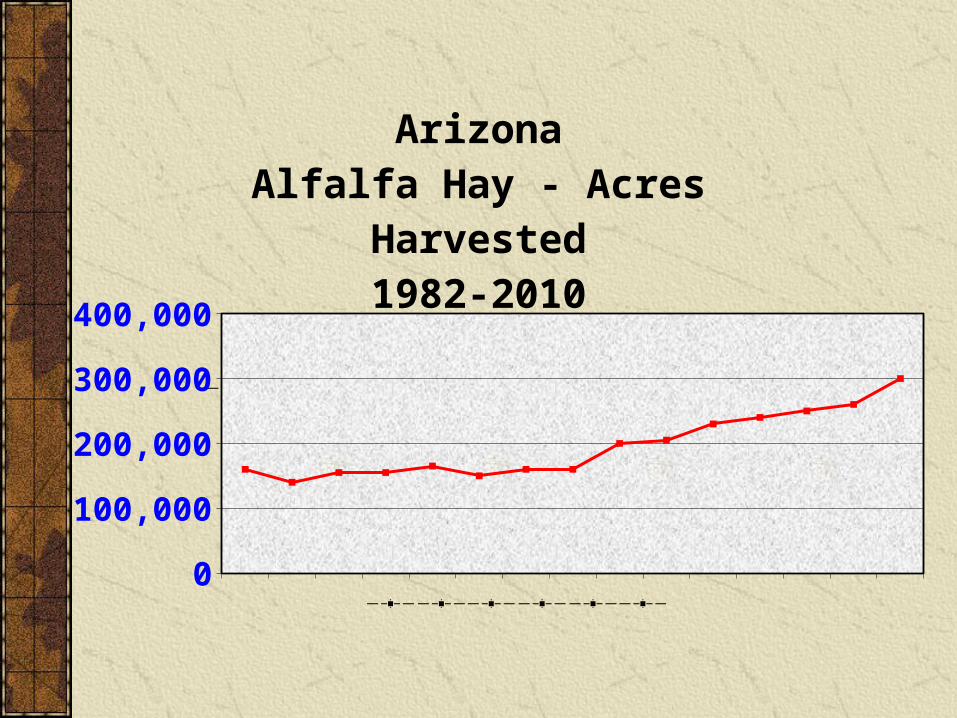
050,000
100,000150,000200,000250,000300,000350,000
ArizonaAlfalfa Hay - Acres Harvested
1982-2010
1981
1983
1985
1987
1989
1991
1993
1995
1997
1999
2001
2003
2005
2007
2009
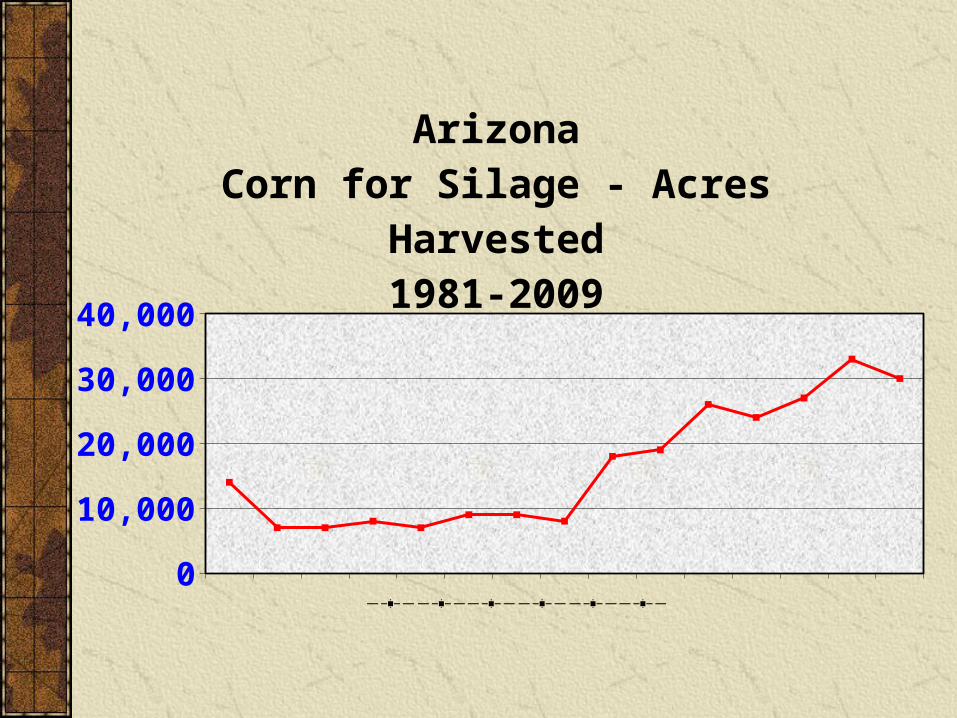
05,000
10,00015,00020,00025,00030,00035,000
ArizonaCorn for Silage - Acres Harvested
1981-2009
1989
1991
1993
1995
1997
1999
2001
2003
2005
2007
2009
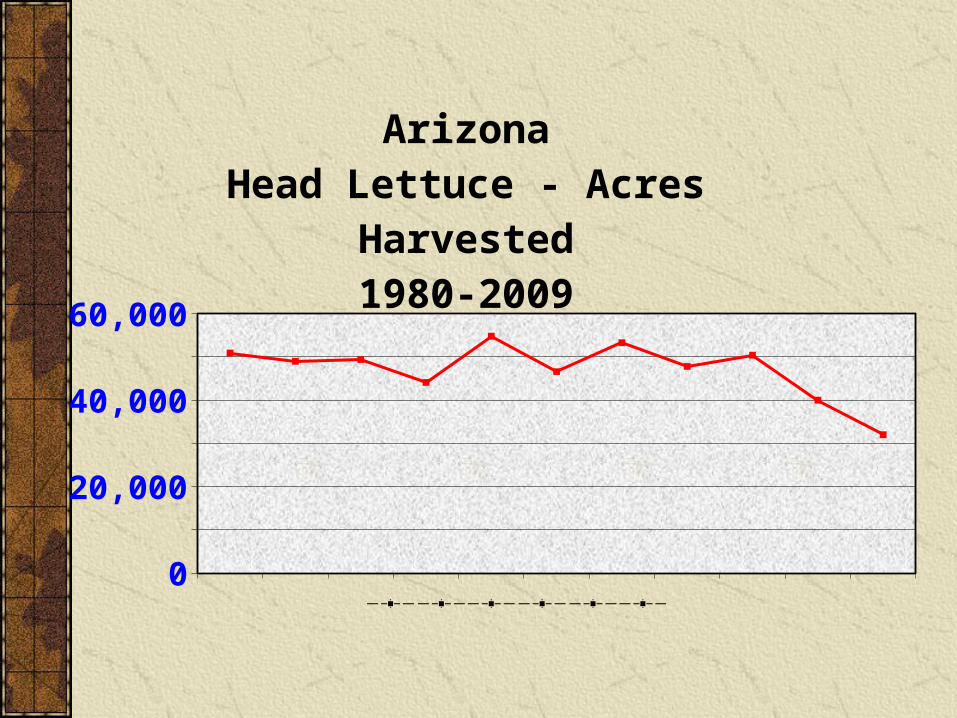
010,00020,00030,00040,00050,00060,000
ArizonaHead Lettuce - Acres Harvested
1980-2009
1993 1995 1997 1999 2001 2003 2005 2007 20090
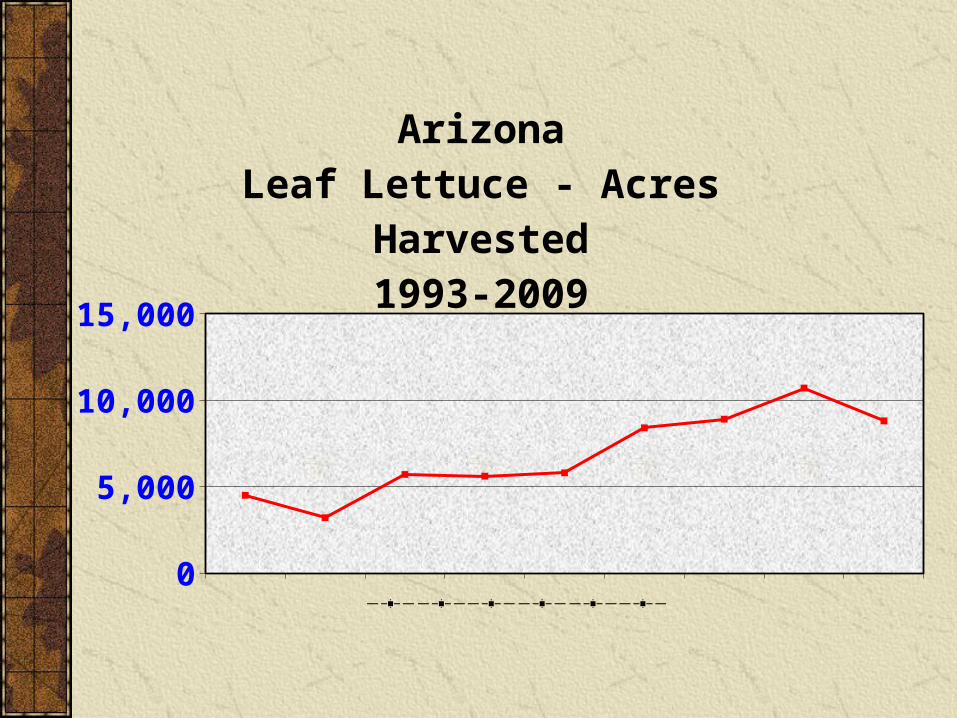
2,0004,0006,0008,000
10,00012,000
ArizonaLeaf Lettuce - Acres Harvested
1993-2009
1993 1995 1997 1999 2001 2003 2005 2007 20090
5,000
10,000
15,000
20,000
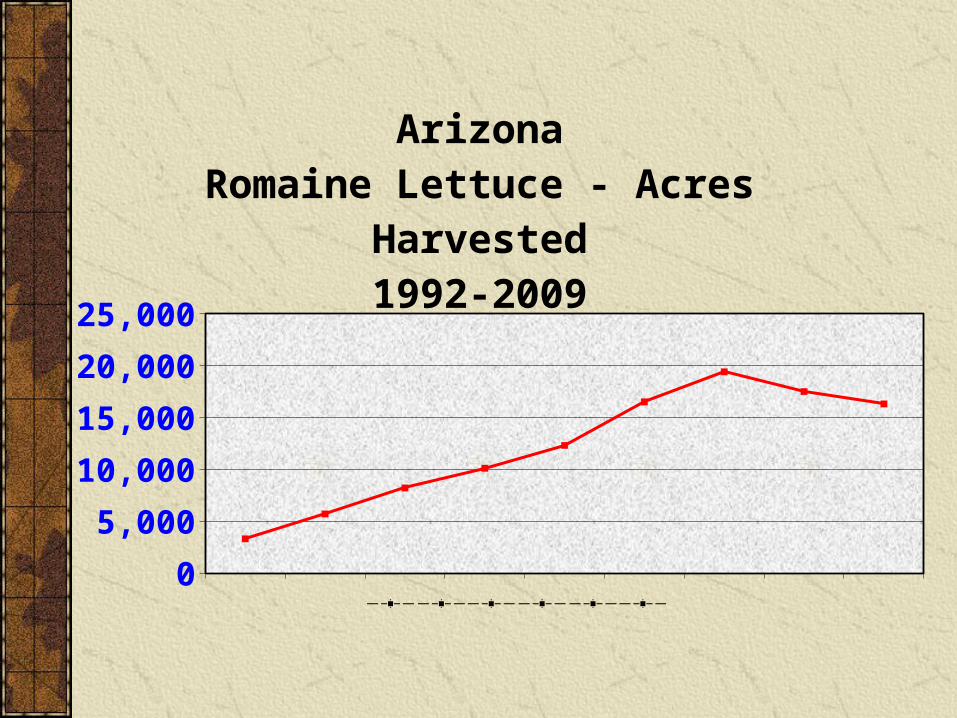
25,000
ArizonaRomaine Lettuce - Acres Harvested
1992-2009
1980
1982
1984
1986
1988
1990
1992
1994
1996
1998
2000
2002
2004
2006
2008
2009
0
4,000
8,000
12,000
16,000
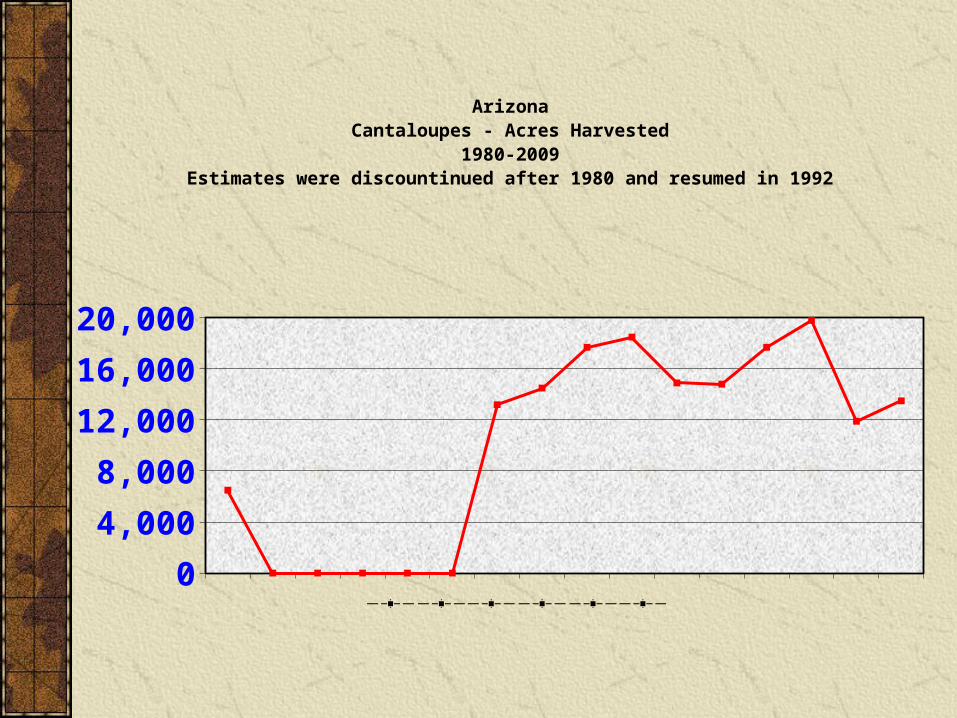
20,000
ArizonaCantaloupes - Acres Harvested
1980-2009Estimates were discountinued after 1980 and resumed in 1992
1980
1984
1988
1990
1992
1994
1997
2000
2003
2006
2009
0
1,000
2,000
3,000
4,000
5,000
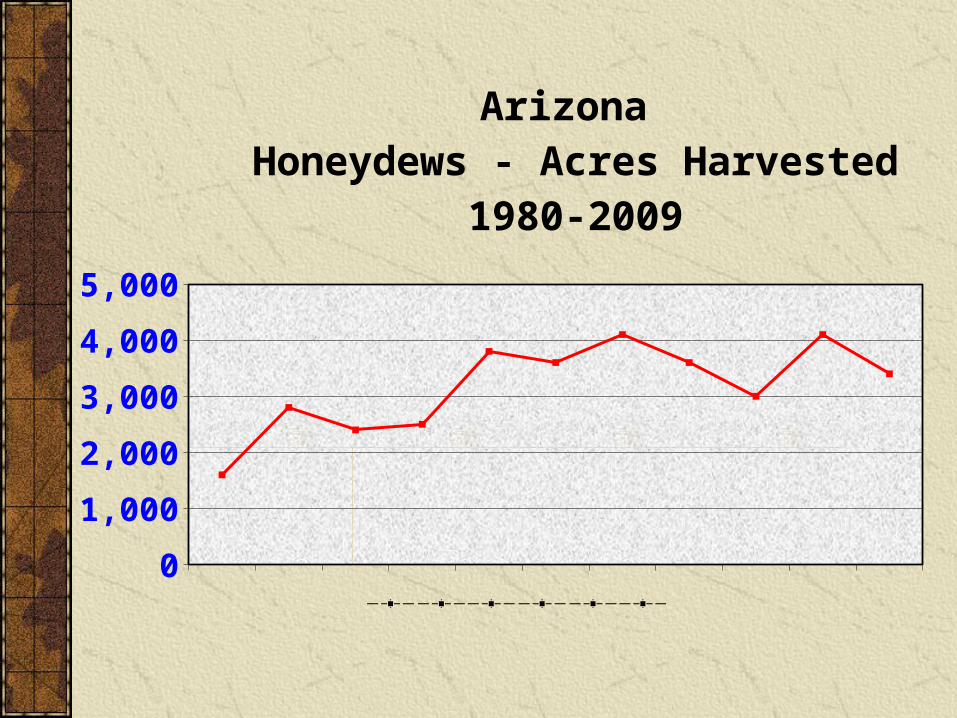
Arizona Honeydews - Acres Harvested
1980-2009
1989
1991
1993
1995
1997
1999
2001
2003
2005
2007
2009
0
5,000
10,000
15,000
20,000
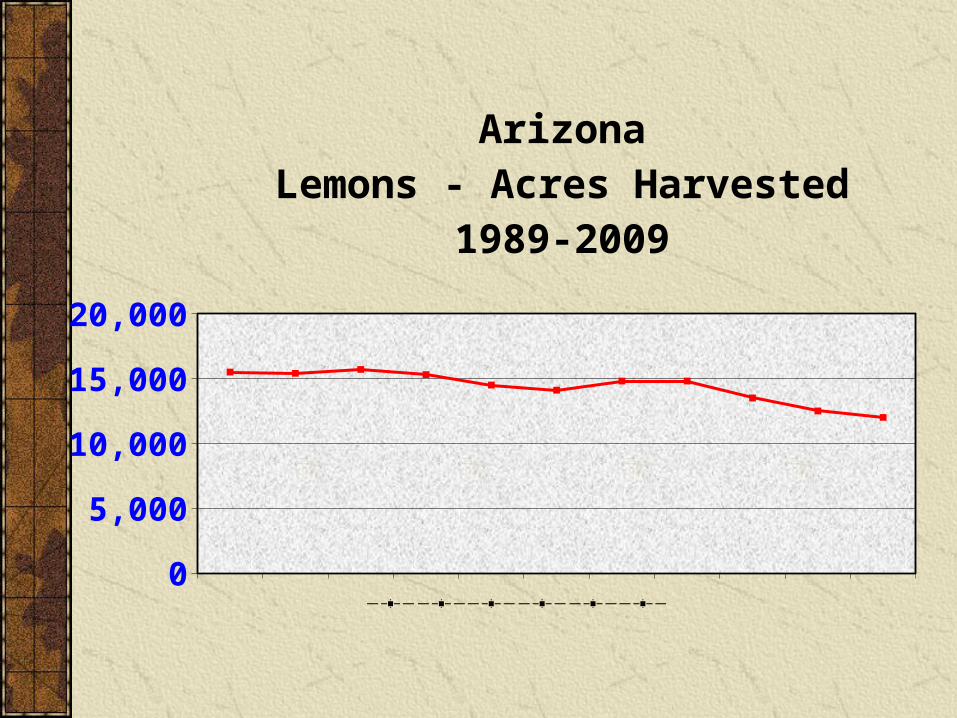
ArizonaLemons - Acres Harvested
1989-2009
1989
1991
1993
1995
1997
1999
2001
2003
2005
2007
2009
01,0002,0003,0004,0005,0006,0007,000
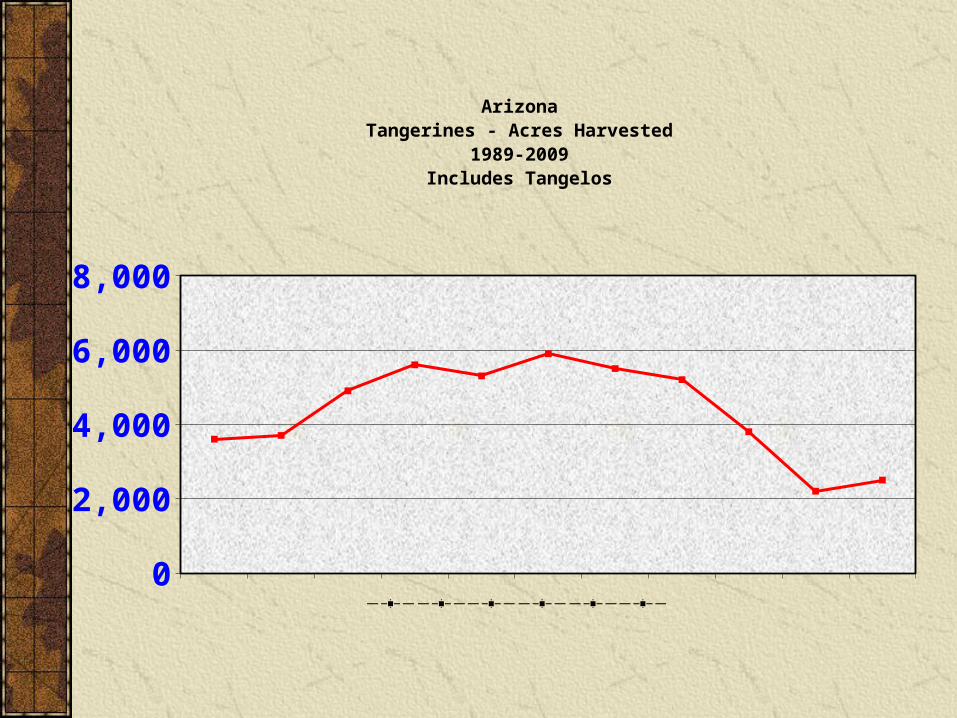
ArizonaTangerines - Acres Harvested
1989-2009Includes Tangelos
1989
1991
1993
1995
1997
1999
2001
2003
2005
2007
2009
01,0002,0003,0004,0005,0006,0007,000
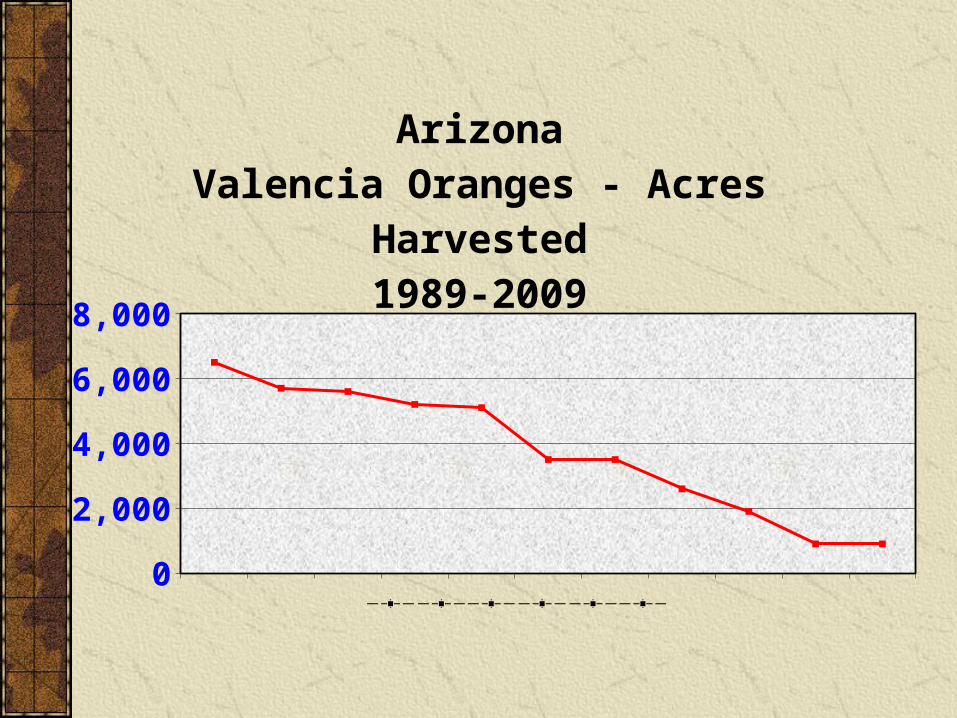
ArizonaValencia Oranges - Acres Harvested
1989-2009
1989
1991
1993
1995
1997
1999
2001
2003
2005
2007
2009
01,0002,0003,0004,0005,0006,000
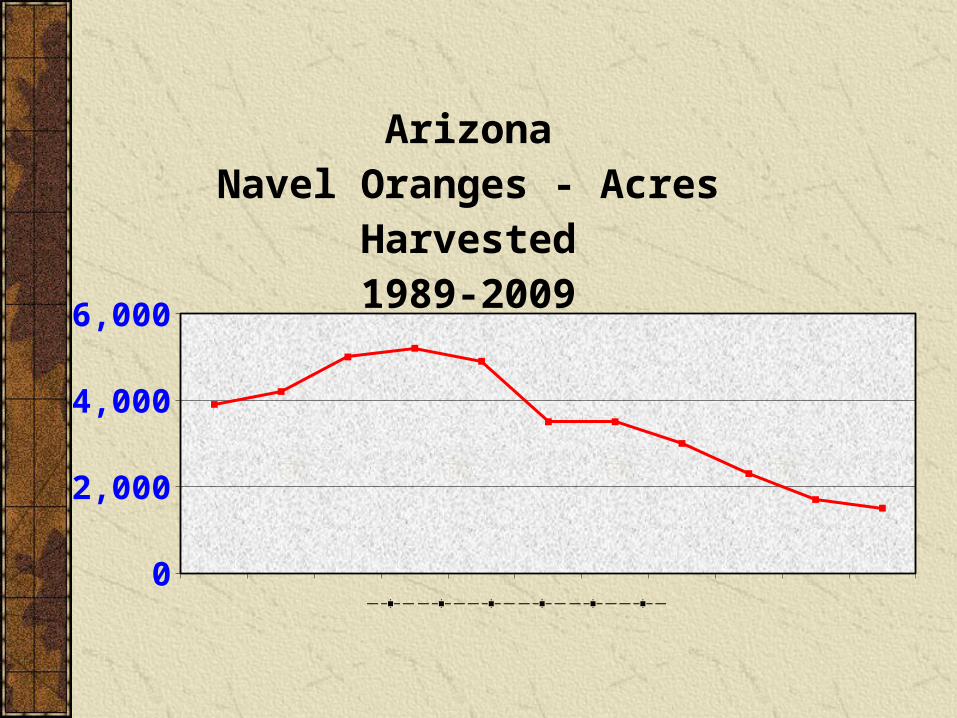
ArizonaNavel Oranges - Acres Harvested
1989-2009

1989
1991
1993
1995
1997
1999
2001
2003
2005
2007
2009
01,0002,0003,0004,0005,0006,0007,000
ArizonaGrapefruit - Acres Harvested
1989-2009
1982
1984
1986
1988
1990
1992
1994
1996
1998
2000
2002
2004
2006
2008
2010
0200,000400,000600,000800,000
1,000,0001,200,000
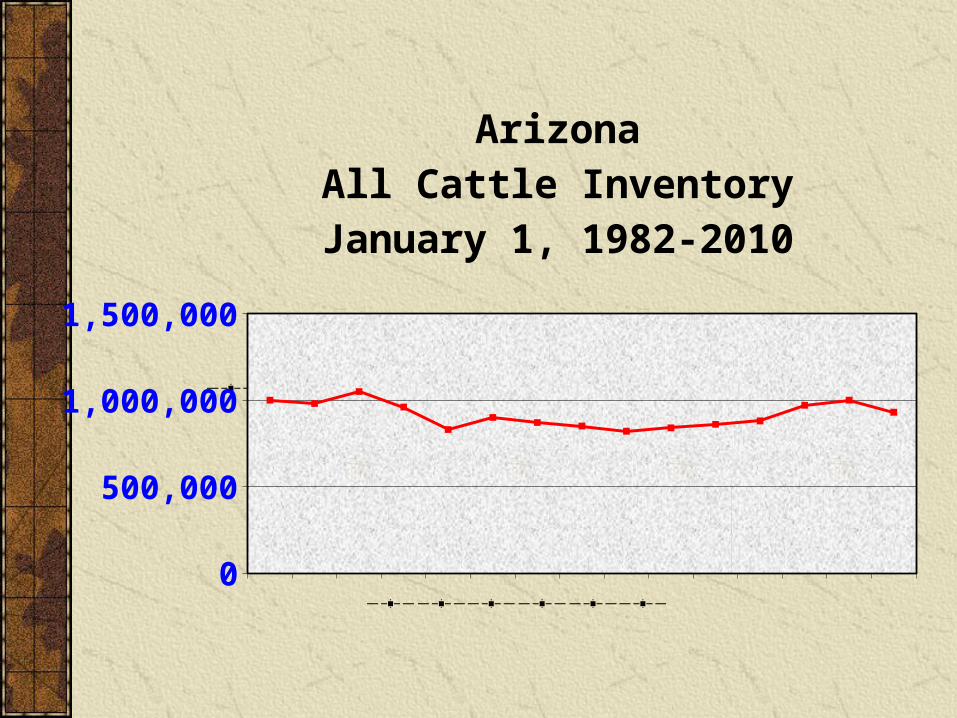
ArizonaAll Cattle Inventory
January 1, 1982-2010
1982
1984
1986
1988
1990
1992
1994
1996
1998
2000
2002
2004
2006
2008
2010
0
50,000
100,000
150,000
200,000
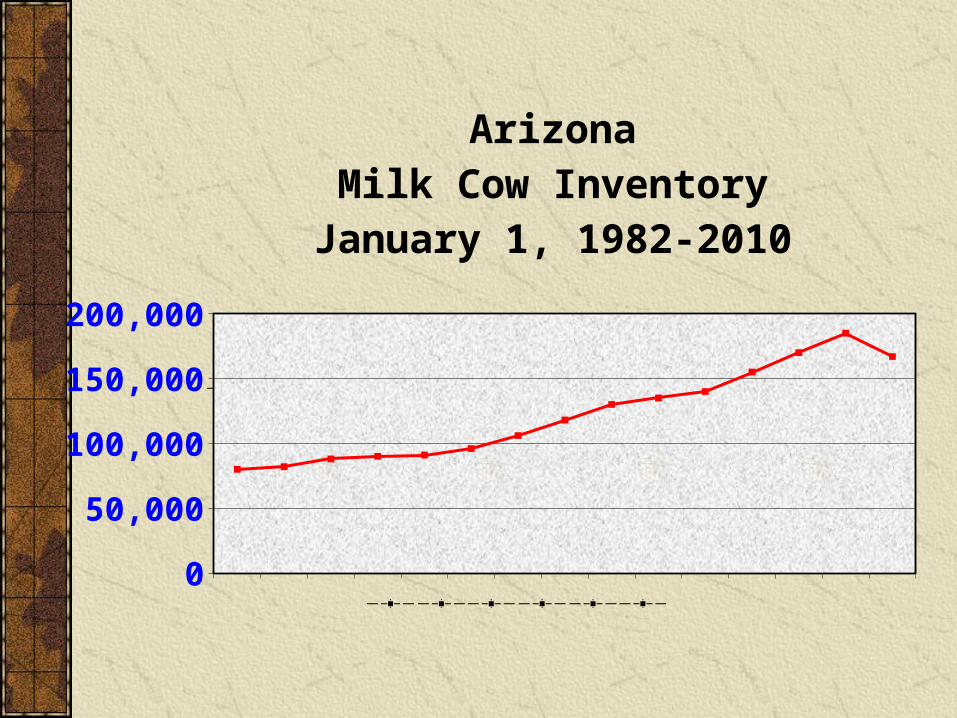
ArizonaMilk Cow InventoryJanuary 1, 1982-2010
1982
1984
1986
1988
1990
1992
1994
1996
1998
2000
2002
2004
2006
2008
2010
050,000
100,000150,000200,000250,000300,000350,000
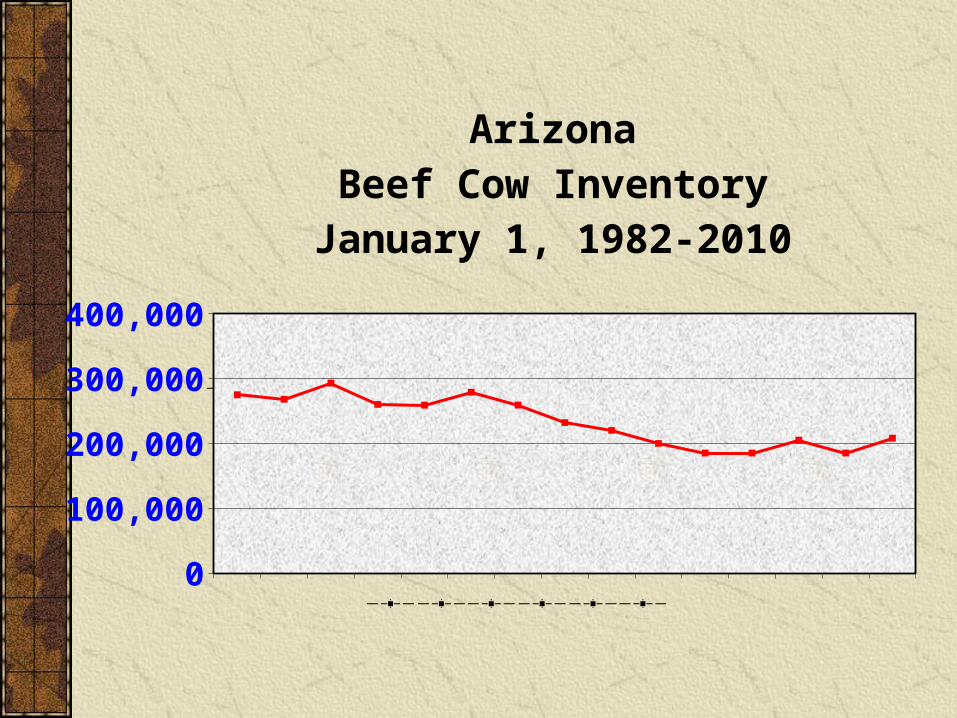
ArizonaBeef Cow Inventory
January 1, 1982-2010
1982
1984
1986
1988
1990
1992
1994
1996
1998
2000
2002
2004
2006
2008
2010
0
100,000
200,000
300,000
400,000
500,000
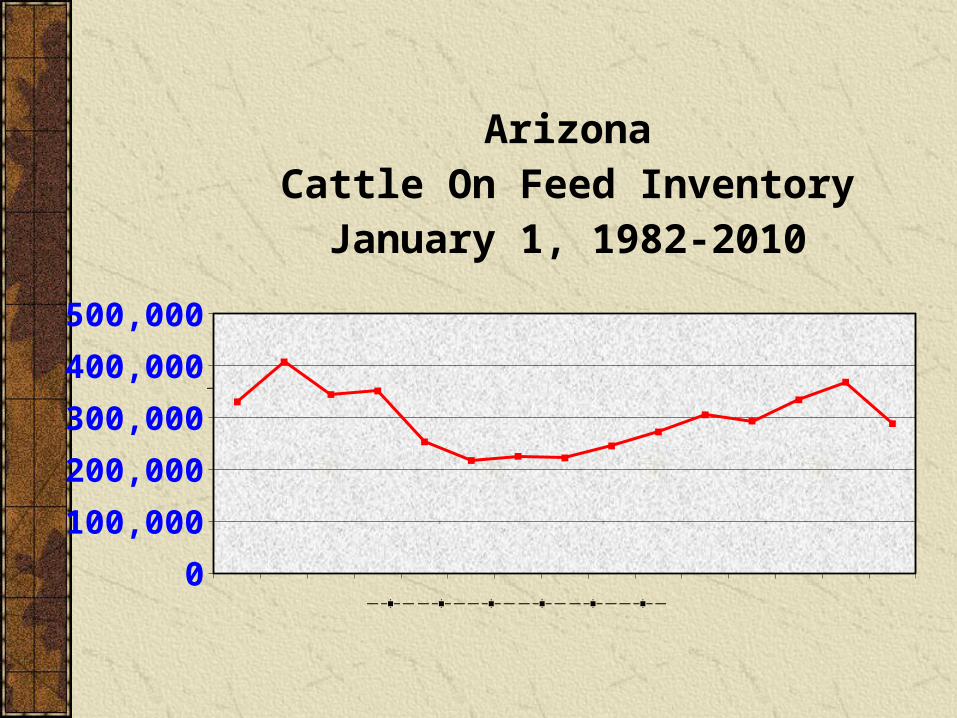
ArizonaCattle On Feed Inventory
January 1, 1982-2010