trends in transit bus accidents and promising collision ... 10-3 yang.pdftrends in transit bus...
TRANSCRIPT

Trends in Transit Bus Accidents and Promising Collision Countermeasures
119
Trends in Transit Bus Accidents and Promising Collision
CountermeasuresC. Y. David Yang, Noblis
Abstract
This article presents information on bus collisions from the National Transit Data-base (NTD) and discusses implications of the findings on the design of transit collision warning systems. A total of 2,405 major transit bus collisions were reported in 2002 and 2003 that resulted in more than $15 million in property damage, 145 fatalities, and more than 8,000 injuries. According to the NTD, front and angle transit collisions yielded higher fatality and injury rates and property damage costs compared to rear collisions. Most major bus collisions occurred in benign conditions such as clear weather and on dry roads. Therefore, emphasis should be placed on developing a warning system with the capability of continuously monitoring the bus surroundings and providing timely alerts to transit operators about crash threats in front and on either side of the bus.
IntroductionSince the 1998 Transportation Efficiency Act for the 21st Century (TEA-21), the U.S. Department of Transportation (U.S. DOT) has allocated funds to develop and test collision warning systems for alerting transit operators of impending collisions. To implement effective transit collision warning systems, a thorough understanding of transit accident types and causal factors is essential.

Journal of Public Transportation, Vol. 10, No. 3, 2007
120
The National Transit Database (NTD) holds crucial statistics that reveal important trends about the transit industry. The Safety and Security Module within the NTD contains data regarding incidents (e.g., bus collision, passenger injury, and vehicle damage and theft) reported by transit agencies. Incident records from the Safety and Security Module offer important information that can help the U.S. DOT identify key transit safety problems that may be addressed with transit collision warning systems.
In the first part of this article, an overview of the NTD and background informa-tion regarding the data analyzed is presented. Utilizing the information from the NTD enables (1) a thorough understanding of the frequencies and types of transit bus accidents and (2) identification of the causal factors for bus collisions.
The second section of this article discusses implications of the NTD findings in relation to the development of transit collision warning systems. Several projects funded by TEA-21 tested prototype systems with the capability to warn transit operators about collision threats in the front, right and left sides, and rear of a bus. If the U.S. DOT should commit resources to further develop transit collision warn-ing systems and set strategy for product implementation, the following questions need to be addressed:
• What is the most prevalent type of transit crash that can be lowered using a collision warning system? Would it be beneficial to use a warning system that has the capability to detect collision threats from all sides? Alternatively, would it be more cost effective to install a collision warning system that is dedicated to detecting certain crash types, such as a frontal collision warn-ing system?
• Are transit collisions associated with particular environmental or situational circumstances, such as weather or road conditions? If so, could collision warning systems help reduce these types of crashes?
Overview of the National Transit DatabaseBackground InformationNTD is the primary database maintained by U.S. DOT’s Federal Transit Adminis-tration (FTA) of vital statistics in the transit industry. The funding of many FTA programs and projects is based on data gathered from the NTD. Transit agencies that receive Urbanized Area Formula Program (Section 5307) grants are required

Trends in Transit Bus Accidents and Promising Collision Countermeasures
121
to submit data to the NTD. Currently, more than 600 transit agencies and authori-ties submit data to the NTD (Federal Transit Administration 2002, 2003).
FTA reevaluated the structure of the NTD in 2000 and 2001 and redesigned it to better serve NTD users and reporters, including many modifications of the Safety and Security Module. The Safety and Security Module of the NTD has two forms for reporting incidents such as bus accidents and crimes that occur on transit vehicles: Major Incident Reporting form (S&S-40) and Non-Major Summary Report form (S&S-50). Transit agencies and authorities began to report transit incidents to the newly designed NTD in 2002.
The Major Incident Reporting form gathers detailed information on the most severe safety and security incidents occurring in the transit environment, and includes detailed data from sources such as transit agency and police reports. For transit buses, an incident is considered “major” when one or more of the following conditions occurred (Federal Transit Administration 2002, 2003):
1. a fatality other than suicides;
2. injuries requiring immediate medical attention away from the scene for two or more persons;
3. property damage equal to or exceeding $25,000 (for both transit and non-transit vehicles and property);
4. an evacuation of a transit vehicle due to life safety reasons such as fire and fuel leak;
5. a collision at a grade crossing resulting in an injury or property damage equal to or exceeding $7,500.
The transit agency is responsible for completing a Major Incident Reporting form for each major incident that occurs. To do so, transit agencies log onto the NTD website (www.ntdprogram.com) and complete the form on-line.
The Non-Major Summary Report form (S&S-50) summarizes less severe safety and security transit incidents that are not reported on the Major Incident Reporting form. One Non-Major Summary Report form is completed per reporting period.
NTD results presented in this article are limited to the Major Incident Reporting records because these records have detailed transit bus incident information, allowing in-depth analyses of them.

Journal of Public Transportation, Vol. 10, No. 3, 2007
122
Breakdown of Major Incident Reporting RecordsTransit incidents reported in the Major Incident Reporting form can be placed into one of several categories: (a) collision, (b) security incident, (c) derailment, (d) evacuation, (e) fire, (f) vehicle leaving roadway, and (g) fatality/injury not oth-erwise classified.
Table 1 presents the number of major bus incident records and total property damage cost (i.e., the dollar amount required to repair or replace all vehicles or public/private property damaged in a transit collision) in 2002 and 2003. The total number of major bus incidents in 2003 decreased 5.8 percent from 2002, due to a drop of three incidents in the Collision category and 80 incidents in the Other category. However, the total damage property cost in 2003 exceeded the 2002 cost by 2.4 percent.
Table 1 also lists the number of fatalities and injuries that resulted from major bus incidents. In 2003, 99 fatalities were associated with bus incidents, an increase of 18.2 percent from the fatalities in 2002. In contrast, the total number of injuries in 2003 dropped 2.8 percent compared to the 2002 total.
Table 1. Breakdown of 2002 and 2003 Major Bus Incident Records

Trends in Transit Bus Accidents and Promising Collision Countermeasures
123
If a reported transit incident is a collision, the agency is responsible for completing a Collision Detail sub-form within the Major Incident Reporting form, includ-ing information on the collision type. Transit collisions can be grouped into the following: front, back, angle, sideswipe, fixed object, and other (Federal Transit Administration 2002, 2003). Figure 1 illustrates the locations of front, back, angle, and sideswipe collisions when a transit vehicle collides with other vehicles. When reporting information, choice of collision type is always from the point of view of the transit vehicle.
Figure 1. Collision Type from the Perspective of the Transit Vehicle

Journal of Public Transportation, Vol. 10, No. 3, 2007
124
Key Results and DiscussionTypes of Collisions from the Major Incident Reporting RecordsTable 2 presents a breakdown of the major incident collision records by type from the 2002 and 2003 NTD. Several notable changes from 2002 and 2003 are listed below.
1. Of the major bus collisions recorded in the NTD, frontal collisions occurred most frequently, followed by back, angle, and sideswipes. From 2002 to 2003, the number of sideswipe collisions increased more than other collision types with the associated property damage increasing more than 46 percent. In contrast, the number of rear bus collisions and associated property damage cost dropped slightly in 2003.
2. Major bus collisions that occurred in 2003 generated 11 more fatalities compared to 2002, an overall increase of 14 percent. Of the five collision categories, angle collision had the biggest increase in fatality, from 16 in 2002 to 20 in 2003.
3. Total injuries recorded in the 2003 NTD decreased by 7.5 percent compared to the 2002 numbers; in particular, injuries caused by frontal bus collision reduced significantly (24.2%) in 2003. However, injuries related to sideswipe, angle, and fixed object collisions all increased slightly in 2003.
Figure 2 presents the average property damage costs of various bus collision types in 2002 and 2003. Each cost value is normalized by counts of respective collision type. Although frequencies of transit collisions with fixed objects are low, the average property damage cost for collisions with fixed objects is more than double that of the costs associated with the other four collision types. Average property damage costs for front, sideswipe, and angle collisions are comparable, but for rear collisions, the average cost is approximately $1,400 lower.
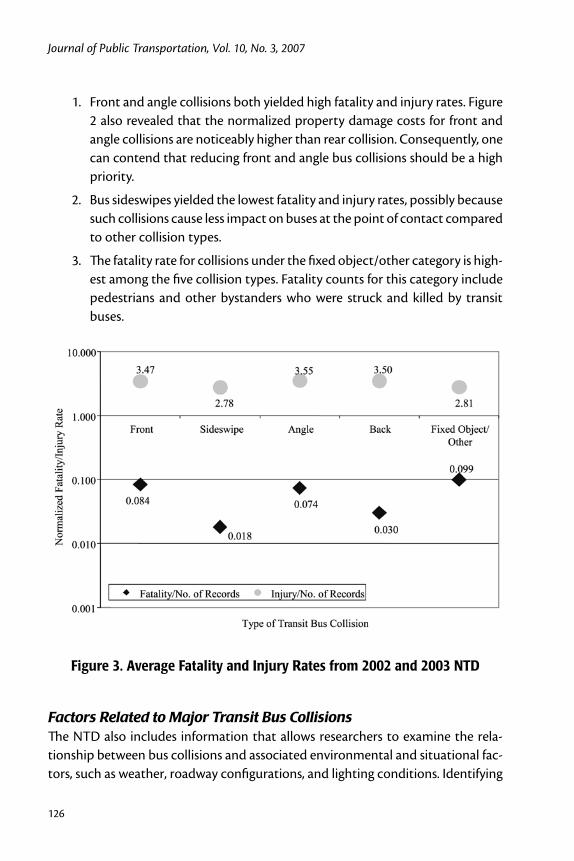
Figure 3 presents the average fatality and injury rates for the five bus collision cat-egories. These average values are plotted on a logarithmic scale to better illustrate the rate difference between the collision types. Several interesting observations are noted.

Trends in Transit Bus Accidents and Promising Collision Countermeasures
125
Table 2. Breakdown of Collision Types— 2002 and 2003 Major Incident Records
Figure 2. Average Normalized Property Damage Costs
from 2002 and 2003 NTD
Journal of Public Transportation, Vol. 10, No. 3, 2007
126
1. Front and angle collisions both yielded high fatality and injury rates. Figure 2 also revealed that the normalized property damage costs for front and angle collisions are noticeably higher than rear collision. Consequently, one can contend that reducing front and angle bus collisions should be a high priority.
2. Bus sideswipes yielded the lowest fatality and injury rates, possibly because such collisions cause less impact on buses at the point of contact compared to other collision types.
3. The fatality rate for collisions under the fixed object/other category is high-est among the five collision types. Fatality counts for this category include pedestrians and other bystanders who were struck and killed by transit buses.
Figure 3. Average Fatality and Injury Rates from 2002 and 2003 NTD
Factors Related to Major Transit Bus CollisionsThe NTD also includes information that allows researchers to examine the rela-tionship between bus collisions and associated environmental and situational fac-tors, such as weather, roadway configurations, and lighting conditions. Identifying

Trends in Transit Bus Accidents and Promising Collision Countermeasures
127
such factors enables one to understand the underlying causes for collisions and potential countermeasures.
Table 3 presents a breakdown of bus collision records by the five collision catego-ries and seven factors (time of day, type of intersection control, weather, lighting condition, roadway condition, roadway configuration, and roadway type). Inter-pretations of the results presented in Table 3 are provided below.
1. Time of Day. Table 3 shows that the number of collisions during PM hours is approximately twice that in the AM hours. This finding is expected since more core hours of bus operation are in the PM time period (i.e., 1 PM to 7 PM), than in the AM period.
2. Type of Intersection Control. Since the majority of bus routes are located in urban areas where many intersections are controlled by either traffic signals or stop signs, it is expected that a high percentage of bus collisions would occur at/near traffic signals and stop signs. Further, urban intersections with pedestrians crossing streets and vehicles maneuvering in and out of lanes is likely to increase the probability of being involved in collisions. Consistent with the expectation, more than 80 percent of major bus collisions reported in the NTD occurred at/near intersections controlled by a traffic signal or stop sign.
3. Weather. The effect of bad weather (i.e., fog, cloudy, rain, and snow) seems to have minimal impact on the major transit collision—more than three quarters of major bus collisions occurred when weather was clear. This obser-vation is consistent with the crash statistics, for all vehicle types, found in the National Highway Traffic Safety Administration’s Fatality Analysis Reporting System (FARS) and General Estimates System (GES) databases, which show that more than 80 percent of crashes occurred in normal weather conditions (National Highway Traffic Safety Administration 2001, 2002).
4. Lighting Condition. More than 90 percent of bus collisions occurred in well-lit situations (i.e., daylight and dark with street lights). FARS and GES data showed a similar trend where more than 80 percent of crashes (all vehicle types) occurred when the lighting condition is either daylight or “dark, but lighted” (National Highway Traffic Safety Administration 2001, 2002). One possible explanation of this observation is that in the early morning and late evening hours when outside visibility is limited, transit operators may be more attentive to the driving environment. As a result, the probability of being involved in collisions decreases.

Journal of Public Transportation, Vol. 10, No. 3, 2007
128
Tabl
e 3.
Bre
akdo
wn
of B
us C
ollis
ion
Rec
ords
by
Vari
ous
Fact
ors

Trends in Transit Bus Accidents and Promising Collision Countermeasures
129
1. T
otal
maj
or in
cide
nt re
cord
s for
bus
col
lisio
ns fr
om th
e 20
02 a
nd 2
003
NTD
is 2
,405
. How
ever
, not
ever
y re
cord
has
com
plet
e in
form
atio
n; c
onse
quen
tly, t
otal
for o
ne fa
ctor
may
be
diffe
rent
com
pare
d to
anot
her f
acto
r.

Journal of Public Transportation, Vol. 10, No. 3, 2007
130
5. Roadway Condition. Bus collisions occurred predominately when the road surface is dry. There are two likely explanations for this finding: (1) when the road is covered with snow or the surface is wet, transit operators may drive more cautiously and as a result are less likely to be involved in collisions; (2) the exposure of buses, by vehicle miles traveled, to dry roads is much higher compared to wet, snow, or icy road surfaces.
6. Roadway Configuration. Buses drove on straight roads more often than any other roadway configurations; consequently, it is not surprising to find that most of the major transit collisions occurred on straight roads compared to curve roads, uphill, or downhill. Furthermore, many transit operators probably drive conservatively and are less likely to be involved in major collisions when traveling in “unconventional” road configurations such as going downhill.
7. Roadway Type. More bus collisions occurred at intersections and divided highways than other roadway types combined. This finding is understand-able because most bus operations occur in and around urban environments that are dominated by these two roadway types. Additionally, driving on urban roads with pedestrians crossing streets and vehicles maneuvering in and out of lanes are likely to increase the probability of being involved in collisions.
Based on the results presented in Table 3, it can be concluded that many major transit bus collisions occurred in benign environmental conditions—clear weather, daylight hours, dry road surface, and straight roadway. These findings point to the fact that transit collision warning systems should be designed to assist transit operators in normal, everyday driving conditions instead of focusing on specific situations. For example, a collision warning system that focuses only on adverse weather conditions would not be a cost-effective investment and will only have limited use.
Implications of the ResultsCountermeasures for Transit CollisionsThe U.S. DOT has sponsored a number of projects in the past several years to develop and test new technologies with the goal to further reduce transit colli-sions (Yang et al. 2003). These new technologies utilize radar, lidar (which is similar to radar but works at near-infrared wavelengths), video, or ultrasonic sensor to

Trends in Transit Bus Accidents and Promising Collision Countermeasures
131
detect potential driving hazards and issue warnings to bus operators. Three of these countermeasure technologies are described below.
1. Obstacle Detection System (ODS). This system monitors the area in close proximity to the vehicle and is designed to serve as an extension of the driver’s mirrors by detecting objects that are not within the view of the bus operator. Ultrasonic sensors used in ODS are installed at the front corners and sides of the bus. These sensors transmit signals and detect objects based on recognizable echoes reflected from surrounding objects. In a slow urban driving environment between 0 to 15 mph, the ODS can detect objects within a 4-foot perimeter of each sensor. During highway driving of more than 45 mph, ODS has a detection zone of 8 feet. ODS issues both visual and auditory warnings to bus operators upon detecting potential objects in the vehicle’s path. The warning consists of a flashing display, followed by an auditory tone (via a speaker mounted behind the operator’s seat) if the threat of the object increases. In 2001, the Port Authority of Allegheny County in Pittsburgh, Pennsylvania, conducted a field operational test by installing 100 of its buses with a side obstacle detection system. During the nine-month field test period, the Port Authority of Allegheny County experienced a reduction in accidents and associated claims (Tate et al. 2003). Additionally, the majority of transit operators who participated in the field test stated that the technology was helpful in detecting objects in blind spots.
2. Integrated Collision Warning System (ICWS). This countermeasure integrated two separate collision warning systems, a Forward Collision Warning System (FCWS) and a Side Collision Warning System (SCWS), into a single product (University of California PATH and Carnegie Mellon University Robotics Institute 2006). The FCWS consisted of two forward-looking radar sensors installed on the right and left front corners of the bus and forward-looking lidar sensors mounted at the center of the bus. These sensors work in tandem to enhance the detection capabilities. The sensors measure the distance and angle to the detected object and are capable of detecting obstacles within the same lane from 3 to 100 meters. The SCWS was developed to track objects surrounding the bus (i.e., within a 3-meter perimeter), but is capable of detecting objects up to 50 meters away. SCWS has laser scan-ners for object detection and equipment for curb detection and prediction. Based on results of the field operational test, the prototype ICWS showed potential to improve the safety of transit operation by alerting bus opera-

Journal of Public Transportation, Vol. 10, No. 3, 2007
132
tors of driving hazards. The test also showed that the ICWS had an effect on driving behavior; operators who participated in the field operational test tended to drive more conservatively by increasing their car following gaps and having fewer hard brakes.
3. Transit Integrated Vehicle Based Safety System (Transit IVBSS). The U.S. DOT began another major initiative in 2005, referred to as the Integrated Vehicle Based Safety System. The IVBSS project aims to test and develop collision warning systems for transit buses, light vehicles, and heavy trucks (U.S. Department of Transportation 2006). According to preliminary results and the fact that many transit bus activities take place in urban settings, with potential for numerous front and side movement conflicts, it is possible that transit IVBSS can significantly reduce maneuver conflicts and subse-quent collisions. NTD results reported in this article show that front and angle transit collisions produced higher property damage, fatality rates, and injury rates compared to rear collisions. Consequently, emphasis should be placed on developing and implementing a collision warning system with the capability to alert transit operators about crash threats in front and on the sides of the bus. Appropriately, the project goal of transit IVBSS is to develop such a system.
A Collision Warning System for Everyday UseTable 3 shows that many transit collisions occurred in benign environmental conditions. Therefore, it can be concluded that an effective transit collision warn-ing system needs to be able to continuously monitor the bus surroundings and provide timely alerts of potential crash threats to transit operators in normal conditions. It is possible that drivers are less vigilant when driving in benign condi-tions, such as in clear weather or on straight roadways. As a result, a driver may not be prepared to react to a sudden changing traffic event, as in the case of a lead vehicle slowing or stopping unexpectedly. The data do not support developing a system geared for poor conditions (e.g., adverse weather). During unfavorable driving conditions, the data suggest that transit operators are focused and drive cautiously to minimize the chances of getting involved in accidents.
Impacts Beyond the NumbersAn effective countermeasure has great potential to reduce bus collisions. As a result, injuries, fatalities, and the overall operating cost of transit agencies will decrease. Cost savings from lower bus accident rates can then be invested in other

Trends in Transit Bus Accidents and Promising Collision Countermeasures
133
aspects of transit operations and maintenance. However, the impact of fewer bus collisions is beyond the financial savings and fewer injuries and fatalities.
Lowering the number of bus accidents with use of transit collision warning sys-tems could also generate the following benefits:
• Transit operators have more confidence and become less stressful driving large buses in and around congested urban environments.
• Human resource/workforce at transit agencies will become available to address other needs instead of dealing with accident-related issues.
• Positively impact the public’s perception of transit, thereby promoting transit’s image and growth.
Closing RemarksUsing information extracted from the NTD, fatalities and injuries from 1991 to 2001, normalized by passenger miles, are presented in Figure 4 (Powers 2002; Yang 2004). Both injury and fatality rates have remained fairly steady during the 11-year span even though many resources have been devoted to train and prepare transit employees and educate the public about transit safety (Yang 2004). In an effort to continue to reduce transit accidents and improve travel safety, collision warn-ing systems that issue timely alerts to transit operators about imminent collision threats are viewed as having good potential to further cut down injury and fatality rates.
Utilizing the NTD, results presented in this article offer useful information about transit accident trends in the United States and factors that are associated with bus collisions. However, it is important to note the following limitations of the NTD:
• The dataset does not capture all transit accidents. Minor accidents such as “fender benders” that do not meet the minimal reporting criteria of NTD are not included in the database.
• The cost data reported in the NTD are limited to property damages. Asso-ciated costs, such as medical expenses for treating injured employees and passengers and administration expenses for filing paper work and replacing transit operators, are not reflected in the NTD cost data.
• Quality and detail of the information being reported in the NTD may not be consistent because staff and resources devoted to enter information in

Journal of Public Transportation, Vol. 10, No. 3, 2007
134
NTD vary from one transit agency to the next. Some NTD records have large numbers of missing information.
Source: Powers 2002; Yang 2004.
Figure 4. Bus Fatalities and Injuries Normalized by Passenger Miles
Due to reasons listed above, a transit agency that is considering implementing a collision warning system should perform a detailed accident data analysis to supplement the findings presented in this study. Results from such analysis will help the transit agency identify specific bus collision challenges that need to be addressed and develop a strategic plan for implementation. In addition, more precise benefit estimates can be calculated from a detailed accident analysis using specific cost information.
Acknowledgements
Much of the information presented in this article is based on a project funded by the U.S. Department of Transportation. The author acknowledges his colleagues at

Trends in Transit Bus Accidents and Promising Collision Countermeasures
135
Noblis, Dr. Kathryn Wochinger and Mr. Daniel Cohen, for their review comments which improved the quality of this article.
References
Federal Transit Administration. 2002. National Transit Database 2002 reporting manual. Available at http://www.ntdprogram.com.
Federal Transit Administration. 2003. National Transit Database 2003 reporting manual. Available at http://www.ntdprogram.com.
National Highway Traffic Safety Administration. 2001. Traffic safety facts 2000: A compilation of motor vehicle crash data from the Fatality Analysis Reporting System and the General Estimates System (DOT HS 809 337). Washington, DC: U.S. Department of Transportation.
National Highway Traffic Safety Administration. 2002. Traffic safety facts 2001: A compilation of motor vehicle crash data from the Fatality Analysis Reporting System and the General Estimates System (DOT HS 809 484). Washington, DC: U.S. Department of Transportation.
Powers, G. 2002. Transit safety & security statistics and analysis: 2000 annual report. FTA-MA-26-5011-02-1. Washington, DC: U.S. Department of Transportation.
Tate, W. H., J. E. Orban, H. M. Clark, and T. J. Luglio. 2003. Evaluation report: Driver experience with the enhanced object detection system for transit buses. FHWA-OP-04-061/FTA-TRI-11-2003.2. Washington, DC: U.S. Department of Trans-portation.
University of California PATH and Carnegie Mellon University Robotics Institute. 2006. Integrated collision warning system final evaluation report. FTA-PA-26-7006-04.1. Washington, DC: U.S. Department of Transportation.
U.S. Department of Transportation. 2006. Integrated vehicle based safety system. Available at http://www.its.dot.gov/ivbss/index.htm. Accessed April 20, 2006.
Yang, C. Y. D., B. P. Cronin, N. R. Meltzer, and M. E. Zirker. 2003. 2003 status report on transit intelligent vehicle initiative studies. FHWA-OP-03-092/FTA-TRI-11-2003.1. Washington, DC: U.S. Department of Transportation.

Journal of Public Transportation, Vol. 10, No. 3, 2007
136
Yang, C. Y. D. 2004. Understanding transit accidents using the National Transit Database and the role of transit intelligent vehicle initiative technology in reduc-ing accidents. FTA-TRI-11-04.1/ FHWA-JPO-04-042. Washington, DC: U.S. Department of Transportation.
About the Author
C. Y. David Yang ([email protected]) received his Ph.D. in civil engineering from Purdue University and is currently a principal at Noblis. Results presented in this article were based on a project conducted by Dr. Yang when he was a senior research engineer at the U.S. Department of Transportation’s Volpe National Transportation Systems Center. Dr. Yang’s recent research work focuses on driver behavior, transportation safety, vehicle crash data, and vehicle safety systems. He serves on the editorial board of the Journal of Intelligent Transportation Systems and is a member of Transportation Research Board’s Traffic Law Enforcement Commit-tee and User Information Systems Committee.