trends in the use of management science techniques in capital budgeting
TRANSCRIPT

MANAGERIAL AND DECISION ECONOMICS, VOL. 10, 135-140 (1989)
Trends in the Use of Management Science Techniques in Capital Budgeting
RICHARD PIKE
and JOHN SHARP
Provident Financial Group, Professor of Finance and Accounting, University of Bradford, Bradford, UK
Senior Lecturer in Management Science, University of Bradford, Bradford, UK
This paper examines trends in the use of management science techniques for capital investment decisions based on three surveys conducted on the same 100 large UK firms between 1975 and 1986. A strong increase in the uptake of these techniques is reported, which may partly be explained by the recent developments in end-user computing and investment software. The logistic forecasting model is employed to examine the trend and to forecast usage in the 1990s.
INTRODUCTION
Capital budgeting has, over the years, provided the focus of considerable attention within the manage- ment science literature. This is hardly surprising: or- ganizations, operating within tight capital constraints, seeking to attain specified goals through putting large capital sums at risk for long periods of time offer a near-ideal setting for a wide variety of management science applications.
The important early work in discounted cash flow analysis, risk and uncertainty analysis, capital ratio- ning, etc. has now been espoused by a generation of academics. This gives rise to the obvious question: to what extent are management science-related techni- ques employed within larger UK firms today?
The question is, of course, not a new one. State-of- the-art empirical surveys on the use of capital budge- ting techniques appear with some regularity in the literature. (See, for example, Boersema, 1978; Gitman et al., 1977; Klammer, 1972; Petty et al., 1975 for the American scene, and Carsberg and Hope, 1976; West- wick and Shohet, 1976; Pike, 1983; Scapens et af., 1981 for the UK position.)
While such surveys have their own distinctive con- tribution to make, collectively they offer a confusing and sometimes distorted view of the state of the art and how it is developing. First, the surveys from which the data were drawn are frequently so dissimilar as to invalidate any comparison and, second, the use of mailed questionnaire surveys means that results are inflated by response bias-users of ‘sophisticated’ in- vestment techniques being more likely to respond than those of ‘naive’ methods.
RESEARCH AIMS
The main aims of this paper are threefold:
(1) To report on the use of management science applications in capital budgeting with a sample of larger UK firms and to examine how these practi- ces have changed within these firms since 1975;
(2) To explain the change in the use of management science applications over time in terms of a com- monly used forecasting model; and
(3) To apply the model to forecast their usage in the early 1990s.
Reliable estimates of the state of the art in capital budgeting are of interest to many parties. For the researcher it provides a platform for other relevant research. For the businessman it permits an assess- ment of his firm’s practices against more generally held approaches, and gives useful information for training and software development requirements.
SAMPLE
The survey was conducted at two points in time. In 1980/81 a survey was conducted on the 208 largest UK-quoted companies (measured in terms of market capitalization). Respondents were requested to indi- cate current practices and those in use five years earlier. Any response errors that might arise in the recall of past practices may reasonably be assumed to occur randomly rather than systematically, and not therefore give rise to significant bias. During 1986 the
01 43-6570/89/020135-06$05.00 0 1989 by John Wiley & Sons, Ltd.

136 RICHARD PIKE A N D JOHN SHARP
same survey was distributed to the firms participating in the 1980/81 survey. Between the two surveys ten organizations were lost from the sample as a result of amalgamations and liquidations, giving rise to the following samples and response rates:
1980/8 1 1986 Sample firms 208 140 Usable responses 150 100 Response rate 72.1 ‘/o 71.4%
In both years the usable response rate achieved was in the region of 72%, well above that of any other mailed survey known to the authors. To ensure compara- bility, this study is restricted to examining the invest- ment practices on the same 100 firms in 1975, 1980/81 and 1986. Because of the timing of the two studies, our results effectively cover changes in usage over two consecutive time periods, each 5: years in length. Although the survey specifically excluded smaller- sized firms, the annual capital expenditure of respon- ding organizations varied widely:
Size of capital budget € m
Below 5 24 5-25 23
25-50 21 50-plus 32
Similarly, the distribution between the stock ex- change classes chosen for the sector analysis in 1980/8 1 proved to be relatively evenly spread with the ex- ception of the wide capital goods definition, which covers about one-third of the firms:
Number offirms
Sector Number of firms Capital goods 34 Consumer durables 10 Food and drink 18 Retail and stores 16 Oil and chemicals 13 Other 9
100
SURVEY RESULTS
A summary of the findings on the use of management science techniques in capital budgeting is given in Tables 1-3.
DCF methods, of which the main variants are the internal rate of return (IRR) and net present value (NPV) methods, are now standard practice for large firms. However, as Table 1 makes clear, in terms of regularity of use the IRR is more popular42Y0 ‘always’ use IRR compared with only 23% for NPV. Both methods have greatly increased in popularity since 1975, the NPV method more than doubling in
usage over that period. Although discounted cash flow/analysis first came to prominence in the early 1950s (for example, Dean, 1951) it is only in very recent years that it has become a major evaluation technique for larger firms. Many of the earlier capital budgeting studies discussed the wide gap between investment theory and practice (for example, Churchman, 1964; Klammer, 1972; Sundem, 1974). This gap has now considerably narrowed as far as DCF usage is concerned.
Easily the most commonly found method for assessing risk is sensitivity analysis-the impact on investment expected outcomes of changes in critical assumptions. The rapid diffusion in its application to its current level of 72% is undoubtedly one of the many benefits derived from the considerable increase in relatively inexpensive spreadsheet packages on micros.
A common feature of prior surveys (Klammer, 1972; Pike, 1983) is the reluctance among managers to move beyond single-point estimates. Table 2 indicates that between 1981 and 1986 a strong movement took place among firms in assigning probabilities to possible outcomes. Some 40% of responding firms conduct probability analysis, although most do so only ‘rarely’ (Table 1). Use of sophisticated management science techniques are clearly unnecessary for appraising smaller capital projects, and it is not expected that such methods would ever become standard require- ments for all investment evaluations.
Central to much of the capital budgeting literature is the risk-return relationship found within the capital asset pricing framework (Sharpe, 1964; Linter, 1985). The CAPM has failed to live up to much of its early promise as a practical tool for estimating capital project risk-return relationships. Even so, it is cur- rently being employed within a number of firms. The first survey found no users of this technique at all.
Critical path analysis continues to grow in popu- larity, almost one-half of the sample applying it to certain types of capital projects. Unlike other manage- ment science techniques in capital budgeting, this technique is a post-decision control measure rather than a pre-decision appraisal one.
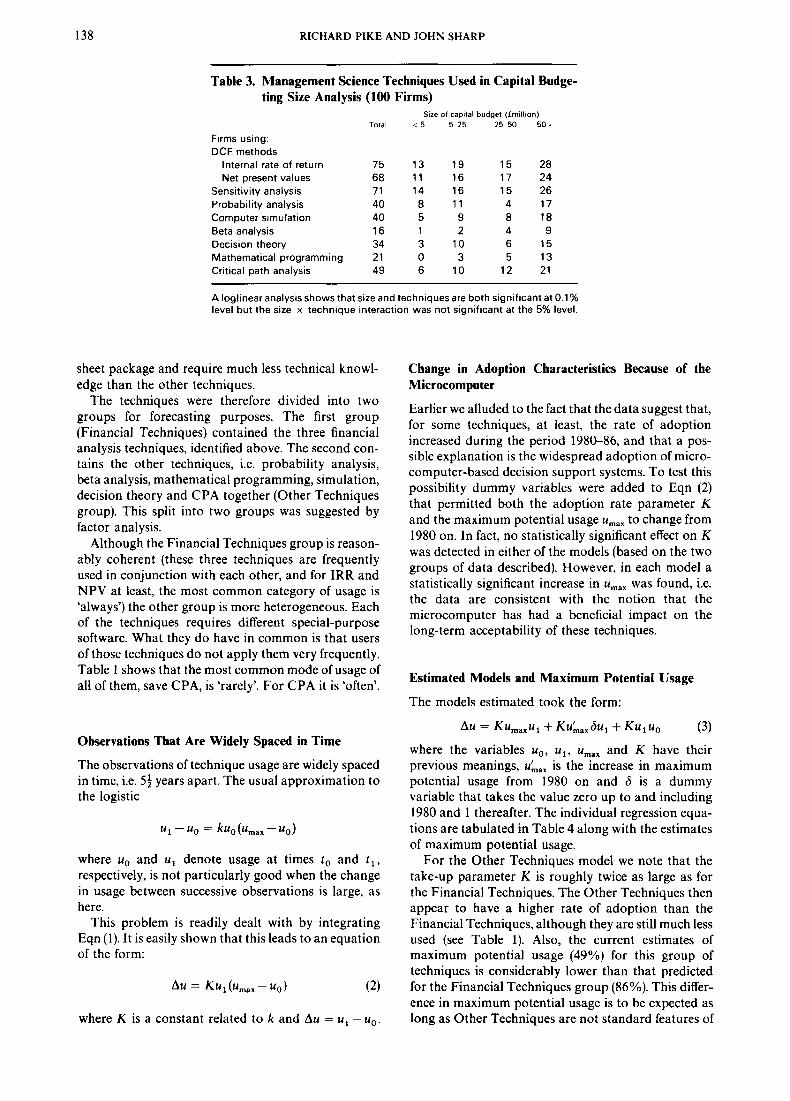
Finally, as Table 3 indicates, usage of almost all the management science techniques examined are associ- ated with firm size. The disparity between small and large-sized firms within the sample increases with the level of complexity of the technique involved.
To summarize: i t is now standard practice among larger firms to evaluate projects using more than one scenario and to assess the impact of critical variables on project returns. While probability approaches have still to become a regular feature in capital budgeting, they are increasingly employed within firms on certain major projects.
An interesting question is whether the use of the various techniques has been significantly affected by the development of microcomputer-based decision support systems in recent years or whether it merely reflects diffusion of ‘best practice’. Survey results show

TRENDS IN THE USE OF MANAGEMENT SCIENCE TECHNIQUES 137
Table 1. Management Science Techniques Used in Capital Budgeting in 1986 (100 Firms)
Most common form of usage Total Rarely Often Mostly Always
(%) (%) (%) (%) (%)
Firms using: DCF methods
Internal rate of return Always 75a 9 1 1 13 42 Net present value Always 68a 16 15 14 23
Sensitivity analysis Often 72a 15 23 16 18 Probability analysis Rarely 40 22 13 2 3 Computer simulation Rarely 40a 21 10 6 3 Beta analysis Rarely 16a 12 2 - 2 Decision theory Rarely 34a 21 9 1 3 Mathematical programming Rarely 21 a 12 4 2 3 Critical path analysis Often 49 17 18 8 6
a Indicates that a variable is associated (at the 5% level) with the use by firms of computer packages or financial modelling applications in capital budgeting.
Table 2. Management Science Techniques Used in Capital Budgeting Trends 197586 (100 Firms)
1986 1980/81 1975 (%) (%) (%)
Firms using: DCF methods
Internal rate of return 75 57 44 Net present value 68 39 32
Sensitivity analysis 71 42 28 Probability analysis 40 10 9 Computer simulation 40 21 12
Decision theory 34 3 3 Mathematical programming 21 17 11
- - Beta analysis 16
Critical path analysis 49 31 23
that 58% of responding firms use a computer package or financial modelling system for at least some capital budgeting decisions. Table 1 reveals a significant asso- ciation between the degree of usage of nearly all management science decision-evaluation techniques and the extent to which computer software is applied to investment decisions.
Associated with this question is the prediction of future usage and the extent to which these techniques will eventually be used. The remainder of the paper attempts to throw some light on these questions by constructing a forecasting model based on the data from 1975 to 1986.
~ ~
THE FORECASTING MODEL
Clearly, we are dealing with a question of techno- logical substitution. The obvious forecasting model to employ is, therefore, the Logistic, which has been widely used for this purpose (for example, Fisher and Pry, 1978; Sahal, 1984; Saunders er al., 1987). This
model takes the form
where u denotes the percentage usage at time t, u,,, the maximum possible usage and k is a constant.
There are four practical problems of employing this model here:
(1) Lack of observations; (2) A set of techniques that are probably not homog-
eneous with regard to adoption characteristics; (3) Observations that are widely spaced in time; (4) A possible change in adoption characteristics from
the first period to the second period as a result of the impact of the microcomputer.
Each is discussed further below, along with the way we have tackled them.
Lack of Observations
Since we only have usage of any particular technique at three points we effectively only have two observ- ations of change in usage, and as the Logistic has two parameters to be estimated this leaves no degrees of freedom for their estimation. This problem was coped with by assuming that
techniques could be put into groups that could be assumed to be following the same logistic adoption curve, even though they are at markedly different stages with regard to adoption. Degrees of freedom are then much less of a problem.
Lack of Homogeneity in Adoption Behaviour
Although all the techniques discussed have at some time been, or still are, regarded as management science techniques it is by no means obvious that they are homogeneous with regard to adoption behaviour. For instance, it might be argued that IRR, NPV and sensitivity analysis are available through any spread-
138 RICHARD PIKE A N D JOHN SHARP
Table 3. Management Science Techniques Used in Capital Budge- ting Size Analysis (100 Firms)
Size of capital budget (frnillion) Total < 5 5 2 5 2 5 5 0 501
Firms using: DCF methods
Internal rate of return Net present values
Sensitivity analysis Probability analysis Computer simulation Beta analysis Decision theory Mathematical programming Critical path analysis
75 13 19 15 28 68 1 1 16 17 24 71 14 16 15 26 40 8 11 4 17 40 5 9 8 18 16 1 2 4 9 34 3 10 6 15 21 0 3 5 13 49 6 10 12 21
A loglinear analysis shows that size and techniques are both significant at 0.1 % level but the size x technique interaction was not significant at the 5% level.
sheet package and require much less technical knowl- edge than the other techniques.
The techniques were therefore divided into two groups for forecasting purposes. The first group (Financial Techniques) contained the three financial analysis techniques, identified above. The second con- tains the other techniques, i.e. probability analysis, beta analysis, mathematical programming, simulation, decision theory and CPA together (Other Techniques group). This split into two groups was suggested by factor analysis.
Although the Financial Techniques group is reason- ably coherent (these three techniques are frequently used in conjunction with each other, and for IRR and NPV at least, the most common category of usage is ‘always’) the other group is more heterogeneous. Each of the techniques requires different special-purpose software. What they do have in common is that users of those techniques do not apply them very frequently. Table 1 shows that the most common mode of usage of all of them, save CPA, is ‘rarely’. For CPA it is ‘often’.
Observations That Are Widely Spaced in Time
The observations of technique usage are widely spaced in time, i.e. 54 years apart. The usual approximation to the logistic
where uo and u1 denote usage at times t o and t , , respectively, is not particularly good when the change in usage between successive observations is large, as here.
This problem is readily dealt with by integrating Eqn (1). It is easily shown that this leads to an equation of the form:
where K is a constant related to k and Au = u , - uo.
Change in Adoption Characteristics Because of the Microcomputer
Earlier we alluded to the fact that the data suggest that, for some techniques, at least, the rate of adoption increased during the period 198Ck86, and that a pos- sible explanation is the widespread adoption of micro- computer-based decision support systems. To test this possibility dummy variables were added to Eqn (2) that permitted both the adoption rate parameter K and the maximum potential usage u,,, to change from 1980 on. In fact, no statistically significant effect on K was detected in either of the models (based on the two groups of data described). However, in each model a statistically significant increase in umax was found, i.e. the data are consistent with the notion that the microcomputer has had a beneficial impact on the long-term acceptability of these techniques.
Estimated Models and Maximum Potential Usage
The models estimated took the form:
AU = Ku, , ,u~ +Ku&,,6ul +Kuluo (3) where the variables uo, u l , umax and K have their previous meanings, u&,, is the increase in maximum potential usage from 1980 on and 6 is a dummy variable that takes the value zero up to and including 1980 and 1 thereafter. The individual regression equa- tions are tabulated in Table 4 along with the estimates of maximum potential usage.
For the Other Techniques model we note that the take-up parameter K is roughly twice as large as for the Financial Techniques. The Other Techniques then appear to have a higher rate of adoption than the Financial Techniques, although they are still much less used (see Table 1). Also, the current estimates of maximum potential usage (49%) for this group of techniques is considerably lower than that predicted for the Financial Techniques group (86%). This differ- ence in maximum potential usage is to be expected as long as Other Techniques are not standard features of
TRENDS IN THE USE OF MANAGEMENT SCIENCE TECHNIQUES 139
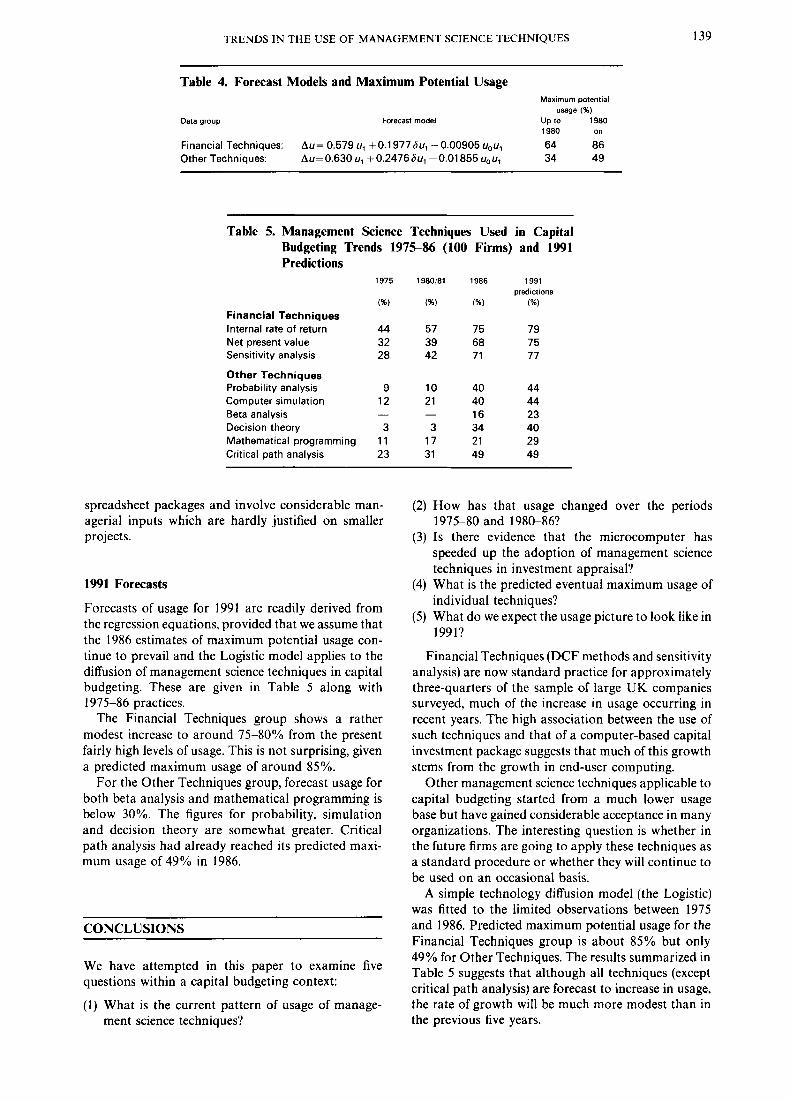
Table 4. Forecast Models and Maximum Potential Usage Maximum potential
usage (%)
1980 On
Data group Forecast model up to 1980
Financial Techniques: Au= 0.579 u, +O.1977Su1 -0.00905 uou, 64 86 Other Techniques: A ~ = 0 . 6 3 0 ~1 +0 .24766~1-0 .01855 UOU, 34 4 9
Table 5. Management Science Techniques Used in Capital Budgeting Trends 197586 (100 Firms) and 1991 Predictions
1975 1980/81 1986 1991
(%) (%) (%) (%)
Financial Techniques Internal rate of return 44 57 75 79 Net present value 32 3 9 68 75 Sensitivity analysis 28 42 71 77
Other Techniques Probability analysis 9 10 40 44 Computer simulation 12 21 40 44
16 23 Beta analysis - - Decision theory 3 3 34 40 Mathematical programming 11 17 21 29 Critical path analysis 23 31 49 49
predictions
spreadsheet packages and involve considerable man- agerial inputs which are hardly justified on smaller projects.
1991 Forecasts
Forecasts of usage for 1991 are readily derived from the regression equations, provided that we assume that the 1986 estimates of maximum potential usage con- tinue to prevail and the Logistic model applies to the diffusion of management science techniques in capital budgeting. These are given in Table 5 along with 1975-86 practices.
The Financial Techniques group shows a rather modest increase to around 7540% from the present fairly high levels of usage. This is not surprising, given a predicted maximum usage of around 85%.
For the Other Techniques group, forecast usage for both beta analysis and mathematical programming is below 30%. The figures for probability, simulation and decision theory are somewhat greater. Critical path analysis had already reached its predicted maxi- mum usage of 49% in 1986.
CONCLUSIONS
We have attempted in this paper to examine five questions within a capital budgeting context:
(1) What is the current pattern of usage of manage- ment science techniques?
(2) How has that usage changed over the periods 1975-80 and 198&86?
(3) Is there evidence that the microcomputer has speeded up the adoption of management science techniques in investment appraisal?
(4) What is the predicted eventual maximum usage of individual techniques?
( 5 ) What do we expect the usage picture to look like in 1991?
Financial Techniques (DCF methods and sensitivity analysis) are now standard practice for approximately three-quarters of the sample of large UK companies surveyed, much of the increase in usage occurring in recent years. The high association between the use of such techniques and that of a computer-based capital investment package suggests that much of this growth stems from the growth in end-user computing.
Other management science techniques applicable to capital budgeting started from a much lower usage base but have gained considerable acceptance in many organizations. The interesting question is whether in the future firms are going to apply these techniques as a standard procedure or whether they will continue to be used on an occasional basis.
A simple technology diffusion model (the Logistic) was fitted to the limited observations between 1975 and 1986. Predicted maximum potential usage for the Financial Techniques group is about 85% but only 49% for Other Techniques. The results summarized in Table 5 suggests that although all techniques (except critical path analysis) are forecast to increase in usage, the rate of growth will be much more modest than in the previous five years.

140 RICHARD PIKE AND JOHN SHARP
The Other Techniques, as we have dubbed them, are probably the methods with which the management scientist is most likely to be involved nowadays. The predicted eventual maximum usage of these techni- ques of around 49% looks considerably higher than seemed possible at the time of the first survey in 1980. Furthermore, the results suggest that recent devel- opments in microcomputer DSS have made this pos- sible. It would appear that more user-friendly systems can have a substantial effect on whether certain techni- ques are ever used.
Even for this group of techniques the forecast in- crease in usage over the period 1986-91 is not that great. There would therefore still seem to be scope for developing better software and extending the training of managers in the use of these techniques, particularly if firms are to apply them to a wider range of projects. If eventually they could be persuaded to view them in the same light as the Financial Techniques, the influ- ence of OR methods in investment decisions would be substantially increased.
REFERENCES
J. M. Boersema (1 978). Capital Budgeting Practices including the Impact o f Inflation, The Canadian Institute of Chartered Accountants.
B. Carsberg and A. Hope (1 976). Business Investment Decisions under Inflation: Theory and Practice, London: The Institute of Chartered Accountants in England and Wales.
C. W. Churchman (1 964). Managerial acceptance of scientific recommendations. California Management Review Fall, 31 -8.
J. Dean (1 951 ) Capital Budgeting, Columbia University Press. J. C. Fisher and R. M. Pry (1 978) A simple substitution model of
technological change, Technological Forecasting and Social Changes 3. 75-88.
L. J. Gitman and J. R. Forrester Jr (1977). A survey of capital budgeting techniques used by major US firms. Financial Management 6(3), 66-71.
1. Klammer (1972). Empirical evidence of the adoption of sophisticated capital budgeting techniques. Journal of Busi- ness 45(3), 337-57.
J. Lintner (1 965). Thevaluation of risky assets and the selection of risky investments in stock portfolios and capital budgets. Review o f Economics and Statistics 47(1), 13-37.
J. W. Petty, D. F. Scott Jr and M. M. Bird (1975) The capital
expenditure decision-making process of large corporations. The Engineering Econornisr 20(3).
R. H. Pike (1 983). A review of recent trends in capital budgeting practices. Accounting and Business Research 13(51), 201-8.
J. Saunders. J.A. Sharpand S. F. Witt (1987). PracticalBusiness Forecasting, Aldershot: Gower.
D. Sahal (ed) (198f). Research, Development and Techno- logical Innovation: Recent Perspectives on Management, Lexington, MA: Heath.
R. W. Scapens and J. J. Sale (1 981 ). Performance measurement and formal capital expenditure controls in divisionalized com- panies. Journal of Business Finance and Accounting 8(3), 389-4 1 9.
W. F. Sharpe (1964). Capital asset prices: a theory of market equilibrium under conditions of risk. Journalof Finance 19(3). 42542 .
G. L. Sundern (1 974). Evaluating simplified capital budgeting models using a timestate preference metric. The Accounting Review 49(2), 306-21.
C. A. Westwick and P. Shohet (1 976). InvestmentAppraisaland Inflation, Research Paper No. 7, London. The Institute of Chartered Accountants.