trends in the manufacturing sector in massachusetts sharing skills ~ building connection conference,...
TRANSCRIPT

Trends in the Manufacturing Sector
in Massachusetts
Sharing Skills ~ Building Connection Conference, March 12, 2008
Rebekah Lashman
Jonathan Latner
Navjeet Singh
Commonwealth Corporation
617-727-8158
March 12, 2008Page 2
Agenda
1. Who is in the Audience?
2. Massachusetts Employment Trends
3. Massachusetts Manufacturing Employment Trends
4. How to Engage Local Employers?
5. Sources of Information
6. Evaluation forms

March 12, 2008Page 3
Purpose of Workshop
• Introduction
1. How many are already working with a manufacturing organization?
2. What kind of work are you doing? (training, for which occupations or jobs)
3. Purpose
4. What should a workforce professional know about the manufacturing sector?

March 12, 2008Page 4
Massachusetts Employment Trends
Source: Bureau of Labor StatisticsCES Data, Seasonally Adjusted Data
January, 2001 – December, 2007Employment is recovering from recession, but has not equaled its Peak: Feb, 2001
February, 20013,372,900
December, 20033,167,100
December, 2007 3,282,100
3,000,000
3,100,000
3,200,000
3,300,000
3,400,000
3,500,000
2001 2002 2003 2004 2005 2006 2007

March 12, 2008Page 5
Decline (2001-4)Decline (2001-4) Recovery (2004-6) Recovery (2004-6) Proj. Growth (2006-11)Proj. Growth (2006-11)
Educ. & HealthEduc. & Health
Hotels & FoodHotels & Food
Other ServicesOther Services
ConstructionConstruction
FinanceFinance
GovernmentGovernment
Trade, TransTrade, Trans
InformationInformation
Prof. & Bus. Svcs.Prof. & Bus. Svcs.
ManfgManfg
Source: CommCorp Analysis of New England Economic Partnership Data, November, 2007.
All Numbers in Thousands of Employees
Structural Shifts in the Economy
-76
-34
-24
-20
-19
-11
-1
1
11
27
-14
21
0
-2
8
4
3
2
4
24
-9
33
6
7
1
2
-3
3
19
62
There is a shift in employment – towards Healthcare & Education and Professional and Business Services
March 12, 2008Page 6
5
17
2
24
3
5
2
2
9
22
-9
33
6
7
1
2
-3
3
19
62
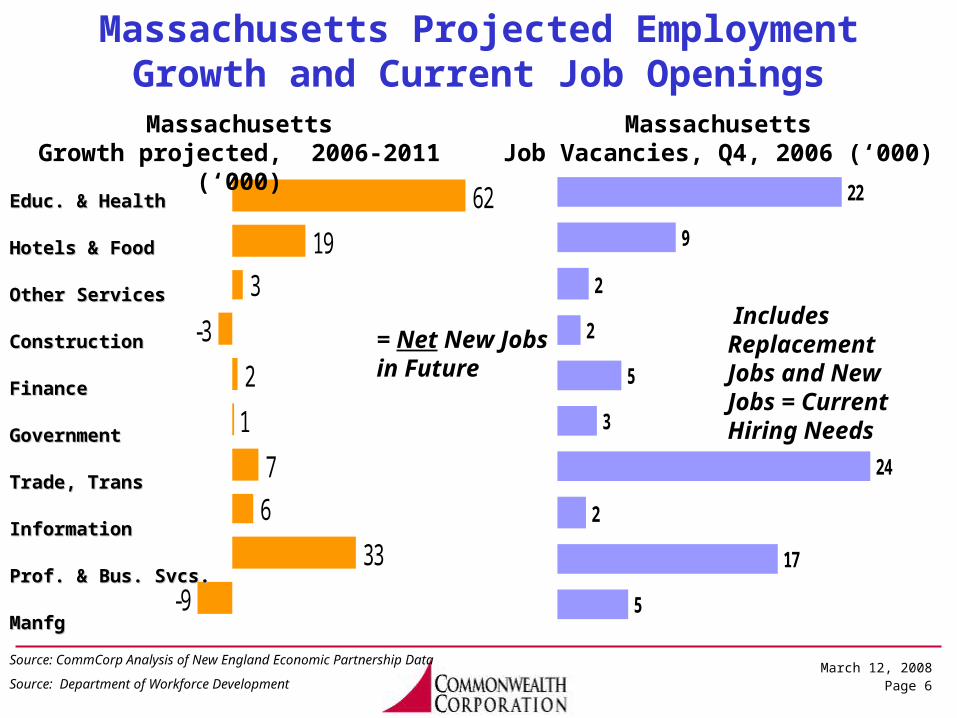
MassachusettsGrowth projected, 2006-2011 (‘000)
Massachusetts Projected Employment Growth and Current Job Openings
Source: CommCorp Analysis of New England Economic Partnership Data
Source: Department of Workforce Development
= Net New Jobs in Future
Includes Replacement Jobs and New Jobs = Current Hiring Needs
MassachusettsJob Vacancies, Q4, 2006 (‘000)
Educ. & HealthEduc. & Health
Hotels & FoodHotels & Food
Other ServicesOther Services
ConstructionConstruction
FinanceFinance
GovernmentGovernment
Trade, TransTrade, Trans
InformationInformation
Prof. & Bus. Svcs.Prof. & Bus. Svcs.
ManfgManfg
March 12, 2008Page 7
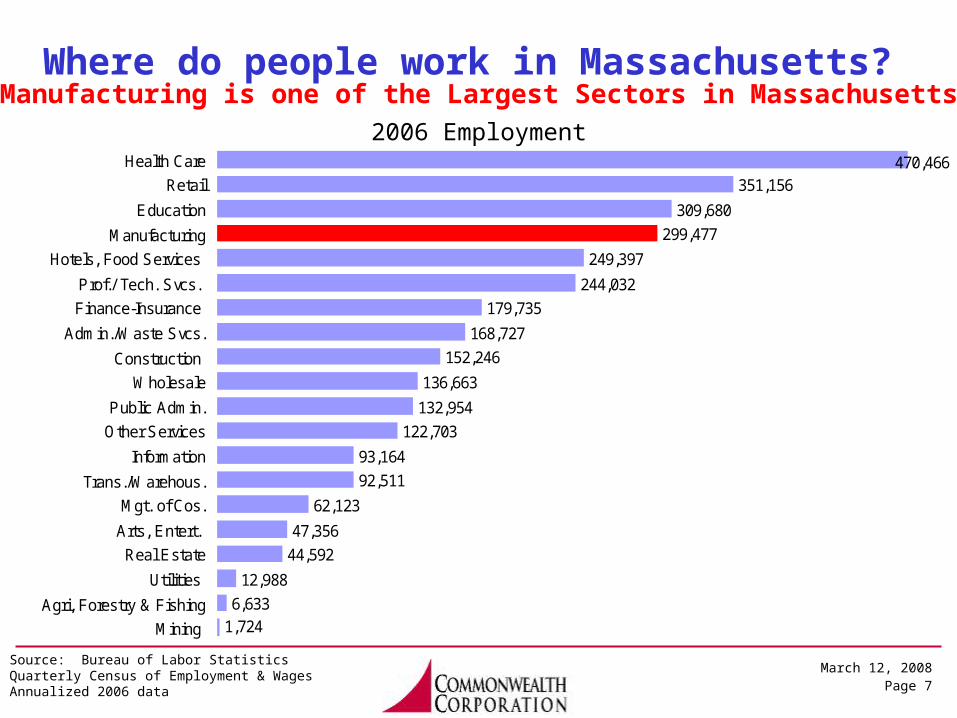
Source: Bureau of Labor StatisticsQuarterly Census of Employment & WagesAnnualized 2006 data
Where do people work in Massachusetts?
1,7246,633
12,988
44,592
47,356
62,123
92,511
93,164
122,703
132,954
136,663
152,246
168,727
179,735
244,032
249,397
299,477
309,680
351,156470,466
Mining
Agri, Forestry & Fishing
Utilities
Real Estate
Arts, Entert.
Mgt. of Cos.
Trans./Warehous.
Information
Other Services
Public Admin.
Wholesale
Construction
Admin./Waste Svcs.
Finance-Insurance
Prof./ Tech. Svcs.
Hotels, Food Services
Manufacturing
Education
Retail
Health Care
Manufacturing is one of the Largest Sectors in Massachusetts
2006 Employment

March 12, 2008Page 8
How has Massachusetts Manufacturing Employment Changed since 1990?
Source: Bureau of Labor StatisticsCurrent Employment StatisticsSeasonally Adjusted1990 – 2007
January, 1990 494,800
November, 2007 294,900
-
100,000
200,000
300,000
400,000
500,000
600,000
1990 1991 1992 1993 1994 1995 1996 1997 1998 1999 2000 2001 2002 2003 2004 2005 2006 2007

March 12, 2008Page 9
Share of Total Employment in Manufacturing in Massachusetts and United States, 1990 - 2006
16.6%
14.4%
12.5%
9.4%
16.2%
14.7%
13.1%
10.4%
0%
6%
12%
18%
1990 1995 2000 2006
Massachusetts
United States
Source: Bureau of Labor StatisticsQuarterly Census of Employment & WagesAnnualized 1990, 1995, 2000, & 2006 data

March 12, 2008Page 10
Manufacturing Revenues have been Increasing, 1997 - 2006
Source: Bureau of Economic Analysis,Regional Economic Accounts, GDP by State1997 – 2006
$222
$338
$30 $33
$-
$50
$100
$150
$200
$250
$300
$350
$400
1997 1998 1999 2000 2001 2002 2003 2004 2005 2006
$ billion
Manufacturing revenues
Mass. State Product (All Sectors)

March 12, 2008Page 11
What is the Employment in Different Sub-sectors in Manufacturing (2006)?
1,2462,5642,5922,6713,3783,6565,0435,4976,3836,789
11,27712,311
14,46615,65416,05317,112
19,99722,83523,608
35,16871,178
Petroleum and Coal Leather and Allied
Beverage and Tobacco Textile Product Mills
Wood Apparel
Primary Metal Furniture and Related
Textile MillsNonmetallic Mineral
Electrical Equipment, Appliance, and Component Paper
Transportation Equipment Plastics and Rubber
Printing and Related ActivitiesChemical
Machinery Food
Miscellaneous Fabricated Metal
Computer and Electronic
Source: Bureau of Labor StatisticsQuarterly Census of Employment & Wages2006 data

March 12, 2008Page 12
What are Employment Trends 2000-2004 in Manufacturing Sub-sectors?
71-751-523
-1,044172
-3,375-2,108
-1,266-3,659
-2,010-5,268-4,546
-3,394-5,947
-4,323-2,073
-10,708-652
-5,467-9,644
-28,664
Petroleum and Coal Leather and Allied
Beverage and Tobacco Textile Product Mills
Wood Apparel
Primary Metal Furniture and Related
Textile MillsNonmetallic Mineral
Electrical Equipment, Appliance, and Component Paper
Transportation Equipment Plastics and Rubber
Printing and Related Support ActivitiesChemical
Machinery Food
Miscellaneous Fabricated Metal
Computer and Electronic
Source: Bureau of Labor StatisticsQuarterly Census of Employment & Wages2000 & 2004 data
Change in employment 2000-2004
March 12, 2008Page 13
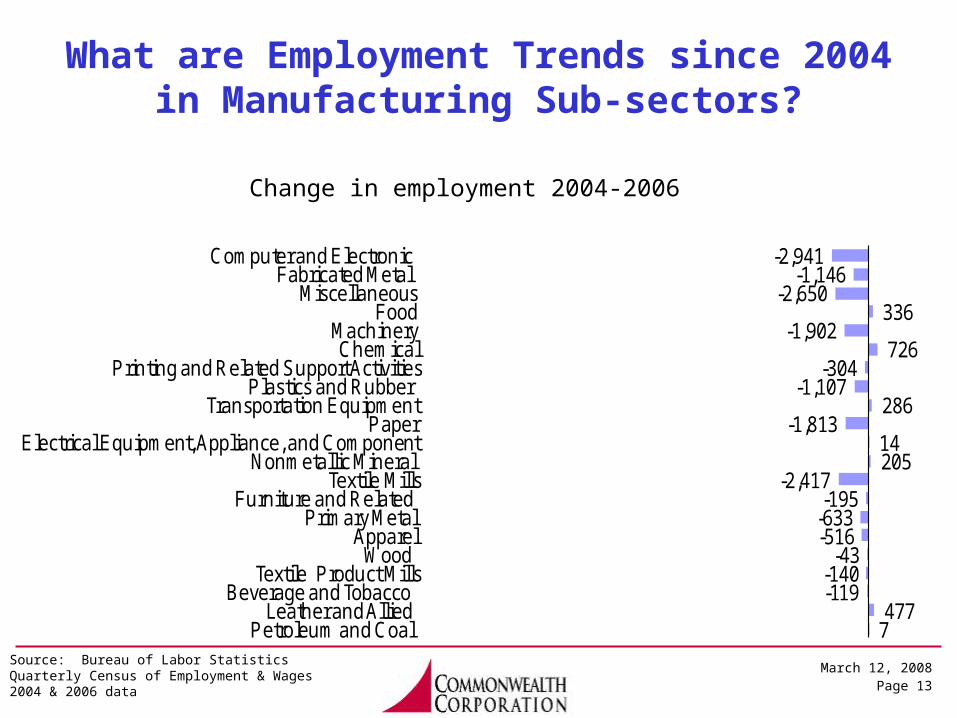
What are Employment Trends since 2004 in Manufacturing Sub-sectors?
7477
-119-140
-43-516-633-195
-2,41720514
-1,813286
-1,107-304
726-1,902
336-2,650
-1,146-2,941
Petroleum and Coal Leather and Allied
Beverage and Tobacco Textile Product Mills
Wood Apparel
Primary Metal Furniture and Related
Textile MillsNonmetallic Mineral
Electrical Equipment, Appliance, and Component Paper
Transportation Equipment Plastics and Rubber
Printing and Related Support ActivitiesChemical
Machinery Food
Miscellaneous Fabricated Metal
Computer and Electronic
Source: Bureau of Labor StatisticsQuarterly Census of Employment & Wages2004 & 2006 data
Change in employment 2004-2006

March 12, 2008Page 14
What are Average Annual Total Wages for Different Sectors in Massachusetts, 2006
Source: Bureau of Labor StatisticsQuarterly Census of Employment & Wages2006 data
$53,689
$43,075
$80,369
$54,402
$31,086
$88,469
$43,430
$77,517
$26,773
$53,973
$72,813
$54,938
$35,680
$103,834
$87,920
$18,215
$65,333
$46,555
$27,312
$45,647
$0 $52,396 $104,792
Mining
AFF
Utilities
Real Estate
Arts
Mgmt. Of Co.
Transp. & Warehousing
Information
Other Svcs.
Government
Wholesale Trade
Construction
Admin. Svcs.
Finance
Prof. Tech. Svcs.
Hotels & Food Svcs.
Manufacturing
Education
Retail
Health Care
Red line indicates the Massachusetts state average Total Wages in 2006

March 12, 2008Page 15
How is Manufacturing Employment Distributed in different Workforce Areas in Massachusetts?
Source: Executive Office of Labor and Workforce Development, Division of Career ServicesQuarterly Census of Employment & WagesAnnualized 2006 data
2,424
6,142
8,461
8,665
10,974
11,227
11,868
15,480
19,032
20,116
21,481
24,098
25,163
27,678
27,740
58,799
Cape.Cod
Berkshire
Brockton
Franklin.Hampshire
Boston
So.Coastal
New.Bedford
No.Worcester
No.Middlesex
So.Essex
Bristol
Hampden
Lower.Merrimack.Valley
So.Worcester
Metro.North
Metro.South.West

March 12, 2008Page 16
What is the local share of Manufacturing Employment Different Workforce Areas?

March 12, 2008Page 17
What are the Major Manufacturing Sub-sectors in Different Workforce Areas of the State?

March 12, 2008Page 18
What are “Sectors” and “Occupations?”
• Where people work? – Sectors, Sub-sectors, Industries– Examples: Manufacturing, Computer & Electronic
Products, Audio & Visual Equipment
• What people do? – Occupational Groups, Occupations, – Examples: Production Workers, Machinists,
Engineers, Home Health Aides
March 12, 2008Page 19
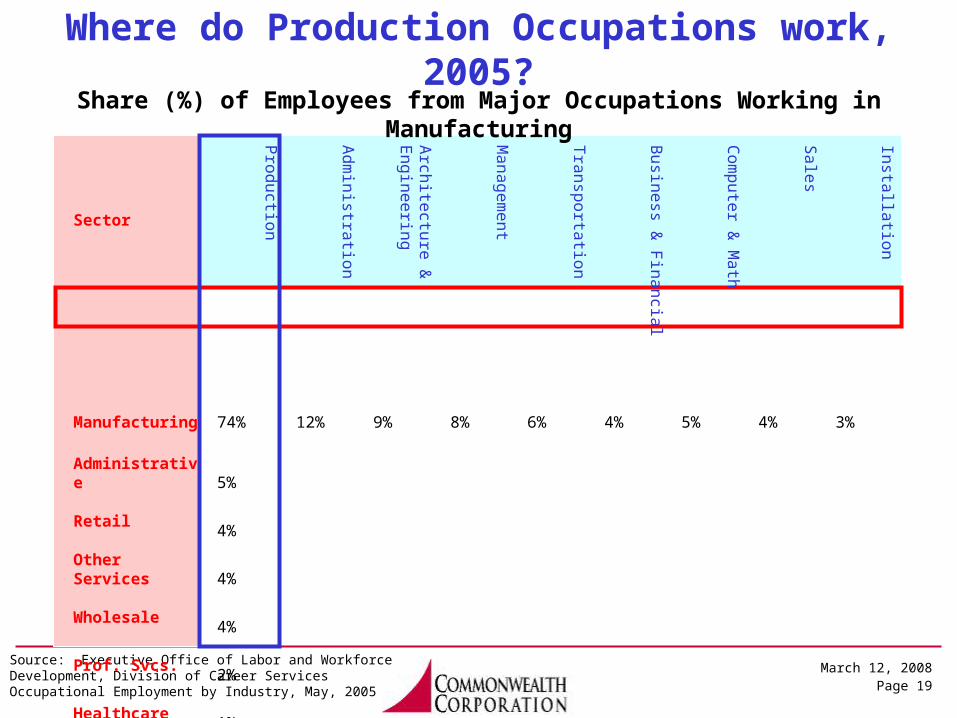
Where do Production Occupations work, 2005?
Source: Executive Office of Labor and Workforce Development, Division of Career ServicesOccupational Employment by Industry, May, 2005
Sector
Pro
du
ction
Ad
min
istratio
n
Arch
itectu
re &
E
ng
ine
erin
g
Ma
na
ge
me
nt
Tra
nsp
orta
tion
Bu
sine
ss & F
ina
ncia
l
Co
mp
ute
r & M
ath
Sa
les
Insta
llatio
n
Manufacturing 74% 12% 9% 8% 6% 4% 5% 4% 3%
Administrative 5%
Retail 4%
Other Services 4%
Wholesale 4%
Prof. Svcs. 2%
Healthcare 1%
Other 6%
Share (%) of Employees from Major Occupations Working in Manufacturing

March 12, 2008Page 20
What are Different Jobs in the Manufacturing Sector in Massachusetts and US, 2005?
MA Source: Executive Office of Labor and Workforce DevelopmentIndustry Staffing Patterns, May, 2005US Source: Bureau of Labor StatisticsNational Industry Specific Occupational Employment & Wage Estimates, May, 2005
4%
1%
5%
3%
3%
2%
9%
5%
6%
10%
52%
4%
2%
3%
4%
4%
5%
6%
8%
9%
12%
43%
0% 10% 20% 30% 40% 50% 60%
Other
Sciences
Installation & Repair
Financial
Sales
Comp. & Math
Transportation
Management
Engineering
Administrative
Production
MassachusettsUnited States

March 12, 2008Page 21
What is the Share of Production Workers Among Manufacturing Employees in Different Areas
March 12, 2008Page 22
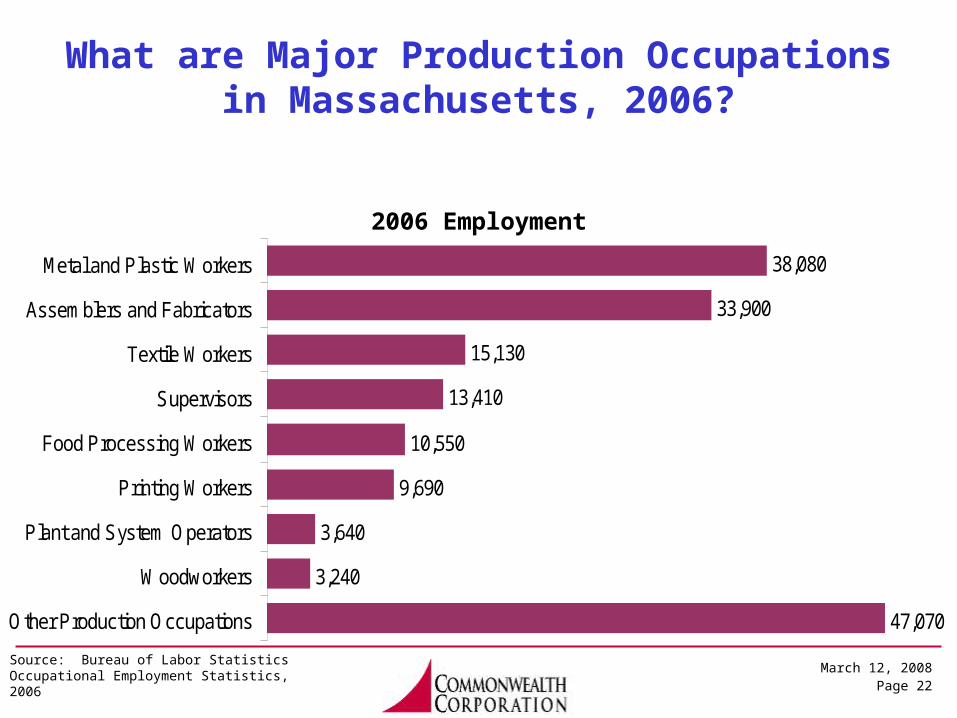
47,070
3,240
3,640
9,690
10,550
13,410
15,130
33,900
38,080
Other Production Occupations
Woodworkers
Plant and System Operators
Printing Workers
Food Processing Workers
Supervisors
Textile Workers
Assemblers and Fabricators
Metal and Plastic Workers
What are Major Production Occupations in Massachusetts, 2006?
Source: Bureau of Labor StatisticsOccupational Employment Statistics, 2006
2006 Employment
March 12, 2008Page 23
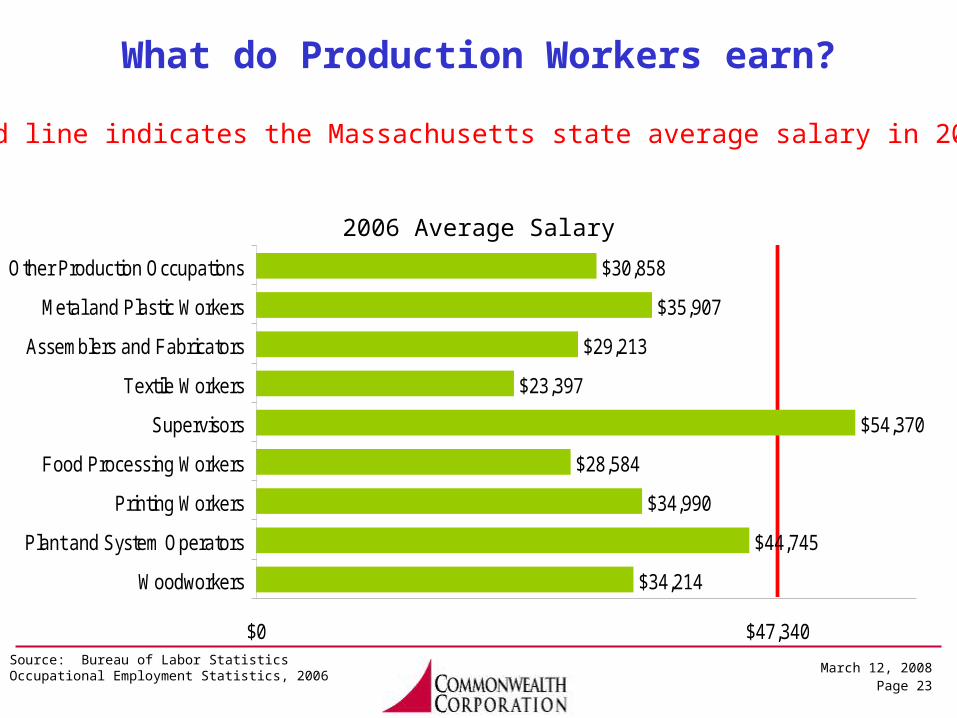
What do Production Workers earn?
Source: Bureau of Labor StatisticsOccupational Employment Statistics, 2006
$34,214
$44,745
$34,990
$28,584
$54,370
$23,397
$29,213
$35,907
$30,858
$0 $47,340
Woodworkers
Plant and System Operators
Printing Workers
Food Processing Workers
Supervisors
Textile Workers
Assemblers and Fabricators
Metal and Plastic Workers
Other Production Occupations
2006 Average Salary
Red line indicates the Massachusetts state average salary in 2006

March 12, 2008Page 24
How much do Production Workers earn by Workforce Investment Area, 2005
$32,578$36,253
$33,439$30,776
$33,059$28,346
$36,814$33,674
$44,588$39,567$39,595
$37,295$45,379
$46,596$36,265
$50,202
$0 $38,794
HampdenBerkshireBrockton
BristolFranklin/Hampshire
New BedfordSouthern WorcesterNorthern Worcester
South EssexLower Merrimack
BostonSouth Coastal
Metro NorthNorthern Middlesex
Cape Cod and IslandsMetro South/West
Red line indicates the Median Total Wages of Production Workers in Massachusetts
Source: Executive Office of Labor and Workforce DevelopmentDivision of Career ServicesOccupational Employment and Wage Industry Staffing PatternsMay, 2005

March 12, 2008Page 25
What is the Share of Production Workers Among Manufacturing Employees in Different Areas

March 12, 2008Page 26
Change in Educational Attainment of Workers in the Manufacturing Industry in Massachusetts,
2000 - 2006
2000 Census PUMS Data, 5% sample2006 ACS PUMS DataPopulation aged 25 or older
12%
22%
8%
16%
30%
12%
10%
19%
7%
19%
30%
15%
Masters or more
Bachelors degree
Associates degree
Some College
Highschool diploma
Less than highschool
20002006
March 12, 2008Page 27
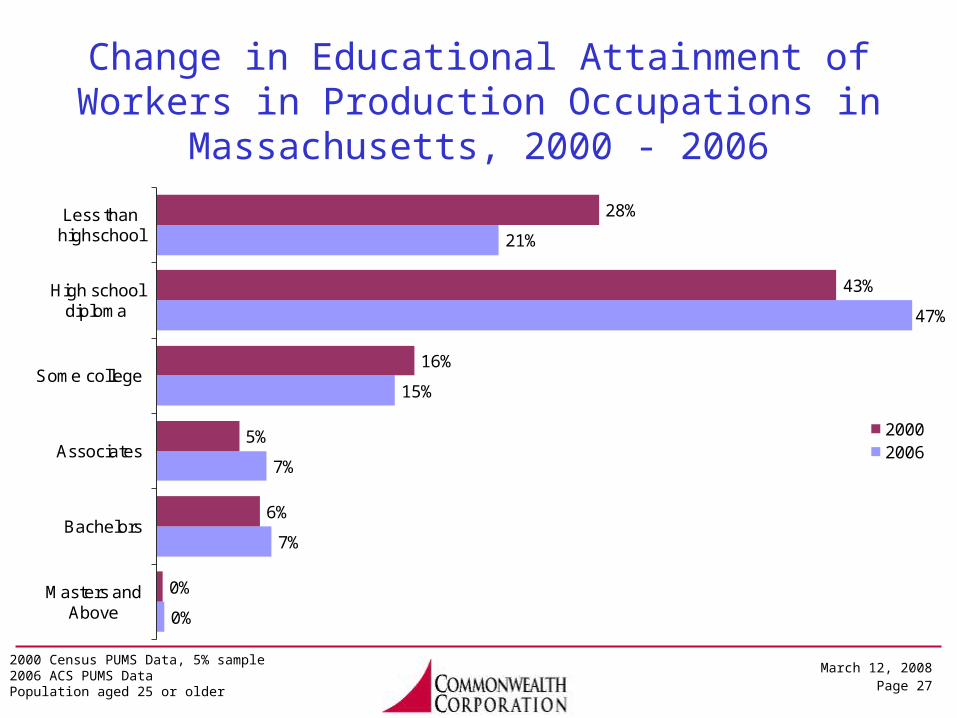
Change in Educational Attainment of Workers in Production Occupations in Massachusetts, 2000 -
2006
2000 Census PUMS Data, 5% sample2006 ACS PUMS DataPopulation aged 25 or older
0%
6%
5%
16%
43%
28%
0%
7%
7%
15%
47%
21%
Masters and Above
Bachelors
Associates
Some college
High school diploma
Less than highschool
20002006

March 12, 2008Page 28
Age Distribution of Workers in the Manufacturing Industry in Massachusetts, 2000 - 2006
2000 Census PUMS Data, 5% sample2006 ACS PUMS DataPopulation aged 25 or older
8%
21%
31%
25%
13%
3%
13%
23%
26%
22%
11%
4%
6%
18%
27%
30%
16%
3%
13%
20%
24% 24%
14%
4%
15-24 25 - 34 35 - 44 45 - 54 55 - 64 65+ 15 - 24 25 - 34 35 - 44 45 - 54 55 - 64 65+
Manufacturing All Industries
2000 2006

March 12, 2008Page 29
Massachusetts Vacancies in the Manufacturing Sector, 2006 (4th Quarter)
Q4, 2006 Job Vacancy Survey Number of
Vacancies
Vacancy
Rate
Percent Requiring an
Associate's Degree or Higher
Percent Requiring
Related Experience
Total,
All Sectors92,639 3.2% 38% 54%
Retail Trade 18,795 5.7% 2% 13%
Healthcare & Social Assistance 71,621 4.0% 54% 68%
Professional & Technical Services
10,132 5.0% 87% 80%
Accommodation & Food Services 7,532 3.3% 25% 71%
Manufacturing 5,464 1.9% 57% 82%
Source: Department Workforce Development,Division of Career Services, Job Vacancy Survey (JVS), Q4, 2006
March 12, 2008Page 30
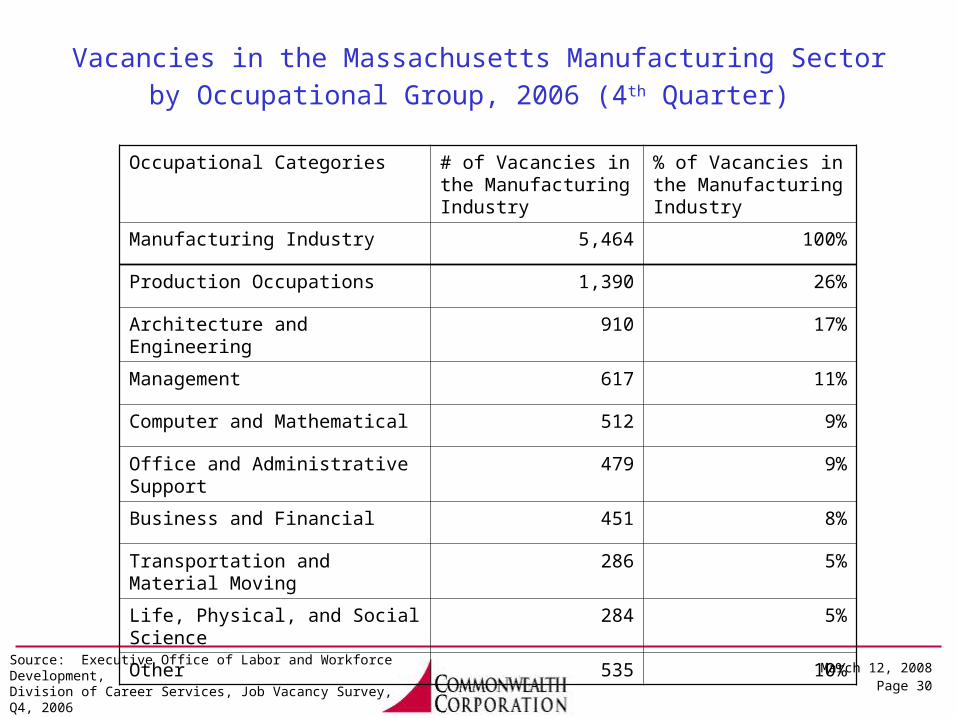
Vacancies in the Massachusetts Manufacturing Sector by Occupational
Group, 2006 (4th Quarter)
Source: Executive Office of Labor and Workforce Development,Division of Career Services, Job Vacancy Survey, Q4, 2006
Occupational Categories # of Vacancies in the Manufacturing Industry
% of Vacancies in the Manufacturing Industry
Manufacturing Industry 5,464 100%
Production Occupations 1,390 26%
Architecture and Engineering 910 17%
Management 617 11%
Computer and Mathematical 512 9%
Office and Administrative Support 479 9%
Business and Financial 451 8%
Transportation and Material Moving
286 5%
Life, Physical, and Social Science 284 5%
Other 535 10%

March 12, 2008Page 31
What are the Largest Occupations in the Manufacturing Sector?
• Which occupations have the most employees?• What have been recent employment trends?• What do they get paid? • What are their education or training
requirements?• How many vacancies did they have?• Which of these are ‘critical’ vacancies?• What are projections for new jobs and
replacement jobs?

March 12, 2008Page 32
Engaging your Local Employers
1. Using the chartbook with you local employers
2. General questions to ask local employers

March 12, 2008Page 33
Selected Sources of Information
Critical Vacancieshttp://www.commcorp.org/researchandevaluation/vacancy-critical.html
Industry-Staffing Patterns
http://lmi2.detma.org/Lmi/FPlmiforms1.aspOccupational Employment by Industry
Job Vacancy Surveyhttp://lmi2.detma.org/Lmi/LMIjobvacancy.asp
Educational Attainmenthttp://www.bls.gov/emp/empeted1.htm
Industry Employment and Wageshttp://www.bls.gov/cew/
Occupational Employment and Wageshttp://www.bls.gov/oes/