trends in robotics patents - cset.georgetown.edu
TRANSCRIPT

October 2021
Trends in Robotics Patents A Global Overview and an Assessment of Russia
CSET Data Brief
AUTHORS Margarita Konaev Sara M. Abdulla
Center for Security and Emerging Technology | 1
Executive Summary
Whether it is the Roomba vacuum taking over mundane household activities or NASA’s sophisticated rovers exploring the surface of Mars, robots are performing an increasingly varied range of tasks in today’s society. Networked and mobile industrial robots are transforming the traditional assembly lines in automotive and electronics factories. Surgical robots are performing intricate medical procedures, while telepresence robots are changing how patients communicate with their healthcare providers. Drones in different sizes and degrees of autonomy are used for a broad range of tasks, from crop monitoring for sustainable agriculture practices to surveillance and targeted strikes in military operations. Innovation in robotics technology therefore has significant strategic, economic, social, legal, and moral implications.
Patent activity is one useful indicator of technological advancement in robotics. Designed to protect invention and intellectual property, patents are a linkage between science, technology, and commercial activity. Trends in patenting provide information about the vibrancy and dynamism of the broader innovation ecosystem. Invention and innovation are not a zero-sum game, and the transfer and diffusion of certain technologies can have economic and societal benefits across national borders. That said, patents—and robotics patents in particular—are also an important part of the equation when assessing scientific and technological competition.
This report provides an overview of global trends in robotics patents granted to inventors across 88 countries between 2005 and 2019. While discussions and policies aimed at winning the global technology competition typically focus on China as the principal strategic competitor of the United States, Russia’s advances in emerging technologies such as robotics and AI, especially for military applications, can undermine U.S. strategic interests and merit further attention. With that, the report also delves into robotics patenting activity in Russia, and assesses the landscape of military robotics patents, both in Russia and around the world.
Center for Security and Emerging Technology | 2
Examining global patent activity between 2005 and 2019, our key findings are as follows:
● China leads in granted robotics patents, accounting for nearly 35 percent of the global robotics patents total between 2005 and 2019. The United States ranks fourth, with about 13 percent of the world’s total robotics patent output for this time period, coming in after Japan and South Korea.
● While Russia accounts for only 2 percent of the global robotics patent output between 2005 and 2019, it is responsible for 17 percent of the global military robotics patents, ranking third in the world in this category.
● Industrial robotics is the most popular category of robotics patent types, followed by medical robotics and transportation.
● The United States leads in robotics patents in areas such as aerospace, medical, military/security, and telepresence, as well as robotics patents with AI features. China tops the chart in patents for industrial robotics, transportation, humanoid/exoskeleton, agriculture, underwater applications, and education.

Center for Security and Emerging Technology | 3
Table of Contents
Executive Summary ......................................................................................... 1
Introduction ........................................................................................................ 4
Overview of Patent Data and Methodology ............................................ 5
Robotics Patents: A Look Around the World .......................................... 7
Robotics Patents: A Look Inside Russia ................................................. 15
Military Robotics Patents: Global and Russian Developments ....... 20
Conclusion ....................................................................................................... 26
Authors ............................................................................................................. 28
Acknowledgements ...................................................................................... 28
Appendix .......................................................................................................... 29
Endnotes .......................................................................................................... 31

Center for Security and Emerging Technology | 4
Introduction
Robotics technology is prominent across virtually every aspect of modern life. The demand for industrial robotics has risen consistently since 2010, as robots have become cheaper, more flexible, and more autonomous.1 Worldwide, the automotive industry is the largest customer when it comes to industrial robotics, closely followed by the electronics industry. Advances in autonomous navigation, computer vision, depth sensing, social robotics, and machine learning technologies help make robots more mobile, dexterous, collaborative, and aware of their surroundings. The trend toward smart factories and facilities where robots increasingly collaborate with humans is therefore expanding beyond manufacturing to industries like e-commerce. Amazon alone has about 350,000 mobile robots working alongside hundreds of thousands of employees across its global fulfillment centers.2 Most recently, as the COVID-19 pandemic spread around the world, remote presence robots connected patients with healthcare providers and cleaning robots helped sanitize hospitals, hotels, and public transport.3
Robots also have many applications in defense and military operations, and are already being used for surveillance, logistics and resupply, casualty evacuation, demining, combat support and many other tasks.4 Nearly 100 countries have an active military drone inventory, while armed non-state groups like ISIS, Hezbollah, and Hamas have also proved quite capable in using this technology.5 As a whole, advances in robotics have significant implications for a broad range of issues, including but not limited to, economic growth, transportation, healthcare, and the conduct of military conflicts.
Patent activity is a useful indicator of technological progress and innovation in robotics. Comparisons of patent activity across different countries can provide insights into areas of competitive advantage in the global competition for tech innovation and leadership. While the invention process is multidimensional, trends in patenting can also inform strategic forecasting of technological developments by highlighting areas and sectors that are being

Center for Security and Emerging Technology | 5
prioritized for innovation, alongside data on additional vectors such as research and development, investment, and infrastructure development.6
After providing an overview of patent data, the remainder of this report analyzes trends in granted robotics patents around the world, and zeros in on the state of robotics patenting in Russia. Additionally, we offer a discussion of military robotics patents in both Russia and across the globe.
Overview of Patent Data and Methodology
Patenting is the process by which inventors, whether individuals or organizations, seek to formalize exclusive intellectual property rights to their invention. If granted, patents allow inventors to monetize their invention, although not all inventions become commercially successful, nor do all inventors seek to take their inventions to market. Patents are granted for a certain period of time, and when the exclusive rights expire, other inventors and manufacturers are free to use and expand on the original invention. While each country has its own patent office, for example, the United States Patent and Trademark Office, there are also supranational bodies such as the European Patent Office that provide inventors with intellectual property rights across national borders.
An assessment of patent activity can provide insights on technological progress and innovation across different countries. An analysis of global patent activity, however, must be sensitive to the differences in countries’ patenting laws and cultures. For instance, inventors may have less of an incentive to file for a patent if their country has weak intellectual property protections. On the other hand, if certain organizations use patent filings in their performance reviews and promotions, or as a factor in university rankings, there are clear incentives to file patent applications in pursuit of these “non-market” objectives. Moreover, in many if not most countries, individual motives are inherently intertwined with national policies and ambitions. China’s ascendance to the top of the global patent rankings, for instance, was achieved in part through such incentives, meant to encourage
Center for Security and Emerging Technology | 6
(and pressure) Chinese inventors, universities, companies and other institutions to ramp up domestic patent activity.
Patent offices that examine the applications and decide to grant patent rights also differ in their standards for “novelty, non-obviousness, and industrial applicability [as] defined in national laws,” as well as their application processing times and efficiency.7 As a result, there are significant variations in terms of patent examination outcomes. For example, in 2019, patent offices in the United States, China, and India granted patents to less than 43 percent of all of the patent applications. In contrast, Japan, South Korea, and Russia granted patents to around 75 percent of applications that same year.8
Taken together, when comparing countries’ patent productivity and output, it is important to acknowledge that there is significant variation in patenting laws, the efficiency of patent granting institutions, and overall patenting cultures. These differences inherently affect how many patent applications are submitted each year as well as what percentage of patent applications are granted. Moreover, since inventors may file for patent protection for their inventions in multiple countries, it is sometimes the case that a single invention has multiple patent documents from different countries. At the same time, in some countries (including the United States), applicants can file for a series of patents, with each document describing different aspects of the same underlying invention.
To avoid double-counting the same inventions, we use the ‘patent family’ as a unit of analysis–with each patent family containing “all patent documents that result from the same initial filing, known as the ‘priority’ application.”9 Taking into account differences in patent examination outcomes, we focus solely on patent families that contain at least one granted patent. For simplicity, in the remainder of this report these units are referred to as ‘patents’ or ‘granted patents’. Readers should keep in mind that these are shorthand for the more accurate, but more cumbersome, ‘granted patent families’.
Center for Security and Emerging Technology | 7
Two additional methodological decisions are of note. First, keeping in mind that inventors can file for patents in multiple countries, when comparing countries’ patent outputs, we allocated patents based on the country of the priority document, namely, where the first patent application in the patent family was filed. Second, we determine the year of publication by using the latest publication date of any document in a patent family. This method is consistent with previous CSET research and has the advantage of capturing information from the latest amendments and filings for a patent family.10 As a robustness check, we also conducted our analysis by extracting the year variable from the earliest “patent grant” document, i.e., the document certifying the first patent’s approval in a given patent family. The results from this analysis were not significantly different from the findings included in the report, and are available in Table 1A in the Appendix.
With that, our data covers robotics patents filed across 88 countries between the years 2005 and 2019, drawing on a database curated by 1790 Analytics. 1790 Analytics maintains internal databases of patents from the U.S. Patent and Trademark Office, the European Patent Office, and the World Intellectual Property Organization (WIPO), with the robotics patent universe outlined through a combination of keywords and patent classifications made available by the Cooperative Patent Classification and the International Patent Classification.11 The focus on this time period is motivated by data availability, with 2019 as the cutoff year because of delays in processing of patent applications. While we report trends in terms of totals from this time period, we also offer the most recent data on granted robotics patents by looking at trends and patterns from 2018-2019.
Robotics Patents: A Look Around the World
Between 2005 and 2019, 72,618 robotics patents were granted worldwide. Table 1 below shows the top 10 countries in terms of granted robotics patents and their respective share of the global total for this period of time.
Center for Security and Emerging Technology | 8
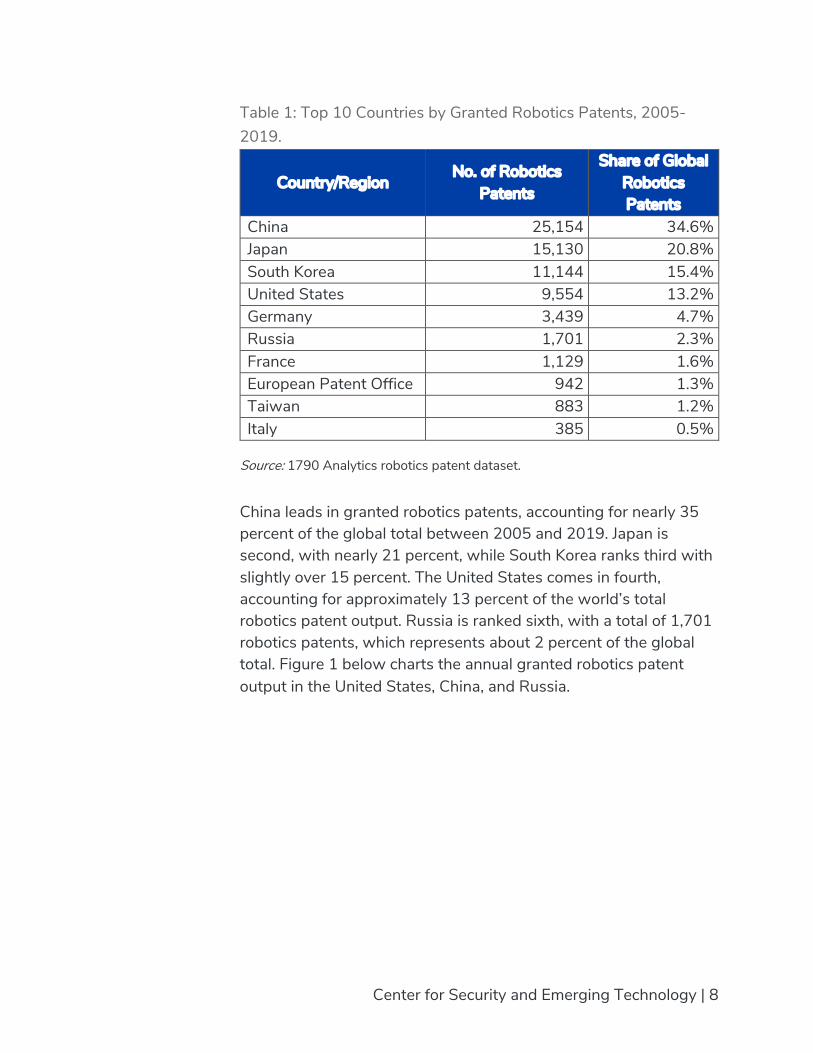
Table 1: Top 10 Countries by Granted Robotics Patents, 2005-2019.
Country/Region No. of Robotics
Patents
Share of Global Robotics Patents
China 25,154 34.6% Japan 15,130 20.8% South Korea 11,144 15.4% United States 9,554 13.2% Germany 3,439 4.7% Russia 1,701 2.3% France 1,129 1.6% European Patent Office 942 1.3% Taiwan 883 1.2% Italy 385 0.5%
Source: 1790 Analytics robotics patent dataset.
China leads in granted robotics patents, accounting for nearly 35 percent of the global total between 2005 and 2019. Japan is second, with nearly 21 percent, while South Korea ranks third with slightly over 15 percent. The United States comes in fourth, accounting for approximately 13 percent of the world’s total robotics patent output. Russia is ranked sixth, with a total of 1,701 robotics patents, which represents about 2 percent of the global total. Figure 1 below charts the annual granted robotics patent output in the United States, China, and Russia.
Center for Security and Emerging Technology | 9
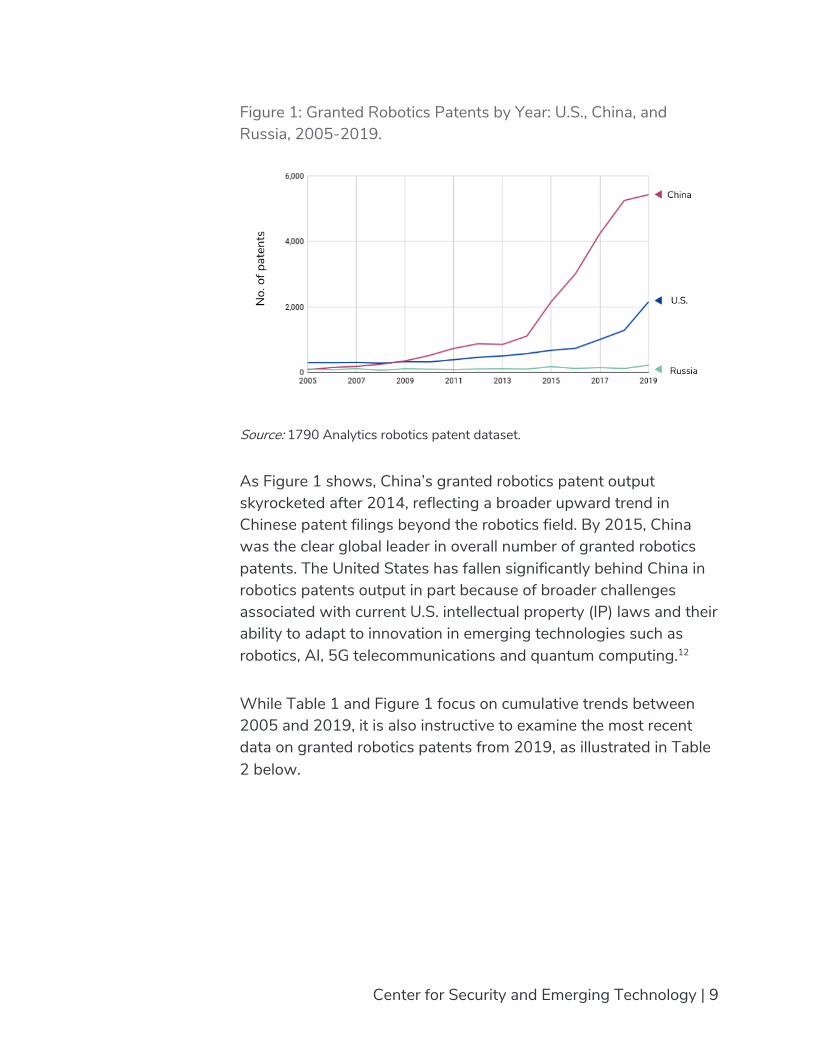
Figure 1: Granted Robotics Patents by Year: U.S., China, and Russia, 2005-2019.
Source: 1790 Analytics robotics patent dataset.
As Figure 1 shows, China’s granted robotics patent output skyrocketed after 2014, reflecting a broader upward trend in Chinese patent filings beyond the robotics field. By 2015, China was the clear global leader in overall number of granted robotics patents. The United States has fallen significantly behind China in robotics patents output in part because of broader challenges associated with current U.S. intellectual property (IP) laws and their ability to adapt to innovation in emerging technologies such as robotics, AI, 5G telecommunications and quantum computing.12
While Table 1 and Figure 1 focus on cumulative trends between 2005 and 2019, it is also instructive to examine the most recent data on granted robotics patents from 2019, as illustrated in Table 2 below.

Center for Security and Emerging Technology | 10
Table 2: Top 10 Countries by Granted Robotics Patents, 2019.
Country/Region
No. of Robotics
Patents in 2019
Share of Global Robotics Patents in
2019
China 5,430 43.3% United States 2,155 17.2% Japan 1,903 15.2% South Korea 1,215 9.7% Germany 566 4.5% Russia 217 1.7% European Patent Office 210 1.7% France 191 1.5% Taiwan 135 1.1% United Kingdom 72 0.6%
Source: 1790 Analytics robotics patent dataset.
To a great extent, this 2019 list of top 10 countries reflects the longer term trends that produced the overall granted robotics patents numbers and rankings in Table 1. In addition to trends over time, robotics patenting activity also reflects trends in overall patent output. According to 2019 WIPO data, seven out of the 10 countries in Table 2 also topped the global charts in patent grants across various applications and fields: China, United States, Japan, European Patent Office, South Korea, Russia, and Germany (see Table 2A in the Appendix).
With over 43 percent of the global output in 2019, the most recent data shows China as the clear leader in granted robotics patents. The surge in Chinese patenting activity and robotics development may be the result of a deliberate government effort to garner a majority market share over China’s domestic robotics market and with that, become a world leader in robotics, as outlined in the Made in China 2025 plan.13 To accelerate innovation and grow its patent output, the Chinese government offered a range of incentives (and pressures) to individual inventors, universities, companies, and other relevant entities. For instance, regional

Center for Security and Emerging Technology | 11
governments throughout China provided robust cost reimbursement subsidies to patent filers that often exceeded the cost of patent filing. Universities were instructed to include patent filing numbers as a measure in professors’ and departments’ performance evaluations. Patent filing numbers were also added as criterion for determining university rankings. 14
In January 2021, however, the Chinese government announced an end to these incentives and measures. Still, other incentives remain. For example, companies with a certain number of patents receive preferential corporate tax rates. Additionally, patent filings are a requirement for companies to be listed on the Shanghai Stock Exchange’s Science & Technology Board.15 These temporary and ongoing incentives for patent filings may partially explain China’s ascendance to leadership in robotics patenting.
China’s rapid rise in this space inevitably raises questions about the quality of granted Chinese patents. One way to evaluate the quality of patents is to differentiate between the highly innovative “invention patents” and the lower-quality “utility models.”16 IP protections that fall into this latter category are typically cheaper to file, easier to secure, and have a lower threshold for novelty compared to invention patents. Previous research shows that utility models account for a greater share of Chinese patents than invention patents, casting doubt on the quality of Chinese innovation.17 Our analysis, however, only includes invention patents, indicating that China still outperforms all other countries in robotics patents, even when only examining this category of higher quality invention patents. A recent CSET report on China’s robotics patent landscape explores these and other issues in greater detail.18
In addition to overall output, the specific categories of robotics patents also merit attention. The robotics patent data in our dataset are disaggregated into 18 different robotics patent “types” and “features.”19 The categories in the robot type dimension include aerospace, agriculture, consumer, education, entertainment, humanoid/exoskeleton, industrial, medical, military/security, telepresence, transportation, and underwater. The categories in the robot features dimension include artificial intelligence, physical
Center for Security and Emerging Technology | 12
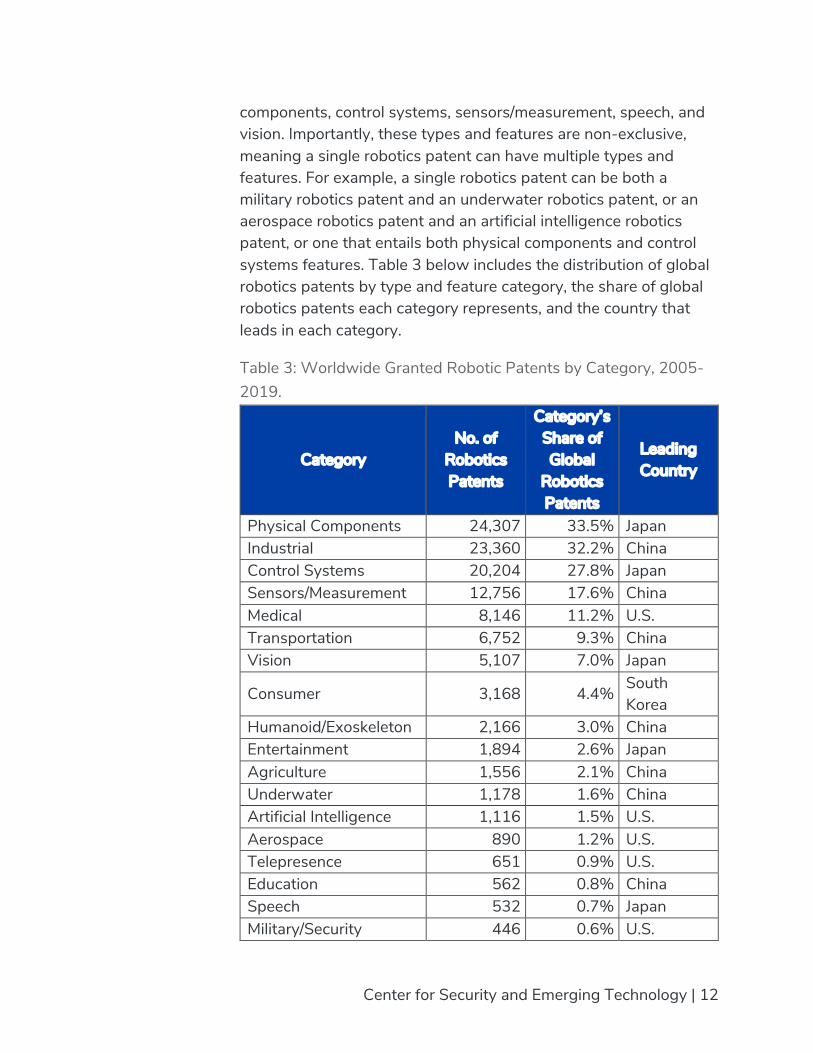
components, control systems, sensors/measurement, speech, and vision. Importantly, these types and features are non-exclusive, meaning a single robotics patent can have multiple types and features. For example, a single robotics patent can be both a military robotics patent and an underwater robotics patent, or an aerospace robotics patent and an artificial intelligence robotics patent, or one that entails both physical components and control systems features. Table 3 below includes the distribution of global robotics patents by type and feature category, the share of global robotics patents each category represents, and the country that leads in each category.
Table 3: Worldwide Granted Robotic Patents by Category, 2005-2019.
Category No. of
Robotics Patents
Category’s Share of Global
Robotics Patents
Leading Country
Physical Components 24,307 33.5% Japan Industrial 23,360 32.2% China Control Systems 20,204 27.8% Japan Sensors/Measurement 12,756 17.6% China Medical 8,146 11.2% U.S. Transportation 6,752 9.3% China Vision 5,107 7.0% Japan
Consumer 3,168 4.4% South Korea
Humanoid/Exoskeleton 2,166 3.0% China Entertainment 1,894 2.6% Japan Agriculture 1,556 2.1% China Underwater 1,178 1.6% China Artificial Intelligence 1,116 1.5% U.S. Aerospace 890 1.2% U.S. Telepresence 651 0.9% U.S. Education 562 0.8% China Speech 532 0.7% Japan Military/Security 446 0.6% U.S.

Center for Security and Emerging Technology | 13
Source: 1790 Analytics robotics patent dataset.
Looking at the most prominent types and features of granted robotics patents within this time period, as shown in Table 3, there are a number of notable observations. About 33 percent of granted robotics patents between 2005 and 2019 entail physical components, nearly 28 percent deal with control systems, and close to 18 percent pertain to measurement/sensors. These features are the core parts of a robot which allow it to receive commands, carry out specified tasks, and make sense and respond to the environment around it. In terms of type, more than 32 percent of granted robotics patents fall within the industrial robotics category. Although industrial robotics have been a feature of manufacturing, production and other related facilities since the middle of the 20th century, the decreased costs and increased efficiency associated with the automation of repetitive tasks have fueled innovation in this field. About 11 percent of granted robotics patents are in the medical robotics category, and slightly over 9 percent are in transportation.
Less than 2 percent of the granted robotics patents worldwide were classified as having artificial intelligence features. AI has many applications for robotics, including serving as the intelligent software behind autonomous vehicles and helping customer service robots better interact with customers through advanced natural language processing abilities. AI enables greater flexibility, accuracy, and a broader range of functionalities for robots, including image and object recognition, motion control, grasping objects, analytics, perception, communications, and learning. That said, robotics patents with AI features are not the same as AI patents. CSET has published a study of trends in AI patenting that analyzed 287,532 AI patent documents that included 56,677 granted AI patents worldwide between 2000 and 2020.20 Comparatively, as Table 3 above shows, our data contains only 1,116 granted robotics patents with AI features between 2005 and 2019.
When looking at the countries responsible for the most robotics patents granted in each of the aforementioned categories between 2005 and 2019, the United States leads in aerospace, medical,

Center for Security and Emerging Technology | 14
military/security, telepresence, and AI. Meanwhile, Japan leads in robotics patents that entail physical components and those classified under categories such as entertainment, control systems, speech and vision. China tops the chart in robotics patents for industrial applications, sensors/measurement, transportation, humanoid/exoskeleton, agriculture, underwater and education, while South Korea leads in consumer robotics patents. Although Russia does not hold the top spot in any of the examined categories, it is ranked third in military robotics patents and fourth in underwater robotics patents. While these rankings may seem higher than one would expect based on Russia's overall patent output, they are indicative of both the country’s priority areas for innovation (military robotics) and areas of traditional technological leadership (underwater technology).
As previously noted, robotics patent categories are not exclusive and patents can fall into more than one category. In fact, there are over 300 possible category interactions between the 18 different types and features of robotics patents. Table 4 below shows the 15 most common category interactions for granted robotics patents worldwide between 2005 and 2019.
Table 4: Top Category Interactions for Worldwide Granted Robotics Patents, 2005-2019.
Robotics Category #1 Robotics Category #2 No. of
Robotics Patents
Industrial Physical components 8,916 Physical components Control systems 7,931
Control systems Sensors/ Measurement
5,643
Industrial Control systems 5,028
Physical components Sensors/ Measurement
4,356
Control systems Vision 3,553
Industrial Sensors/ Measurement
2,628
Sensors Measurement
Vision 2,131

Center for Security and Emerging Technology | 15
Transportation Physical components 2,059 Transportation Control systems 2,011 Physical components Vision 1,679 Medical Physical components 1,609 Medical Control systems 1,355 Industrial Transportation 1,347 Consumer Control systems 1,276
Medical Sensors/ Measurement
1,215
Source: 1790 Analytics robotics patent dataset.
Between 2005 and 2019, 8,916 robotics patents coined various devices, mechanisms and solutions that had to do with physical components for industrial robotics. Examples of such patents include a South Korean duct cleaning robot and a duct cleaning method that can clean the interior of a duct which is difficult to reach by a human hand, and a Japanese robot for spot welding.21 The second most common robotics patent category interaction entails control systems and physical components, such as control devices for robot arms or for a multi-joint robot equipped with several legs, wireless control systems for mobile robots, and different manipulators that help control the movements and functions of the robot.
Patents that have to do with industrial robotics also frequently feature innovations pertaining to control systems (5,028) and sensors/measurement (2,628 patents), as well as overlap with the transportation sector (1,347). Meanwhile, robotics patents in both the transportation sector and the medical sector often include features related to a robot’s physical components and control systems.
Robotics Patents: A Look Inside Russia
While the global competition for technological superiority is often discussed as a two-horse race between the United States and China, Russia’s advances in cutting edge technologies like robotics and AI can have a disruptive effect on U.S. strategic interests, and

Center for Security and Emerging Technology | 16
therefore merit attention.22 As a whole, Russia’s science and technology innovation ecosystem shows some positive trends. The country ranks in the top 10 globally in spending on research and development, has a history of rigorous STEM education, and is currently advancing a range of government initiatives designed to propel progress in emerging technologies.23
That said, Russia ranks 47th on the WIPO Global Innovation Index, and displays weakness in the quality of its institutions and regulations.24 Research and development is largely funded and led by public institutions and state-owned firms, while the private sector invests relatively little in science and technology R&D.25 Weak enforcement of intellectual property rights has been a major barrier for the commercialization of the country’s research and development investments. 26 Russia also struggles to develop, attract and retain the talent that drives scientific productivity. More fundamentally, however, the country’s science and technology community is adversely affected by broader systemic and societal problems such as low levels of external and internal openness, economic stagnation, bureaucratic complexity, and corruption.27
The Federal Service for Intellectual Property (Rospatent) is the authority in charge of registering patents in Russia. As in many other countries, legal protections for intellectual property in Russia can be secured through patents, trademarks, or trade secrets.28 While the Russian patents system covers three types of IP objects—inventions, utility models, and industrial designs—our data only includes invention patents to allow for a more accurate cross-country comparison and a focus on higher quality innovations.
According to 2019 data from WIPO, Russia ranked sixth in the world in granted patents.29 With 34,008 granted patents that year, however, Russia remains far behind China, which leads the world with 452,804 granted patents, and even behind South Korea which is ranked fifth with 125,661 granted patents. Russia’s patent office also recorded a 6.4 percent decline in applications in 2019, compared to 2018. Notably, patent offices in nine of the top 20 patent-producing countries around the world reported a similar decline, with China’s being the steepest at 9.2 percent.30

Center for Security and Emerging Technology | 17
When assessing the robotics landscape in Russia, the International Federation of Robotics estimates that “the potential for robot installations could be expensive in Russia.”31 An optimistic interpretation of this assessment points to the large and still growing domestic market for consumer products, the government’s push toward the digital transformation of the economy, and automation and modernization of production. Russia's stock of operational robots, i.e. the number of industrial robots in use in a given year, has indeed been growing steady by about 18 percent a year since 2014, and was estimated at 6,185 units in 2019. Installations of industrial robots—the number of new industrial robots purchased that year—increased by 40 percent in 2019, adding 1,410 units to the previous year’s total.
This ‘extensive’ potential for increasing the deployment of industrial robots, however, also points to a relatively low baseline. Russia is ranked 32nd in the world in operational stock, lagging behind countries such as India, Indonesia and Turkey. Relatedly, Russia’s robot density, i.e. the number of industrial robots as a share of manufacturing workers, is also quite low, with six robots per 10,000 workers.32 The global average robot density in the manufacturing industry is at 113 units per 10,000 employees; in the United States that number stands at 228. Singapore, which leads the world in robot adoption, has 918 robots per 10,000 workers.
There is no simple explanation for why some countries lead in robot adoption while others lag. Factors such as wages, the size of the automotive industry, ratios of middle-aged workers, power of industrial unions, and cultural attitudes all play a role.33 Still, the fact that Russia’s manufacturing sector is so far behind in robotization and automation has troubling implications for productivity and competitiveness, especially for the automotive and electronics industries, which are heavily reliant on robotics.
In other metrics, however, the picture is less grim. For instance, in 2019, Russia had 73 service robot supply companies, only second to the United States. Of these service robotics companies, 86 percent are focused on professional applications, which generally entail robots performing commercial tasks such as cleaning public
Center for Security and Emerging Technology | 18
spaces, delivery robots in offices, fire-fighting robots, and rehabilitation or surgery robots in hospitals.34 Previous CSET research has also found that robotics is one of the top areas of AI-related research among Russian scientists.35
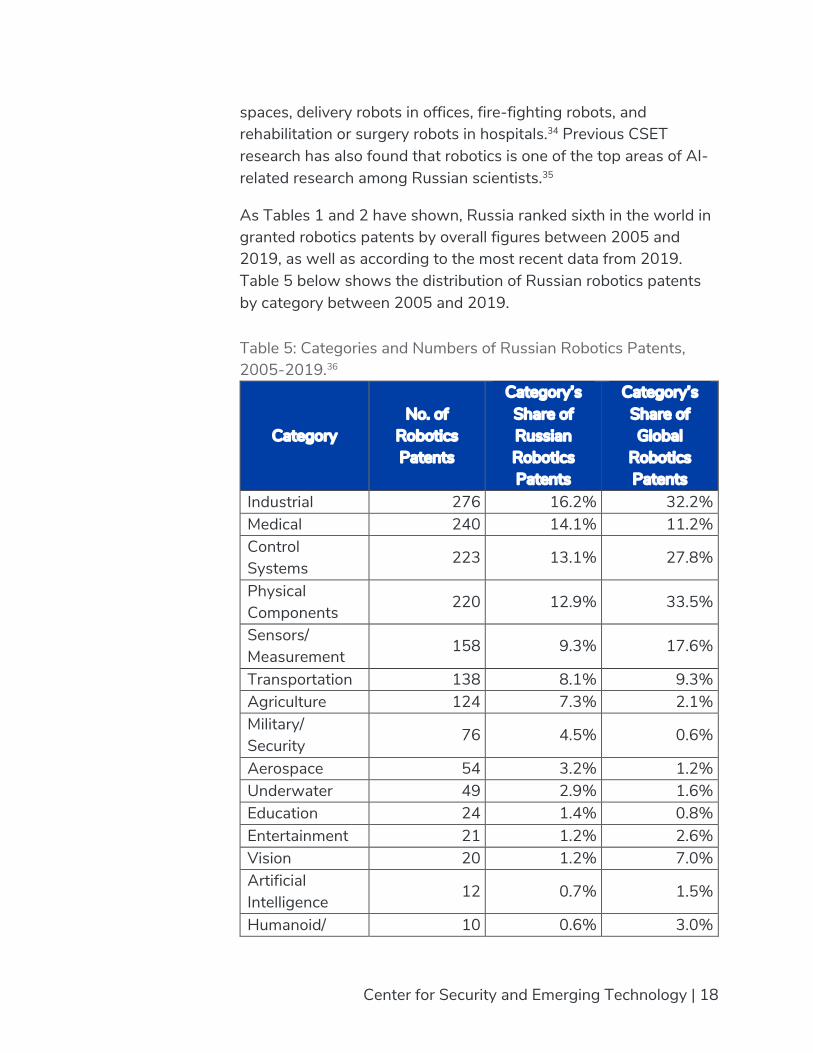
As Tables 1 and 2 have shown, Russia ranked sixth in the world in granted robotics patents by overall figures between 2005 and 2019, as well as according to the most recent data from 2019. Table 5 below shows the distribution of Russian robotics patents by category between 2005 and 2019.
Table 5: Categories and Numbers of Russian Robotics Patents, 2005-2019.36
Category No. of
Robotics Patents
Category’s Share of Russian Robotics Patents
Category’s Share of Global
Robotics Patents
Industrial 276 16.2% 32.2% Medical 240 14.1% 11.2% Control Systems
223 13.1% 27.8%
Physical Components
220 12.9% 33.5%
Sensors/ Measurement
158 9.3% 17.6%
Transportation 138 8.1% 9.3% Agriculture 124 7.3% 2.1% Military/ Security
76 4.5% 0.6%
Aerospace 54 3.2% 1.2% Underwater 49 2.9% 1.6% Education 24 1.4% 0.8% Entertainment 21 1.2% 2.6% Vision 20 1.2% 7.0% Artificial Intelligence
12 0.7% 1.5%
Humanoid/ 10 0.6% 3.0%

Center for Security and Emerging Technology | 19
Exoskeleton Consumer 9 0.5% 4.4% Speech 3 0.2% 0.7% Telepresence 1 0.1% 0.9%
Source: 1790 Analytics robotics patent dataset.
The top six categories of Russian robotics patents—industrial, medical, control systems, physical components, sensors/measurement, and transportation—reflect the global distribution (Table 3), albeit not in the exact same order. Robotics patents related to agriculture account for slightly more than 7 percent of Russia’s overall robotics patents output, compared to 2 percent globally.
Perhaps most notable, however, is the difference between global and Russian trends in military robotics patents: while military robotics patents account for less than 1 percent of the global robotics patent output, this category represents 4.5 percent of Russia’s robotics patent output. We discuss trends in global and Russian military robotics patents in more detail in the next section.
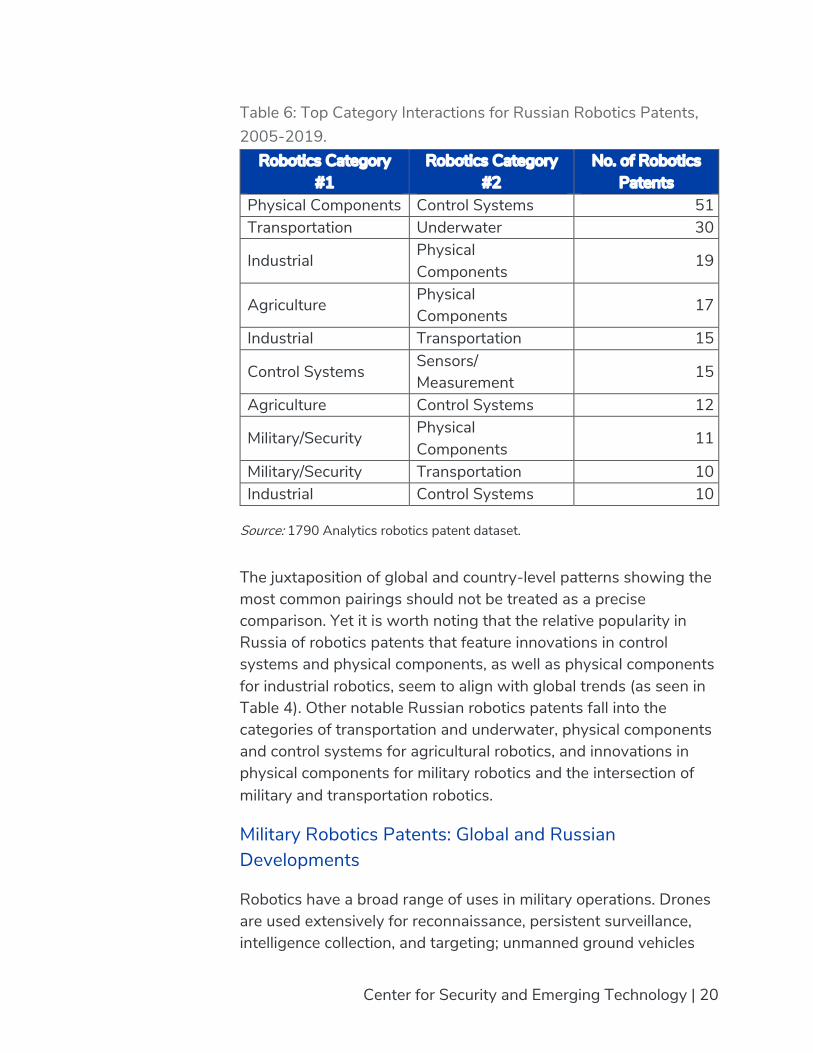
Robotics patents can fall into more than one category. Examining the different interactions between the various robotics patents types and features can provide further insights into areas of comparative advantage, as well as industries and technologies a country may be prioritizing in its innovation strategy. That said, because of the high number of possible category interactions and the relatively low number of overall Russian robotics patents, it is likely that even the most common category interactions will feature a relatively low number of patents. As such, substantive interpretations of patterns gleaned from this data should be done with care. Table 6 below includes the most common category interactions for granted robotics patents in Russia (specifically, those category interactions that had more than 10 patents).
Center for Security and Emerging Technology | 20
Table 6: Top Category Interactions for Russian Robotics Patents, 2005-2019.
Robotics Category #1
Robotics Category #2
No. of Robotics Patents
Physical Components Control Systems 51 Transportation Underwater 30
Industrial Physical Components
19
Agriculture Physical Components
17
Industrial Transportation 15
Control Systems Sensors/ Measurement
15
Agriculture Control Systems 12
Military/Security Physical Components
11
Military/Security Transportation 10 Industrial Control Systems 10
Source: 1790 Analytics robotics patent dataset.
The juxtaposition of global and country-level patterns showing the most common pairings should not be treated as a precise comparison. Yet it is worth noting that the relative popularity in Russia of robotics patents that feature innovations in control systems and physical components, as well as physical components for industrial robotics, seem to align with global trends (as seen in Table 4). Other notable Russian robotics patents fall into the categories of transportation and underwater, physical components and control systems for agricultural robotics, and innovations in physical components for military robotics and the intersection of military and transportation robotics.
Military Robotics Patents: Global and Russian Developments
Robotics have a broad range of uses in military operations. Drones are used extensively for reconnaissance, persistent surveillance, intelligence collection, and targeting; unmanned ground vehicles
Center for Security and Emerging Technology | 21
are increasingly employed for demining, logistical support and casualty evacuation; unmanned maritime vehicles are used for surveillance and mapping of undersea environments, mine countermeasures, and anti-submarine warfare. Robots can help ease the cognitive and physical burden on military personnel, increase their situational awareness, reduce exposure to dangerous missions, and provide protection from enemy fire. While the majority of today’s military robotics systems are remotely operated, with advances in AI, robots will be able to take on a broader range of tasks with increasing autonomy and independence in both combat and non-combat situations.
Between 2005 and 2019, 446 military robotics patents were granted to inventors around the world, accounting for 0.6 percent of the total granted robotics patents (see Table 3). Considering that military robotics patents account for only a fraction of overall robotics patents, it is not surprising that this pattern is also evident when looking at the individual countries responsible for most of the military robotics patents. For the United States, granted military robotics patents account for about 1 percent of its total robotics patents, while for China, it's approximately 0.5 percent; even for Russia, it's about 4.5 percent. Ukraine, where military robotics patents account for over 15 percent of the total granted robotics patents, is a notable outlier (see Table 3A in the Appendix).
One explanation for the relatively low overall number of granted military robotics patents is that countries have restrictions on patenting military technology due to national security concerns. Patent filings require a certain amount of information disclosure to claim rights over a scientific or technological invention and potentially turn said rights into profit. Making information about the contents of military robotics inventions publicly available could expose sensitive details that may be exploited by competing companies or adversaries. Disclosure of scientific or technological advances for patenting purposes could also open the door to others who seek to reverse engineer said advances, which in turn could undermine the technological advantage a particular company or country hopes to gain from these innovations. On the other hand, without the intellectual property rights secured through
Center for Security and Emerging Technology | 22
patenting, there is little inventors can do when illegal copying occurs, at least not in the legal sense.
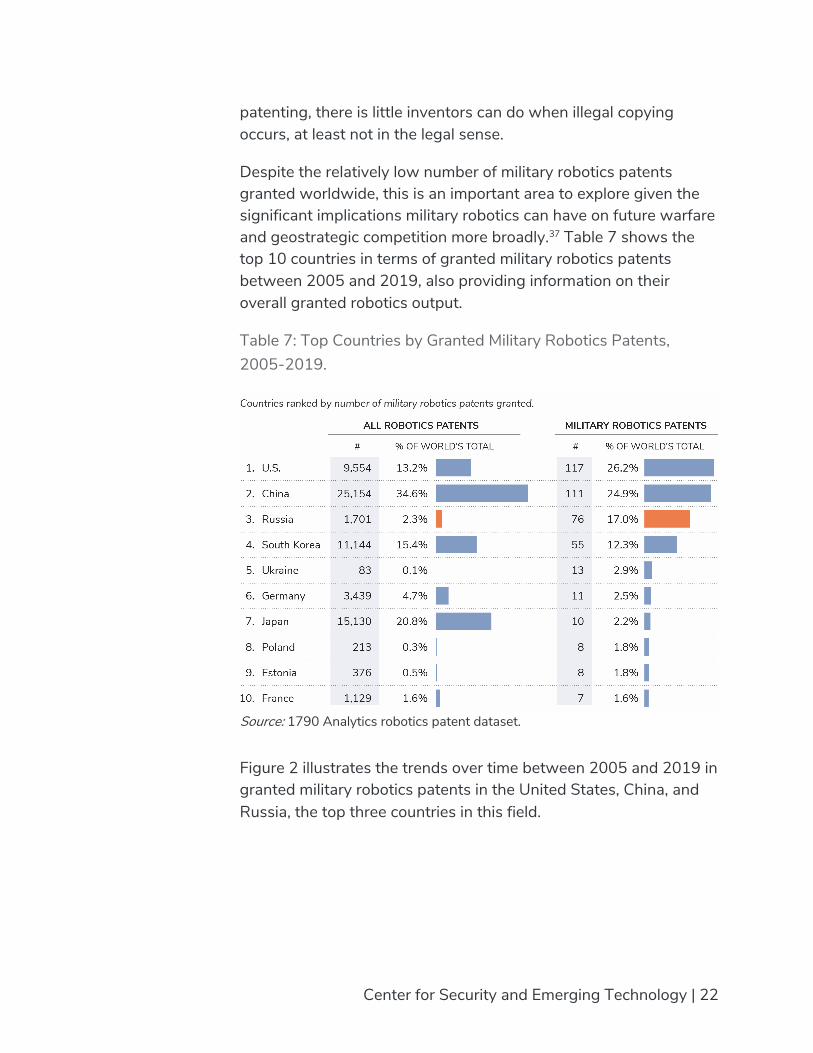
Despite the relatively low number of military robotics patents granted worldwide, this is an important area to explore given the significant implications military robotics can have on future warfare and geostrategic competition more broadly.37 Table 7 shows the top 10 countries in terms of granted military robotics patents between 2005 and 2019, also providing information on their overall granted robotics output.
Table 7: Top Countries by Granted Military Robotics Patents, 2005-2019.
Source: 1790 Analytics robotics patent dataset.
Figure 2 illustrates the trends over time between 2005 and 2019 in granted military robotics patents in the United States, China, and Russia, the top three countries in this field.

Center for Security and Emerging Technology | 23
Figure 2: Granted Military Robotics Patents by Year: U.S., China, and Russia, 2005-2019.
Note: According to this data, there were no military robotics patents granted in Russia in 2012.
Source: 1790 Analytics robotics patent dataset.
As evident in Figure 2, the United States was the leader in military robotics patents from 2005 until 2015, when it was first surpassed by Russia. Meanwhile, Chinese output of military robotics patents, which grew slowly up until 2015, accelerated significantly afterwards, with China becoming the global leader after 2016. This trend reflects a broader push on behalf of the Chinese government to raise the country’s science and technology profile and propel innovation.
As Table 7 shows, the United States accounts for about 13 percent of robotics patents granted worldwide between 2005 and 2019, but over a quarter of military robotics patents. U.S. military spending, including on research, development, and procurement, dwarfs that of other nations.38 The U.S. Navy and Army are among the top assignees of military robotics patents in the United States, alongside defense giants such as Raytheon, Boeing, L3Harris Technologies, and Northrop Grumman Corp.
China, however, is a very close second, once again illustrating the country’s broader push to accelerate technological innovation and

Center for Security and Emerging Technology | 24
reach a position of global leadership in emerging technologies. Robotics is one of the strategic industries named in the PRC’s “Made in China 2025” plan that seeks to increase China’s domestic innovation, as well as a key area where the PRC supplements national science and technology innovation with foreign technologies and knowledge transfers, both licit and illicit.39 In terms of military robotics developments, China has dominated the export market for armed drones since 2011.40 The PLA is reportedly developing a broad range of robotic and unmanned systems, including ground systems for logistics and multipurpose unmanned surface vessels intended for export.41
Now, while the United States and China are both among the top three countries in overall robotics patent output, Russia lags behind quite significantly. Therefore, it is particularly notable that while Russia accounts for about 2 percent of the global robotics patents total, it is responsible for 17 percent of global military robotics patents.
Russia’s notable output in military robotics patents reflects its broader military modernization and technology development priorities.42 The country’s defense establishment views the development and fielding of military robotics as key to minimizing personnel losses in combat, as well as for gaining advantage over the enemy in the air, land, and sea. Over the past two decades, the Russian military has modernized existing, and developed new, robotics capabilities, including “combat vehicle fire systems; multiple-launch rocket systems; radiological reconnaissance; logistic transport; use in space; crewless ships and submarines; and robotic swarms and group interactions, among many others.”43 Several of the granted military robotics patents pertain to different functionalities and capabilities for unmanned vehicles, especially ground vehicles, or robotic complexes as they are often referred to in Russian military parlance. One of the top recipients of Russian military robotics patents is the Degtyarev Plant—a leading weapons manufacturer and a subsidiary of the state-owned defense conglomerate, Rostec.44 In June of 2013, Russia’s then deputy prime minister, Dmitry Rogozin, announced plans for a new military robot laboratory at the Degtyarev Plant.45 According to

Center for Security and Emerging Technology | 25
submitted patent documents, the Degtyarev Plant has been granted patent rights for different inventions that expand the technical capabilities of robotic complexes through improved controllability, more accurate navigation, increased cruising range, higher degree of automation and autonomy, faster information processing, and other enhancements. The Degtyarev Plant has also been working with the Foundation for Advanced Research (Russia’s version of DARPA) on the Nerekhta armed UGV.46 These inventions and developments directly align with the emphasis Russian ground force analysts put on “increasing the role and improving the robotization of equipment, first and foremost, on board fire resources,” as evident in the aforementioned Nerekhta armed UGV as well as in systems such as Vikhr, Uran-9, Soratnik, and Platforma-M.47
Notably, it is possible that a great deal of patent-worthy innovation in Russian military robotics is left unobserved. Some Russian officials have expressed frustration that Russian defense companies do not file for patents for Russian weapons and equipment abroad. As one Rostec executive has noted, “such foreign companies as Raytheon and BAE Systems have up to 5,000 patents abroad. They disclose their intellectual property, for they see no risks. In the meantime, neither our Defense Ministry nor defense-industrial complex enterprises have registered patents abroad.”48 Although this estimate almost certainly refers to patents writ large, rather than robotics patents or military robotics patents specifically, this observation is relevant. It is also revealing that, despite the fact that Russian scientists and inventors working in the defense space are much more reluctant to file for patents than their American counterparts, Russia still ranks third globally when it comes to military robotics patents.
Center for Security and Emerging Technology | 26
Conclusion
Advances in robotic technology are having a transformative impact on how people work, travel, communicate, receive services, and fight wars. Industrial robots increase the speed and efficiency of manufacturing, assembly, packaging, and handling of materials and products across a wide range of industries and sectors, from automotives to electronics to agriculture. Medical robots assist with surgery and handle logistical tasks that support comprehensive patient care. Developments in military robotics are redefining what is possible for human-machine teaming, as intelligent machines are deployed to support, protect and, at times, replace human soldiers in dangerous and hostile environments. With advances in artificial intelligence, increasingly autonomous robots will be able to take on a broader variety of tasks with greater independence and control. Whether it is education, transportation, industry and manufacturing, or warfighting, innovation in robotics technology is omnipresent and deeply consequential.
Patent activity is a useful way to track technological advancements in robotics. While comparisons of patent output across different countries are not without limitations, they can nonetheless help identify areas of comparative advantage and expanding innovation.
Drawing on data on robotics patents granted to inventors from 88 countries between 2005 and 2019, this report shows that China, Japan, and South Korea lead the world in robotics patents. The United States ranks fourth in overall output, but leads in strategically important categories such as aerospace, military/security, and AI. Russia, meanwhile, is ranked sixth, accounting for about 2 percent of the global robotics patents output, but 17 percent of military robotics patents.
Robotics patents that fall under the military/security category represent a very small share of global robotics patents. Innovation in this space is likely underreported, or at least, uncredited in terms of intellectual property rights. Countries usually prefer to keep their advanced military technologies secret, whether because they want to keep the element of surprise in a potential confrontation or avoid global condemnation for developing destructive and dangerous
Center for Security and Emerging Technology | 27
weaponry. Tracking innovation in military robotics, however, is critical for assessing and anticipating the military capabilities of both U.S. allies and competitors. Keeping close watch on military robotics inventions is therefore part of ensuring that the United States military retains its technological and operational advantage in future conflicts.
Because robotics technology can be leveraged across so many sectors and industries, innovation in robotics is part of the broader global technological competition, and relatedly, the intensifying strategic competition with China. As the National Security Commission on Artificial Intelligence points out, “China has met its strategic goal of increasing the quality of its patent applications and issued patents, creating the narrative that it has “won” the innovation race.”49 Amending U.S. intellectual property policies, patent eligibility and patentability doctrine to better accommodate inventions related to emerging technologies such as AI and software for robotics is a critical step toward restoring U.S. leadership in this space. Moreover, to win the technology competition, the United States needs to work closely with its allies and partners. Notably, key U.S. allies like Japan, South Korea, and Germany are at the forefront of robotics innovation. There are therefore many opportunities for collaboration, including in research and development, standards-setting, and support for commercialization of inventions.
Center for Security and Emerging Technology | 28
Authors
Margarita Konaev is an Associate Director of Analysis and a Research Fellow at CSET, where Sara Abdulla is a Data Research Analyst.
Acknowledgements
For review, feedback, and editorial support, the authors would like to thank Igor Mikolic-Torreira, Catherina Aiken, Dewey Murdick, Danny Hague, Lynne Weil, Rebecca Gelles, Melissa Deng, Patrick Thomas, Anthony Breitzman, Samuel Bendett, Alexander Kott, Dale Brauner, and Farhana Hossein.
© 2021 by the Center for Security and Emerging Technology. This work is licensed under a Creative Commons Attribution-Non Commercial 4.0 International License.
To view a copy of this license, visit https://creativecommons.org/licenses/by-nc/4.0/.
Document Identifier: doi: 10.51593/20210012
Center for Security and Emerging Technology | 29
Appendix
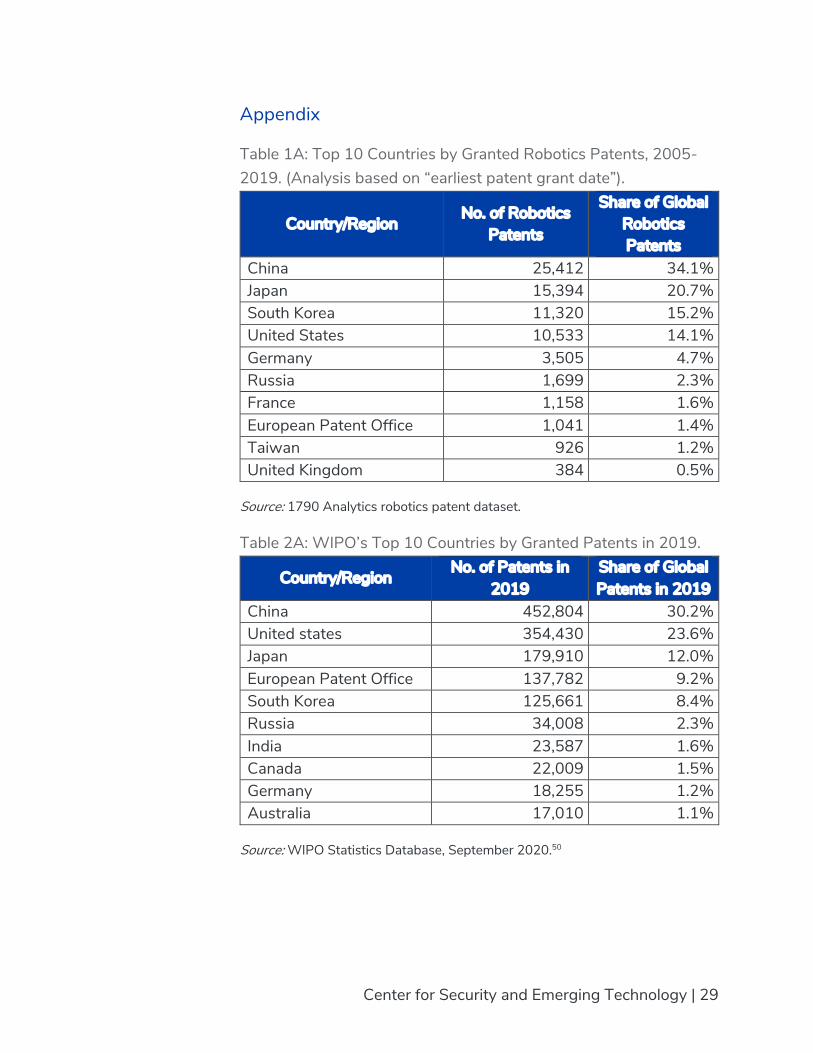
Table 1A: Top 10 Countries by Granted Robotics Patents, 2005-2019. (Analysis based on “earliest patent grant date”).
Country/Region No. of Robotics
Patents
Share of Global Robotics Patents
China 25,412 34.1% Japan 15,394 20.7% South Korea 11,320 15.2% United States 10,533 14.1% Germany 3,505 4.7% Russia 1,699 2.3% France 1,158 1.6% European Patent Office 1,041 1.4% Taiwan 926 1.2% United Kingdom 384 0.5%
Source: 1790 Analytics robotics patent dataset.
Table 2A: WIPO’s Top 10 Countries by Granted Patents in 2019.
Country/Region No. of Patents in
2019 Share of Global Patents in 2019
China 452,804 30.2% United states 354,430 23.6% Japan 179,910 12.0% European Patent Office 137,782 9.2% South Korea 125,661 8.4% Russia 34,008 2.3% India 23,587 1.6% Canada 22,009 1.5% Germany 18,255 1.2% Australia 17,010 1.1%
Source: WIPO Statistics Database, September 2020.50

Center for Security and Emerging Technology | 30
Table 3A: Top Countries by Military Robotics Patents, 2005-2019.
Country
No. of Military
Robotics Patents
Country’s Share of Global Military Robotics Patents
Proportion of Country’s Robotics
Patents that are Military
Country 117 26.2% 1.2% China 111 24.9% 0.4% Russia 76 17.0% 4.5% South Korea
55 12.3% 0.5%
Ukraine 13 2.9% 15.7% Germany 11 2.5% 0.3% Japan 10 2.2% 0.1% Poland 8 1.8% 3.8% Estonia 8 1.8% 2.1% France 7 1.6% 0.6%
Source: 1790 Analytics robotics patent dataset.
Center for Security and Emerging Technology | 31
Endnotes
1 “World Robotics 2020, Industrial Robots” (International Federation of Robotics, 2020), 37, http://www.worldrobotics.org.
2 “New technologies to improve Amazon employee safety,” Amazon, June 13, 2021, https://www.aboutamazon.com/news/innovation-at-amazon/new-technologies-to-improve-amazon-employee-safety.
3 Erico Guizzo and Randi Klett, “How robots became essential workers in the COVID-19 response,” IEEE Spectrum, September 30, 2020, https://spectrum.ieee.org/robotics/medical-robots/how-robots-became-essential-workers-in-the-covid19-response.
4 IFR (International Federation of Robotics). (2020). World robotics 2020. Service Robots, 181. International Federation of Robotics, Frankfurt am Main. Retrieved from http://www.worldrobotics.org.
5 Dan Gettinger, “The Drone Databook” (The Center for the Study of the Drone at Bard College, 2019), https://dronecenter.bard.edu/files/2019/10/CSD-Drone-Databook-Web.pdf.
6 Carol Robbins, Derek Hill, and Mark Boroush, “Invention, Knowledge Transfer, and Innovation,” National Science Foundation | National Science Board, https://ncses.nsf.gov/pubs/nsb20204/.
7 “World Intellectual Property Indicators 2020” (World Intellectual Property Organization, 2020), 20, https://www.wipo.int/edocs/pubdocs/en/wipo_pub_941_2020.pdf.
8 “World Intellectual Property Indicators 2020,” 20-21.
9 Patrick Thomas, “The Robotics Patent Landscape–Study Overview and Methodology” (Report prepared for CSET by 1790 Analytics LLC., October 9, 2020), 2.
10 Sara M. Abdulla, “China’s Robotics Patent Landscape” (Center for Security and Emerging Technology, August 2021), https://cset.georgetown.edu/wp-content/uploads/CSET-Chinas-Robotics-Patent-Landscape.pdf.
11 Thomas, “The Robotics Patent Landscape.”
Center for Security and Emerging Technology | 32
12 National Security Commission on Artificial Intelligence, Final Report (Washington, DC: NSCAI, March 2021), 200, https://www.nscai.gov/wp-content/uploads/2021/03/Full-Report-Digital-1.pdf.
13 “Made in China 2025: Global Ambitions Built on Local Protections” (United States Chamber of Commerce, 2017), https://www.uschamber.com/sites/default/files/final_made_in_china_2025_report_full.pdf; Abdulla, “China’s Robotics Patent Landscape.”
14 Original CSET Translation of “Certain Opinions of the Ministry of Education, the China National Intellectual Property Administration, and the Ministry of Science and Technology on Improving the Quality of Patents at Institutes of Higher Education and Promoting [Patent] Conversion and Use” [教育部 国家知
识产权局 科技部 关于提升高等学校专利质量 促进转化运用的若干意见], The Ministry of Education (教育部), the China National Intellectual Property Administration (国家知识产权局), and the Ministry of Science and Technology (MOST; 科技部), February 3, 2021.
15 Aaron Wininger, “Patents Required to List on the Shanghai Stock Exchange’s Science & Technology Board,” China IP Law Update, March 20, 2020, https://www.chinaiplawupdate.com/2020/03/patents-required-to-list-on-the-shanghai-stock-exchanges-science-technology-board/. See also Justin Harper, “China’s Star market aims to take on the Nasdaq,” BBC News, July 23, 2020, https://www.bbc.com/news/business-53509651.
16 Note that utility models are a different designation from utility patents available in the United States.
17 Ana Maria Santacreu and Heting Zhu, “What Does China’s Rise in Patents Mean? A Look at Quality vs. Quantity,” Economic Synopses, no. 14 (2018), https://research.stlouisfed.org/publications/economic-synopses/2018/05/04/what-does-chinas-rise-in-patents-mean-a-look-at-quality-vs-quantity/.
18 Abdulla, “China’s Robotics Patent Landscape.”
19 Our robotics patent data is derived from 1790 Analytics. We flatten 1790 Analytics' disaggregation of robotics patents’ “types” and “features” to get a more comprehensive view of the robotics patents’ characteristics. Robot “types” are adapted from the robotics categories proposed by Institute of Electrical and Electronics Engineers (IEEE). Robot “features” were developed by 1790 Analytics. Thomas, “The Robotics Patent Landscape,” 2.

Center for Security and Emerging Technology | 33
20 Patrick Thomas and Dewey Murdick, “Patents and Artificial Intelligence: A Primer” (Center for Security and Emerging Technology, September 2020), https://cset.georgetown.edu/publication/patents-and-artificial-intelligence/.
21 Examples drawn from data provided by 1790 Analytics.
22 Jeffrey Edmonds et al., “Artificial Intelligence and Autonomy in Russia” (Center for Naval Analyses, May 2021), https://www.cna.org/CNA_files/centers/CNA/sppp/rsp/russia-ai/Russia-Artificial-Intelligence-Autonomy-Putin-Military.pdf; Samuel Bendett et al., “Advanced military technology in Russia: Capabilities and implications” (Chatham House, September 2021), https://www.chathamhouse.org/sites/default/files/2021-09/2021-09-23-advanced-military-technology-in-russia-bendett-et-al.pdf.
23 UNESCO Institute for Statistics, “How much does your country invest in R&D?,” UNESCO, accessed on February 20, 2021, http://uis.unesco.org/apps/visualisations/research-and-development-spending/.
24 “The Global Innovation Index 2020: Who Will Finance Innovation?” (Cornell University, INSEAD, and WIPO, 2020), https://www.wipo.int/edocs/pubdocs/en/wipo_pub_gii_2020.pdf.
25 Stephanie Petrella, Chris Miller, and Benjamin Cooper, “Russia’s Artificial Intelligence Strategy: The Role of State-Owned Firms” (Foreign Policy Research Institute, November 2020), https://sites.tufts.edu/hitachi/files/2021/02/1-s2.0-S0030438720300648-main.pdf; Keith Dear, “Will Russia Rule the World Through AI? Assessing Putin’s Rhetoric Against Russia’s Reality,” The RUSI Journal 164, no. 5-6 (2019), https://www.tandfonline.com/doi/full/10.1080/03071847.2019.1694227.
26 Nayanee Gupta et al., “Innovation Policies of Russia” (Institute for Defense Analyses, September 2013), https://www.ida.org/-/media/feature/publications/i/in/innovation-policies-of-russia/ida-p-5079.ashx.
27 Margarita Konaev and James Dunham, “Russian AI Research 2010-2018” (Center for Security and Emerging Technology, October 2020, https://cset.georgetown.edu/publication/russian-ai-research-2010-2018/.
28 European Patent Office, “Russian Federation,” https://www.epo.org/searching-for-patents/helpful-resources/asian/russian-federation.html; Alexander G. Barabashev, Daria V. Ponomareva, and Jeffrey A. Burt, “Review of the Results of Scientific Activities: Protecting Intellectual Property in Russian and American Legal Practice,” Journal of Physics: Conference Series 1406 (2019), https://iopscience.iop.org/article/10.1088/1742-6596/1406/1/012009.

Center for Security and Emerging Technology | 34
29 “World Intellectual Property Indicators 2020,” 33.
30 “World Intellectual Property Indicators 2020,” 13.
31 “World Robotics 2020, Industrial Robots,” 342.
32 “World Robotics 2020, Industrial Robots,” 342. Note that IFR measures include both domestically produced robots and imported technologies.
33 Robert D. Atkinson, “Robotics and the Future of Production and Work” (Information Technology and Innovation Foundation, October 2019), https://itif.org/publications/2019/10/15/robotics-and-future-production-and-work.
34 A service robot is a robot that performs useful tasks for humans or equipment excluding industrial automation applications. “World Robotics Report 2020, Service Robots” (International Federation of Robotics, 2020), 15, 276.
35 Konaev and Dunham, “Russian AI Research 2010-2018.”
36 The shares here will not necessarily sum to 100 percent because patents can have multiple robotics categories assigned to them. Alternatively, patents may also not have any robotics category assigned to them and still be a robotics patent.
37 To be clear, military robotics patents are not synonymous with military robotics innovation or military robotics adoption. Countries and companies can make significant strides in military robotics without filing for patent protections and the absence of a country from the top 10 list does not necessarily suggest it lags behind in military robotics innovation or adoption.
38 Diego Lopes da Silva, Nan Tian, and Alexandra Marksteiner, “Trends in World Military Expenditure, 2020” (SIPRI, April 2021), https://sipri.org/sites/default/files/2021-04/fs_2104_milex_0.pdf
39 Office of the Secretary of Defense, Annual Report to Congress: Military and Security Developments Involving the People’s Republic of China (Washington, DC: Department of Defense), 2020, 141, 148, https://media.defense.gov/2020/Sep/01/2002488689/-1/-1/1/2020-DOD-CHINA-MILITARY-POWER-REPORT-FINAL.PDF.
40 Michael C. Horowitz, Joshua A. Schwartz, and Matthew Fuhrmann, “Who’s Prone to Drone? A Global Time-Series Analysis of Armed Uninhabited Aerial Vehicle Proliferation” (October 15, 2020), available at SSRN, https://ssrn.com/abstract=3422313.
Center for Security and Emerging Technology | 35
41 Elsa B. Kania, “‘AI Weapons’ in China’s Military Innovation” (The Brookings Institution, April 2020), https://www.brookings.edu/wp-content/uploads/2020/04/FP_20200427_ai_weapons_kania_v2.pdf.
42 Edmonds et al., “Artificial Intelligence and Autonomy in Russia”; Timothy Thomas, “Russian Robotics: A Look at Definitions, Principles, Uses, and Other Trends” (MITRE, February 2021), https://fas.org/irp/eprint/russian-robotics.pdf.
43 Thomas, “Russian Robotics,” 2.
44 While we would have liked to present an analysis of robotics patent assignees in Russia, namely, those organizations or individuals that have filed for and were granted patent protections, this proved difficult. Our robotics patents database does contain information about assignees, but the accuracy and comprehensiveness of this information varies significantly by country. For Russia, assignees were determined based on transliteration or machine translation from Russian language documents filed to Rospatent. As a result, assignee IDs were at times incomplete, for instance “ROSSIJSKAJA FEDERATSIJA OT IM” which loosely translates to “on behalf/in the name of the Russian Federation”; other entrees included variations of the same entity, for instance, the Degtyarev plant appeared as “ZD IM V A DEGTJAREVA AOOT” and “OTKRYTOE AKTSIONERNOE OBSHCHESTVO ZAVOD IM V A DEGTYAREVA.” Another challenge was the fact that while individual inventors were aggregated under “Individual Patenters” when looking at data on U.S. robotics patents, in the Russian list, they appeared by name. Although we do not present a systematic analysis of assignees, it is worth noting that the Ministry of Defense is listed as an assignee on a number of granted military robotics patents, and there are a number of federal state budgetary institutions of higher education, some of which may be military academies or professional military education institutions.
45 David Hambling, “Armed Russian robocops to defend missile bases,” New Scientist, April 23, 2014, https://www.newscientist.com/article/mg22229664-400-armed-russian-robocops-to-defend-missile-bases/#ixzz708cm2mwl.
46 Sten Allik et al., “The Rise of Russia’s Military Robots: Theory, Practice and Implications” (International Centre for Defence and Security, February 2021), https://icds.ee/wp-content/uploads/2021/02/ICDS-Analysis_The-Rise-of-Russias-Military-Robots_Sten-Allik-et-al_February-2021.pdf; “Combat robot Nerekhta confirms characteristics in military tests - Russian Foundation for Advanced Research Projects,” Interfax, May 16, 2019, https://interfax.com/newsroom/top-stories/20410/.
47 Thomas, “Russian Robotics,” 5.

Center for Security and Emerging Technology | 36
48 “With No Foreign Patents, 500 Russian Arms Copied Abroad,” Defense World, December 14, 2019, https://www.defenseworld.net/news/26006/With_No_Foreign_Patents__500_Russian_Arms_Copied_Abroad#.YHl-cJNKh0t.
49 National Security Commission on Artificial Intelligence, Final Report, 202.
50 “World Intellectual Property Indicators 2020,” 31.