trends in out sourcing in investment management industry prepared by rod homer & stewart copland...
TRANSCRIPT

Trends in Out Sourcing in
Investment Management Industry
Prepared by Rod Homer & Stewart Copland for
Securities & Investment Institute

2© Etheios Group Limited 2006
Your presenters today
• Rod Homer, Chief Executive
• Stewart Copland, Consulting Director
Seasoned practitioners

3© Etheios Group Limited 2006
Agenda
• Introductions• Overview of the Out Sourcing Market• Overview of Off Shore Scene• Major users of Out Source Services• The Indian Situation• South Africa, China et al• Predictions & Conclusions
4© Etheios Group Limited 2006
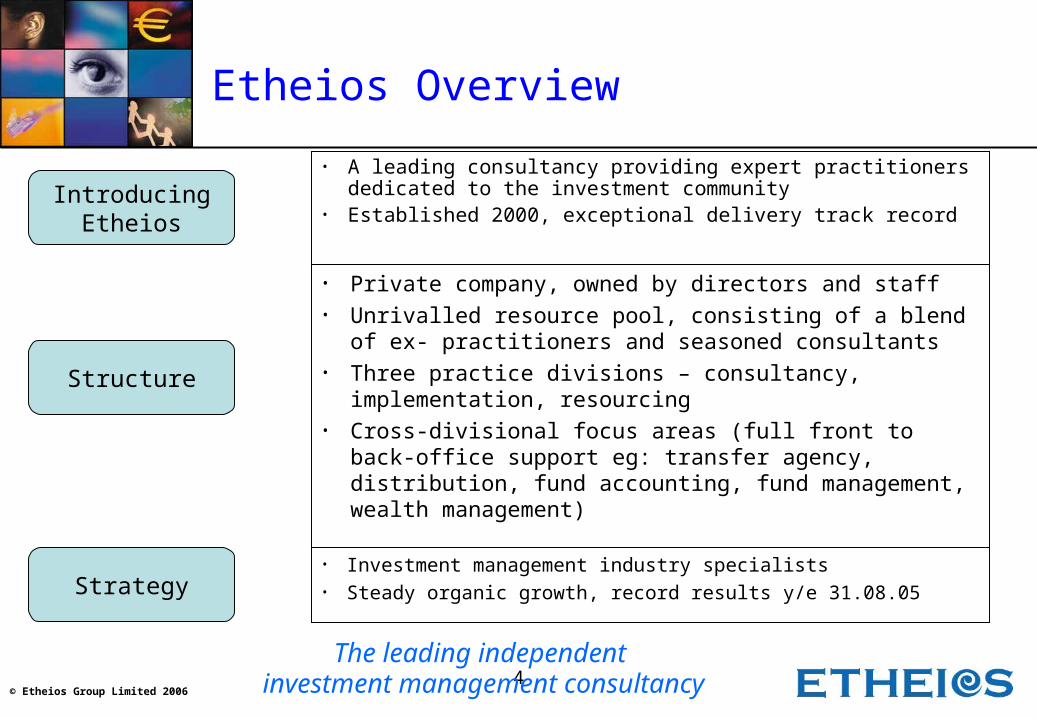
Etheios Overview
• A leading consultancy providing expert practitioners dedicated to the investment community
• Established 2000, exceptional delivery track recordIntroducing
Etheios
Structure
Strategy
• Private company, owned by directors and staff• Unrivalled resource pool, consisting of a blend of
ex- practitioners and seasoned consultants• Three practice divisions – consultancy,
implementation, resourcing • Cross-divisional focus areas (full front to back-office
support eg: transfer agency, distribution, fund accounting, fund management, wealth management)
• Investment management industry specialists• Steady organic growth, record results y/e 31.08.05
The leading independent investment management consultancy

5© Etheios Group Limited 2006
1st Generation Outsourcing New Breed Outsourcing
HR Outsourcing Payroll Benefits Administration Participant Recordkeeping
Funct
ion
al Sco
pe
Time
End-Client ReportingPaper StatementsWeb SolutionsPrivate Label
Accounting Separate Managed Accounts Vehicle Accounting Performance Measurement Composite Generation Post-Trade Compliance Risk Measurement
Investment Operations TPC Management Fail Management & Broker Claims Reconciliation Global Asset Servicing MIS Tax Reclaims
Trade Automation & Routing Message Transformation & Concentrator Trade Matching Trade Enrichment Data Management MIS
Fund Services Mutual Fund Accounting Mutual Fund Administration Master Trust/Master Custody Performance Measurement Transfer Agency
Asset Processing & Servicing Global Custody Clearance Cash Management Securities Lending Income Collection & Corporate Actions
Outsourcing evolution
Source: The Bank of New York
6© Etheios Group Limited 2006
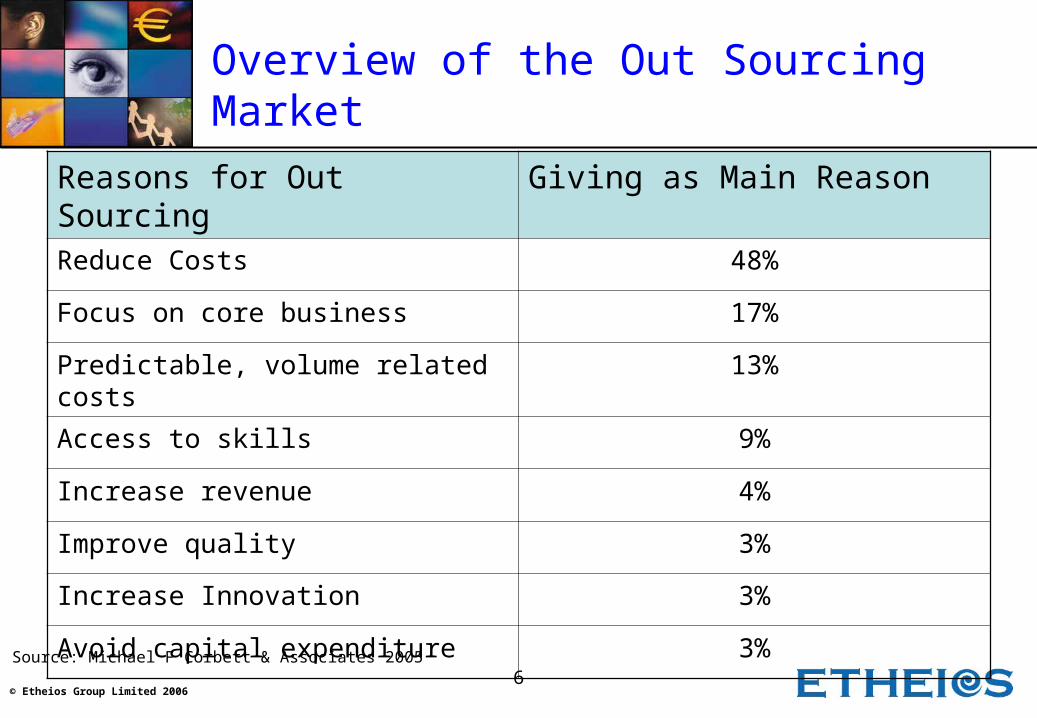
Overview of the Out Sourcing Market
Reasons for Out Sourcing Giving as Main Reason
Reduce Costs 48%
Focus on core business 17%
Predictable, volume related costs 13%
Access to skills 9%
Increase revenue 4%
Improve quality 3%
Increase Innovation 3%
Avoid capital expenditure 3%
Source: Michael F Corbett & Associates 2005

7© Etheios Group Limited 2006
Where did it all go wrong?
Schroders cancels outsourcing deal1 July 2005
Outsourcing savings are unrealistic - Cost savings actually average just 15 per cent, study finds13 April 2006
New study shows that the benefits of IT outsourcing are real1 May 2006
JPMorgan Chase cancels IBM outsourcing contract15 September 2004
F&C fails to agree terms with Mellon1 November 2005

8© Etheios Group Limited 2006
Reasons given for not Out Sourcing
The most common reasons for retaining services in house after considering out sourcing are:
• Loss of control – Dependency on supplier when introducing new products or services
may constrain speed to market– Less flexibility to allocate resources to new projects– Competing for prioritisation for new developments and project
resources• Security
– Unauthorised release of data– Business continuity plans
• Regulatory– Less stringent local regimes– Incompatibility with latest EU directives

9© Etheios Group Limited 2006
Benefits of Out Sourcing
IBM examined 56 out source contracts and reported that significant benefits were achieved:
• 11.8% higher earnings growth than the sector median• 9.9% reduction in expenses compared with sector median• 8.6% increase in RoA • swing of 16.1% from their pre-out source position of 7.5% lower
than median.

10© Etheios Group Limited 2006
Benefits of Out Sourcing
Size Front Office Middle/Back Office
IT
Small – AUM €11bn
6.0 bp 3.7 1.9
Medium – AUM €44bn
5.3 5.0 2.6
Large –AUM €102bn
3.9 2.4 1.4
Source: McKinsey 2003
Typical costs for in-house operations and support

11© Etheios Group Limited 2006
Benefits of Out Sourcing
Size Front Office Middle/Back Office
IT
Small – AUM €11bn
6.0 bp – 18%
3.7 – 35% 1.9 – 26%
Medium – AUM €44bn
5.3 – 8% 5.0 – 52% 2.6 – 46%
Large –AUM €102bn
3.9 – 8% 2.4 – 52% 1.4 – 46%
Source: McKinsey 003
Typical savings from out sourcing operations and support

12© Etheios Group Limited 2006
The UK Market - Trends
• Continuing pressure on fund managers’ margins and increasing public awareness of costs.
• Consolidation of product providers has not met predictions and may have some way to go.
• Increased penetration by volume providers.• Extended penetration of outsourcing to middle
office.• Niche suppliers making inroads. • Structured products threat.• New entrants to 3rd Party Administration.
13© Etheios Group Limited 2006
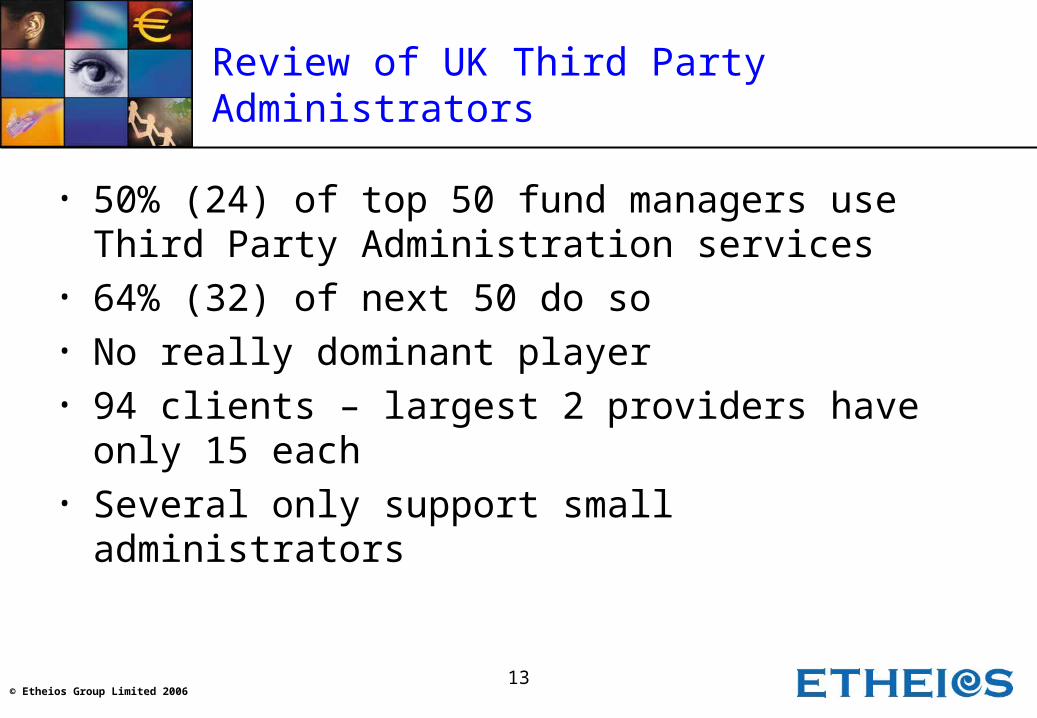
Review of UK Third Party Administrators
• 50% (24) of top 50 fund managers use Third Party Administration services
• 64% (32) of next 50 do so• No really dominant player• 94 clients – largest 2 providers have only 15
each• Several only support small administrators
14© Etheios Group Limited 2006
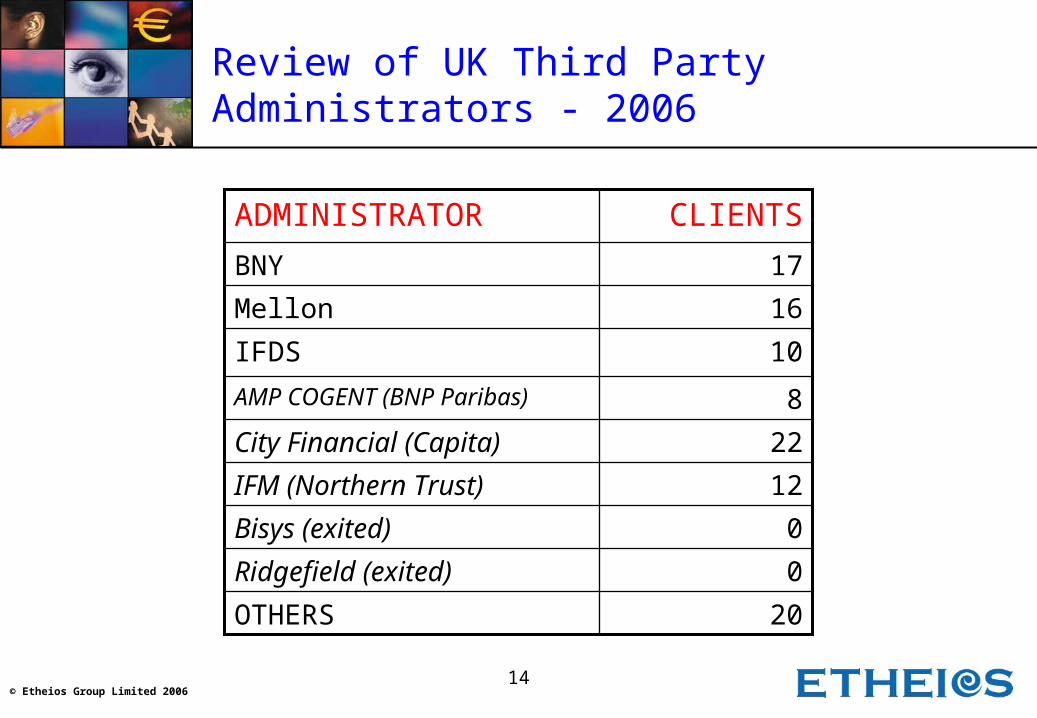
Review of UK Third Party Administrators - 2006
0Bisys (exited)
12IFM (Northern Trust)
22City Financial (Capita)
8AMP COGENT (BNP Paribas)
0Ridgefield (exited)
20OTHERS
10IFDS
16Mellon
17BNY
CLIENTSADMINISTRATOR

15© Etheios Group Limited 2006
• Continued consolidation• Established Continental operators have
expressed interest in bringing their services to the UK market
• Service providers are not immune from world economics
UK TPA trends

16© Etheios Group Limited 2006
Overview of European Market
• Growth in funds under management forecast to exceed 10% p.a. in all European markets and average 14%
• Banks still dominate distribution
• On-line distribution growing rapidly
• Considerable potential for further changes in distribution and 3rd party product providers

17© Etheios Group Limited 2006
Where to Out Source
High
LowHigh
Off-shore – a foreign location with low cost base and access to skills supported by technology providing equal or improved quality of service at lower cost.
Near-shore – nearby location with common/similar language, culture and business environment provides convenience of access to compensate for lower cost savings.
On-shore – same country as client with mix of in-house and external service provision. Low risk but minimal cost savings. Used to gain access to improved process, technology or to solve an internal problem.

18© Etheios Group Limited 2006
Off Shore Locations
Country IT BPO
Brazil $200m
Canada $8.2bn $5.5bn
China $700m $300m
Czech Republic
$60m $40m
Hungary $50m $25m
India £12.2bn $5,2bn
Ireland $2.2bn
Malaysia $120m $40m
Mexico $100m $200m
Philippines $330m $800m
Poland $110m $70m
Romania $30m $25m
Russia $550m $25m
South Africa $220m
Source: neoIT 2005

19© Etheios Group Limited 2006
Some Major user of Off Shore Services

20© Etheios Group Limited 2006
The Indian Situation
• Largest supplier world-wide of both ITO and BPO with exports worth over $17bn in 2005
• Impressive facilities• Substantial investment• Highly competent management• Keen and enthusiastic staff• High quality work• Productivity can be improved• Capacity for growth

21© Etheios Group Limited 2006
Comparison of Strengths
Source: neoIT of San Ramon California who produce an index of attractiveness of the major out source centres using the under mentioned factors.
Factor Weight Sub FactorsFinancial Benefit 30 Labour costs
Cost advantage – operating and capital expenditure
Service Maturity 25 Process maturity and competence of suppliers
Industry size and growth
Security and IP protection
People 25 Labour pool and skill level
Language proficiency
HR
Education system
Infrastructure 5 ICT and physical infrastructure
Catalyst 15 Government support and geo-political environment
Physical and time zone displacement
Cultural compatibility

22© Etheios Group Limited 2006
Off Shore Attractiveness Index - ITO
Location 0.1 0.2 0.3 0.4 0.5 0.6 0.7 0.8 0.9 1.0 1.1 1.2 1.3 1.4 1.5 1.6 1.7 1.8 1.9 2.0 2.1 2.2 2.3 2.4 2.5 2.6 2.7 2.8 2.9 3.0 3.1 3.2 3.3 3.4 3.5 3.6 3.7 3.8 3.9 4.0 4.1 4.2 4.3
IndiaCanadaChinaPolandIreland CzechRussiaMalaysia 0.2
MexicoHungaryPhilippinesRomaniaBrazil 0.1
South Africa
Financial Benefit Service Maturity People Infrastructure Catalyst
0.470.18
0.16
0.58
0.66
0.53
0.61
0.69
0.54
0.44
0.59
0.16
0.16
0.16
0.6
0.52
0.56
0.52
0.450.35
0.48
0.18
0.25
0.19
0.18
0.24
0.18
0.15
0.38
0.43
0.37
0.35
0.62
0.52
1.03
0.79
0.61
0.54
0.60
0.48
0.49
0.39
1.15
0.69
0.73
0.45
0.94
1.16
0.83
0.57
0.69
0.61
0.46
0.42
0.39
1.06
1.27
1.33
1.29
1.30
1.12
0.62
0.72
1.30
1.24
1.38
1.30
1.30
23© Etheios Group Limited 2006
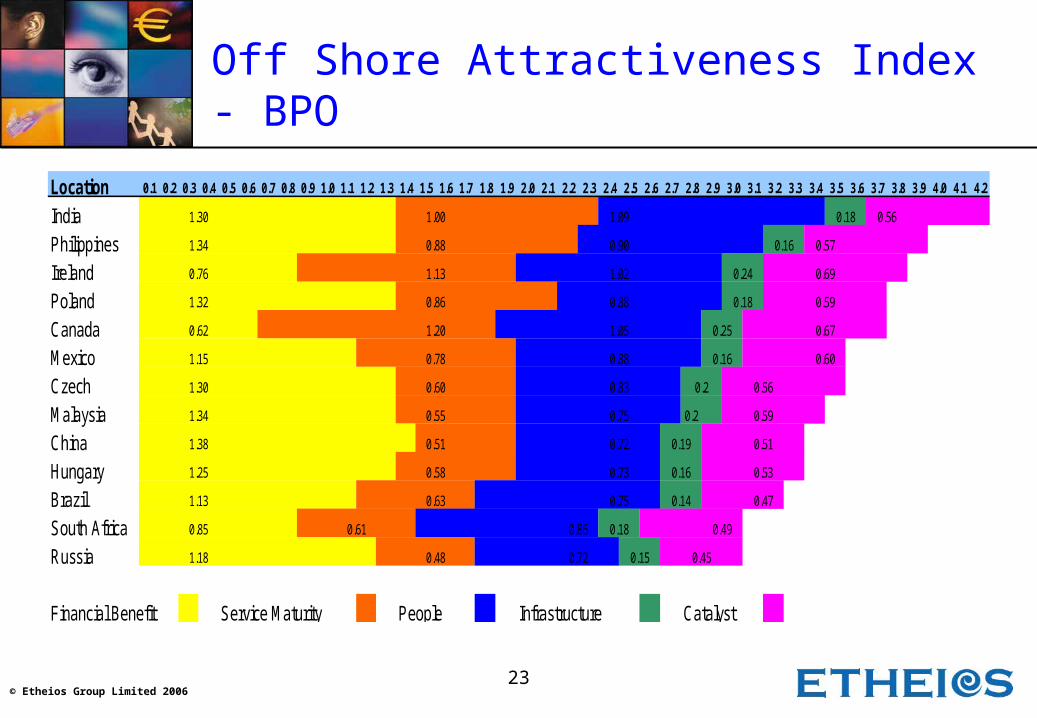
Off Shore Attractiveness Index - BPO
Location 0.1 0.2 0.3 0.4 0.5 0.6 0.7 0.8 0.9 1.0 1.1 1.2 1.3 1.4 1.5 1.6 1.7 1.8 1.9 2.0 2.1 2.2 2.3 2.4 2.5 2.6 2.7 2.8 2.9 3.0 3.1 3.2 3.3 3.4 3.5 3.6 3.7 3.8 3.9 4.0 4.1 4.2
IndiaPhilippinesIreland PolandCanadaMexicoCzechMalaysia 0.2
ChinaHungaryBrazilSouth AfricaRussia
Financial Benefit Service Maturity People Infrastructure Catalyst
0.88 0.60
0.90 0.57
1.34
0.18
1.32 0.86 0.88 0.18 0.59
1.02
1.25
1.34
1.30
1.15
0.62
0.76
1.30
1.18
1.38
0.85
1.20
1.13
0.60
0.78
0.58
0.88
1.13 0.63
1.00
0.51
0.48
0.55
0.83
0.72
0.75
0.73
0.75
1.09
1.05
0.72
0.61
0.14 0.47
0.86
0.25
0.19
0.24
0.2
0.15
0.51
0.59
0.16
0.16
0.53
0.490.18
0.16
0.56
0.67
0.69
0.56
0.45
24© Etheios Group Limited 2006
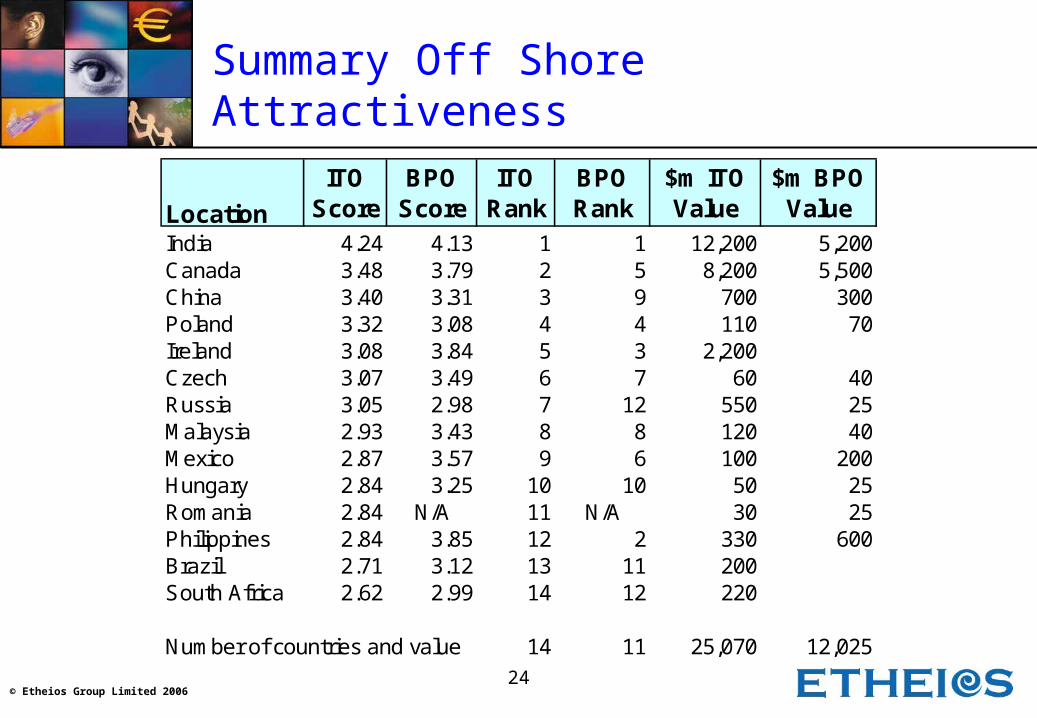
Summary Off Shore Attractiveness
Location
ITO Score
BPO Score
ITO Rank
BPO Rank
$m ITO Value
$m BPO Value
India 4.24 4.13 1 1 12,200 5,200Canada 3.48 3.79 2 5 8,200 5,500China 3.40 3.31 3 9 700 300Poland 3.32 3.08 4 4 110 70Ireland 3.08 3.84 5 3 2,200Czech 3.07 3.49 6 7 60 40Russia 3.05 2.98 7 12 550 25Malaysia 2.93 3.43 8 8 120 40Mexico 2.87 3.57 9 6 100 200Hungary 2.84 3.25 10 10 50 25Romania 2.84 N/A 11 N/A 30 25Philippines 2.84 3.85 12 2 330 600Brazil 2.71 3.12 13 11 200South Africa 2.62 2.99 14 12 220
Number of countries and value 14 11 25,070 12,025
25© Etheios Group Limited 2006
Predictions & Conclusions
1. Companies will continue develop strategies which focus on what they do best.
2. Customer contact will remain of crucial importance for financial institutions.
3. Core financial products will become less complex but exotic products will continue to be developed for niche markets.
4. The pace of technology advance will not slacken.
5. Focus on costs will continue.

26© Etheios Group Limited 2006
Questions & Discussion