trends in natural resource management - - … · suggested citation crowley, g.m. (2015). trends in...
TRANSCRIPT

Trends in natural resource management in Australia’s Monsoonal North: The beef industry
Gabriel Crowley
October 2015
The Cairns Institute, James Cook University and
Research Institute for Environment and Livelihoods, Charles Darwin University

Suggested Citation
Crowley, G.M. (2015). Trends in natural resource management in Australia’s Monsoonal North: The beef
industry. Cairns: The Cairns Institute, James Cook University.
ISBN 978-0-9944984-0-3
This report is licenced under a Creative Commons Attribution 3.0 Australia licence. You are free to copy,
communicate and adapt this work, so long as you attribute James Cook University [The Cairns Institute] and the
author.

Contents List of tables ......................................................................................................................................... i List of figures ....................................................................................................................................... ii Acronyms and abbreviations ............................................................................................................. iii About the author ............................................................................................................................. viii Acknowledgements and disclaimer ................................................................................................... ix
Disclaimer............................................................................................................................................... ix Executive summary ................................................................................................................................. 1 Introduction ............................................................................................................................................ 9 The region ............................................................................................................................................. 10
Climate .............................................................................................................................................. 10 Soil and vegetation ........................................................................................................................... 11 Biodiversity ....................................................................................................................................... 12 River systems .................................................................................................................................... 13 Land use and tenure ......................................................................................................................... 14 Population ......................................................................................................................................... 15
The northern beef industry ................................................................................................................... 17 The northern cattle herd................................................................................................................... 17 Markets ............................................................................................................................................. 21 Cattle enterprises .............................................................................................................................. 22 Indigenous pastoralism ..................................................................................................................... 24 Profitability........................................................................................................................................ 25 Herd performance and market access .............................................................................................. 33 Health and well-being ....................................................................................................................... 35
Supply and demand .............................................................................................................................. 37 Domestic and global demand ........................................................................................................... 37 Competing producers ....................................................................................................................... 39 International trade ............................................................................................................................ 40 Market requirements ........................................................................................................................ 43 Consumer preferences and concerns ............................................................................................... 45
Industry challenges ............................................................................................................................... 46 Supply chain ...................................................................................................................................... 47
Saleyards ....................................................................................................................................... 48 Meatworks .................................................................................................................................... 48 Freight ........................................................................................................................................... 50 Ports .............................................................................................................................................. 51
Resources .......................................................................................................................................... 53 Water ............................................................................................................................................ 53 Land ............................................................................................................................................... 56
Mining ............................................................................................................................................... 56 Environmental impacts ................................................................................................................. 59 Infrastructure impacts .................................................................................................................. 60 Social impacts ............................................................................................................................... 60
Pests and diseases ............................................................................................................................ 61 Weeds ........................................................................................................................................... 61 Pest animals .................................................................................................................................. 65 Disease and parasites.................................................................................................................... 66
Fire .................................................................................................................................................... 68 Climate .............................................................................................................................................. 70
Variability and seasonal conditions .............................................................................................. 70

Climate change.............................................................................................................................. 70 Policy environment ............................................................................................................................... 76
Australian Government white papers and parliamentary inquiries ................................................. 79 Northern Australia Beef Industry Working Group ............................................................................ 83 Indigenous Land Corporation ........................................................................................................... 84 State and territory governments ...................................................................................................... 84
Western Australian Government .................................................................................................. 85 Northern Territory Government ................................................................................................... 86 Queensland Government .............................................................................................................. 87
High-level industry bodies ................................................................................................................ 88 State farming organisations .............................................................................................................. 91 Financial institutions ......................................................................................................................... 92 Research organisations ..................................................................................................................... 92 Extension providers .......................................................................................................................... 95 Climate change.................................................................................................................................. 95
Legal and regulatory environment ....................................................................................................... 98 Tenure and Native Title..................................................................................................................... 99 Environmental management .......................................................................................................... 101 Pastoral lease conditions ................................................................................................................ 102 Water .............................................................................................................................................. 104 Land clearing ................................................................................................................................... 106 Carbon ............................................................................................................................................. 109 Reef regulations .............................................................................................................................. 110 Pest, weed and disease management ............................................................................................ 111 National Livestock Identification System ........................................................................................ 111 Animal health and welfare .............................................................................................................. 111 Workforce management ................................................................................................................. 114 Mining ............................................................................................................................................. 115
Environmental approvals ............................................................................................................ 118 Water resources .......................................................................................................................... 119
Practice improvement......................................................................................................................... 120 Identification and uptake of practice improvement ....................................................................... 120 Land condition and economic returns ............................................................................................ 121 Resting pastures .............................................................................................................................. 122 Fire management ............................................................................................................................ 122 Paddocks and water points ............................................................................................................. 123 Herd size .......................................................................................................................................... 125 Herd management .......................................................................................................................... 125 Vaccination...................................................................................................................................... 126 Supplementation ............................................................................................................................ 126 Introduced pasture species ............................................................................................................. 127 Reef water quality ........................................................................................................................... 129 Greenhouse gas budgets ................................................................................................................ 134 Animal welfare and community expectations ................................................................................ 136 Climate change adaptation ............................................................................................................. 138
Diversification ..................................................................................................................................... 140 Forage crops .................................................................................................................................... 140 Other cropping ................................................................................................................................ 142 Environmental service delivery ....................................................................................................... 143
Natural resource management implications ...................................................................................... 144 Herd building ................................................................................................................................... 144

Performance improvement ............................................................................................................ 145 Mosaic agriculture and irrigated cropping...................................................................................... 145 Environmental services ................................................................................................................... 146 Enterprise viability and uptake of sustainable practices ................................................................ 147
References .......................................................................................................................................... 148
i | P a g e
List of tables
Table 1. Land tenure across the Monsoonal North .............................................................................. 15 Table 2. Population statistics for the Monsoonal North ....................................................................... 16 Table 3. Population estimates for Indigenous people living in northern Australia .............................. 17 Table 4. Numbers of cattle in the Monsoonal North ............................................................................ 17 Table 5. Beef cattle enterprises found in the Monsoonal North .......................................................... 23 Table 6. Adjustments made to northern cattle businesses in response to the live export suspension or
intended with continuation of suspension beyond July 2011 ................................................. 29 Table 7. Top rating issues affecting profitability of Northern Territory grazing enterprises in 2011-12
................................................................................................................................................. 32 Table 8. Top rating issues affecting environmental sustainability of Northern Territory grazing
enterprises in 2011-12 ............................................................................................................. 32 Table 9. Achievable herd performance targets for the Mitchell Grass and the remainders of the
Monsoonal North ..................................................................................................................... 34 Table 10. Flow-on-impacts of drought on pastoral families ................................................................. 36 Table 11. Timeline of recent significant events affecting northern beef exports ................................ 41 Table 12. Requirements for beef to access quality markets................................................................. 43 Table 13. Coal mines, exploration permits and nominated areas in the Burdekin Dry Tropic ............. 58 Table 14. Economically viable mineral deposits in the Monsoonal North ........................................... 59 Table 15. Woody weeds with a significant impact on grazing operations ........................................... 62 Table 16. Impact of Rubber Vine, Prickly Acacia and Mesquite on pastoral enterprises ..................... 63 Table 17. Estimated cost of three weeds on the Queensland beef industry with and without the SWEEP
control program ....................................................................................................................... 64 Table 18. Cost of endemic diseases to the northern Australian beef industry .................................... 67 Table 19. Climate change projections across the Monsoonal North to 2030 ...................................... 72 Table 20. Cascading climate change impacts on beef production in northern Australia ..................... 74 Table 21. Organisations influencing the northern Australian beef industry shown in Figure 35 ......... 78 Table 22. Government projections for the northern Australian beef industry .................................... 85 Table 23. Beef production targets in Queensland’s Draft Beef Industry Action Plan 2014-2016 ........ 87 Table 24. Actions to support development of the beef industry in Queensland’s Draft Beef Industry
Action Plan 2014-2016 ............................................................................................................. 88 Table 25. Research, development and extension priorities and goals to enhance development of the
northern Australian beef industry ........................................................................................... 94 Table 26. Rights and responsibilities associated with grazing land tenures in Queensland ............... 100 Table 27 Rights to take for various uses across the Monsoonal North without a permit .................. 105 Table 28. Conditions for vegetation management for pastoral purposes in Western Australia ........ 107 Table 29. Conditions for vegetation management for pastoral purposes in the Northern Territory 107 Table 30. Conditions for vegetation clearance for pastoral purposes in Queensland ....................... 109 Table 31. Major legislation covering mining activity in northern Australia ........................................ 117 Table 32. Use of fire on grazing land of the Monsoonal North .......................................................... 123 Table 33. Characteristics of the Burdekin River sub-catchments ....................................................... 131 Table 34. Strategies to improve greenhouse gas footprint of pastoral properties ............................ 136 Table 35. Enterprise-level options to facilitate climate change adaptation ....................................... 138 Table 36. Industry and policy-level options to facilitate climate change adaptation ......................... 139 Table 37. Details of the most profitable mosaic irrigation scenarios modelled for northern Australian
beef cattle enterprises ........................................................................................................... 141
ii | P a g e
List of figures
Figure 1. The Monsoonal North showing natural resource management regions and subregions ....... 9 Figure 2. Annual average rainfall in the Monsoonal North .................................................................. 11 Figure 3. Vegetation of the Monsoonal North ...................................................................................... 12 Figure 4. Drainage basins of the Monsoonal North .............................................................................. 13 Figure 5. Land tenure across the Monsoonal North ............................................................................. 14 Figure 6. Population of the Monsoonal North ...................................................................................... 16 Figure 7. Growth of the northern cattle herd in relation to consumption, demand and rainfall ........ 18 Figure 8. Australian beef and veal exports ........................................................................................... 22 Figure 9. Location of feedlots in relation to the Monsoonal North ...................................................... 23 Figure 10. Long term profitability of average and top 25% northern beef businesses ........................ 27 Figure 11. Ratio between off-farm and on-farm income in relation to herd size ................................ 28 Figure 12. Regional patterns of reliance of the beef industry on the live export trade ....................... 29 Figure 13. Land prices and debt burden of grazing properties in Monsoonal North ........................... 30 Figure 14. Average equity ratio and business debt of beef enterprises in the Monsoonal North ....... 31 Figure 15. Example of a box plot explaining the concepts of median and achievable performance ... 34 Figure 16. Market suitability of northern Australian cattle grown on different feed regimes ............. 35 Figure 17. Australian meat consumption: (a) total and (b) per capita ................................................. 37 Figure 18. Global and Asian beef production and consumption .......................................................... 38 Figure 19. Projected increase in Asian beef imports ............................................................................ 38 Figure 20. Beef exports by the current five highest ranking exporter nations ..................................... 39 Figure 21. Comparative global beef prices 2005-2015 ($US/kg liveweight) ......................................... 42 Figure 22. Minimum weight for age to meet most prime beef markets .............................................. 44 Figure 23. Australian beef supply chain ................................................................................................ 47 Figure 24. Location of saleyards in relation to the Monsoonal North .................................................. 48 Figure 25. Location of meatworks in relation to the Monsoonal North ............................................... 49 Figure 26. Number of cattle exported from Australian ports from 2002 to 2014 ................................ 52 Figure 27. Relative importance of cattle export ports and destinations from 2002 to 2012 ............... 53 Figure 28. Water requirements of beef cattle at Wyndham in relation to climatic conditions ........... 54 Figure 29. Progressive drying of a section of the Cloncurry River ........................................................ 55 Figure 30. Coal basins and major coal seam gas deposits .................................................................... 57 Figure 31. Coal mines, exploration permits, nominated areas and proposed infrastructure in the
Burdekin Dry Tropic ................................................................................................................. 57 Figure 32. Current and potential distributions of Prickly Acacia based on CLIMEX modelling (a) and
projected potential distributions based on various climate change scenarios (b-g) ............... 65 Figure 33. Frequency of fires in the Monsoonal North between 1997 and 2010 ................................ 69 Figure 34. Frequency of late dry season fires in the Monsoonal North between 1997 and 2010 ....... 69 Figure 35. Organisations that influence the northern Australian beef industry .................................. 77 Figure 36. Hierarchy of peak bodies representing the interests of the northern beef industry .......... 89 Figure 37. Potential recognition of Native Title on pastoral leases in relation to assumed level of
Aboriginal connection to the land ......................................................................................... 101 Figure 38. Percentage of grazing lands within 3 km of water ............................................................ 124 Figure 39. Soil phosphorus status across northern Australia ............................................................. 127 Figure 40. Sub-catchments of the Burdekin catchment (left) and their contribution to suspended
sediments (right) .................................................................................................................... 130 Figure 41. Percentage of Burdekin Dry Tropics with less than 50% ground cover, 1987-2010 .......... 132 Figure 42. Ground cover in the Burdekin Dry Tropics in relation to annual rainfall, 1987-2010 ....... 132 Figure 43. Greenhouse gas emissions from agriculture ..................................................................... 135

iii | P a g e
Acronyms and abbreviations
ACCU Australian Carbon Credit Units
AE Animal Equivalents
ALEC Australian Livestock Exporters’ Council
ALFA Australian Lot Feeders’ Association
AMIC Australian Meat Industry Council
AMPC Australian Meat Processor Corporation
APVMA Australian Pesticides & Veterinary Medicines Authority
ARC Australian Research Council
ARCBA Australian Registers Cattle Breeders Association
ARS Australian Rangelands Society
AVA Australian Veterinary Association
BJD Bovine Johne’s Disease
BMP Best Management Practices
BoM Australian Bureau of Meteorology
BSE Bovine Spongiform Encephalopathy
CCA Cattle Council of Australia
CFI Carbon Farming Initiative
CDU Charles Darwin University
CH4 Methane
CLC Central Land Council
CLCAC Carpentaria Land Council Aboriginal Corporation
CO2 Carbon Dioxide
COTS Crown of Thorns Starfish
CQU Central Qld University
CSG Coal Seam Gas
iv | P a g e
Cth Commonwealth of Australia
CYLA Cape York Land Council
DAF WA Department of Agriculture & Food, WA
DCM NT Department of Chief Minister, NT
DEC WA Department of Environment and Conservation, NT
DIRD Department of Infrastructure & Regional Development
DLRM NT Department of Land Resource Management, NT
DME NT Department of Mines and Energy, NT
DoA Department of Agriculture (Cth)
DoE Department of the Environment (Cth)
DoT NT Department of Transport, Northern Territory
DPIF NT Department of Primary Industry & Fisheries, Northern Territory
DPIs Primary Industries Departments
DSD WA Department of State Development, Western Australia
EIA Environmental Impact Assessment
EPA WA Environmental Protection Authority, Western Australia
ERF Emission Reduction Fund
ERMP Environmental Risk Management Plan
ESCAS Exporter Supply Chain Assurance System
FIFO Fly-In, Fly-Out (staff that are flown in and out of work sites on a regular basis)
FMD Foot and Mouth Disease
FMDs Farm Management Deposits
Fraccing Hydraulic fracturing to release coal seam gas from parent rock
GBR Great Barrier Reef
GHG Greenhouse Gas
IARC International Agency for Research on Cancer (World Health Organisation)
ILC Indigenous Land Corporation
v | P a g e
IPP Indigenous Pastoral Program
JCU James Cook University
KLC Kimberley Land Council
Lands WA Department of Lands, Western Australia
LiveCorp Australian Livestock Export Corporation
LPA Livestock Production Assurance
MLA Meat & Livestock Australia
MSA Meat Standards Australia
N2O Nitrous Oxide
NABIWG Northern Australia Beef Industry Working Group
NABRC North Australia Beef Research Council
NADO (NT) Northern Australia Development Office, Northern Territory
NAFI North Australia Fire Information website
NAIEF Northern Australian Indigenous Experts Forum on Sustainable Economic Development
NAMF Northern Australia Ministerial Forum
NBIR Northern Beef Industry Roundtable
NBIWC Northern Beef Industry Working Group
NDRRA National Disaster Relief & Recovery Arrangements
NFF National Farmers Federation
NLC Northern Land Council
NLIS National Livestock Identification System
NQLC North Qld Land Council
NRM Natural Resource Management
NRM WA State NRM Office, Western Australia
NT Northern Territory
NT EPA Northern Territory Environment Protection Authority
NTCA Northern Territory Cattlemen’s Association

vi | P a g e
OH&S Occupational Health and Safety
ORS WA Office of Road Safety, Western Australia
PAW WA Parks and Wildlife, Western Australia
PCAS Pasturefed Cattle Assurance System
PGA WA Pastoralists & Graziers Association of Western Australia
ppm Part per million
QAAFI Queensland Alliance for Agriculture & Food Innovation
QDAF Queensland Department of Agriculture and Fisheries
QDEWS Queensland Department of Energy & Water Supply
QDoT Queensland Department of Transport
QDSD Queensland Department of State Development
QDSI Queensland Department of Science & Innovation
QEHP Queensland Department of Environment and Heritage Protection
QFF Queensland Farmers’ Federation
Qld Queensland
QMRRSP Queensland Department of Main Roads, Road Safety & Ports
QNRM Queensland Department of Natural Resources & Mines
QRAA Queensland Rural Adjustment Authority
RD&E Research, Development and Extension
RET Renewable Energy Target
RIRDC Rural Industries Research & Development Corporation
RMAC Red Meat Advisory Council
RSPCA Royal Society for the Prevention of Cruelty to Animals
SDA State Development Area
SFOs State Farming Organisations
SWEEP Strategic Weed Eradication and Education Program (Queensland)
TGS Tropical Grasslands Society of Australia

vii | P a g e
TNRM Territory NRM
TS-CRC Tropical Savannas Cooperative Research Centre
Turn-off Livestock sent to market
UQ University of Queensland
UWIR Underground Water Impact Report
WA Western Australia
WA BC Western Australian Beef Council
WAFarmers Western Australian Farmers Federation
viii | P a g e
About the author
Gabriel Crowley has over 20 years’ experience assisting natural resource managers meet their
planning, management and conservation goals.
Her interest in natural resource management began on Cape York Peninsula in 1992, when she worked
with pastoralists to reverse the decline of open grassy woodlands that have high conservation and
pastoral values to development of fire and grazing management guidelines. She undertook similar
collaborative work with landholders on Kangaroo Island for Glossy Black-Cockatoo conservation.
Returning to northern Australia in 1998, she worked in Queensland Parks and Wildlife and the Tropical
Savannas Cooperative Research Centre to support sustainable land management through production
of fire and wildlife management guides and web-based tools.
She subsequently led the development of:
Northern Territory's 2010-2015 Integrated Natural Resource Management Plan
Queensland Government’s $10M Reef Policy Science Program to inform best practice cane
farming and cattle grazing and prioritise investment in research gaps (2010-2011)
Meat and Livestock Australia’s 10-year Research, Development and Engagement Plan to
improve fire management on northern grazing lands (2013)
The research plan to inform Natural Resource Management across northern Australia (2014).
This report and its companion volume Trends in natural resource management in Australia’s
Monsoonal North: The conservation economy are a continued expression of her commitment to
support the information needs landholders and Natural Resource Management groups.
Gabriel is an Adjunct Principal Research Fellow with The Cairns Institute at James Cook University,
Cairns, Australia.

ix | P a g e
Acknowledgements and disclaimer
This project was fund in part by the Australian Government’s Regional Natural Resource Management
Planning for Climate Change Fund. My thanks go to Brendan Edgar and Andrew Campbell (Charles
Darwin University) for inviting me to undertake this project. I also thank Allan Dale (James Cook
University), who provided guidance, support and comments on the text, and Katrina Keith (James Cook
University) undertook the onerous task of proof reading and getting the manuscript ready for
production. Roanne Ramsey (Charles Darwin University) and Jennifer McHugh (James Cook University)
provided administrative support. Sarah Rizvi (NGRMG), Sarah Connor (Sarah Connor Consulting),
Alastair Buchan (NQ Dry Tropics), Paul Donohoe (Territory NRM), John Silver, Grey Mackay and Kira
Andrews (Rangelands NRM, Western Australia) set the report’s direction and identified issues to be
addressed. I thank Sarah Rizvi, who was especially supportive and provided constant feedback. I also
thank Marie Vitelli (AgForce) for feedback on the beef industry support network, Jo Bloomfield for
providing information on meatworks, and Rosemary Stanton for nutritional advice. I am eternally
grateful to David Gillieson for his support, GIS advice and proof-reading throughout the interminable
production of this task.
Disclaimer
While every effort is made to ensure the accuracy of this publication the author and the publisher
accept no liability for any loss or damage that result from reliance on it. All information regarding
legislation, regulations and government policy should be regarded as the authors’ opinions and not
legal advice. All electronic sources were successfully accessed in January 2016, but their ongoing
availability cannot be guaranteed.

1 | P a g e
Executive summary
This report describes trends in the beef industry in the Monsoonal North. It aims to provide the
region’s natural resource management (NRM) groups with an understanding of how best to support
the industry, undertake the changes required to improve its environmental sustainability and
economic viability, and to provide it with resilience in the face of increasing development pressures
and climate change. This report charts the industry’s history and development; describes its current
condition and the pressures and drivers it is experiencing; and explores how these are likely to change
in the near future.
The region: The Monsoonal North covers 20% of Australia’s land surface across the tropical savannas.
It shares a monsoonal climate, extensive intact ecological systems, generally poor soils and limited
development. Its river systems carry nearly half of the runoff. The region has a large Indigenous
population; most land is either under Indigenous ownership or subject to Native Title; and the highest
proportion of Indigenous people live in the region’s north and north-west.
The region also faces a number of shared issues, particularly the challenges of intensifying climatic
extremes and pressure to exploit Asia’s growing demand for agricultural produce, which is placing
pressure on land and water resources.
The industry: Cattle production is northern Australia’s most important agricultural industry. Two-
thirds of the Monsoonal North is currently used for extensive cattle grazing. Through most of the
region, cattle are grazed at low stocking rates on native pastures, with introduced pasture species
being restricted in extent. Most enterprises breed animals for the low-value live export trade or for
fattening and finishing on better pastures or in feedlots.
Cattle numbers in Queensland, Northern Territory and Western Australia have doubled since 1965,
and fluctuated with changes in demand and climatic conditions. In 2009, the Monsoonal North held
around 5.7 million head of cattle. High export demand from Asia and drought destocking has seen the
region’s cattle numbers fall and prices rise through 2014-15. In the longer-term, continued growth in
global demand, a reduced Australian dollar and high global prices, and improved incomes are forecast
for Australian beef producers. Since 2009, each of the three northern governments have released
policy documents that included targets to increase the herd size by between 1 and 5%, with the
greatest planned increases on Aboriginal land in the Kimberley. Between 2009 and 2014, the Northern
Territory herd grew by more than the projected 5% increase. Herd size in Queensland has recently
diminished because of drought, and the current government’s stance on herd-building is unclear.

2 | P a g e
Nevertheless, long-term growth is expected to increase the northern Australian herd by a further 80%
by 2050.
Recent growth in the northern cattle herd has been achieved through intensification (spreading
grazing pressure using water points and fencing) and development of underutilised properties,
notably on Indigenous lands. Indigenous pastoralism is growing rapidly, with developments in all parts
of the sector from cattle breeding to slaughter.
Markets: Most beef grown in northern Australia is sent to Asia, with Indonesia being the largest buyer
of live cattle. Despite a long-established framework for assuring animal health and welfare within
Australia, widely-publicised animal mistreatment in Indonesia resulted in the temporary closure of the
live-export market in 2011 until animal welfare could be assured throughout the supply chain. This
closure demonstrated how dependence on a single market exposed the northern beef industry to
market volatility. Bilateral and multilateral trade negotiations by the federal government are now
progressively broadening market access, with agreements favouring Australian beef now in place or
close to finalisation with most significant beef markets.
Enterprises: Cattle enterprises in the Monsoonal North have been struggling because, in real terms,
cattle prices have declined, while input costs have remained stable. In addition, escalating land prices
through the 1990s and 2000s encouraged many land owners to increase their mortgages to levels that
became unsustainable once land prices fell. This has implications for environmental management. In
comparison to pastoralists in a good financial position, those in debt have less resilience to cope with
drought; are less likely to adopt practice improvements needed for improving enterprise viability and
environmental conditions; and are more likely to suffer adverse health effects.
Many enterprises, especially those with small herds, derive more income from off-farm work than
they earn from cattle operations. While large cattle enterprises allow economies of scale, increasing
cattle herd size seems less important to profitability than does improving herd performance.
Performance: Except on Mitchell Grass pastures and small areas of intensively managed pastures,
cattle performance in the Monsoonal North is substandard when compared to the rest of the country,
and is affected by poor quality pasture quality. Breeding performance is typically poor; with low
pregnancy rates; high foetal and calf death rates; and many cows are lost. However, the achievements
of the top 25% of the industry indicate there is great potential to improve performance on the
remaining properties.

3 | P a g e
Health and well-being: Pastoral production is a stressful occupation, involving financial insecurity and
isolation; and pastoralists have high rates of injury, disease, accident and suicide. Recent years have
brought additional challenges associated with falling land prices, market instability and drought. In the
Burdekin Dry Tropics, proposed coal mining is increasing stress levels for many pastoralists.
Supply and demand: Domestic demand for beef in Australia stagnated because per capita beef
consumption has fallen, but global demand is escalating with population growth and economic
development. Demand for beef is expected to keep increasing until at least 2050, with greatest growth
occurring in China.
Australia was the world’s top beef exporter until 2003. Only Brazil and India currently export more
beef than Australia does. Australia’s disease-free status gives it access to markets that are closed to
these exporters. Australia’s dominance of the live-export trade to Indonesia also helps provide a
disease free buffer to its north. Australian beef producers are disadvantaged by protectionist
measures employed by both beef importing countries and exporting countries. The Australian
Government has been engaging in international trade agreements that will overcome some of these
barriers and increase market access.
Market requirements and consumer preference: A high percentage of Brahman genes in the herd
makes northern cattle attractive for slaughter and feedlots in tropical countries. However, slow
growth rates and long transport distances mean most beef is sold in the low end of the market. Ethical,
health and environmental concerns have contributed to the decline in domestic meat consumption,
and are influencing consumer preferences in global markets. These concerns are driving practice
improvement throughout the Australian beef supply chain.
Challenges: Industry viability is constrained by lack of infrastructure, including feedlots, intensive
fattening pastures, saleyards and meatworks, inactive ports and poor quality roads, all of which
combine to make freight expensive, pushing up input costs. Considerable advances have been made
in alleviating these constraints by building meatworks in Darwin, Arnhem Land and the Kimberley.
However, lack of competition through the supply chain may be depressing returns at the farm gate.
The ports of Darwin and Townsville are operating at record capacity, but some northern ports with
export facilities (Port Hedland, Weipa, Mourilyan and Mackay) have not operated for several years.
Water for cattle operations and irrigated crops may be at risk if extraction for these and other activities
is not sustainably allocated. While broadscale irrigated cropping is likely to be restricted to a small
proportion of the region, its requirements for water resources and fertile soil may deprive the pastoral

4 | P a g e
industry of some of its most productive pasture land. Extraction for mining and irrigated agriculture is
of particular concern. This has become a contentious issue with several coal projects in Queensland’s
Galilee Basin. Mining also has the potential to disrupt pastoral operations by removing land from
production for both mineral extraction and infrastructure. Again, this is a significant issue in
Queensland, where several landholders will be affected by the rail corridor servicing mines in the
Galilee Basin. The disruption caused by mining poses a risk, not only to the financial viability of pastoral
enterprises, but also to the health and welfare of pastoralists and their families. If well managed,
however, mining and agricultural development can also have co-benefits, improving regional
economies and providing employment and infrastructure.
Weeds, fire, pest animals, disease and cattle theft all impose financial burdens on northern pastoral
operations. Production losses caused by weeds have been estimated at costing the industry around
$1,000 million/year; pest animals: ca $36 million/year; disease and parasites: ca $390 million; and
cattle theft between $1.5 and $2 million a year in Queensland alone. No industry-wide estimates are
available for impacts of fire, cyclones or other natural disasters. Conversely, pastoral managers
perform important roles in control of weeds, fire, pest animals and diseases that would not be
undertaken if no one was living on the lands they manage.
Climatic and seasonal conditions are also serious constraints, particularly in inland Queensland, where
periods of drought of two or more years are not uncommon. Conversely, extended periods of above
average rainfall may encourage pastoralists to stock land beyond its long-term carrying capacity, and
develop unrealistic impressions of what average conditions are. This could be an issue in the Kimberley
if the elevated rainfall of the last few decades is not sustained.
Climate change is already being felt in the region. Temperature have risen by up to 1.0˚C since 1910,
with further increases of up to 5˚C expected by the end of the century. Droughts, cyclones, wildfires
and flooding rains are likely to intensify over the next few decades, and continue to intensify until at
least the end of the century. Carbon dioxide enrichment may increase forage production, but reduce
its quality and stimulate woody thickening, as woody plants are favoured over tropical grasses. In most
climate change scenarios, whether rainfall remains roughly the same or decreases, pasture growth
and safe stocking rates in the Monsoonal North are expected to decrease, with the worst scenarios
predicting decreases in pasture growth and safe stocking rates of between 50% and 60%. Climate
change will also have adverse impacts on each stage of the supply chain, with effects ranging from
increasingly uncomfortable work conditions to increased frequency of flood and cyclone damage to
infrastructure.

5 | P a g e
Policy environment: Many organisations have an influence on the direction of the pastoral industry.
Individually, or as part of cross jurisdictional alliances, national, state and territory governments
promote industry sustainability and herd-building. The preferred approach is to improve trade
relations; simplify regulation; invest in roads; and provide a conducive business environment to attract
infrastructure investment. The Developing Northern Australian White Paper and the Agricultural
Competitiveness White Paper further these objectives.
Under Australian national legislation, the Red Meat Advisory Council was established to represent the
interests of beef and other meat producers, and is reported to by various state farming organisations
that work closely with the industry as advocates and information and extension providers. Research
and marketing is largely driven by Meat and Livestock Australia (informed on northern issues by the
North Australia Beef Research Council) and extension is delivered by state agencies, state farming
organisations and NRM groups. The emphasis of both research and extension is on practice
improvement, rather than herd building. The Australian Government funded Indigenous Land
Corporation is also playing a pivotal role in the northern grazing industry by assisting Indigenous
people acquire, develop and manage pastoral properties. Finally, the policies and assessments made
by financial institutions can both determine the level of debt that a pastoral enterprise can acquire
and the cost of repayment, and influence whether developments seeking external funding are seen
as viable.
The Australian Government is committed to climate change action by virtue of signing international
agreements. Its commitments to reduce emissions will help moderate the long-term impacts of
climate change. Both the Western Australian and Northern Territory Governments have also made
climate change commitments and the Queensland Government is currently revitalising its climate
change agenda.
Regulatory environment: Legislation and regulation govern much activity on pastoral properties, most
of which are pastoral leases coexisting with Native Title. This type of land tenure allows pastoralists to
undertake most activities that can be justified as core business to a pastoral operation, including
pastoral-related activities that reduce carbon footprints. Diversification into other activities requires
the consent of Native Title holders, which is usually negotiated through Indigenous Land Use and
Access Agreements.
Pastoralists have the right to water stock and clear vegetation for pastoral uses, but conditions vary
between jurisdictions and water use for agricultural development requires a permit. There is a lack of
6 | P a g e
clarity about whether permits can be granted for non-pastoral uses (including diversification into
broadacre cropping) in Western Australia and Queensland.
Pastoral leases also come with a range of legislated responsibilities. Leaseholders in each jurisdiction
are to manage weeds, pest animals and diseases and to report notifiable cattle diseases to the relevant
authority. They must use National Livestock Identification Scheme tags to ensure their cattle can be
traced through the supply chain, and adhere to animal health and welfare standards. In addition, as
employers, pastoral operators must follow conditions laid down by Fairwork Australia. Graziers in the
Burdekin catchment are required to manage their properties to minimise reef pollution.
The rights of miners to access land and water override those of pastoral leaseholders. While legislation
facilitating exploitation of mineral and gas and fuel resources purports to safeguard other interests
(notably environmental matters and water access), few mining proposals have been rejected because
of environmental or pastoral concerns.
Practice improvement: Much effort has been invested in identifying the best practices to improve the
profitability and environmental sustainability of the northern beef industry. Key areas of knowledge
advancement include:
Improving land condition
Improving diet through exotic pastures and supplementary feeding, especially at finishing
Improving reproductive performance by culling non-productive animals, vaccinating against
reproductive diseases and improving diet quality
Increasing liveweight gain through early weaning and improving diet quality
Spreading grazing pressure by increasing fencing and water points.
Improvements to herd management are largely compatible with practice change required for reducing
adverse impacts on biodiversity, carbon footprints and Great Barrier Reef water quality. Improved
animal performance increases animal growth rates (meaning fewer animals are required to produce
the same volume of meat), and therefore also reduces the methane emissions generated. Good herd
performance in rangelands is also dependent on moderate stocking rates to maximise forage quality,
especially by improving the cover of productive perennial grasses. Improved ground cover also
reduces soil loss (when cover is at least 50%) and gully formation (when at least 75%).
Resilience to climate change will be built by undertaking the practice improvements identified to
improve pastoral productivity and land condition. Of particular importance is the ability to adjust

7 | P a g e
stocking rates in relation to seasonal conditions. At the industry level, decision support, including
improved access to climatic information, is required to assist pastoralists make the best decisions for
their circumstances.
Diversification: Another approach to increasing enterprise resilience is diversification. Options being
canvased include small-scale irrigation of pasture crops for finishing cattle on the property, grain and
oil seed crops, biodiversity conservation and carbon abatement. Conservation efforts on some
properties attracted subsidies in return for entering into conservation agreements. Biodiversity offsets
may widen opportunities for on-property conservation, particularly in Queensland, where a
formalised offset scheme is being developed. A small number of pastoral properties in the region are
also receiving funding for fire management to reduce carbon emissions. A range of other emission
reduction opportunities are at various stages of development, including reducing emissions from
pastoral operations through improved herd management and adjusting cattle diets and storing carbon
in soil or vegetation.
Natural resource management implications: As practices to improve performance are adopted and/or
diversification options are pursued, careful management will be required to avoid potential adverse
environmental impacts. Best-bet options for improving environmental outcomes along with pastoral
productivity include:
Avoiding the use of “transformer” grasses (with high biomass and fuel loads), or at least
ensuring they do not escape from improved pasture plantings
Protecting areas of high biodiversity values when increasing extent and/or intensity of
grazing, in particular protecting biodiversity values on riparian corridors when planning
irrigated cropping projects
Ensuring wet season supplementary feeding does not weaken native perennial grasses
Ensuring early dry season burning does not lead to vegetation thickening and biodiversity
decline.
The NRM implications of the current trajectory of the pastoral industry are mixed. Herd building will
put more pressure on the natural environment. However, performance improvement has many
benefits by reducing the number of hooves and mouths required to produce a kilogram of meat. If
well managed, mosaic agriculture can contribute to herd performance while taking pressure off
pastures and the natural environment during the wet season, but managed poorly could result in
further degradation of alluvial environments and over stocking of adjacent areas.

8 | P a g e
The environmental footprint of diversification into agriculture would similarly need to be managed
carefully. However, increasing income from various forms of ecosystem service delivery, particularly
on lands that are marginal for grazing, would be a boon to both pastoral enterprises and the
environment.
Central to all this change are the pastoralists themselves. And with all that is required from them and
all the stresses and strains they already have to bear, many will be in no position to take up improved
practices, let alone participate in conservation activities. Pathways out of debt must be found before
resilience in the face of change can be achieved, and pastoralists must be supported in the adoption
of new practices, rather than have it mandated.
9 | P a g e
Introduction
This report describes trends in the beef industry in the Monsoonal North. It aims to provide the
region’s natural resource management (NRM) groups with an understanding of how best to support
the industry, undertake the changes required to improve its environmental sustainability and
economic viability, and to provide it with resilience in the face of increasing development pressures
and climate change. It charts the industry’s history and development; describes its current condition
and the pressures and drivers it is experiencing; and explores how these are likely to change in the
near future.
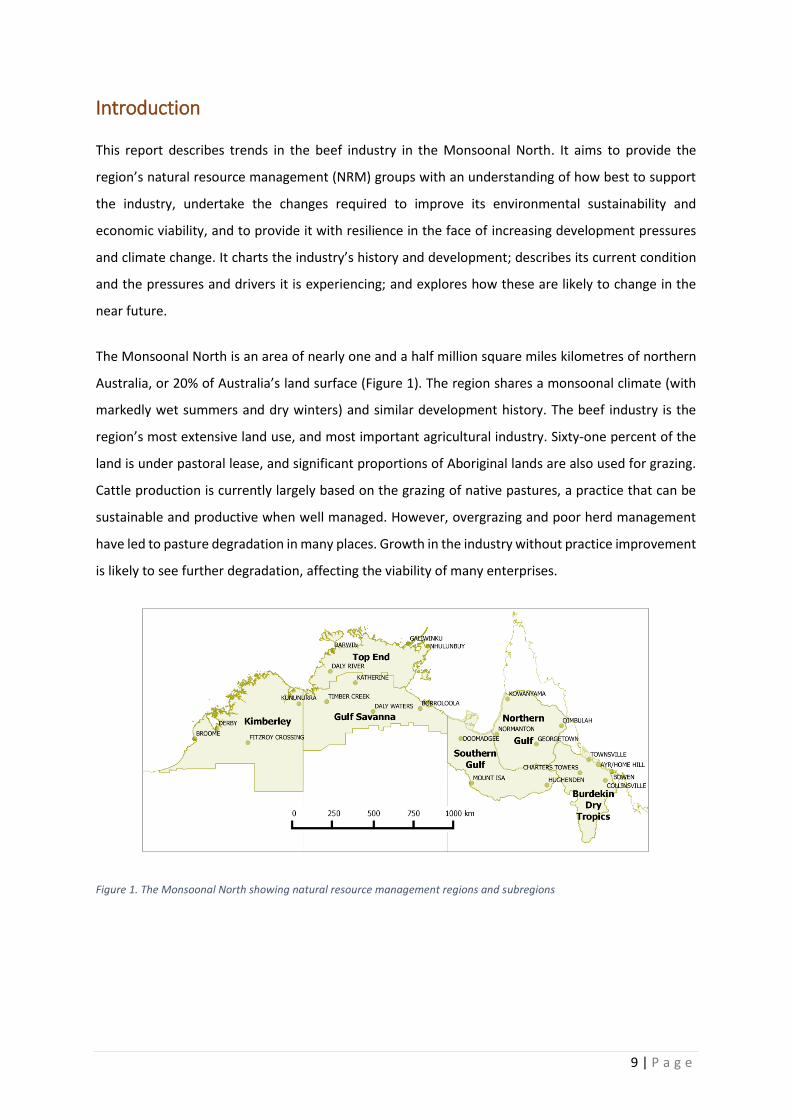
The Monsoonal North is an area of nearly one and a half million square miles kilometres of northern
Australia, or 20% of Australia’s land surface (Figure 1). The region shares a monsoonal climate (with
markedly wet summers and dry winters) and similar development history. The beef industry is the
region’s most extensive land use, and most important agricultural industry. Sixty-one percent of the
land is under pastoral lease, and significant proportions of Aboriginal lands are also used for grazing.
Cattle production is currently largely based on the grazing of native pastures, a practice that can be
sustainable and productive when well managed. However, overgrazing and poor herd management
have led to pasture degradation in many places. Growth in the industry without practice improvement
is likely to see further degradation, affecting the viability of many enterprises.
Figure 1. The Monsoonal North showing natural resource management regions and subregions

10 | P a g e
The region also faces a number of shared issues, particularly the challenges of intensifying climatic
extremes and pressure to exploit Asia’s growing demand for agricultural produce, which is leading to
a jostling for the use of land and access to apparently copious water resources. Indigenous ownership
of land is also increasingly being legitimised with the resolution of Native Title claims. So on the one
hand, ownership of many pastoral properties is being resumed by Indigenous communities, and on
the other, the nature and extent of pastoralism is likely to change as enterprises intensify and diversify,
or are replaced by other agricultural industries. Each of these changes bring with it different challenges
to the viability of the industry and the environmental condition of tropical landscapes. But many
pastoralists have little capacity to consider the implications of these changes, as they are daily
confronted with market volatility, financial worries, complex management arrangements, exacting
regulatory requirements, health concerns and the difficulties of getting cattle to distant markets on
substandard roads.
Efforts to improve industry sustainability must, therefore, be aware of both current circumstances and
future directions. It is hoped that by improving understanding of the industry, its current and future
challenges, and its opportunities, this report will assist chart a path to a more sustainable and resilient
future.
The region
Climate
The region extends across the band of northern Australia that experiences a highly summer-dominant
rainfall. Its climate is generally very hot and humid1. Average temperatures mostly range between 18
and 27°C in winter and between 27 and 33°C in summer, with slightly cooler temperatures in coastal
areas in summer and slightly cooler temperatures inland in winter. Annual average rainfall ranges from
400 mm in the inland to in excess of 2,000 mm in the north and east (Figure 2). Rainfall is strongly
influenced by the intensity of the wet season and monsoon, and by tropical cyclones. In the eastern
parts of Queensland, moist onshore south-east trade winds also bring rain through much of the year.
This pattern is overlain by the wet dry cycles of the El Niño-Southern Oscillation. In the El Niño part of
the cycle, rainfall tends to be depressed in eastern and central areas; in La Niña years, significant
rainfall during the wet season typically build-up presages an early wet season onset1.

11 | P a g e
Figure 2. Annual average rainfall in the Monsoonal North
Source of data: Australian Bureau of Meteorology (2015)2
Cyclones cause significant wind damage, flooding and coastal erosion in the region in most years, most
usually between November and April3. On average, 4.7 cyclones affect the Queensland coast each
year, with cyclone frequency being almost twice as high during La Niña years as in El Niño years. The
Gulf of Carpentaria averages two cyclones a year, while the Arafura and Timor Seas average one a
year. The frequency of cyclones affecting any single location is much lower than these regional
frequencies. Most of the region experiences a cyclone once in every eight years. The highest frequency
is in the northwest, with Broome experiencing a cyclone once every four years. Nearly half the
cyclones in the northern region and Gulf of Carpentaria are in the least severe category (Category 1),
with progressively fewer cyclones of increasing intensity. Less than 5% of cyclones are classed as
Category 5.
Soil and vegetation
Soils in the Monsoonal North are generally infertile, with deficiencies in nitrogen, phosphorus and
sulphur4. Poor soils present significant challenges to agricultural development5. The region is often
referred to as tropical savanna, which classically means that the grass layer is an important component
of the vegetation under a lightly-treed area4. However, this belies the diversity of vegetation
communities (Figure 3). While much of the region is vegetated by different forms of eucalypt
woodland with an understorey of tussock or hummock grasses, other communities include mesic
rainforests on Queensland’s near coastal ranges and monsoon scrubs dotted throughout the region
across fire-protected refugia. Acacia scrublands become more important in the west and spinifex

12 | P a g e
grasslands in the inland. Coastal communities are particularly diverse, ranging from marine grasslands
and mudflats to mangroves.
Figure 3. Vegetation of the Monsoonal North
Source of data: National Vegetation Information System Version 4.16
Biodiversity
Northern Australia is recognised for its high biodiversity values and intact landscapes7. The region’s
terrestrial, freshwater aquatic and marine ecosystems support an abundance of plants and animals
unique to the region. However, biodiversity decline is a serious concern, with high rates of extinctions
among critical weight-range mammals8 and the health of coral reefs in decline. Although only a small
proportion of the region has been cleared of its native vegetation, biodiversity is increasingly impacted
by inappropriate fire regimes, weeds, exotic herbivores, including livestock, exotic predators,
pathogens and disease, groundwater and surface water extraction8. Its rivers and estuaries are largely
in good condition9,10. However, degradation of marine systems is a concern with marine debris being
a particular problem across the north11,12 and run-off pollution in the Great Barrier Reef13.
Depopulation and social dysfunction are now recognised as a significant threat that reduces the
environmental management capacity8. Climate change is already affecting marine systems, with
increasing frequency of coral bleaching events14. As it intensifies, it is expected to exacerbate these
problems as it puts more pressure on systems already under stress15,16.

13 | P a g e
River systems
The region’s rivers account for close to half Australia’s river discharge17. However, only a small
proportion of rivers are perennial and flow is mostly highly seasonal, with about 90% occurring
between December and March18,19. There is considerable pressure to capture some of this flow for
agricultural development20. The Burdekin and associated rivers in the north-east drain to the Great
Barrier Reef (GBR), so their management impacts on GBR water quality (Figure 4). All other rivers drain
to the northern coastline with rivers to the west of Cape York Peninsula from the Timor Sea Drainage
Division.
Figure 4. Drainage basins of the Monsoonal North
Source of data: Rivers: Geoscience Australia (2004)21; Catchments: Australian Surveying and Land Information Group (2000)22

14 | P a g e
Land use and tenure
Nearly two-thirds of the Monsoonal North is pastoral lease, and one-fifth is Aboriginal land (Figure 5,
Table 1). Distribution of land tenures varies across the region. Pastoral leases dominate the
Queensland NRM regions and the Gulf Savanna and constitute almost half of the Kimberley. The
Kimberley also has large areas of Aboriginal pastoral leases and Crown Land. The highest proportion
of Aboriginal land is in the Top End. Most of the freehold land is in the Queensland NRM regions,
where there is very little Aboriginal land outside Aboriginal pastoral leases.
Figure 5. Land tenure across the Monsoonal North
Source of data: Geoscience Australia (2004)23
NB: Tenure changes that have occurred since 1993 may not appear on this map.
15 | P a g e
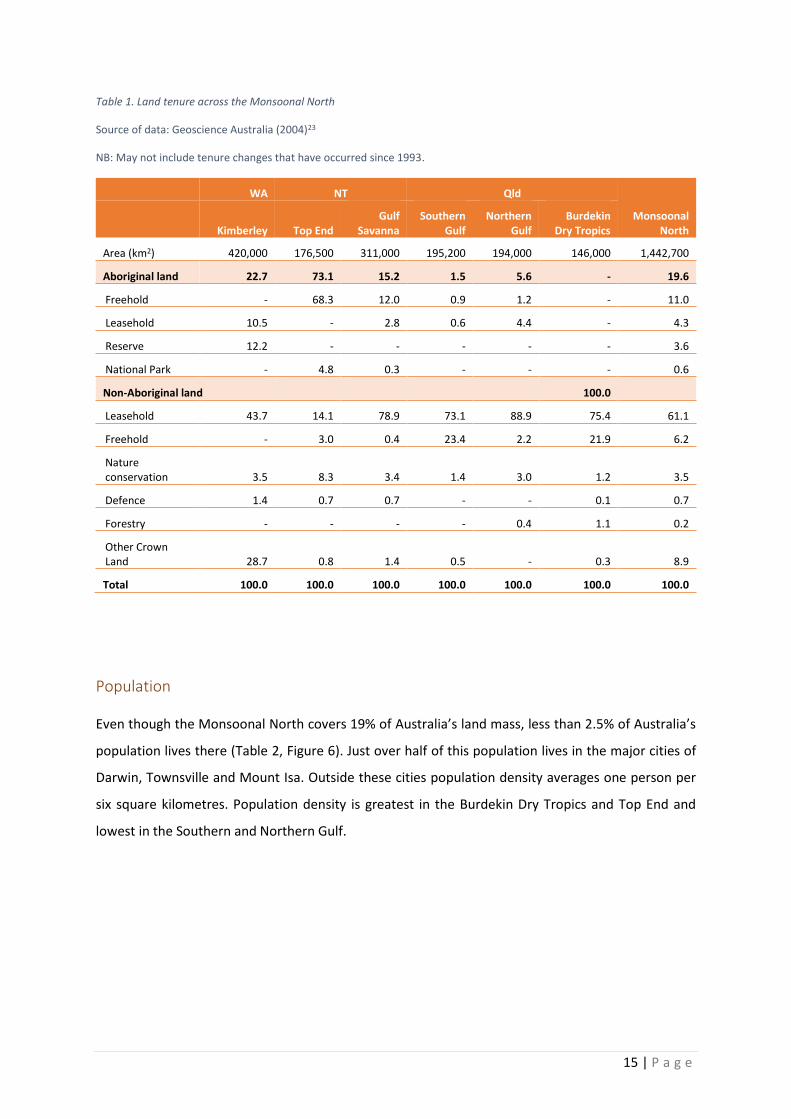
Table 1. Land tenure across the Monsoonal North
Source of data: Geoscience Australia (2004)23
NB: May not include tenure changes that have occurred since 1993.
WA NT Qld
Monsoonal North Kimberley Top End
Gulf Savanna
Southern Gulf
Northern Gulf
Burdekin Dry Tropics
Area (km2) 420,000 176,500 311,000 195,200 194,000 146,000 1,442,700
Aboriginal land 22.7 73.1 15.2 1.5 5.6 - 19.6
Freehold - 68.3 12.0 0.9 1.2 - 11.0
Leasehold 10.5 - 2.8 0.6 4.4 - 4.3
Reserve 12.2 - - - - - 3.6
National Park - 4.8 0.3 - - - 0.6
Non-Aboriginal land 100.0
Leasehold 43.7 14.1 78.9 73.1 88.9 75.4 61.1
Freehold - 3.0 0.4 23.4 2.2 21.9 6.2
Nature conservation 3.5 8.3 3.4 1.4 3.0 1.2 3.5
Defence 1.4 0.7 0.7 - - 0.1 0.7
Forestry - - - - 0.4 1.1 0.2
Other Crown Land 28.7 0.8 1.4 0.5 - 0.3 8.9
Total 100.0 100.0 100.0 100.0 100.0 100.0 100.0
Population
Even though the Monsoonal North covers 19% of Australia’s land mass, less than 2.5% of Australia’s
population lives there (Table 2, Figure 6). Just over half of this population lives in the major cities of
Darwin, Townsville and Mount Isa. Outside these cities population density averages one person per
six square kilometres. Population density is greatest in the Burdekin Dry Tropics and Top End and
lowest in the Southern and Northern Gulf.

16 | P a g e
Table 2. Population statistics for the Monsoonal North
Source of data: Australian Bureau of Statistics (2014)24
Kimberley Top End Gulf
Savanna Southern
Gulf Northern
Gulf Burdekin
Dry Tropics Total Number of people 39,890 166,375 26,011 26,182 8,969 283,718 551,145
Percentage of Australian population 0.17 0.72 0.11 0.11 0.04 1.23 2.38
Number of people outside major cities 39,890 51,075 26,011 10,536 8,969 100,111 261,383
Population density outside major cities (people/km2) 0.09 0.29 0.08 0.05 0.05 0.69 0.17
Figure 6. Population of the Monsoonal North
Source of data: Australian Bureau of Statistics (2014)24
The region has a high Indigenous population. Representation of Indigenous people increases from east
to west (Table 3) and with remoteness. Across Australia, Indigenous people make up 1% of the
population in major cities, 3% in inner regional areas, 6% in outer regional areas, 15% in remote areas
and 49% in very remote areas25.

17 | P a g e
Table 3. Population estimates for Indigenous people living in northern Australia
Source of data: Australian Bureau of Statistics (2013)26
Indigenous statistical region Total population Indigenous population (no.) (no.) (%)
Western Australia
Broome 15,737 5,481 34.8
West Kimberley 8,955 4,930 55.1
Kununurra 12,099 6,611 54.6
Northern Territory
Darwin 131,619 14,660 11.1
Jabiru - Tiwi 15,586 12,151 78.0
Katherine 19,602 10,543 53.8
Nhulunbuy 16,899 10,896 64.5
Queensland
Mount Isa 34,026 9,358 27.5
Townsville - Mackay 385,525 27,607 7.2
The northern beef industry
The northern cattle herd
An assessment of the northern beef industry based on numbers alone reveals a success story. Two-
thirds of the Monsoonal North is currently used for cattle grazing (Table 4), accounting for
approximately one-fifth of Australia’s cattle herd and more than one-third of the cattle in northern
Australia27.
Table 4. Numbers of cattle in the Monsoonal North
State/ Territory Region Land area Pastoral enterprises Cattle Sources
(km2) (no.) (% of region) (no.)
WA Kimberley 422,000 94 53 750,000 28,29
NT Top End/Savanna Gulf 487,500 148 55 1,000,000 30,31,32
Qld Southern Gulf 175,000 ? 90 1,593,000 33,27
Qld Northern Gulf 194,000 ? 92 933,000 33,27
Qld Burdekin Dry Tropics 141,000 977 85 1,432,000 27,34
Total 1,419,500 1,219 66 5,708,000
After the industry rapidly spread across the region in the late 19th century, its growth was initially
aided by low wages paid to Aboriginal stockmen until the late 1960s; progressive introduction of
drought-hardy and tick-resistant Brahman stock (Bos indicus) from the 1940s; and the shift away from
sheep from the 1960s35-37. While affected by a major market slump in the 1970s, stock numbers
doubled across Queensland, the Northern Territory and Western Australia between 1965 and 2014

18 | P a g e
(Figure 7). Subsequent growth has been facilitated by eradication of brucellosis and tuberculosis in
the 1980sa; infrastructure development and management changes, including the introduction of
pasture species; supplementary feeding; hormone growth promotants; and improvements in herd
management.
Figure 7. Growth of the northern cattle herd in relation to consumption, demand and rainfall
Source of data: Cattle numbers: Australian Bureau of Statistics (2013)38; Beef consumption: United States Department of Agriculture (2015)39; Saleyard prices: Mathews and Ryan (2015)40; Rainfall: Australian Bureau of Meteorology (2015)2
Growth in cattle numbers since 1965 has also been subject to fluctuations in domestic and global
demand, prices and trade restrictions. Resultant changes in stocking rates have had temporal
implications for grazing pressure and land condition. While beef consumption and stock numbers have
generally increased (with some variations) saleyard prices have decreased in real terms affecting
industry profitability (see Profitability).
Demand for beef was stimulated by global economic growth in the early 1970s41. Herd-building to take
advantage of the high prices followed both in Australia and overseas, and stocking rates in the north
began to exceed carrying capacity. In the least resilient land systems, intensification of the northern
a With replacement herds further increasing the proportion of Brahman stock

19 | P a g e
grazing lands was accompanied by degradation, with negative impacts on production, biodiversity and
water quality35,42,43. Over-supply saw the price of beef collapse in late 197341. Cattle numbers then
further increased as several of Australia’s trading partners imposed trade restrictions, and favourable
climatic conditions allowed stock to be retained rather than sold at low prices. Stocking rates
escalated. Improvement in prices at the end of the 70s saw an increase in cattle sales, only briefly
interrupting the northern herd’s growth. At that stage, the north was only exporting chilled boxed
beef.
A cattle glut in the United States of America in the 1990s lowered demand and prices for Australian
boxed beef. At the same time feedlots were being established in south-east Asia to service a growing
demand for freshly-slaughtered beef44. Northern Australia was well placed to supply the Brahman
cattle demanded by the Asian market, and further adapted to this market by reducing the age at which
animals were turned off breeding properties45. This growth of the live-export market coincided with
drought, and there was only moderate growth in cattle numbers37.
A rising Australian dollar through the early 2000s, combined with high domestic prices, saw Australian
beef exports fall45. In 2010, aiming to have a self-sufficient beef industry, Indonesia imposed import
quotas on Australian beef and a weight limit of 350 kg37. In 2011, exports of live cattle to Indonesia
were suspended for two months over welfare concerns46 and only recommenced after the Australian
Government was satisfied that a system47 was in place to safeguard animal welfare48, and the
Indonesian Government was prepared to resume issuing permits. When trade recommenced,
Indonesia reduced import quotas, issuing permits on a quarterly basis. The Australian herd reached
record numbers in 201349. Prices once again slumped50. Concerns about overstocking led some
producers to shoot cattle, rather than let them starve50.
By the end of 2014, following successful implementation of the Exporter Supply Chain Assurance
Scheme, exports to Indonesia had almost returned to pre-2011 levels with 730,000 head exported to
this market. New markets opened and exports reached record levels. This growth was only possible
through investment in specialised infrastructure, such as holding yards at ports and specially fitted-
out ships37. Initially, not all producers benefited from this live-export market. Most cattle came from
properties that were close to export facilities and had all-season access, especially when demand
weakened45. Unfortunately, once the Indonesian market reopened, many of the cattle that had
originally been destined for this market now exceeded the 350 kg weight limit51. Producers left with
these “out-of-specification” cattle had difficulty selling stock because of a lack of market appeal and
high cost of transport to alternative markets, leading to overstocking51. Average incomes of northern
20 | P a g e
beef producers suffered a 43% decline between 2011-12 and 2013-14, 36% of producers recording
negative farm cash incomes and 12% of producers were in a position where they are unable to service
further debt52.
Drought conditions persisted in western Queensland through 2014, causing further stress on
enterprises, and forcing producers to offload stocka. Stock numbers were so low that some saleyards
suspended tradingb.
By the start of 2015, ongoing drought and record exports had reduced the size of the cattle herd49,
with the expectation that it would take years to recover to peak levelsc. Reduced numbers of cattle
available for slaughter and export, increased global demand and the opening of some new markets49
drove prices higher and forced northern exporters to source cattle from southern statesd. By October
2015, prices were higher than they had been in decades and were expected to remain high53.
Sustained price increases returned optimism to the industrye. However, drought-affected producers
with few stock were unable to take advantage of these prices, which made the cost of restocking after
the drought breaks prohibitivef.
Industry-wide, continued growth in demand, a reduced Australian dollar and high global prices, are
expected to maintain improved incomes for Australian beef producers in the short-term54. In the
longer term, Australian beef production is expected to continue to grow, and be 80% greater in 2050
than it was in 200755. Whether this is achieved will depend on a number of factors. These include
global supply and demand dynamics; trade agreements and market access; policies and programs of
government, industry and financial institutions; adequacy of infrastructure (roads, ports, saleyards,
abattoirs); the pastoral industry’s capacity to weather current and emerging stresses (including
climate change) and to adopt business models and management practices necessary to support
intensification; and the capacity of the land and water resources to support increased stock
production.
a http://www.abc.net.au/news/5982842 b http://www.abc.net.au/6466804 c http://www.abc.net.au/6847786 d http://www.abc.net.au/news/6017028 e http://www.abc.net.au/6158822 f http://www.abc.net.au/news/6814294
21 | P a g e
Markets
In 2003, 62% of Australian beef was exported49. With stagnating domestic and growing global demand
(see Domestic and global demand), this figure had grown to 74% by 2015. While exports are expected
to hover around 70% in the short-term49, growth is expected to continue as a result of increased
production, with exports projected to more than double by 205055. Since 2000, the majority of beef
exported from northern Australia has been sold to Indonesia37,56. Exports to Indonesia peaked at
720,000 head in 2009-10, but steadily declined over the next three years, reaching a low of 270,000
in 2012-13 as a combined result of the live-export ban and subsequent trade restrictions by the
Indonesian government (see Profitability). In 2014, sales to the Indonesian market had nearly
recovered to peak levels, with 700,000 head exported and a total of 1.2 million head to all
destinations49. Other destinations for northern cattle were unaffected by the ban, and exports to
many destinations increased over this period. In particular, China and Vietnam have become
significant destinations for northern cattle in the last five years, and now receive 8 and 12% of
Australia’s total live beef exports respectively56. Live exports to China have increased sixfold since
2008-09, and Vietnam has risen from an almost non-existent base to being the second most important
destination for Australian cattle in 2013-14. Most of the cattle to both these destinations have been
sourced from northern Australia. In the first three quarters of 2015, live exports to Indonesia were
22% lower than in 2014, and income generated from these exports 12% lower. This has been offset
by increases in exports to Vietnam57. Volatility in the live export sector (which averaged 21.5% of total
volume of beef exports between 1998 and 2010, and fell to 16.2% in 2011) affects availability and
price in the rest of the market. Prices slumped following the live export ban and have escalated with
recovery of this market. This may change as more processing facilities are built in the north, which will
improve the capacity of northern producers to export chilled beef (see Supply chain). In contrast to
the volatile live export numbers, Australian packed beef has been exported at fairly consistent levels
in recent years (Figure 8).
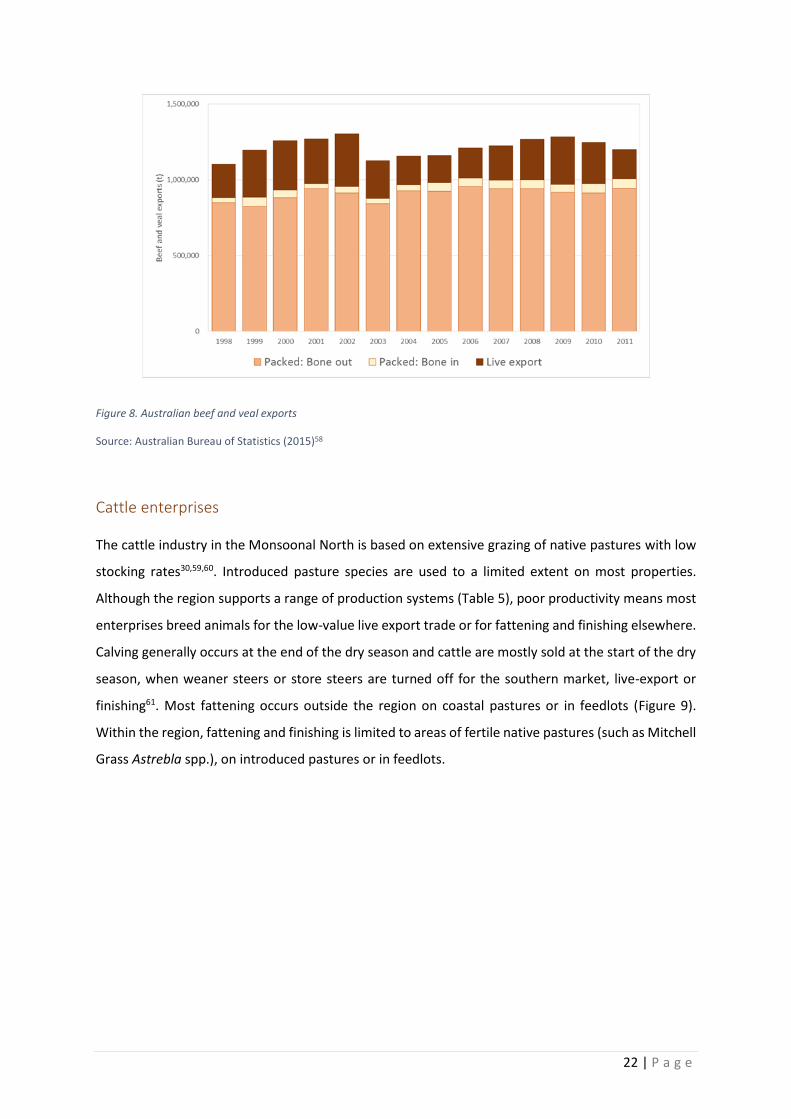
22 | P a g e
Figure 8. Australian beef and veal exports
Source: Australian Bureau of Statistics (2015)58
Cattle enterprises
The cattle industry in the Monsoonal North is based on extensive grazing of native pastures with low
stocking rates30,59,60. Introduced pasture species are used to a limited extent on most properties.
Although the region supports a range of production systems (Table 5), poor productivity means most
enterprises breed animals for the low-value live export trade or for fattening and finishing elsewhere.
Calving generally occurs at the end of the dry season and cattle are mostly sold at the start of the dry
season, when weaner steers or store steers are turned off for the southern market, live-export or
finishing61. Most fattening occurs outside the region on coastal pastures or in feedlots (Figure 9).
Within the region, fattening and finishing is limited to areas of fertile native pastures (such as Mitchell
Grass Astrebla spp.), on introduced pastures or in feedlots.

23 | P a g e
Table 5. Beef cattle enterprises found in the Monsoonal North
Source: Ausvet Animal Health Services (2006)62
Enterprise focus Activities Kim
ber
ley
Top
En
d
Kat
her
ine
Sou
ther
n G
ulf
No
rth
ern
Gu
lf
Bu
rdek
in D
ry
Tro
pic
s
Breeding Breed cattle destined for sale at weaning + + + + + +
Breeding & growing
Breed cattle for sale as store yearling cattle to be finished at a feedlot or specialist finisher
+ + + + + +
Breeding & finishing
Breed and finish cattle for sale for slaughter, generally for the domestic market
+ + +
Growing & backgrounding
Acquire weaner or yearling steers for growing-out to weights required by specialised finishers or lot-feeders
+ + +
Figure 9. Location of feedlots in relation to the Monsoonal North
Source: Adapted from Australian Lot Feeders’ Association

24 | P a g e
Indigenous pastoralism
Indigenous people have a long association with the northern beef industry, with many Aboriginal
stockmen providing cheap labour on cattle stations until the equal pay decision of 196763,64.
Indigenous pastoralism is a significant and growing part of the northern beef industry. Efforts to
develop Indigenous pastoralism have adopted a vertical integration approach spanning resource
development; education and training; cattle breeding, fattening, processing and live-export, with the
addition of pastoral tourism65-67. Along with increasing the number of properties in Indigenous hands
and employment opportunities for Indigenous people, Indigenous-owned lands offer the opportunity
to increase the size of the northern Australian cattle herd. Herd-building on Indigenous land in the last
decade or so has increased cattle numbers in the Northern Territory by around 100,000 head, and
there are plans to double the herd on Indigenous land in the Kimberley through improving land
condition and investing in watering points, fencing, access roads and stock handling facilities37,59,68.
However, there is some question as to whether these properties can sustainably support viable
herds69.
Development of Indigenous pastoralism in the Monsoonal North is supported by government agencies
and the Indigenous Land Corporation (ILC)a. The ILC operates 14 pastoral operations across Australia
and runs approximately 90,000 head of cattle67. Six of these properties are in the Monsoonal North.
In 2013-14, ILC employed 137 Indigenous people and hosted an additional 148 Indigenous trainees.
ILC operates breeding and fattening enterprises, runs a small abattoir and butcher shop in the Top End
(which supplies Indigenous communities and niche outlets), and has an export depot outside Broome.
The Western Australian Government is investing in Indigenous pastoralism in the Kimberley region,
by underwriting irrigation infrastructure needed for pasture crops70. It aims to increase the size of the
cattle herd on the Aboriginal-owned cattle station, Mowanjum from 1,500 to 10–15,000 head by
building a centre-pivot irrigation system that draws on local groundwater to provide dry season feed
for a fattening operation. It will also provide a training facility for Derby TAFE’s Pastoral Management
Studies program for both Mowanjum and Derby students.
In the Northern Territory, the Indigenous Pastoral Program (IPP) aims to increase Indigenous
participation in the pastoral industry and increase cattle numbers on Indigenous land to around
200,00071. Initiated in 2003, IPP operates through a partnership between ILC, Northern Land Council
(NLC); Central Land Council (CLC) and the Department of Primary Industry and Fisheries, Northern
a A government entity established to assist Indigenous people to acquire and manage land to achieve economic, environmental, social and cultural benefits

25 | P a g e
Territory (DPIF NT); the Northern Territory Cattlemen’s Association (NTCA) and the Australian
Government. Achievements of the program to 2104 include72,73:
An additional 90-100,000 cattle on Indigenous-owned land
An additional 24,000 km2 of land fenced, watered and in pastoral production
25 new grazing licenses on Indigenous-owned land covering 34,000 km2
14 natural resource management audits on Indigenous held pastoral enterprises
Development of 23 business/property management plans.
An Indigenous Pastoral Project74 was also established within the Rural Industries Research and
Development Corporation (RIRDC) as part of the northern Australia Beef Strategy (see Northern
Australia Beef Industry Working Group). It aims to help Indigenous pastoral businesses become
commercially viable and sustainable. Its main achievement has been the production of a pastoral
management manual for the Indigenous pastoral sector66.
Not all pastoral properties purchased on behalf of Indigenous communities will remain as pastoral
operations. Fish River (1,825 km2) in the Top End and Tallaroo Station (315 km2) in the Northern Gulf
were purchased to establish Indigenous Protected Areas75, with land management on Fish River being
supported through fire abatement projects76. Land on Cape York Peninsula transferred to Aboriginal
ownership since March 2012 included excision of 3,257 km2 of two pastoral properties to create new
National Parks 77. However, some of the 6,628 km2 of new Aboriginal freehold land on Cape York
Peninsula is likely to be used for grazing.
Profitability
Up until the start of 2015, profitability of the northern cattle industry had not improved in 30 years,
and had declined for the best performing enterprises (Figure 10). This is because costs of cattle
production increased thirty-fold from 1950 (i.e. stayed level in real terms), while income had only
increased eight-fold (i.e. decreased 60% in real terms)78. Indeed, after interest payments are made,
most cattle businesses make a loss and so are deemed to be unsustainable78.
The direct costs of producing a 400 kg steer (labour, supplements and fodder, agistment, animal health
and freight and selling) rose by 150% between 2001 and 2008, and total costs of production increased
by 54%79. These estimates do not account for lost production as a result of Weeds (ca $1,000
million/year industry-wide), Pest animals (ca $36 million/year) and Disease and parasites (ca $390

26 | P a g e
million) as documented in subsequent sections of this report, or of natural disasters—for which
costings are not available. In addition, cattle theft has been estimated to cost the industry between
$1.5 and $2 million a year in Queensland alonea. Costs would be even higher without current
biosecurity efforts, which are estimated to save beef producers an average of $12,927 per enterprise,
largely through the through preventing the introduction of Foot and Mouth Disease and the spread of
exotic pests, weeds and diseases80.
While most enterprises have offset cost increases by reducing their labour costs, this is not an option
for the top 25% of businesses, which are already operating at a high level of input efficiency. Hence,
the gap between the best performing and average businesses is closing. Corporation-run businesses
are the least flexible in their cost structure, and can be outperformed by well-run family businesses78.
While there is marked variation in enterprise performance across the region, the majority of northern
beef enterprises are not considered viable in the long term78,79 (Figure 10). Between 2001-2012,
enterprises performing in the top 25% made an average profit of $66 per head of cattle sold compared
to an industry average of $6 per head78. Performance was found to be related to good management,
rather than constrained by environmental factors. Top performance was characterised by
reproductive rates that were higher, mortality rates that were lower and sale weights that were better
than industry averages. These enterprises, therefore, demonstrate that adoption of management
practices to improve herd performance (as outlined in the next section) flows through to improved
enterprise profitability. Top performers also had larger herds, high income, low operating expenses,
high labour efficiency and low ratios between asset value and herd size. Businesses with fewer than
800 head typically made a loss78. Even the best performing businesses in this size class averaged losses
of nearly $14 per head.
a http://www.abc.net.au/news/6322062

27 | P a g e
Figure 10. Long term profitability of average and top 25% northern beef businesses
Source: McLean, Holmes, Counsell, Bush AgriBusiness Pty Ltd and Holmes & Co. (2014)78 Reproduced courtesy of Meat & Livestock Australia Limited - www.mla.com.au
Note: Includes enterprises in the Monsoonal North, Pilbara, Barkly, Alice Springs and Cape York Peninsula.
The average price paid per head (adult equivalent/AE) declined between 2004 and 2014 from close to
$200 to around $160, and cattle prices have rarely been higher than they were in the 1970s78. Average
income of surveyed northern beef properties in 2013-14 was 43% lower than it was in 2012-13, and
48% below the ten-year average52. Northern beef enterprises made an average loss of $63,000 in
2013-14a, following on losses of $6,100 in the previous year. As a result, off-farm income is particularly
important for propping up small enterprises, which receive more income from off-farm activities than
they do from cattle production (Figure 11). While off-farm work improves financial capacity for cattle
and land management, it also restricts time and physical capacity available for on-farm work81. Off-
farm work also increases in times of drought, placing considerable stress on family businesses82.
a Income minus expenses

28 | P a g e
Figure 11. Ratio between off-farm and on-farm income in relation to herd size
Source: Data from Martin, Phillips, Leith and Caboche (2014)83
The price of pastoral land rose steeply between 1990 and 2008 (Figure 13), reflecting land speculation
rather than productivity, which has increased by less than 1% a year since 197752. At the same time,
debt levels across the region increased as pastoralists were encouraged to borrow against their
growing asset base. Increased debt has resulted in interest payments reaching 13% of farm income52.
Cattle producers responding to the Gulf Cattlemen’s Association survey suggested bank managers
actively encouraged over-extended borrowing during this period84. This strategy came unstuck for
pastoralists when land prices collapsed in 2008. The same cattlemen reported the value of their
properties declined by an average of 28% between 2010 and 201484.
Northern Territory and Kimberley properties have increasingly specialised in supplying cattle for the
live-export market, while Queensland producers export both live cattle and packed beef (Figure
12)52,78. The immediate impact of the ban on cattle enterprises was assessed by surveying pastoralists
in the Kimberley and northern half of the Northern Territorya. When the live-export trade with
Indonesia was suspended in 2011, almost all pastoral enterprises were intending to send cattle to
Indonesia. For just over half of the enterprises, at least 50% of the cattle to be sold that year had been
intended for the Indonesian market; and three-quarters of enterprises had cattle ready to send when
the ban occurred46. Queensland pastoralists had lower exposure to the market’s suspension. Just over
a third of pastoralists surveyedb were intending to send cattle to Indonesia, only 6% to sell more than
50% of their turn-off, and only 13% had cattle ready to send.
a 55 beef enterprises in the Kimberley, Top End and Gulf Savanna NRM regions b 89 businesses surveyed in the three statistical regions covering the Queensland section of the Monsoonal North
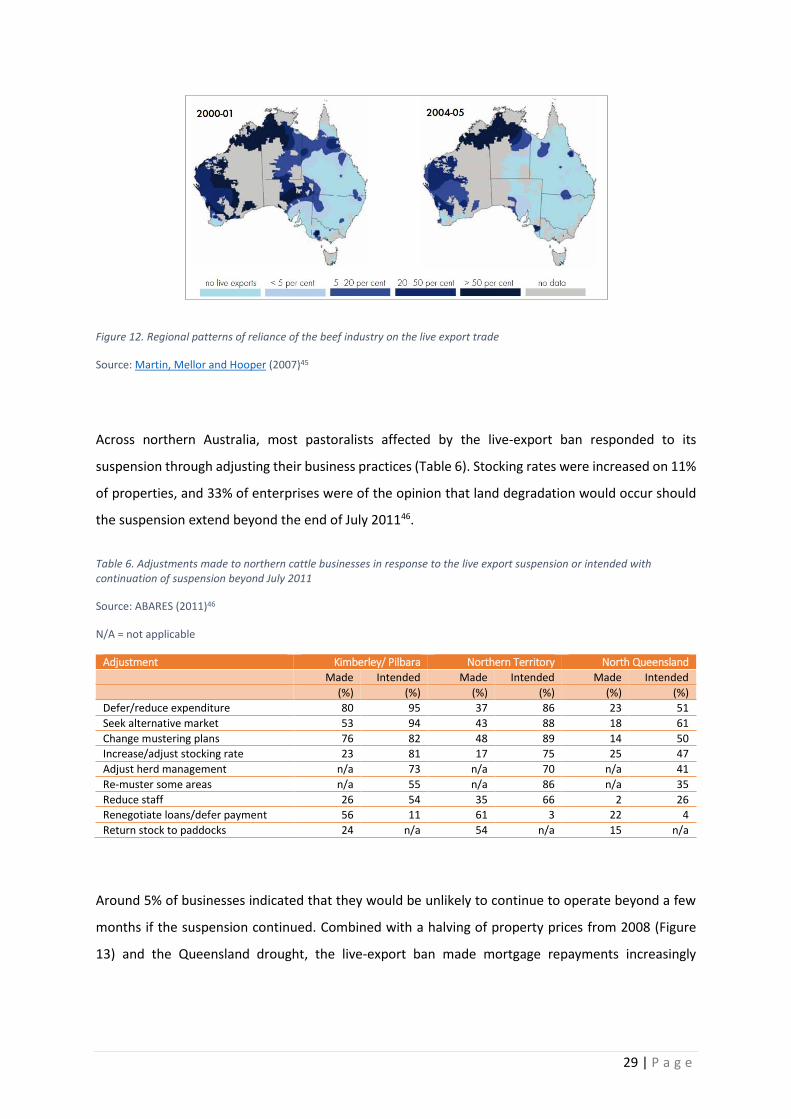
29 | P a g e
Figure 12. Regional patterns of reliance of the beef industry on the live export trade
Source: Martin, Mellor and Hooper (2007)45
Across northern Australia, most pastoralists affected by the live-export ban responded to its
suspension through adjusting their business practices (Table 6). Stocking rates were increased on 11%
of properties, and 33% of enterprises were of the opinion that land degradation would occur should
the suspension extend beyond the end of July 201146.
Table 6. Adjustments made to northern cattle businesses in response to the live export suspension or intended with continuation of suspension beyond July 2011
Source: ABARES (2011)46
N/A = not applicable
Adjustment Kimberley/ Pilbara Northern Territory North Queensland
Made Intended Made Intended Made Intended
(%) (%) (%) (%) (%) (%)
Defer/reduce expenditure 80 95 37 86 23 51
Seek alternative market 53 94 43 88 18 61
Change mustering plans 76 82 48 89 14 50
Increase/adjust stocking rate 23 81 17 75 25 47
Adjust herd management n/a 73 n/a 70 n/a 41
Re-muster some areas n/a 55 n/a 86 n/a 35
Reduce staff 26 54 35 66 2 26
Renegotiate loans/defer payment 56 11 61 3 22 4
Return stock to paddocks 24 n/a 54 n/a 15 n/a
Around 5% of businesses indicated that they would be unlikely to continue to operate beyond a few
months if the suspension continued. Combined with a halving of property prices from 2008 (Figure
13) and the Queensland drought, the live-export ban made mortgage repayments increasingly

30 | P a g e
difficult. In some casesa, this was exacerbated by increasingly stringent mortgage arrangements,
including increased interest rates and overdraft margins84. The majority of pastoralists surveyed (59%)
considered that such changes to mortgage arrangements had adversely affected their businesses and
a further 8% saw these changes being a threat to their long-term viability.
Figure 13. Land prices and debt burden of grazing properties in Monsoonal North
Source of data: Australian Bureau of Agricultural and Resource Economics and Sciences (2012)86
The percentage of Queensland beef producers in debt rose by 15% from 5,658 in 2009 to 6,499 in
201187. Over this period, the industry’s combined debt increased from $7.8 billion (54.5% of the state’s
total) to $9.2 billion (54%). In the Queensland gulf, the average debt of pastoralists to financial
institutions increased by 22% between 2010 and 2014 and their debt to rural businesses increased by
600%84. In mid-2012, 23 Queensland gulf pastoralists were more than 90 days overdue on bank loan
repayments (1.9% bank customers)84. By mid-2014, this figure has almost doubled. This has led to an
increase in forced sales, particularly in Queensland. Although ANZ announced a 12-month moratorium
on foreclosures in drought affected parts of Queensland in December 2014b, other banks did not
follow suit. Across the wider pastoral industry, ongoing loss of equity has reduced capacity to provide
a 18% of respondents to Gulf Cattlemen’s Association survey85 b http://www.abc.net.au/news/5961490

31 | P a g e
capital investment for infrastructure and other development78. The flow-on effects of reduced
capacity to service debt on beef enterprise sustainability (including impacts on the health and well-
being of pastoralists) and natural resource condition are dealt with in other sections of this document.
Despite spiralling debt, pastoral businesses in northern Australia still have relatively high equity in
their businesses, averaging 89% in 30 June 201352. This may explain why the Queensland Government
considers the vast majority of these borrowers to be either viable in the long-term or potentially viable
despite current debt-servicing difficulties87. This stands in contrast to industry assessments indicating
the majority of northern beef enterprises to be unviable in the long term78,79 and the majority of
pastoralists surveyed in the Queensland gulf having no confidence in the industry’s future in the
region88.
Figure 14. Average equity ratio and business debt of beef enterprises in the Monsoonal North
Source of data: Australian Bureau of Agricultural and Resource Economics and Sciences (2012)86
In October 2105, cattle prices were as nearly as good as they have ever been and demand from
international and domestic markets is expected to grow 53 4917. A new abattoir in the Darwin rural area
has provided access to the lucrative Asian packed meat market. However, increased beef cattle turn-
off during the drought and in response to high prices has reduced the size of the Australian herd and,
as a consequence, the value of cattle inventories52. The size of the Australian cattle herd is not
expected to recover to 2013 levels in the foreseeable future53, so many pastoralists may be unable to
take advantage of these conditions. However, fortunes of pastoralists not affected by drought have

32 | P a g e
begun to improve, with Kimberley pastoral enterprises shifting from average losses of $150,000 per
station in 2012-13 to profits of $650,000 in 2013-14a.
Pastoralists’ perceptions of issues influencing profitability are consistent with the above summary,
with costs of production, market access issues and poor animal performance included in the top-rating
issues affecting the profitability of grazing enterprises in the Northern Territory in 2011-12. On the
other hand, weeds were the main issue considered to have most impact in environmental
sustainability, followed by feral animals; drought and seasonal conditions; and government. These
issues will be explored in subsequent sections of this report.
Table 7. Top rating issues affecting profitability of Northern Territory grazing enterprises in 2011-12
Source: Cowley et al. (2013)30
Issue Respondents
(%)
Cost of production 34
Market access/instability 28
Government regulation/policy 15
Live export ban 13
Poor reproductive performance/fertility 13
Cattle prices 11
Freight/transport costs 11
Table 8. Top rating issues affecting environmental sustainability of Northern Territory grazing enterprises in 2011-12
Source: Cowley et al. (2013)30
Issue Respondents
(%)
Weeds 30
Feral animals 16
Drought/seasonal conditions 13
Government 12
Governments provide financial support to pastoralists in the times of hardship89. Most support is
provided only at times of declared droughts or natural disasters. One of the most significant forms of
support is in the form of concessional loans for debt restructuring, to cover operating expenses or for
drought recovery and preparedness activities.
a http://www.abc.net.au/news/6321066

33 | P a g e
As the vast majority of farmers have historically managed climate variability without government
support, there is concern that drought assistance rewards poor management90. A Productivity
Commission inquiry into government assistance programs concluded that government support should
concentrate on assisting farmers to improve their business management skills and build self-reliance
through research, development, extension, training and professional advice, and that support
provided to farmers should be based on the level of hardship, not its cause90. Subsequently, there has
been a move away from providing concessional loans to programs to assist producers to increase the
capacity, efficiency and sustainability of their operations91. In 2013-15, the Australian Government
also subsidised pest animal management in drought affected areas. In a move away from emphasising
enterprise viability over providing subsidies, the Queensland Government granted drought-affected
pastoralists grazing rights on National Parks in 2013a.
Herd performance and market access
Indifferent pasture quality, resulting from the harsh climate and infertile and erodible soils, limits
cattle growth rates and reproductive success in much of the Monsoonal North. Except on the Mitchell
Grass country in the Southern Gulf, breeding performance is typically poor; with low pregnancy rates,
high foetal and calf death rates; and high rates of cows “going missing”60,92. Low levels of productivity
necessitate large properties and limited resources needed for infrastructure development and to
minimise handling78. Lack of fattening and finishing options means that most enterprises are supplying
the less profitable end of the market59.
There is a great deal of variation across northern pastoral enterprises on all herd performance criteria.
Some enterprises may be lucky and have exceptionally good soils, financial resources and staff, so
achieve outstanding performance that cannot be emulated by all producers. However, on any country
type or in any given region, it has been argued that anyone should be able to do as well as the pastoral
enterprise that is ranked 25 percentage places from the top60. An example of this concept is provided
(Figure 15) using the mature cows pregnancy rate. The median rate was 17%, meaning that, on half
the enterprises, 17% or fewer cows were pregnant by the fourth month after calving. The top 25% of
enterprises achieved a mature cow pregnancy rate of 31%, or more. This is called the 75th percentile
rate, and is considered to be achievable by all enterprises. Using this approach, significant
a http://www.abc.net.au/news/5076268

34 | P a g e
improvements in all herd performance criteria are considered achievable on pastoral properties across
the Monsoonal North (Table 9).
Figure 15. Example of a box plot explaining the concepts of median and achievable performance
Source: Adapted from McGowan et al. (2014)60
Table 9. Achievable herd performance targets for the Mitchell Grass and the remainders of the Monsoonal North
Source: McGowan et al. (2014)60
NB: In McGowan et al. (2014), Mitchell Grass is called Northern Downs and the rest of Monsoonal North is called Northern Forest
Direction Mitchell Grass Monsoonal North
Desired improvement Median Achievable Median Achievable
Pregnant within four months of calving
(%) increase 66 75 15 25
Annual pregnancy rate (%) increase 80 90 66 73
Foetal/calf loss (%) increase 10 4.7 12.9 9.6
Contributed a weaner (%) increase 72 78 53 62
Cow mortality (missing animals) (%) decrease 6.6 3.8 10.6 5.8
Annual liveweight production per cow
(kg) increase 141.2 188.8 88.8 122.4
Liveweight gained/weight cattle in paddock
(kg/kg) increase 0.23 0.29 0.14 0.20
Weaner production (kg/cow) increase 163 182.6 93.3 112.4
The best beef quality is produced by cattle that grow quickly (i.e. have high liveweight gain). Fast-
grown beef has access to the most lucrative end of the market and attracts the best prices (Figure 16).
Cattle grown on unimproved pastures and using substandard herd management have low liveweight
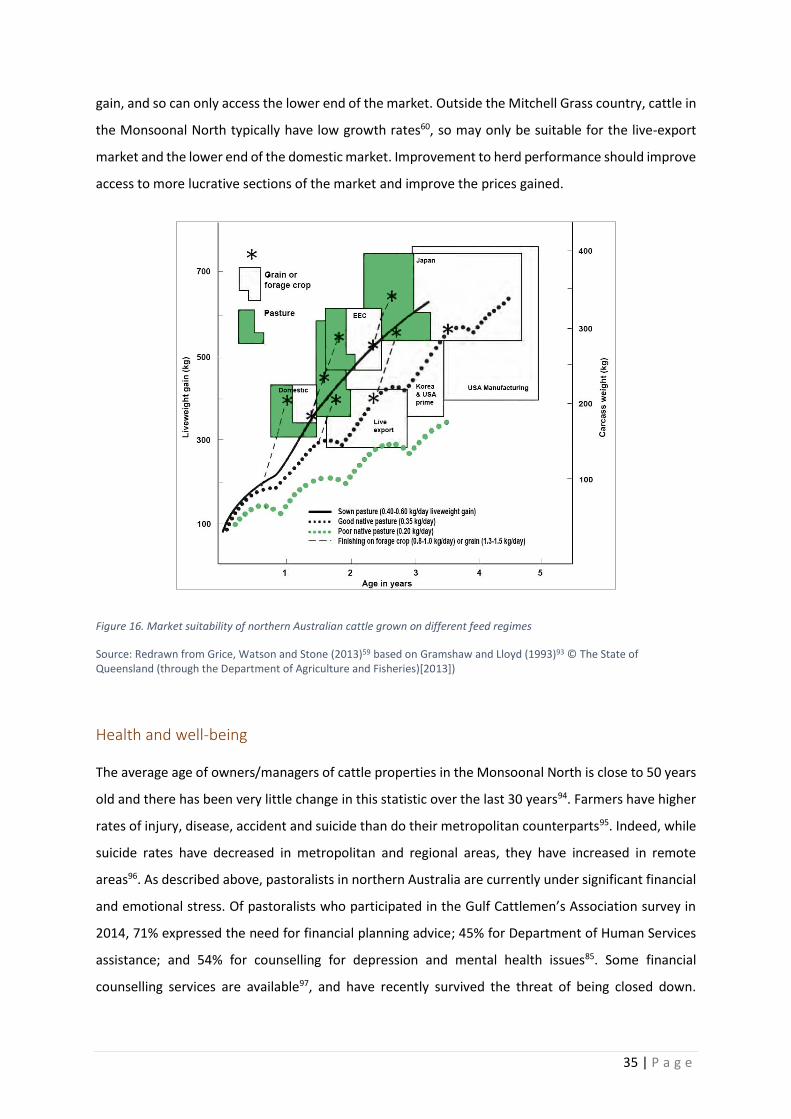
35 | P a g e
gain, and so can only access the lower end of the market. Outside the Mitchell Grass country, cattle in
the Monsoonal North typically have low growth rates60, so may only be suitable for the live-export
market and the lower end of the domestic market. Improvement to herd performance should improve
access to more lucrative sections of the market and improve the prices gained.
Figure 16. Market suitability of northern Australian cattle grown on different feed regimes
Source: Redrawn from Grice, Watson and Stone (2013)59 based on Gramshaw and Lloyd (1993)93 © The State of Queensland (through the Department of Agriculture and Fisheries)[2013])
Health and well-being
The average age of owners/managers of cattle properties in the Monsoonal North is close to 50 years
old and there has been very little change in this statistic over the last 30 years94. Farmers have higher
rates of injury, disease, accident and suicide than do their metropolitan counterparts95. Indeed, while
suicide rates have decreased in metropolitan and regional areas, they have increased in remote
areas96. As described above, pastoralists in northern Australia are currently under significant financial
and emotional stress. Of pastoralists who participated in the Gulf Cattlemen’s Association survey in
2014, 71% expressed the need for financial planning advice; 45% for Department of Human Services
assistance; and 54% for counselling for depression and mental health issues85. Some financial
counselling services are available97, and have recently survived the threat of being closed down.

36 | P a g e
However, many pastoralists feel shamed by the failure of their businesses and are afraid to ask for
assistancea.
Farming is a stressful occupation that often involves financial insecurity and isolation, both of which
are exacerbated by extreme climatic events, such as drought98. Dealing with mining proposals (and
the likely impact on the financial viability of the property) also adds to stress experienced by
pastoralists (see Mining). The worst outcome of this stress can be suicide. In Queensland, agricultural
workers have one of the highest suicide rates of any occupational grouping99. Suicides of males in rural
Queensland are most frequent within 12 months of a work- or income-related stress (such as a
business failure or income reduction), when a mental health illness has been diagnosed, or when
moral support from family and friends is lacking100. While statistical evidence for drought or natural
disasters causing an increase in suicide rates is lacking96, pastoralists report drought as causing
significant financial and emotional stresses (Table 10). The financial difficulties facing the pastoral
industry described above (see Profitability), and the need to make substantial changes to their
businesses (which are likely to be beyond their financial capacity) just to stay afloat, are additional
stresses that are likely to see increasing number of pastoralists needing support for mental health
issues.
Table 10. Flow-on-impacts of drought on pastoral families
Source: Paton (2014)82
Financial issues
Financial difficulties, possibly leading to poverty and/or bankruptcy
Postponing capital expenditure, sometimes with consequences for farm safety
Drawing down superannuation Succession issues
Delayed retirement
Inability to keep farm in the family Employment issues
Increased dependence on off-farm income and employment, which may be difficult to attain
Women and children taking on additional on-farm work Social issues
Increased stress and other negative health impacts from financial pressures and seeing stock suffer
Forced separation, as one partner moves to take up employment elsewhere
Intergenerational or marital conflict
Social isolation, especially where animals need daily feeding and watering
Difficulty in affording education for children
a http://www.abc.net.au/news/5969748

37 | P a g e
Supply and demand
This section describes the growing global demand for beef, changes in consumer preferences related
to health and environmental concerns, and the influence of production by other global beef exporters
on demand for Australian beef.
Domestic and global demand
Australia’s total meat consumption has increased since 1980, with greatest increase in chicken and
pork (Figure 17a). Beef consumption has plateaued and lamb and mutton declined. Per capita meat
consumption has decreased (Figure 17b), with lamb, mutton and beef consumption declining and
chicken and pork consumption growing. Weekly red meat consumption in 2014 was 0.97 kg and beef
consumption was 414 g per week101. These figures indicate that domestic demand for beef has not
increased significantly in at least 35 years despite the population growing by 60% over the same
period102. The fall in per capita beef consumption is expected to continue, with no increase in total
domestic consumption. Therefore, growth in the industry will be dependent on international demand.
Figure 17. Australian meat consumption: (a) total and (b) per capita
Source: Data from Organisation for Economic Co-operation and Development (2015)101
Global consumption of beef has increased with population growth and economic development.
Worldwide, beef consumption increased 40% in the last 40 years (Figure 18). Growth and economic

38 | P a g e
development has been greatest in Asia, with both beef production and beef consumption increasing
nine-fold since 1975.
Figure 18. Global and Asian beef production and consumption
Source of data: United States Department of Agriculture (2015)39
Global demand for beef is expected to continue to grow. By 2050, an annual population growth of
0.8%, combined with a 2.7% growth in real world income, is expected to result in a 70% increase in
food demand and a 300% increase in beef consumptiona,55. Food consumption is expected to double
in Asia over the same period, with the value of food imports increasing five-fold55. Beef imports into
Asia are expected to increase astronomically, with most of the demand coming from China (Figure
19). These projections were made before China relaxed its population policy to allow all couples to
have two children instead of one. This change is likely to accelerate growth in the demand for
Australian beefb.
Figure 19. Projected increase in Asian beef imports
Source: Adapted from Linehan, Thorpe, Andrews, Kim and Beaini (2012)55
a Using 2007 as a base level b http://www.smh.com.au/business/the-economy/will-chinas-twochild-policy-affect-australias-economy-20151030-gkmtxt.html

39 | P a g e
While growth in demand appears assured in the long-term, short-term changes in demand are more
difficult to predict. In early 2014, a levelling of live exports to Indonesia was projected, along with
year-on-year doubling of live exports to Vietnam, steady growth in demand from China, further
decline in exports to Malaysia and the Philippines103. In February 2015, came the realisation that
reduced availability of cattle for sale will limit growth in all these markets, and possibly a decline in
exports to Indonesia49.
Competing producers
Global beef production has increased in response to demand, and overtook consumption in 2003 (see
Figure 18 in previous section). Australia was the world’s top beef exporter between 1960 and 2003
(Figure 20). Brazil exceeded Australia’s export of beef in most years since 2004 and India since 2012.
These nations, along with Argentina, are strong competitors in the south-east Asian market, although
disease concerns prevent them supplying some of Australia’s other important export markets, such as
the United States (see below). United States, Canada and New Zealand are also considered key
competitors to Australia. Production in these countries drives price and has the potential to limit
Australian access to markets37.
Figure 20. Beef exports by the current five highest ranking exporter nations
Source of data: United States Department of Agriculture (2015)39
40 | P a g e
International trade
Historically, trade in beef, along with most agricultural products has been subject to protectionist
barriers, including subsidies, quotas and tariffs, or prohibited altogether104. Subsidies are provided by
governments of exporting countries, so that beef can be sold at a lower price and have a competitive
advantage. Quotas and bans restrict market access. Tariffs increase the cost of beef in the importing
country and are often imposed to protect local production or to give preferential treatment to
preferred trading partners. The Australian Government has a free-trade policy, as it believes Australian
agriculture has a natural competitive advantage and is disadvantaged by protectionism105.
Since the 1970s, Australia has, therefore, increasingly moved to a “level playing field” approach to
agriculture in which the price of goods exported reflects cost of production. Assistance to Australian
agriculture through statutory marketing arrangements, tariffs, adjustment assistance, research and
development support, drought relief and tax concessions were reduced in real terms from around
25% in 1970-71 to less than 5% in 2003-04106. Removal of these subsidies disadvantaged Australian
producers competing with countries where high subsidies remain in place. In 1986, continuation of
subsidies to Australia’s agricultural competitors was estimated to cost Australian farmers $30,000 per
farm107. To offset trade disadvantages, Australia first pursued global trade agreements, and then after
these failed to bear fruit, preferential bilateral and multilateral trade agreements (Table 11)108. While
these agreements have not been beyond criticism, they have resulted in the opening of new markets
and reduction of barriers to the export of Australian beef. Australia now has trade agreements with
most of its major trading partners, including the growing Chinese and Korean markets.
Australian beef will be most attractive to overseas markets when both the Australian sale price and
the exchange rate are low relative to those of other beef-exporting countries45. Australian beef
became less competitive through the early 2000s as the exchange rate and domestic price increased37.
As a result, India and Brazil increased their share of the south-east Asian beef market at Australia’s
expense45. Depreciation of the Australian dollar in 2014 and continued weakening through 2015
reduced the price of Australian beef overseas, once again favouring Australian exports49,53. Domestic
prices at the end of 2015 were nearly twice what they were at the start of 201353 and the price of
export meat increased by 30% after adjusting to US dollars (Figure 21). While this made Australian
beef less competitive against beef from southern America, it remains cheaper than beef from either
the United States or Canada.

41 | P a g e
Table 11. Timeline of recent significant events affecting northern beef exports
Date Event Source 1970- Progressive withdrawal of subsidies to Australian agriculture 106
1983 Australian dollar floated 109
1987 Australia first exports live and slaughter cattle to the Philippines 37
1990 Australia’s first live export to Indonesia 37
1998–9 Asian financial crisis 37
Live export to Philippines peaked 37
2000- High exchange rate reduced competitiveness of Australian beef 37
2000-5 Australian beef exports to Philippines fell 37
2003 Singapore-Australia Free Trade Agreement came into force 110
All tariffs for Australian imports into Singapore eliminated
2005 Thailand-Australia Free Trade Agreement came into force
Thailand reduced the tariff on Australian beef imports from 51% to 40% (to 0% by 2020)
110
2005 Australia-United States Free Trade Agreement revised
US to increase Australian beef imports to 70,000 tonnes by 2021, with free access from 2023
Immediate elimination of in-quota tariffs for beef imports into USA, and phasing out of over-quota duties between years 2012 and 2021
110
2010 Indonesia imposed weight limits and quotas on live cattle imports, aiming to achieve beef self-sufficiency by 2014
37,111
2011 Australia suspended export of live cattle to Indonesia in Jun 2011, mandating the Exporter Supply Chain Assurance System
48
Australia lifted ban on export of live cattle to Indonesia in Jul 2011, but Indonesia delayed issuing import permits till August
37,48
Live export trade to Indonesia resumed in Aug 2011 37,48
2012 Indonesia imposed further export restrictions on Australian live cattle imports
2013 Malaysia-Australia Free Trade Agreement comes into force
Tariff-free treatment for the vast majority of Australian agricultural products imported into Malaysia
110
2014 Korea-Australia Free Trade Agreement came into force
Progressive elimination of 40% tariff on Australian beef imports into Korea by 2028
110
2014 Agreement Establishing the ASEAN-Australia-New Zealand Free Trade Area – First protocol signed
Elimination of agricultural export subsidies for trade between partner countries
110
2014 China-Australia Free Trade Agreement negotiations concluded
Elimination of tariffs on Australia beef over nine years
110
2014 Depreciation of Australian dollar increased competitiveness of Australian produce 49
2015 Japan-Australia Economic Partnership Agreement comes into force
Tariff on frozen beef reduced from 38.5% to 30.5%, dropping to 19.5% by 2033
Tariff on fresh beef reduced from 38.5% to 32.5%, dropping to 23.5% by 2030
Replacement of “global snapback” to 50% tariff in the event of escalating imports, to discretionary tariff rise to 38.5% if the import volume exceeds Australia-specific triggers within a given year (14.5% above 2013 exports for frozen beef and 12% above 2013 exports for fresh beef), rising each year for ten years before being reviewed
110
Trans Pacific Partnership agreement signed in Oct 2015, but yet to be ratified
Japanese beef tariffs to be reduced to 9% within 15 years
United States price-based safeguard under the Australia-United States Free Trade Agreement to be eliminated
Canadian, Peruvian and Mexican beef tariffs to eliminated within 10 years
110

42 | P a g e
Figure 21. Comparative global beef prices 2005-2015 ($US/kg liveweight)
Source of data: MLA Statistical database112
Reproduced courtesy of Meat & Livestock Australia Limited - www.mla.com.au112
Recent dependence of the northern beef industry on the Indonesian market made it highly
vulnerablea. Financial hardship and environmental degradation followed when this market was
suspended for two months in 2011 in the peak export season. The fall-out of this was economically
disastrous for many northern producers (see Profitability). Maintaining good relations with the
Indonesian Government was then seen as essential to providing economic certainty for the northern
beef industry37. Subsequently, the industry has benefited from access to an increased range of export
destinations and northern meat processing facilities. Current expansion into Vietnamese and Chinese
a http://www.abc.net.au/news/6348020

43 | P a g e
markets for both live cattle and packed meat should improve resilience in the northern beef industrya,
and, along with Indonesian market restrictions, have contributed to increased beef pricesb.
Therefore, while global demand, favourable exchange rates and trade agreements that recognise
Australia’s disease free status drive beef production in northern Australia, they may be offset by
increased production by competitors and anti-competitive behaviour, such as trade restrictions
imposed by importing nations and trade subsidies by exporting countries.
Market requirements
Some markets demand beef meet specific requirements (Table 12). Demand by premium markets for
heavy, quickly-grown cattle has already been discussed (Figure 16). For access to the most lucrative
markets, animals must reach 300 kg in twelve months and 500 kg within two years (Figure 22). These
growth rates are hard to achieve in northern Australia. Animals sold to the Indonesian live-export
market must be under 350 kg37, with no age restriction. This forced heavier cattle back on to the
Australian market from 2010, making them harder to sellc. Also, selling cattle under 350 kg in weight
may not be financially viable in the long termd.
Table 12. Requirements for beef to access quality markets
Source: Meat and Livestock Australia (2015)113 Reproduced courtesy of Meat & Livestock Australia Limited - www.mla.com.au
Characteristic Japanese market European market Meat Standards
Australia HSCW (kg) 300–420 320–420 160–220
Dentition (adult teeth) 0–6 0–4 0
P8 fat depth (mm) 7–22 6–22 3–10
Butt/muscle shape score A–C A–C A–C
Bruising Nil Nil –
Sex Steer and female Steer and female Steer and female
Ossification score – – < 180
Marbling score – – > 0.5
Fat colour score 0–3 0–3 0
Meat colour grade – 1b–3 1a–2
Eye muscle area (cm2) – > 85 70
Ultimate muscle pH – – < 5.71
Loin temperature (°C) – – < 9
Retail meat yield (%) – – 70
Hormone growth promotants – Free Yes
Acceptable compliance (%) - 90 85
a http://www.abc.net.au/news/6636880 b http://www.abc.net.au/news/6273314 c http://www.abc.net.au/site-archive/rural/news/content/201008/s2978525.htm d http://www.abc.net.au/news/6339788
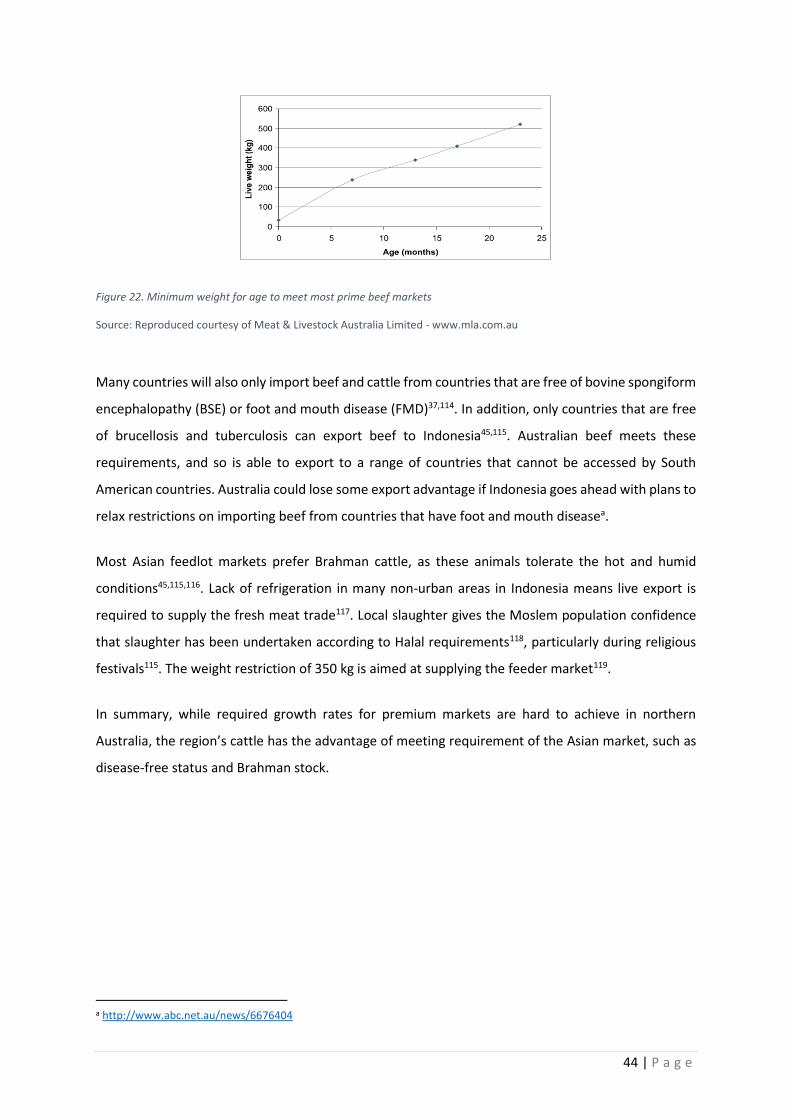
44 | P a g e
Figure 22. Minimum weight for age to meet most prime beef markets
Source: Reproduced courtesy of Meat & Livestock Australia Limited - www.mla.com.au
Many countries will also only import beef and cattle from countries that are free of bovine spongiform
encephalopathy (BSE) or foot and mouth disease (FMD)37,114. In addition, only countries that are free
of brucellosis and tuberculosis can export beef to Indonesia45,115. Australian beef meets these
requirements, and so is able to export to a range of countries that cannot be accessed by South
American countries. Australia could lose some export advantage if Indonesia goes ahead with plans to
relax restrictions on importing beef from countries that have foot and mouth diseasea.
Most Asian feedlot markets prefer Brahman cattle, as these animals tolerate the hot and humid
conditions45,115,116. Lack of refrigeration in many non-urban areas in Indonesia means live export is
required to supply the fresh meat trade117. Local slaughter gives the Moslem population confidence
that slaughter has been undertaken according to Halal requirements118, particularly during religious
festivals115. The weight restriction of 350 kg is aimed at supplying the feeder market119.
In summary, while required growth rates for premium markets are hard to achieve in northern
Australia, the region’s cattle has the advantage of meeting requirement of the Asian market, such as
disease-free status and Brahman stock.
a http://www.abc.net.au/news/6676404

45 | P a g e
Consumer preferences and concerns
Australian dietary patterns are changing, with a shift from a protein intake dominated by beef and
lamb to one dominated by chicken and pork120 (Figure 17). This shift can be largely explained by
changes in relative prices and expenditure120,121. Advertising by Meat and Livestock Australia has been
successful at increasing beef consumption in the short term122, but the trend continues.
Consumer demand for beef is also affected by ethical, health and environmental concerns. Consumers
are increasingly concerned about the ethics of the red meat production and transport. Preventing
animal cruelty was the most frequently stated reasons for choosing to become vegetarian (64% of 843
respondents to an online survey)123. Concerns over animal welfare closed down the Australian live-
export trade in 2011.
The second most cited reason was health concerns (46%)123. Health concerns are likely to have a
negative impact on demand for beef. A review sponsored by Meat and Livestock Australia published
in May 2015, concluded that red meat consumption was associated with an increased risk of colorectal
cancer of 11%a based on 27 independent studies124. When processed meat was excluded, leaving 17
studies, the increased risk was reduced to 5%b. When intake rates were analysed separately,
consumption of less than 100 g per day was found to have no identifiable cancer riskc; but an average
consumption of 100 g per day was associated with 20% risk increased. It is not clear if this last
assessment included processed meats as well as unprocessed red meat.
Publication of this review was followed in October 2015 by a much publicised assessment by the World
Health Organization’s International Agency for Research on Cancer (IARC), which came to much the
same conclusion125. It reported on an analysis of 10 studies of red meat consumption (excluding
processed meat)126, which found that colorectal cancer risk increased by 17%e with a daily
consumption of 100 g per day. The same analysis also found consumption of processed meat further
increased this risk: daily processed meat consumption of only 50 g per day was associated with an
increased risk of 18%f.
a with 95% confidence that the actual increase was between 3 to 19%, which is expressed as: All meat consumption: 1.11, 95% CI: 1.03–1.19, 27 studies b Red meat consumption (separated from processed meat): 1.05, 95% CI: 1.02-1.12, 17 studies c Red meat consumption >40 g/day: (1.02, 95% CI: 0.98–1.07, 9 studies); 40-70 g/day (1.00, 95% CI: 0.96–1.04, 12 studies); 70-100 g/day (1.03, 95% CI: 0.89–1.18, 8 studies) d >100 g/day (1.20, 95% CI: 1.11–1.29, 6 studies) e Red meat alone consumption of >100 g/day (1.17, 95% CI: 1.05–1.31, 10 studies) f Processed meat consumption of >50 g/day (1.18, 95% CI: 1.10–1.28, 10 studies)
46 | P a g e
What is interesting is not the differences in the findings—which are not great—but the differences in
the way they were reported. The first study does not appear to have been reported at all in the
mainstream media following its release, but was interpreted in the blogosphere as acquitting red meat
of causing cancera. The second study was released with much hoorah, when an online search revealed
3,200 news articles within 48 hours of the paper’s releaseb. Most articles reported the findings as
indicating red meat intake was carcinogenic, and a few quoted vociferous refutations of this claim.
Meat and Livestock Australia released a statement reaffirming their recommendations of a weekly
intake of 455 g of red meat127, which is well within the no-significant-impact level, and consistent with
Australian Dietary Guidelines128. Estimated average weekly Australian red meat consumption based
on carcass sales of 971 g101 is twice recommended in these guidelines. Self-reporting of meat
consumption levels are considerably lower; 685 g for men and 445 g for women, but are considered
to be under-estimates129. Both sets of figures indicate that average red meat consumption exceeds
Australian Dietary Guidelines, so that increased efforts to meet these guidelines could mean a
substantial reduction in domestic meat consumption.
Consumers are also increasingly concerned about the sustainability of the red meat production.
However, Australians have little awareness of the impact of meat production on the environment, and
it barely influences their dietary choices130. Only 12% of vegetarians surveyed cited environmental
reasons for their dietary choice123. Nevertheless, demand for ecologically-produced food is growing
domestically131, as well as in China and India132,133. The perception that Australian beef is sustainably
produced may have given it a market advantage in the past, but consumers increasingly expect such
claims to be backed up by certification134. Meat branded as sustainably-produced does have a
domestic market advantage131, but complex supply chain arrangements make it hard to trace product
from paddock to plate135.
Industry challenges
Constraints identified as affecting profitability of the northern cattle industry include lack of property
infrastructure; land use regulation and lease conditions; lack of processing facilities; transport costs
and access to skilled labour37,52,60,78,83,92,136,137. These challenges are examined in detail below, along
with efforts to overcome them.
a http://suppversity.blogspot.com.au/2015/05/fresh-red-meat-acquitted.html b http://news.google.com/

47 | P a g e
Supply chain
Cattle from the Monsoonal North are either sold into the domestic or international market, but rarely
does the producer have direct contact with the buyer at the end of the supply chain (Figure 23). If
cattle are not finished on the property or sold to another grazing enterprise, they will need to be
transported to a saleyard, port or feedlot. Lack of such facilities across much of the north raises freight
costs and reduces market access options138. As described earlier, although some cattle are fattened
and finished on limited areas of fertile native pastures or introduced pastures in the area, most cattle
fattening occurs outside the region (see Cattle enterprises), and so must be transported long
distances.
Figure 23. Australian beef supply chain
Source: Jie, Parton and Cox (2007)139
Spelling at yards is required if cattle are transported more than a certain distance or to allow for tick
inspection when a load of cattle crosses from a tick zone to a tick-free zone. Other than for tick clearing
stations in Queensland140, information on the location of spelling yards is difficult to obtain. However,
it has been estimated that an additional 17 to 32 spelling yards are required in Western Australia and
the Northern Territory to facilitate cattle movement between cattle properties and abattoirs in Darwin
and Broome141.
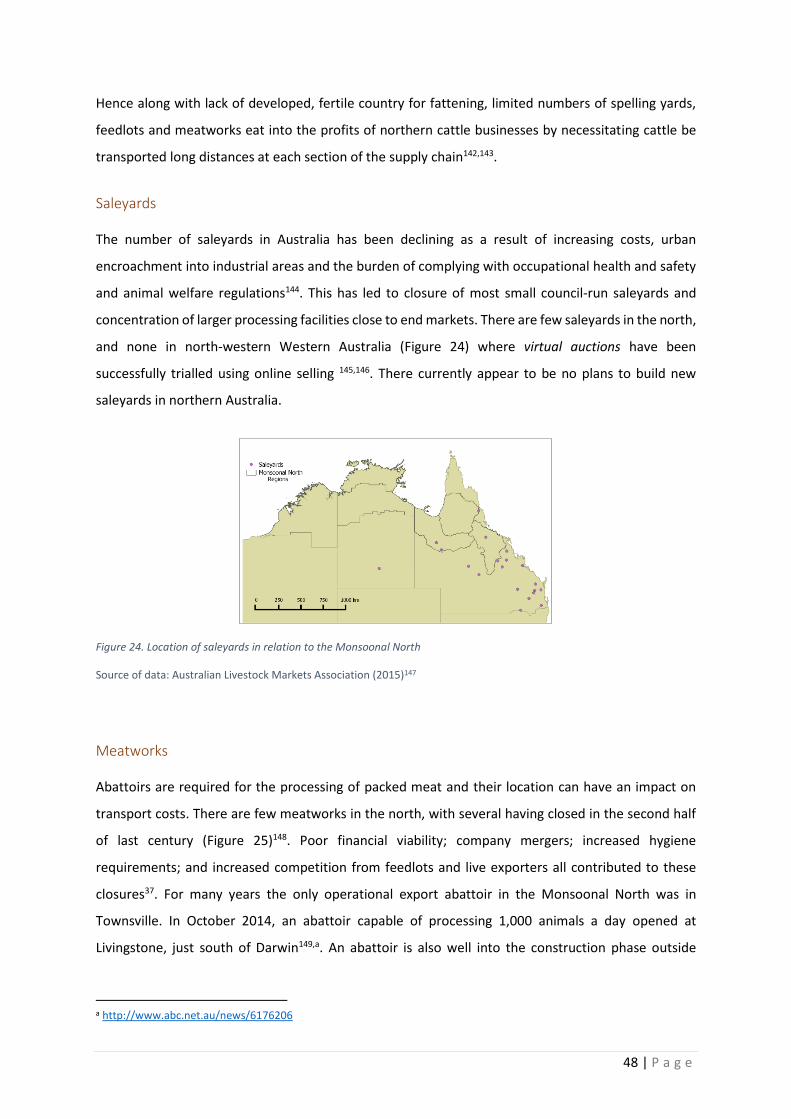
48 | P a g e
Hence along with lack of developed, fertile country for fattening, limited numbers of spelling yards,
feedlots and meatworks eat into the profits of northern cattle businesses by necessitating cattle be
transported long distances at each section of the supply chain142,143.
Saleyards
The number of saleyards in Australia has been declining as a result of increasing costs, urban
encroachment into industrial areas and the burden of complying with occupational health and safety
and animal welfare regulations144. This has led to closure of most small council-run saleyards and
concentration of larger processing facilities close to end markets. There are few saleyards in the north,
and none in north-western Western Australia (Figure 24) where virtual auctions have been
successfully trialled using online selling 145,146. There currently appear to be no plans to build new
saleyards in northern Australia.
Figure 24. Location of saleyards in relation to the Monsoonal North
Source of data: Australian Livestock Markets Association (2015)147
Meatworks
Abattoirs are required for the processing of packed meat and their location can have an impact on
transport costs. There are few meatworks in the north, with several having closed in the second half
of last century (Figure 25)148. Poor financial viability; company mergers; increased hygiene
requirements; and increased competition from feedlots and live exporters all contributed to these
closures37. For many years the only operational export abattoir in the Monsoonal North was in
Townsville. In October 2014, an abattoir capable of processing 1,000 animals a day opened at
Livingstone, just south of Darwin149,a. An abattoir is also well into the construction phase outside
a http://www.abc.net.au/news/6176206

49 | P a g e
Broomea. A few small-scale meatworks also operate across the north , and mainly service Indigenous
communities as well domestic specialty meat markets66.
There has been much discussion about the need for additional meatworks in northern Australia. The
proposed location at Cloncurry, on the tick line, makes it the most economically viable place to
construct an abattoir in north-western Queensland, as this would allow cattle to be transported to it
from any direction without incurring tick inspection costs142. An additional meatworks has also been
proposed south of Townsvilleb and there have been calls for one to be built at Emeraldc. As additional
meatworks come on stream, transport costs to producers should be significantly reduced143.
Figure 25. Location of meatworks in relation to the Monsoonal North
Source: Locations from Bloomfield (2015)150 and McClelland Rural Services Pty Ltd (2014)66
Lack of competition in the meatworks sector is probably disadvantaging beef producersd. A senate
inquiry was conducted into the Effect of market consolidation on the red meat processing sector151.
The terms of reference included:
Any misuse of market power through buyer collusion and impact on producers
Impact of consolidation on market competition, regional monopolies and farm gate prices
Existing selling structures and processes at saleyards, and current relevance
Regulatory environment covering livestock, livestock agents, buyers and meat processors.
a http://www.abc.net.au/news/6324912 b http://www.abc.net.au/news/5877062 c http://www.abc.net.au/news/6035246 d http://www.abc.net.au/news/6313956

50 | P a g e
The report for this inquiry is yet to be released.
Freight
As noted above, most cattle raised in the Monsoonal North need to be transported large distances143.
They are generally transported by road through a dispersed road network using local or regional
carriers; very few are transported by rail144. Half the cattle produced in the Northern Territory are
transported over 1,000 km to processing or export facilities with the transport cost exceeding
A$150/head143 and distances of more than 2,500 km may be required for transport to southern
markets141. Most cattle raised in north-western Queensland are transported between 500 and 1,000
km142. Freight costs are, therefore, a significant component of input costs, being approximately 7% of
the total costs of northern cattle operations52 and accounting for up to 35% of the market price143.
As well as distance to processing facilities, freight costs and logistics are influenced by the condition
of road networks; availability of holding paddocks on freight routes; and the necessity to interrupt
transport for tick inspection138,142,143,152. Prohibition of road trains on some Queensland roads
necessitate diversions to longer routes or the separation of loads143. Seasonal road closures also
interrupt supply and, where diversions are possible, increase transport costs143. In order to maintain
market share in the wet season, the meatworks at Gunbalanya has resorted to flying up to three
tonnes of meat a week to Jabiru, from whence it can be transported to Darwin by roada. This increases
the cost of production by about $0.50 per kilogram of meat, but maintains faith with regular
customers. An improved road network would reduce costs, but this is impeded by responsibility for
the road network being spread amongst about 700 local, state and territory road agencies144.
The Australia Government’s White Paper on developing northern Australia committed $100 million to
improving beef roads in the region and $600 million to strategic road projects 153. A Northern Australia
Beef Roads Programme roundtable was held in Rockhampton in October 2015 to discuss the best
allocation of this fundingb. Most of the issues raised at this meeting concerned upgrades needed to
roads outside the Monsoonal Northc. Further roundtable meetings will be held in Western Australia
and the Northern Territory154. The promised $100 million would cover the cost of sealing between 220
a http://www.abc.net.au/news/6025382 b http://www.abc.net.au/news/6822820 c Access through Rockhampton to abattoirs; access to the Roma saleyards; Clermont to Roma road; Peninsula Development Rd.

51 | P a g e
and 454 km of dirt highways (based on estimates of the cost of upgrading the Outback Way in Western
Australia)a or of a single bypass155.
Linking northern Australia to the national rail network should also assist in reducing freight costs. The
Northern Territory and Australian Governments have commissioned feasibility studies into a Mount
Isa to Tennant Creek rail linkb and a Katherine to Kununurra rail linkc.
The opening of the Livingstone abattoir outside Darwin reduced transport distances and costs for
many pastoralists in the Northern Territory, increasing earnings before interest and tax by $14.56 per
head156. The abattoir also addressed poor wet season access by trucking in cattle in the dry season to
nearby stations that have access to all-weather roadsd. Completion of the Broome abattoir and
construction of other proposed abattoirs in the north should further reduce transport costs to the
industry.
Additional costs are incurred when cattle are transported between the tick-free and tick-affected
areas. Tick inspection stops are estimated to constitute about 19% to the cost of transporting cattle
on the route between Clermont and Roma143. The economic benefit to producers of building an
abattoir at Cloncurry was, therefore, estimated at $41.10 per head of cattle, $2.55 better than of
building one at nearby Mount Isa, which is several kilometres inside the tick-free zone. Another option
for reducing costs that has been suggested is to waive compulsory tick inspection of cattle crossing
the tick line when they are being transported directly to an abattoir143.
Ports
The majority of cattle exported from Australia are sent through northern ports45, particularly when
they are destined for Asian markets. Numbers have fluctuated from year to year, depending on market
demand (Figure 26). To enable export of cattle, ports must have yarding facilities144. Despite having
such facilities, ports at Weipa, Mourilyan and Mackay have not exported cattle for several years. Based
on their maximum throughput, the eight ports between Port Hedland and Mackay have the capacity
to export just over one million cattle. This maximum was nearly reached in 2014, when 940,000 head
were exported. However, unlike in 2009, when all ports were operating and all parts of the region
were able to supply the live export market, export was restricted to five ports, dominated by Darwin
(Figure 27). Recent lease of the Port of Darwin to Chinese interests has been welcomed by the
a http://www.abc.net.au/news/5735650 b http://www.abc.net.au/news/6424552; http://www.abc.net.au/news/6603782 c http://www.abc.net.au/news/6893958 d http://www.abc.net.au/5528780

52 | P a g e
industry, as this should ensure the live-export facilities are maintaineda. However, as beef producers
and exporters have access to a limited number of ports, there is the potential for lack of competition
to lead to price manipulation.
Figure 26. Number of cattle exported from Australian ports from 2002 to 2014
Source of data: Norris and Norman (2003, 2004, 2005, 2006, 2007, 2008, 2009, 2010, 2011, 2012, 2013)157-167, MLA (2014)168
a http://www.abc.net.au/6851430

53 | P a g e
Figure 27. Relative importance of cattle export ports and destinations from 2002 to 2012
Source of data: Norris and Norman (2003, 2004, 2005, 2006, 2007, 2008, 2009, 2010, 2011, 2012, 2013)157-167
Resources
Water
Livestock and pastoral operations require water. Beef cattle in northern Australia require between 43
and 66 litres per head per day, with lowest requirements in the coolest part of the year and greatest
requirements in the late dry season, when it is both hot and dry (Figure 28). Water used by cattle must
also meet certain water quality conditions169. Poor drinking water quality and diets with high mineral
concentrations will increase water needs170. Most cattle grazing occurs within 3-4 km of water, so a
distance between water points of about 5.6 km is recommended for effective use of grazing lands171.
To increase the area that can be grazed, many properties across the Monsoonal North are, therefore,
installing new water points (see Paddocks and water points). Water is also needed to irrigate pasture
crops to provide feed needed to finish cattle on property and sell them at profitable prices (see Forage
crops). It is considered that most properties across the Monsoonal North have access to enough water
to support small-scale irrigation of this kind59.

54 | P a g e
Figure 28. Water requirements of beef cattle at Wyndham in relation to climatic conditions
Source of data: Water requirement calculations based on Luke (1987)170; Climatic data: Australian Bureau of Meteorology (2015)2
Water for cattle operations can come from natural surface or groundwater storage, or artificial tanks
and dams capturing overland flow, stream flow or groundwater. The extraction, storage and use of
water is regulated through a complex systems of laws (see Legal and regulatory environment).
The Monsoonal North’s highly seasonal rainfall means that most streams are also highly seasonal, with
about 90% of flow occurring between December and March18,19. High flow rates followed by rapid
drainage and high evaporative losses make water capture and storage difficult in the region172.
Streams with a steady wet season flow contract to isolated waterholes (Figure 29). Farm dams may
be breached during the rainy season, and go dry before the end of the dry season when water
requirements are at their highest. Water shortage is exacerbated in periods of prolonged drought.
Even without any significant change in rainfall, projected increases in temperature and evaporation
rates1 will increase the period stock are exposed to heat stress and reduce the distances they can
travel to water173.

55 | P a g e
Figure 29. Progressive drying of a section of the Cloncurry River
Source: McJannet, Marvanek, Henderson, Petheram and Jim (2013)174
Groundwater is also responsive to rainfall175. The water table is generally highest at the end of the wet
season. For example, water level in the Howard River catchment in the Northern Territory fluctuates
annually from 0-1 m below ground level at the end of the wet season to 12-15 m below ground level
at the close of the dry176. Year to year variation in rainfall is also important. Braithwaite and Muller177
found that 80% of the variation in groundwater level in the Top End of the Northern Territory could
be explained by rainfall over the previous eight years. Levels peaked at the end of the 1970s after
nearly a decade of wet years. Long periods of low rainfall can impact on the vegetation, and even
cause tree death178. Some basins are highly responsive to rainfall and refill each year and can sustain
regular water extraction. The Great Artesian Basin, which extends into the Southern Gulf region and
holds vast stores of fossil water, recharges very slowly and thus takes a long time to recover from
water extraction179.
Water tables on pastoral properties may be lowered by extraction by other users175. Extraction can
affect both the depth to the groundwater (so the effectiveness of bores) and the discharge of water
into surface streams. Lowering of water tables is especially significant for pastoral operations when it
reduces the period of stream flow through the dry season. Water extraction can also increase levels
of soluble salts in the groundwater. Therefore, both mining and agricultural expansion have potential
to adversely impact the availability and quality of water for stock, with mining being a particular
concern in the Desert Uplands region of Queensland (see Mining).
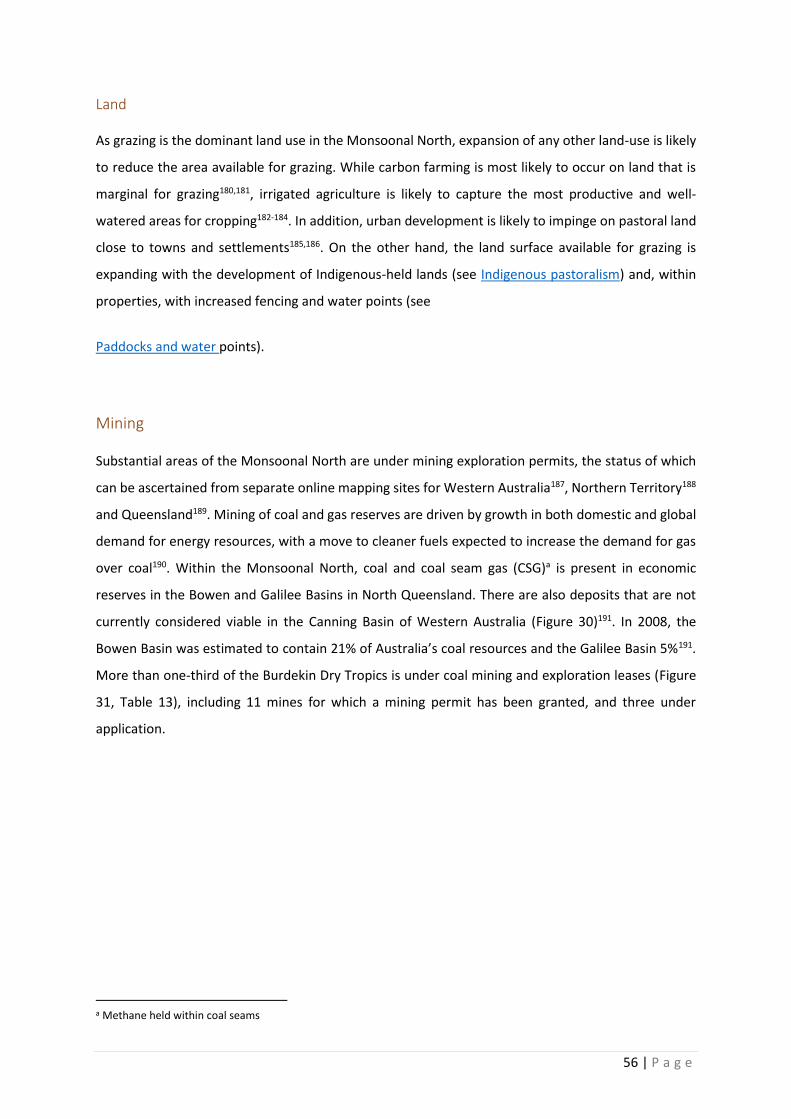
56 | P a g e
Land
As grazing is the dominant land use in the Monsoonal North, expansion of any other land-use is likely
to reduce the area available for grazing. While carbon farming is most likely to occur on land that is
marginal for grazing180,181, irrigated agriculture is likely to capture the most productive and well-
watered areas for cropping182-184. In addition, urban development is likely to impinge on pastoral land
close to towns and settlements185,186. On the other hand, the land surface available for grazing is
expanding with the development of Indigenous-held lands (see Indigenous pastoralism) and, within
properties, with increased fencing and water points (see
Paddocks and water points).
Mining
Substantial areas of the Monsoonal North are under mining exploration permits, the status of which
can be ascertained from separate online mapping sites for Western Australia187, Northern Territory188
and Queensland189. Mining of coal and gas reserves are driven by growth in both domestic and global
demand for energy resources, with a move to cleaner fuels expected to increase the demand for gas
over coal190. Within the Monsoonal North, coal and coal seam gas (CSG)a is present in economic
reserves in the Bowen and Galilee Basins in North Queensland. There are also deposits that are not
currently considered viable in the Canning Basin of Western Australia (Figure 30)191. In 2008, the
Bowen Basin was estimated to contain 21% of Australia’s coal resources and the Galilee Basin 5%191.
More than one-third of the Burdekin Dry Tropics is under coal mining and exploration leases (Figure
31, Table 13), including 11 mines for which a mining permit has been granted, and three under
application.
a Methane held within coal seams

57 | P a g e
Figure 30. Coal basins and major coal seam gas deposits
Source: Bradshaw, Hall, Copeland and Hitchins (2012)192
Figure 31. Coal mines, exploration permits, nominated areas and proposed infrastructure in the Burdekin Dry Tropic
Source of data: Galilee Basin SDA: Department of State Development (2015)193; Mining tenure details: Department of Natural Resources and Mines (2015)189; Land Tenure: Geoscience Australia (2004)23
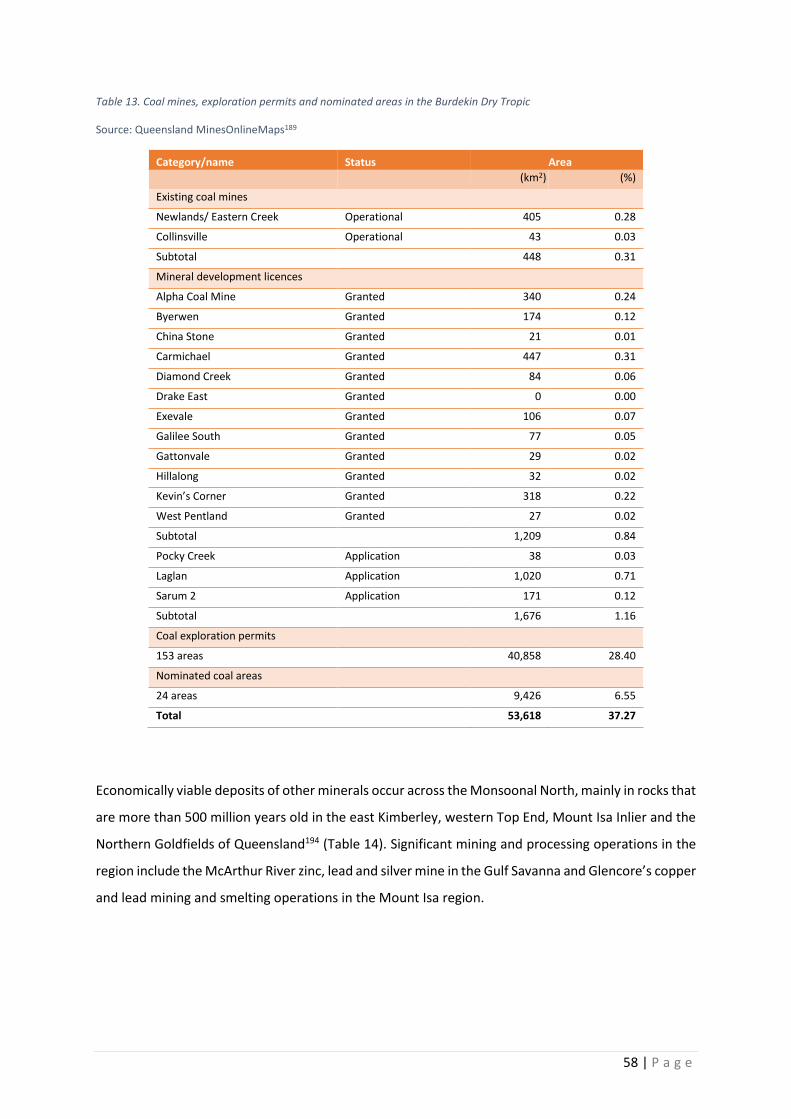
58 | P a g e
Table 13. Coal mines, exploration permits and nominated areas in the Burdekin Dry Tropic
Source: Queensland MinesOnlineMaps189
Category/name Status Area
(km2) (%)
Existing coal mines
Newlands/ Eastern Creek Operational 405 0.28
Collinsville Operational 43 0.03
Subtotal 448 0.31
Mineral development licences
Alpha Coal Mine Granted 340 0.24
Byerwen Granted 174 0.12
China Stone Granted 21 0.01
Carmichael Granted 447 0.31
Diamond Creek Granted 84 0.06
Drake East Granted 0 0.00
Exevale Granted 106 0.07
Galilee South Granted 77 0.05
Gattonvale Granted 29 0.02
Hillalong Granted 32 0.02
Kevin’s Corner Granted 318 0.22
West Pentland Granted 27 0.02
Subtotal 1,209 0.84
Pocky Creek Application 38 0.03
Laglan Application 1,020 0.71
Sarum 2 Application 171 0.12
Subtotal 1,676 1.16
Coal exploration permits
153 areas 40,858 28.40
Nominated coal areas
24 areas 9,426 6.55
Total 53,618 37.27
Economically viable deposits of other minerals occur across the Monsoonal North, mainly in rocks that
are more than 500 million years old in the east Kimberley, western Top End, Mount Isa Inlier and the
Northern Goldfields of Queensland194 (Table 14). Significant mining and processing operations in the
region include the McArthur River zinc, lead and silver mine in the Gulf Savanna and Glencore’s copper
and lead mining and smelting operations in the Mount Isa region.

59 | P a g e
Table 14. Economically viable mineral deposits in the Monsoonal North
Source: Geoscience Australia (2004)194 and Bradshaw et al. (2012)190
Commodity Kimberley Top End Gulf
Savanna Southern
Gulf Northern
Gulf Burdekin
Dry Tropics
Bauxite +
Coal +
Coal seam gas +
Cobalt + +
Copper + + + +
Diamond + +
Gold + + + + + +
Iron + +
Lead + + + + +
Magnesite +
Manganese +
Molybdenum +
Nickel + + +
Niobium +
Phosphate + +
Platinum group elements
+
Rare earths +
Silver + + + +
Tantalum + +
Tin + +
Tungsten
Uranium + + +
Zinc + + + + +
Zirconium +
Environmental impacts
Mining can affect pastoral operations by polluting the land, air and water. Extensive coal mines in the
Galilee Basin will mean loss of grazing land. Graziers in this region are concerned about loss of grazing
land; loss of access; loss of remnant woodlands from open cut coal mining; impact of rail
infrastructure; impact on ground water quality and availability; disturbance to rural lifestyles;
inadequate consultation; and impact of the port development on the Great Barrier Reef195,196,a.
In Mount Isa, contaminants from smelter operations have polluted the atmosphere, soil and water,
contributing to health issues in the community197,198. Lead pollution from the McArthur River has
a http://www.abc.net.au/4966276; http://www.abc.net.au/news/6749244

60 | P a g e
contaminated fisha and appears to be responsible for contamination of 400 cattle that then had to be
destroyedb. Water produced as a by-product of CSG contains elevated sodium, bicarbonate, chloride,
boron and zinc199. Other potential impacts of CSG operations include lowering of water tables, and
hydraulic fracturing (fraccingc) causing ground water contamination, subsurface subsidence and
changes to groundwater flow199,201-203. Other issues with mining include loss of grazing land, unfettered
access rights and disruption of pastoral operations204-206.
Infrastructure impacts
Mine operation is dependent on infrastructure for transporting minerals extracted to processing
facilities or ports. Rail corridors have, therefore, been designated between the proposed mines in the
Galilee Basin and the coal terminal at Abbot Point (Figure 31). These infrastructure corridors impact
pastoral operations by reducing grazing areas and dissecting pastoral propertiesd and can have serious
environmental impacts207 (as can associated ports208,209). The Queensland Government has declared a
Galilee Basin State Development Area (SDA) comprising two multi-use rail corridors to service up to
six mines210 (Figure 31). The compulsory land acquisition corridor intersects approximately 74
landholdings, many being pastoral properties, and land acquisition will be required.
Social impacts
Mining is one of the most contentious issues in sections of the Queensland pastoral industry, and is a
source of conflict elsewhere in the northe, though it was not mentioned as a concern of pastoralists in
the Northern Territory or Western Australia surveys28,30. Queenslanders who own farms have negative
views of the CSG industry than are held by the rest of the community, as well as a more dismal outlook
of what the future holds for them211. In southern Queensland, mental health issues have been
identified amongst landholders coping with coal mining and CSG extraction212. Elsewhere in Australia
repeated mine expansions and contractions or multiple mine developments led to cumulative adverse
impacts on access to affordable accommodation; increases in traffic and fatigue-related road
accidents; increased pressure on services including medical, dental and emergency services; and
increases in criminal and other anti-social behaviour213,214.
a http://www.abc.net.au/news/6724746 b http://www.abc.net.au/news/6716346 c pumping a fluid (water, sand and chemical lubricants) under pressure into the coal seam to fracture the coal and release gas (200) d http://www.abc.net.au/news/5526540 e http://www.abc.net.au/news/6339416

61 | P a g e
Mining also affects community structure, especially where mines are operated by Fly-In, Fly-Out (FIFO)
staff, who are flown in and out on rosters of one or more weeks at a time212. The high wages offered
by the mining industry also makes it difficult for pastoralists to attract and retain capable staff212,213.
Mining can also bring positive benefits to the broader community, especially through infrastructure
development214. Mining built the great towns of Ballarat, Bendigo, Bathurst and Charters Towers,
along with their banks, hotels, hospitals and schools215. Even up until the 1970s, mining companies
built towns such as Greenvale, in Queensland216, and Newman and Goldsworthy, in Western Australia,
and contributed to the development of larger centres, such as Port Hedland217. Hajkowicz et al (2011)
found that as the value of mining production in regional areas increases, so do incomes, housing
affordability, communication access, education and employment218. However, there is an increasing
trend for infrastructure provided for mining towns to be temporary (e.g. portable accommodation)219,
as FIFO workers do not require more permanent services. Even the rail line to the Greenvale Nickel
mine, built in 1974, was dismantled in 1993220. Therefore, the impacts on loss of pastoral land and
livelihood, and the preferential treatment the mining industry receives regarding access to land and
water resources (see Legal and regulatory environment) can far outweigh the few perceived benefits.
Pests and diseases
Weeds
In 2011-12, Northern Territory pastoralists identified weeds as the most significant issue affecting the
environmental sustainability of their properties, with feral animals coming in second at nearly half the
level of concern (Table 8). Woody weeds of concern vary between regions (Table 15), and less is known
about the distribution of non-woody weeds. Parthenium, the non-woody weed with perhaps the
greatest potential, is presently restricted to the eastern seaboard221. While Hyptis (Hyptis suaveolens)
and Sida (Sida acuta) proliferate in over-grazed or sacrifice areas, such around waters and yards, their
impact is less in well maintained pastures222.
62 | P a g e
Table 15. Woody weeds with a significant impact on grazing operations
NB: Numbers show source references
Common name Botanical name Kim
be
rle
y
Top
En
d
Sava
nn
a G
ulf
Qu
ee
nsl
and
Gu
lf
/Mit
che
ll G
rass
No
rth
Qu
ee
nsl
and
Weeds of National Significance
Bellyache Bush Jatropha gossypiifolia 28
223
223-225
223
223,226
Lantana Lantana camara 225
223
223,226
Mesquite Prosopis spp. 223 225
223
Mimosa Mimosa pigra 30,223,22
7
223
Parkinsonia Parkinsonia aculeata 28,223 223,227 30,223,224,228,22
9
223
223,226
Prickly Acacia Vachellia nilotica 30,223 223-225,228 223
223,226
Rubber Vine Cryptostegia grandiflora 223,230 223,226
Other exotic weeds
Chinee Apple Ziziphus mauritiana 223
223-225
223
223,226
Crotalaria Crotalaria spp. 28 30
Devil’s Claw Martynia annua 30
Lion’s Tail Leonotis nepetifola 30
Mimosa Bush Vachellia farnesiana 28
223
223,228 223
223
Rubber Bush Calotropis procera 28
30,227 30,224
Senna/ Sicklepod Senna spp./ Senna obtusifolia 30
Blackwood Acacia argyrodendron 226
Bread Fruit Gardenia vilhelmii 230
Problem native species
Currant Bush Carissa spp. 223
223,231,232 223
223,226
Cooktown Ironwood Erythrophleum chlorostachys 230
Eucalypt regrowth Eucalyptus & Corymbia spp. 223
223
223,228,231-233 223,234 223,226,234,23
5
False Sandalwood Eremophila mitchellii 223
223
Gidgee Acacia cambagei 223
223
Gutta Percha Excoecaria parvifolia 230
Hakea Hakea arborescens 231,233
Lancewood Acacia shirleyi 226
Rosewood Terminalia volucris 231,233
Sandalwood Santalum lanceloatum 226
Tea Tree Melaleuca spp. 230
Wattle Acacia spp. 223
223
223,228,229 223,230 223,226
Whitewood Atalaya hemiglauca 226
Yellowwood Terminalia spp. 230
226
Weeds reduce pastoral production by reducing pasture quality and extent, with some woody weeds
promoting erosion by reducing ground cover 236. They can also increase mustering costs. Some weeds
are poisonous to stock, so can cause stock losses. In 2004, weed invasions were estimated to reduce
the value of Australian beef production by just over $1,000 million a year, and control efforts cost the
industry between $38 and $41 million237. In 2006, three of the largest pastoral companies in Australia
reported spending a total of $1.3 million a year in weed control238. There are few weeds for which
economic assessments have been undertaken. In 1991, Parthenium was estimated to cost the

63 | P a g e
Queensland beef industry between $14.5 and 16.5 million dollars239. Most of the cost was caused by
reductions in turn-off and liveweight, but costs for weed control and reseeding pastures were also
significant240. The impact of weeds on beef production and control costs increase with the density of
the weed (Table 16), with heavy infestations of Rubber Vine estimated to reduce beef production by
80% and heavy infestations of Mesquite costing around $24/ha to control.
Table 16. Impact of Rubber Vine, Prickly Acacia and Mesquite on pastoral enterprises
Source: Adamson and Lynch (2000)241
Weed Infestation Reduced
production Increased
mustering costs Weed
control costs
(%) ($/ha) ($/ha)
Prickly Acacia Light 0 0.00 2
Medium 0 0.15 10
Heavy 35 0.30 20
Rubber Vine Light 4 0.00 1
Medium 25 0.36 10
Heavy 80 0.72 7
Mesquite Light 0 0.00 2
Medium 8 0.18 10
Heavy 40 0.36 24
Across Queensland, Prickly Acacia, Rubber Vine and Mesquite have a substantial impact on the
industry. In 2000, beef production losses were estimated to be $3.17 million, a cost that would have
been doubled had it not been for the Queensland Government’s $15.5 million Strategic Weed
Eradication and Education Program (SWEEP), which operated between 1995 and 2003 (Table 17)238. If
all three weeds were to fill their potential areas of distribution, their impact on the industry could
increase to over $8 million per year by 2044. Had SWEEP continued, it was on track to eradicate
Mesquite and Prickly Acacia from Queensland grazing lands in this period. While there are ongoing
efforts to control these weeds on a lesser scale, notably the 5-year, $1.88 million War on Western
Weeds program242, stop-start funding of weed programs are a huge impediment to meeting such
targets238.
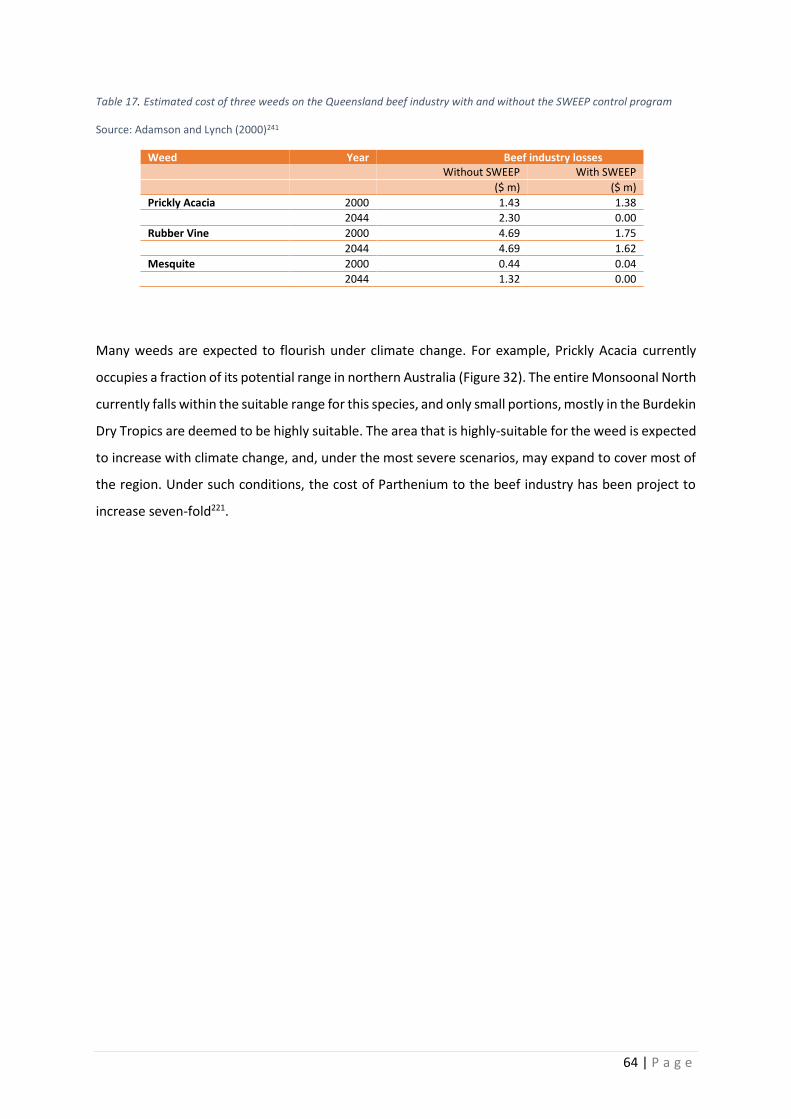
64 | P a g e
Table 17. Estimated cost of three weeds on the Queensland beef industry with and without the SWEEP control program
Source: Adamson and Lynch (2000)241
Weed Year Beef industry losses Without SWEEP With SWEEP
($ m) ($ m)
Prickly Acacia 2000 1.43 1.38
2044 2.30 0.00
Rubber Vine 2000 4.69 1.75
2044 4.69 1.62
Mesquite 2000 0.44 0.04
2044 1.32 0.00
Many weeds are expected to flourish under climate change. For example, Prickly Acacia currently
occupies a fraction of its potential range in northern Australia (Figure 32). The entire Monsoonal North
currently falls within the suitable range for this species, and only small portions, mostly in the Burdekin
Dry Tropics are deemed to be highly suitable. The area that is highly-suitable for the weed is expected
to increase with climate change, and, under the most severe scenarios, may expand to cover most of
the region. Under such conditions, the cost of Parthenium to the beef industry has been project to
increase seven-fold221.

65 | P a g e
Figure 32. Current and potential distributions of Prickly Acacia based on CLIMEX modelling (a) and projected potential distributions based on various climate change scenarios (b-g)
Source: Adapted from Kriticos, Sutherst, Brown, Adkins and Maywald (2003)243 [© 2003 British Ecological Society]
Pest animals
Wild dogs and dingos have significant financial impacts on the Australia beef industry, with annual
losses estimated at $26.6 million in 2007-8244. By comparison, feral pig impacts are relatively small.
However, the impacts of wild dogs and dingoes are widely debated, with some arguing that the
benefits of macropod control outweigh the cost of calf losses245,246 as densities of kangaroos are lower
66 | P a g e
outside the dingo fence247. Moreover, by controlling feral cats (and red foxes, where these occur),
dingoes are important for maintaining biodiversity248.
Kangaroos and wallabies contribute significantly to total grazing pressure across the rangelands249,
particularly around water points250. Kangaroo and wallaby grazing was estimated to cost the Australian
cattle industry $8.1 million in lost cattle production251. It is unclear whether climate change will
influence the pest impacts of either dingoes or kangaroos and wallabies.
Locusts cause considerable damage to grazing lands in the Monsoonal North. Locusts eat pasture and
crop plants, stripping them to bare earth when in large numbers252. The most significant species in the
tropics is the Spur-throated Locust (Austracris guttulosa), which proliferates following drought-
breaking rains253. Locust plagues are thought to occur under these conditions because, while both
numbers of both locusts and their predators are reduced during drought, once rain falls, predators
take longer to recover than the locusts do254. Such an outbreak followed drought-breaking rain in
western Queensland early in 2015a. Under climate change, locust outbreaks are expected to increase
because of intensifying dry and wet cycles254.
Disease and parasites
The Australian beef herd is relatively free of significant diseases. Tuberculosis and brucellosis were
effectively eradicated in the 1992255 and Australia is free from both FMD and BSE256. This gives
Australian cattle a significant trade advantage (see Market requirements). Rigorous quarantine
restrictions are in place to reduce the risk of these diseases entering Australia257,258. Australia’s
dominance of the live export trade to Indonesia also helps provide a disease free buffer to its north37.
Indonesia’s plans to relax restrictions on importing meat from FMD-free areas of India and Brazil is,
therefore, of concernb. The impact of either FMD or BSE entering Australia would be immense, with a
widespread outbreak shifting the value of the beef industry to the Australian economy from a surplus
of $57 million to a deficit of $1.7 billion259 potentially amounting to cost of over $50 billion over a 10
year period260.
The cattle industry already bears heavy disease- and parasite-related costs, particularly from tick-
related diseases, bluetongue, buffalo fly and ephemeral fever (Table 18).
a http://www.abc.net.au/news/6263414 b http://www.abc.net.au/news/5811476

67 | P a g e
Table 18. Cost of endemic diseases to the northern Australian beef industry
Source: Sackett, Holmes, Abbott, Jephcott and Barber (2006)261
NB: - indicates no data available
Disease Cost per head Cost to industry
($) ($ m) High impact
Tick control 15.62 140.1
Nutritional deficiency 27.58 117.5
Buffalo fly - no treatment 9.32 58.5
Tick fever - unvaccinated 3.43 18.4
Bovine ephemeral fever 6.69 17.9
Buffalo fly - treatment 6.14 16.5
Tick fever - vaccinated 1.83 6.6
Botulism - -
Reproductive wastage - -
Medium impact
Pinkeye - treatment 1.29 6.7
Pinkeye - no treatment 1.11 5.8
Clostridial diseases - -
Internal parasites - -
Pestivirus - -
Low impact
Akabane - -
Blue tongue - -
Cancer eye - -
Blue tongue - -
Leptospirosis - -
Lice - -
Transit tetany - -
Weaner stress syndrome - -
Unknown impact
Emerging diseases - -
Genetic diseases - -
Myositis/stearitis - -
Neospora - -
Neurological disease - -
Plant toxins - -
Sporadic bovine encephalitis - -
Ticks impose the greatest burden on the cattle industry. Not only are there costs associated with
treatment and production losses, but animals must be yarded and inspected at recognised facilities
when animals move from tick infested or tick-protected areas into tick-free areas261. In addition,
further costs arise from the need to prevent and treat tick fever. These costs are dealt with in the
following section.
The impact that a disease outbreak can have on the cattle industry was illustrated in a recent outbreak
of bovine johne’s disease (BJD). Western Australia is in the BJD-free zone and Northern Territory and
Queensland are in the Protected Zone, where there is an emphasis on early detection and rapid
response to prevent spread262. There have been 24 recorded instances of cattle in Queensland being

68 | P a g e
infected with BJD, mostly in introduced animals263. In October 2012, a BJD outbreak occurred on a
stud property near Rockhampton, which had transported animals to up to 170 properties across
Queensland, Northern Territory, Western Australia and New South Wales before the disease was
detected. Interventions included restriction on stock movement and consigning potentially affected
animals to feedlot or slaughter to reduce the risk of disease spread. Animals were traced using the
National Livestock Identification System (NLIS)256, but this was hampered by poor compliance and
record access, and recommendations have been made for improvements263.
The cost of controlling this outbreak was estimated to be about $6-7 million, partly borne by the
industry and the rest by government264. Had the outbreak expanded to a second location, the cost of
the response would have been in the order of $23-25 million. Destocking of infected properties was
estimated to cost an average of $1.5 million, and the cost of managing the disease on stud properties
substantially higher. Compensation paid by the Queensland Government was capped at $100,000.
Had Queensland’s BJD status been revised from Protected to Management the costs would have
included both production losses and impacts on market access and prices. Disease control measures
are, therefore, important, not just at ports, but on-property and when stock changes hands.
Climate change is expected to increase the risk of significant diseases and parasites (such as crew
worm) entering Australia from neighbouring countries, as well as favouring many of those already
present in the country, such as ticks, bluetongue, leptospirosis, buffalo fly and bovine ephemeral
fever265-267.
Fire
Fire frequency and extent varies across the Monsoonal North. Most of the Mitchell Grass country in
the Southern Gulf is rarely burnt, and much of the north Kimberley, western Top End, Northern
Territory Gulf country and western Cape York Peninsula is burnt at least every second year (Figure 33).
Most fires occur in the second half of the year (Figure 34). These fires tend to be wildfires, and have a
significant impact on grazing production. In 2010, pastoralists in the Kimberley identified wildfire as
the most significant constraint to environmental sustainability268.
Fire frequency and extent is related to development and grazing pressure, with highest frequencies
occurring on the least intensively managed country, and lowest frequencies in areas with high stocking
rates269. In areas where wildfires are extensive, the combined costs of fighting fires and feeding or
moving cattle exceed those of lighting fires and sacrificing small areas of pasture by burning firebreaks

69 | P a g e
early in the year270,271. Therefore, in areas of high wildfire risk, strategic use of early dry season burning
to prevent wildfires is economically viable, especially when combined with carbon abatement (see
Environmental service delivery). Lack of fire can also be an issue in the northern rangelands, leading
to vegetation thickening and loss of pasture production272-275.
Figure 33. Frequency of fires in the Monsoonal North between 1997 and 2010
Source: NAFI (2015)276
Figure 34. Frequency of late dry season fires in the Monsoonal North between 1997 and 2010
Source: NAFI (2015)276

70 | P a g e
Climate
Variability and seasonal conditions
Beef production is highly dependent on seasonal conditions, with droughts leading to loss of forage
and years of good rainfall assisting pasture recovery, improving land condition and temporarily
increasing carrying capacity69,265,277. Pastoralists respond to severe droughts by destocking to avoid
pasture degradation and cattle death, and use good years to rebuild the herd. However, extended
periods of elevated rainfall can lead to unrealistic expectations of long-term carrying capacity278.
The northern cattle herd was reduced in size, or its growth retarded, by extended or severe periods
of drought in 1965-66, through much of the 1980s and the early 2000s (Figure 7). Following
exceptionally good rainfall years in 2011-12, drought conditions set in in 2013 in the Southern Gulf
and large parts of the Northern Gulf and Burdekin Dry Tropics and properties began to destock279.
Cattle and calf slaughter in Queensland rose 7% in 2012-13 and a further 12% in 2013-14. With sales
at near-record highs54, cattle prices fell, but the volume sold meant business incomes were only
marginally reduced137. Severe drought conditions persisted to the end of the 2015 dry season, and
sales dried up through western Queensland. Prices recovered as the number of stock for sale fell again,
with increasing competition between the various market sectors49. Hence, adjusting stock numbers in
response to seasonal conditions is important for maintaining pasture condition and profitability280,
but also places financial stress on beef enterprises when the whole country is trying to destock or
restock at the same time.
Climate change
Climate change poses one of the greatest challenges to natural resource management in Australia.
Climate change is being caused by an increase in atmospheric carbon dioxidea. In the Monsoonal
North, temperature rises of between 0.9 and 1.0˚C have occurred since 1910, and increases of a
further 1.3 to 5.1˚C are expected by the end of the century1, with CO2 concentrations reaching
somewhere between 540 and 940 ppm (depending on efforts to reduce anthropogenic CO2
emissions)285.
a Atmospheric carbon dioxide has increased from around 280 ppm before the industrial revolution281 to current levels of around 400 ppm282.Over the same period, global temperatures have risen by about 1.0˚C283. Up until the start of the 20th century, CO2 influence on global temperature was difficult to separate from that of other factors such as solar radiance and volcanic eruptions284. However, the steady temperature rise of about 0.5˚C through the 20th century283 has been strongly linked to anthropogenic CO2 emissions284, and temperature is increasing at an accelerated rate. Both CO2 and temperatures have continued to increase through the 21st century, and 2014 was the hottest year on record285,286.

71 | P a g e
The Monsoonal North is already experiencing climate change, with every year of the 21st century so
far being one of the hottest 15 years on record287. Droughts, cyclones, wildfires and flooding rains are
likely to intensify over the next few decades (Table 19), and continue intensifying until at least the end
of the century1. These changes will have enormous impacts on the condition of land and seas of
northern Australia, including their productive potential and our ability to manage them.
Despite some potential benefits to date, climate change poses many new stresses to the northern
beef industry. Since 1900, rainfall has increased by 20 mm per decade in the Kimberley and Northern
Territory sections of the Monsoonal North and by 10 mm per decade in the Queensland section1.
These changes have resulted in increased forage and animal production in the Kimberley and adjoining
areas of the Northern Territory288; with a further 20% increase in rainfall would be likely to further
increase pasture growth by 9% and safe stocking rates by 11%289. However, rainfall in the Kimberley
is neither predicted to increase nor decrease with any certainty1. Rather, large variations in rainfall
from year to year are likely to intensify, accompanied by increases in temperature and evaporation.
These changes are expected to increase the frequency of heatwave conditions and reduce surface
water availability, especially in the late dry season290. While not expected to increase fire frequency,
dry hot conditions will mean that fires that do occur are expected to be more severe and spread faster
than fires do now1. This would both reduce forage availability and create challenges for pastoralists
diversifying into carbon abatement projects.

72 | P a g e
Table 19. Climate change projections across the Monsoonal North to 2030
Climate variable Projection Confidence Sources Atmospheric CO2 Continue to rise (reaching 425-450 ppm) Not stated 291,292 Solar radiation Little change High 1
Evapotranspiration Increases of ca. 2-6% in autumn, winter & spring Increases of ca. 1-5% in summer
Medium 1
Relative humidity Little change Medium 1
Temperature Continued substantial warming for mean, maximum and minimum temperature (increases of 0.5-1.3°C)
High 1
Heatwaves Substantial increase in the temperature of hottest days and duration of warm spells
Very high 1
Days per year over 35˚C
Broome: 72 to 111; Darwin: 25-74; Cairns 4-8 (Currently: Broome: 56; Darwin: 11; Cairns 3)
Very high 1
Days per year over 40˚C
Broome: 6-9; Darwin: 0; Cairns <1 (Currently: Broome: 4; Darwin: 0; Cairns 0)
Very high 1
Rainfall Continues to be driven by natural climate variability High 1
Rainfall intensity Increased intensity of heavy rainfall extremes High 1
Droughts No clear indication on time spent in drought - 1
Soil moisture Decreases in soil moisture, with largest decreases in autumn Medium 1
Run-off No projection - dependent on rainfall & rainfall intensity - 1
Cyclones Less frequent but more intense Medium 1
Fire frequency Top End & Kimberley: No change High 1
Rest of cluster: no change Medium 1
Fire behaviour More extreme Medium-High 1
Average wind speeds Little change High 1
Sea level Continued increase in sea levels requiring raising of sea walls by 11-14 cm
High 1
Groundwater recharge
No projections - Dependent on rainfall, but also sensitive to temperature, rainfall intensity solar radiation and CO2
- 293,294
Groundwater quality No projections - Dependent on groundwater recharge and sea level rise
- 294
Ocean temperature Increases of 0.6-0.9˚C in coastal water Very high 1
Ocean salinity Variable, but little change Low 1
Ocean acidity Increase – pH decreases of 0.07 in coastal waters Very high 1
Oceanic calcium availability
Aragonite saturation decreases of 0.30-0.42 Not stated 1
Carbon dioxide enrichment alone may also have positive and negative effects on forage production.
Increasing growth rates and improving water-use efficiency are expected to contribute a 26% increase
in production by the end of the century288. However, this increase is likely to be offset by woody
thickening as woody plants (with a C3 photosynthetic pathwaya) respond more vigorously to CO2
enrichment than do tropical C4 grasses288. Moreover, CO2 enrichment is likely to reduce forage
quality296 and, with it, animal growth rates, enterprise production and profitability173,290.
a Most plants use only the standard Calvin photosynthetic pathway to produce carbohydrates from CO2, and are known as C3 plants. C4 plants, mostly tropical grasses and sedges, enhance carbohydrate production through a second pathway C4 pathway295. Increasing atmospheric CO2 levels increase vegetative growth in C3 plants, but growth in C4 plants is unaffected.

73 | P a g e
In most climate change scenarios, whether rainfall remains roughly the same or decreases, pasture
growth and safe stocking rates in the Monsoonal North are expected to decrease, with the worst
scenarios predicting decreases in pasture growth and safe stocking rates of between 50% and 60%289.
Climate change impacts on the production environment will filter through the supply chain to affect
enterprise and industry viability (Table 20). But each level of the supply chain will also be individually
affected. Likely impacts extend from increasingly stressful operating conditions to damage caused by
floods and cyclones. The impact of Cyclone Marcia in February 2015 is illustrative of the type of
damage that is likely to become more prevalent with climate change. This cyclone not only cut
communications in the Rockhampton regiona, but also closed the Rockhampton abattoir for at least
six weeks because of power disruption and damage to buildingsb. This closure affected cattle sales and
prices throughout north Queensland297,298,c. Similarly, in March 2015, Gunbalanya Meatworks had to
stop killing and freeze packed meat when Cyclone Nathan delayed transportation for a weekd.
a http://www.abc.net.au/news/6217420 b http://www.abc.net.au/news/6285738; http://www.themorningbulletin.com.au/news/meatworks-to-open-in-four-weeks/2566697/ c http://www.abc.net.au/news/6268850 d http://www.abc.net.au/news/6345286
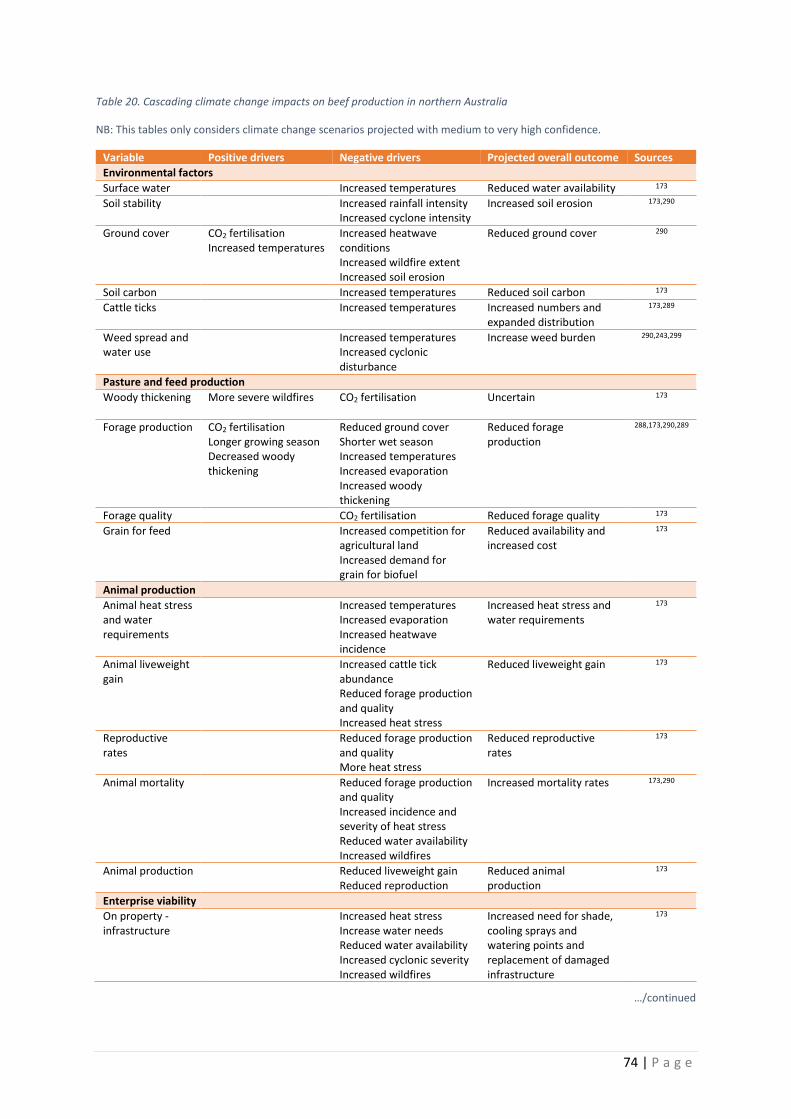
74 | P a g e
Table 20. Cascading climate change impacts on beef production in northern Australia
NB: This tables only considers climate change scenarios projected with medium to very high confidence.
Variable Positive drivers Negative drivers Projected overall outcome Sources
Environmental factors
Surface water Increased temperatures Reduced water availability 173
Soil stability Increased rainfall intensity Increased cyclone intensity
Increased soil erosion 173,290
Ground cover CO2 fertilisation Increased temperatures
Increased heatwave conditions Increased wildfire extent Increased soil erosion
Reduced ground cover 290
Soil carbon Increased temperatures Reduced soil carbon 173
Cattle ticks Increased temperatures Increased numbers and expanded distribution
173,289
Weed spread and water use
Increased temperatures Increased cyclonic disturbance
Increase weed burden 290,243,299
Pasture and feed production
Woody thickening More severe wildfires CO2 fertilisation
Uncertain 173
Forage production CO2 fertilisation Longer growing season Decreased woody thickening
Reduced ground cover Shorter wet season Increased temperatures Increased evaporation Increased woody thickening
Reduced forage production
288,173,290,289
Forage quality CO2 fertilisation Reduced forage quality 173
Grain for feed Increased competition for agricultural land Increased demand for grain for biofuel
Reduced availability and increased cost
173
Animal production
Animal heat stress and water requirements
Increased temperatures Increased evaporation Increased heatwave incidence
Increased heat stress and water requirements
173
Animal liveweight gain
Increased cattle tick abundance Reduced forage production and quality Increased heat stress
Reduced liveweight gain 173
Reproductive rates
Reduced forage production and quality More heat stress
Reduced reproductive rates
173
Animal mortality Reduced forage production and quality Increased incidence and severity of heat stress Reduced water availability Increased wildfires
Increased mortality rates 173,290
Animal production Reduced liveweight gain Reduced reproduction
Reduced animal production
173
Enterprise viability
On property -infrastructure
Increased heat stress Increase water needs Reduced water availability Increased cyclonic severity Increased wildfires
Increased need for shade, cooling sprays and watering points and replacement of damaged infrastructure
173
…/continued

75 | P a g e
Table 20. continued
Variable Positive drivers Negative drivers Projected overall outcome Sources
Profitability Reduced animal production Increased infrastructure and pest and weed management costs Increased cost of grain
Reduced income, gross margins and hence profitability
173,290
Social outcomes
Emotional stress Reduced income, gross margins and profitability
300,301
Infrastructure
Water storage and distribution
Accelerated degradation Interruptions to supply Increased maintenance costs
302
Road transport Temporary or permanent road closure necessitating re-routing (where possible) Increased road maintenance costs Increased risk from road damage
Reduced access to properties Reduced ability to get cattle to market Increased transport costs Increased insurance costs Potential increased cattle mortality
302
Rail transport Temporary closure from submergence or buckling of tracks Damage to signals and electrical systems Damage to rail foundations
Reduced ability to get cattle to market Increased transport costs Increased insurance costs Potential increased cattle mortality
302
Ports Increased corrosion Storm damage Inundation
Increased frequency and duration of port closures Shipping delays Increased transport costs Increased insurance costs Potential increased cattle mortality
302
Power generation Increased power disruption Accelerated degradation
Potential interruptions to operation of meatworks
302,303
Communications Increased frequency and duration of network outages
Disruption of communication services
302,303
Buildings Significant damage to, and accelerated deterioration of buildings
Disruption of lives and business operations
302
76 | P a g e
Policy environment
North Australian beef production is influenced by the policies and programs of numerous government
agencies and industry bodies at national, state and territory and regional levels (Figure 35). Influence
is also exerted directly by peak industry bodies, service providers (e.g. banks and extension providers),
and by lobby groups and the media. The policies and programs of organisations that have most
influence on the beef industry are examined in detail below.
Government agricultural policies and programs aim to drive development in the north. Traditional
forms of government support to agriculture, such as trade protection and vast extension programs,
have declined over the past half century106,304. Recent government support for the beef industry is
currently focused on:
Increasing access to international markets (see International trade)
Building more conducive business and financial environments
Identifying infrastructure needed to provide a reliable supply chain and attract investment in
priority infrastructure
Identifying practice improvement required for industry resilience and growth.

77 | P a g e
Figure 35. Organisations that influence the northern Australian beef industry
See Table 21 for explanation of abbreviations and acronyms.
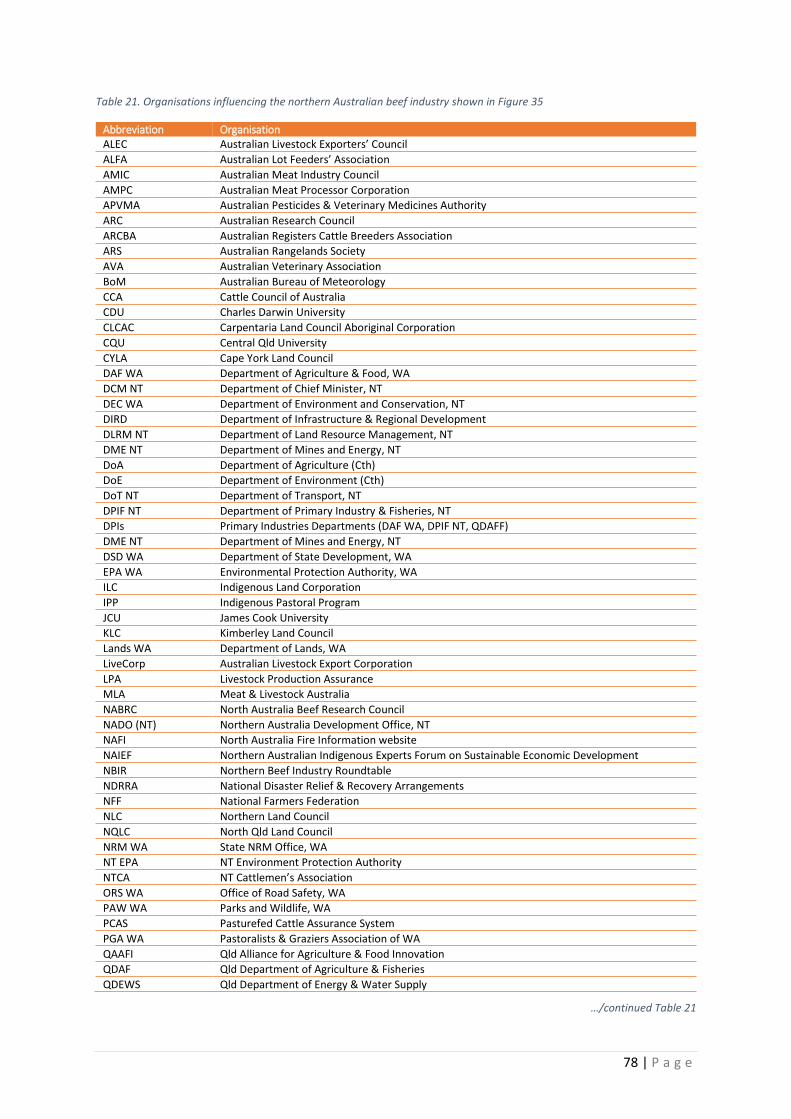
78 | P a g e
Table 21. Organisations influencing the northern Australian beef industry shown in Figure 35
Abbreviation Organisation ALEC Australian Livestock Exporters’ Council
ALFA Australian Lot Feeders’ Association
AMIC Australian Meat Industry Council
AMPC Australian Meat Processor Corporation
APVMA Australian Pesticides & Veterinary Medicines Authority
ARC Australian Research Council
ARCBA Australian Registers Cattle Breeders Association
ARS Australian Rangelands Society
AVA Australian Veterinary Association
BoM Australian Bureau of Meteorology
CCA Cattle Council of Australia
CDU Charles Darwin University
CLCAC Carpentaria Land Council Aboriginal Corporation
CQU Central Qld University
CYLA Cape York Land Council
DAF WA Department of Agriculture & Food, WA
DCM NT Department of Chief Minister, NT
DEC WA Department of Environment and Conservation, NT
DIRD Department of Infrastructure & Regional Development
DLRM NT Department of Land Resource Management, NT
DME NT Department of Mines and Energy, NT
DoA Department of Agriculture (Cth)
DoE Department of Environment (Cth)
DoT NT Department of Transport, NT
DPIF NT Department of Primary Industry & Fisheries, NT
DPIs Primary Industries Departments (DAF WA, DPIF NT, QDAFF)
DME NT Department of Mines and Energy, NT
DSD WA Department of State Development, WA
EPA WA Environmental Protection Authority, WA
ILC Indigenous Land Corporation
IPP Indigenous Pastoral Program
JCU James Cook University
KLC Kimberley Land Council
Lands WA Department of Lands, WA
LiveCorp Australian Livestock Export Corporation
LPA Livestock Production Assurance
MLA Meat & Livestock Australia
NABRC North Australia Beef Research Council
NADO (NT) Northern Australia Development Office, NT
NAFI North Australia Fire Information website
NAIEF Northern Australian Indigenous Experts Forum on Sustainable Economic Development
NBIR Northern Beef Industry Roundtable
NDRRA National Disaster Relief & Recovery Arrangements
NFF National Farmers Federation
NLC Northern Land Council
NQLC North Qld Land Council
NRM WA State NRM Office, WA
NT EPA NT Environment Protection Authority
NTCA NT Cattlemen’s Association
ORS WA Office of Road Safety, WA
PAW WA Parks and Wildlife, WA
PCAS Pasturefed Cattle Assurance System
PGA WA Pastoralists & Graziers Association of WA
QAAFI Qld Alliance for Agriculture & Food Innovation
QDAF Qld Department of Agriculture & Fisheries
QDEWS Qld Department of Energy & Water Supply
…/continued Table 21
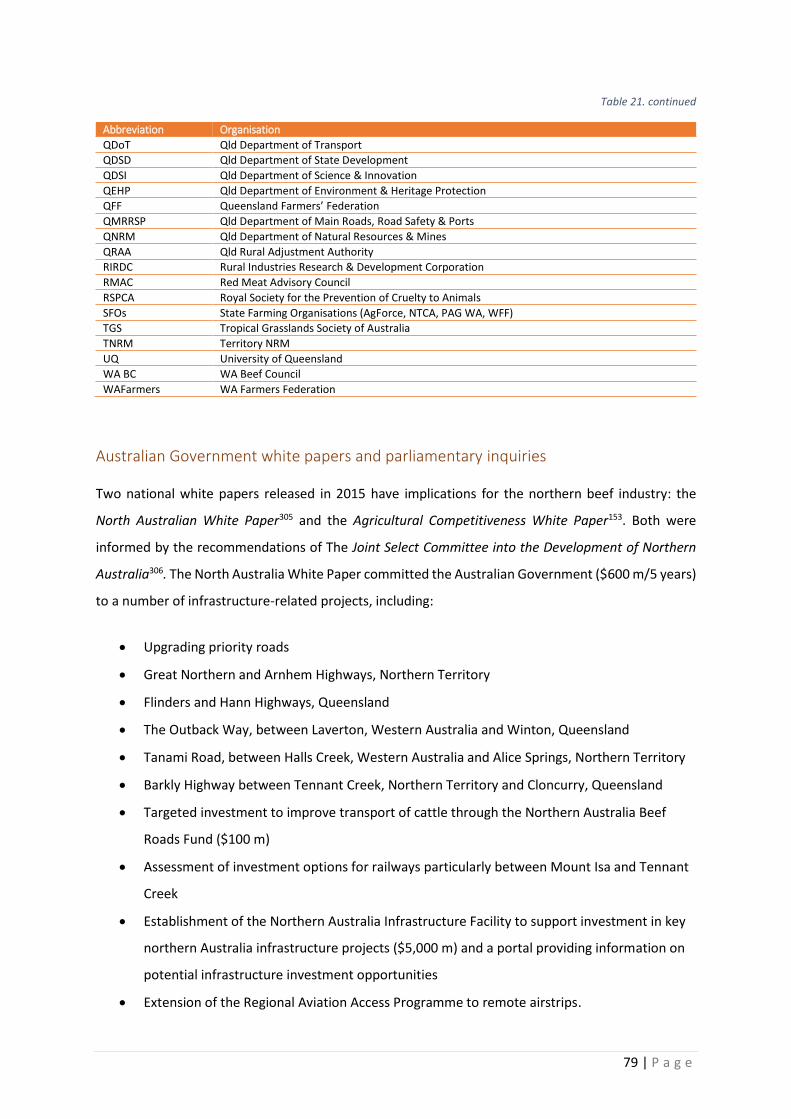
79 | P a g e
Table 21. continued
Abbreviation Organisation
QDoT Qld Department of Transport
QDSD Qld Department of State Development
QDSI Qld Department of Science & Innovation
QEHP Qld Department of Environment & Heritage Protection
QFF Queensland Farmers’ Federation
QMRRSP Qld Department of Main Roads, Road Safety & Ports
QNRM Qld Department of Natural Resources & Mines
QRAA Qld Rural Adjustment Authority
RIRDC Rural Industries Research & Development Corporation
RMAC Red Meat Advisory Council
RSPCA Royal Society for the Prevention of Cruelty to Animals
SFOs State Farming Organisations (AgForce, NTCA, PAG WA, WFF)
TGS Tropical Grasslands Society of Australia
TNRM Territory NRM
UQ University of Queensland
WA BC WA Beef Council
WAFarmers WA Farmers Federation
Australian Government white papers and parliamentary inquiries
Two national white papers released in 2015 have implications for the northern beef industry: the
North Australian White Paper305 and the Agricultural Competitiveness White Paper153. Both were
informed by the recommendations of The Joint Select Committee into the Development of Northern
Australia306. The North Australia White Paper committed the Australian Government ($600 m/5 years)
to a number of infrastructure-related projects, including:
Upgrading priority roads
Great Northern and Arnhem Highways, Northern Territory
Flinders and Hann Highways, Queensland
The Outback Way, between Laverton, Western Australia and Winton, Queensland
Tanami Road, between Halls Creek, Western Australia and Alice Springs, Northern Territory
Barkly Highway between Tennant Creek, Northern Territory and Cloncurry, Queensland
Targeted investment to improve transport of cattle through the Northern Australia Beef
Roads Fund ($100 m)
Assessment of investment options for railways particularly between Mount Isa and Tennant
Creek
Establishment of the Northern Australia Infrastructure Facility to support investment in key
northern Australia infrastructure projects ($5,000 m) and a portal providing information on
potential infrastructure investment opportunities
Extension of the Regional Aviation Access Programme to remote airstrips.
80 | P a g e
As part of the white paper process, Infrastructure Australia undertook an audit to identify
infrastructure needed to develop northern Australia307. This audit characterised the issues facing the
north and identified the processes needed to ensure future investment is well directed. It did not
make any recommendations.
The Agricultural Competitiveness White Paper outlined $4,000 m of new and existing investments to
improve profitability, resilience and sustainability of the agricultural sector, and to facilitate access to
growing international markets, through improvements to food safety, environmental management,
modern technology and workforce skills. The paper’s five priority areas cover the business
environment, infrastructure, risk management, practice improvement and market access. New
initiatives to improve the business environment of primary producers included:
Oversight of fair-trading and competition in agricultural supply chains by the Australian
Competition and Consumer Commission, with a dedicated Agriculture Commissioner
($11.4 m/5 years) to reduce producer vulnerabilities to monopolies in the processing,
transport and product purchase
A pilot programme to help producers establish alternative business models (including
cooperatives), manage contract negotiations and attract investors ($13.8 m/2 years)
A streamlined approval process for agricultural and veterinary chemicals ($20.4 m)
Productivity Commission reviews to investigate options for reducing the regulatory burden
Country-of-origin labelling that identifies where a food product was produced and processed
and the proportion of Australian-grown produce
Changes to taxation arrangements for primary producers, including improvements to:
o Income tax averaging
o Expanding the use of Farm Management Deposits (FMDs) allowing farmers to set
aside pre-tax income in good years to cover low income years (and pay tax
liabilities), and to use these deposits to offset loans and reduce interest rates
o Depreciation for fencing
Increasing investor awareness of agricultural investment opportunities
Increased scrutiny of foreign investment.
The paper also highlighted taxation relief and the accelerated depreciation schedules for small primary
producers in the Growing Jobs and Small Business package308 from 2015; extensive reforms of the
regulatory system, including for environmental assessments; the tax reforms being considered in a
taxation white paper309, including negative gearing of primary production expenses; and efforts to

81 | P a g e
reform land tenure systems across northern Australia to assist development as part of the Northern
Australia White Paper.
New infrastructure commitments included establishment of a National Water Infrastructure
Development Fund to improve farm access to water through strategic planning ($50 m/5 years) and
construction ($450 m/5 years). Water infrastructure options in northern Australia will be assessed
($30 m) covering:
West Kimberley, Western Australia
Ord Stage 3, Western Australia and the Northern Territory
Darwin region, Northern Territory
Mitchell River catchment (Northern Gulf region), Queensland
Nullinga Dam (Northern Gulf region), Queensland.
Expansion of CSIRO’s Transport Network Strategic Investment Tool (TRANSIT) will be supported to
ensure future investment in transport infrastructure improves agricultural supply chains.
The paper highlighted existing infrastructure investment of benefit the agricultural sector, i.e. road
and rail construction (including upgrades to the Bruce Highway, Queensland and Buntine, Plenty,
Victoria and Stuart highways, Northern Territory); improved mobile phone coverage; and the National
Broadband Network to upgrade internet access.
New initiatives to improve risk management included:
Improved seasonal forecasts ($3.3 m/5 years)
Improved taxation arrangements covering new water facilities and fodder storage assets
Funding for access to insurance advice and risk assessment ($29.9 m/4 years).
Support for producers and agricultural communities experiencing drought conditions included:
Extension of the Drought Concessional Loans program for 11 years (up to $250 m a year)
Increased Farm Household Allowance case management for farmers ($22.8 m/5 years)
Access to FMDs without taxation penalties
Funding for infrastructure projects to help drought-affected communities ($35 m/5 years)
Funding to assist pest animals and weed management in drought-affected areas
($25.8 m/4 years)
82 | P a g e
Improved access to financial counselling and community mental health services, and advice
from the Australian Taxation Office.
The White Paper aimed to assist on-farm practice improvement by:
Extension of the Rural R&D for Profit Programme for on-farm and collaborative research
($100 m; 2018–19 to 2021–22)
Extension of research investment to include export fodder and tea tree oil industries
through matching industry levies and contributions ($1.4 m/5 years)
Research support for small industries not currently covered by the Rural Industries Research
and Development Corporation ($1.2 m/5 years)
Reform of use of levies by industry research and development corporations to:
o Prioritise research, development and extension (RD&E) to areas that will improve
farm gate returns
o Reduce administration costs
Improve emergency pest and disease eradication capability ($50 m/ 5 years)
Develop tools and control methods for pest animal and weeds management $50 m/5 years).
Pre-existing programs to support practice improvement highlighted in the paper included:
Training through the Industry Skills Fund and Green Army
Expansion of seasonal and working holiday visas in northern Australia
Review of occupations eligible for temporary skill visas
National Landcare Programme.
The White Paper committed the government to the following investment to improve access to
international markets:
Address technical barriers to trade and appoint five new Agriculture Counsellors
($30.8/5 years)
Improve biosecurity systems, including in northern Australia ($200 m/5 years)
Modernise traceability systems for Australia’s food export ($12.4 m/5 years).
83 | P a g e
Northern Australia Beef Industry Working Group
The Northern Australia Ministerial Forum (NAMF), which operated between 2010 and 2013 to
promote sustainable development of the north, set up the Northern Australia Beef Industry Working
Group (NABIWG) in 2012 to facilitate development of the northern beef industry 310. Members of this
working group included industry (NABRC, RMAC; NAIEF) and governments with responsibilities in
northern Australia.
The working group identified seven strategic priority areas to support industry viability and growth,
along with associated actions:
Trade relationships and market access
Investment security through land tenure and water rights
Transport, logistics and infrastructure
Research, development, extension, education and training across the supply chain
Indigenous involvement in the industry
Compliance costs
Understanding of the resource base.
Reports addressing most of these priorities have been completed and are widely quoted elsewhere in
this report. While the Working Group is no longer in operation, each of the government agencies and
industry bodies represented on this working group are pursuing actions addressing these priorities,
namely:
Land tenure reform is underway in all jurisdictions (see Tenure and Native Title)
Industry groups, land councils and government agencies are supporting the development of
Indigenous pastoralism (see Indigenous pastoralism)
State and territory governments are supporting mosaic irrigation (see Diversification),
identification and adoption of improved practices, and investing in regional infrastructure
development (see below), and new abattoirs have been constructed, are under construction
or have been proposeda
Northern agricultural stakeholders, including state and territory governments, have
collaborated to develop the collaborative research and development program, growNORTH.
a http://www.abc.net.au/news/5877062
84 | P a g e
Indigenous Land Corporation
The Indigenous Land Corporation’s (ILC) key priority of socio-economic development of Indigenous
people is largely delivered through assisting in the purchase and management of northern pastoral
properties311. This priority is addressed through the following activities:
Acquiring and granting land to Indigenous organisations to achieve Indigenous training,
employment and social outcomes
Operating agricultural and tourism businesses that train Indigenous people and assist them
to transition to secure jobs
Providing funding assistance to Indigenous landholders for projects that will develop land-
based businesses and improve management of their land
Providing property planning assistance to build the capacity of Indigenous landholders to
manage and use their land
Developing projects in collaboration with other organisations to assist Indigenous
landholders engage with emerging enterprise opportunities in offsetting greenhouse gas
emissions and delivery of environmental services
Collaborating with other agencies and industry partners to implement regional projects that
provide mentoring, support and advice to assist Indigenous landholders to manage land
sustainably.
ILC’s activities in the northern beef industry were described earlier in this report (see Indigenous
pastoralism).
State and territory governments
Each of the three state and territory governments in northern Australia has had policies to increase
herd size (Table 22), which are detailed below. Recent changes in government mean it is not always
clear which policies remain current.

85 | P a g e
Table 22. Government projections for the northern Australian beef industry
Year Cattle numbers Increase Period Annual growth Source
Kimberley, Western Australia
2009 750,000 29
2020 1-1.3 million 33-73% 11 years 2.65-5.13%
Northern Territory
2009 1.9 million
312 2014 2.0 million 5% 5 years 1.03%
2019 2.3 million 21% 10 years 2.84%
2029 2.8 million 47% 20 years 1.98%
Queensland
2014 12.2 million 313
2040 16.8 million 38% 26 years 1.24%
Western Australian Government
The strategic plan of the Department of Agriculture and Food, Western Australia (DAF WA) focuses on
improving the supply chain; transforming businesses; improving biosecurity; and protecting natural
resources to build markets, increase productivity, improve profitability and build human capacity314.
In line with the strategies identified by NBIWC, the Western Australian Government has prioritised
the development of the beef industry in the Kimberley and Pilbara, focusing on mosaic irrigated
agriculture and Indigenous development. Programs to achieve this include Northern Beef Futures and
Water for Food315.
Northern Beef Futures
The Northern Beef Futures project is part of Western Australia’s Royalties for Regions program316. This
$15 million investment aims to improve economic and employment opportunities in the Kimberley
and Pilbara by increasing cattle production. It aims to build business resilience by facilitating access to
a wider range of markets; and attract business investment by assisting pastoral operations develop
innovative business models and management capabilities. The program promises to:
Deliver extension activities to support skills development and the adoption of improved and
innovative practices in production, processing and export
Facilitate value-adding of beef production and supply chain development to meet the needs
of new and existing markets, particularly through enabling cattle to be finished to slaughter-
ready weights on irrigated pasture within the region
Identify infrastructure needed for delivering products to new and existing markets and
provide seed capital to encourage investment in priority infrastructure
Deliver stand-alone clearing-yard facilities in the Kimberley to enable transport of domestic
cattle without affecting the quarantine status of export depots

86 | P a g e
Work closely with Indigenous pastoral businesses, to facilitate increased production and
Indigenous participation in all stages of the beef supply chain.
The project is built on partnerships with northern pastoral industry groups, ILC, WA Beef Council
(WABC) and Meat and Livestock Australia (MLA), and has been endorsed by Northern Beef Industry
Roundtable (NBIR) and North Australia Beef Research Council (NABRC).
Water for Food
Western Australia’s Water for Food initiative is also part of the Royalties for Regions program. It aims
to increase economic growth and regional employment by developing new irrigation areas and
extending the size and productivity of existing irrigation areas70. This involves developing a new tenure
framework to allow diversification of land use on existing pastoral leases. The first stage includes
investigation of groundwater resources and three pilot projects to develop Indigenous employment
opportunities, including using pivot irrigation to provide forage and silage on the Indigenous-owned
pastoral lease, Mowanjum70,317. This meshes with the aim of the Northern Beef Futures project by
providing the means for finishing cattle on northern properties.
Northern Territory Government
The Northern Territory Government’s policies to support the beef industry are found in its Primary
Industry and Fisheries Industry Development Plan 2013–2017318. These focus on developing a
supportive business environment; market development; practice improvement; biosecurity;
Indigenous pastoralism; diversification of land use activities; and facilitating investment in essential
infrastructure.
The Northern Territory Government projected that the beef industry would grow from 1.9 million
head of cattle in 2009 to 2.0 million head in 2014 and 2.8 million head in 2029, and increase of 47% in
20 years312. Initial growth was to be delivered by general intensification; followed by increasing cattle
numbers on Indigenous land and intensification in the Barkly and Katherine regions; and between
2019 and 2029 by increasing cattle numbers on Indigenous land, especially in the Daly region, further
intensive production in the Douglas-Daly and Katherine regions, and increased intensification in the
Barkly region. So far, growth of the Northern Territory herd has exceeded these expectations, reaching
2.2 million in June 2013319.
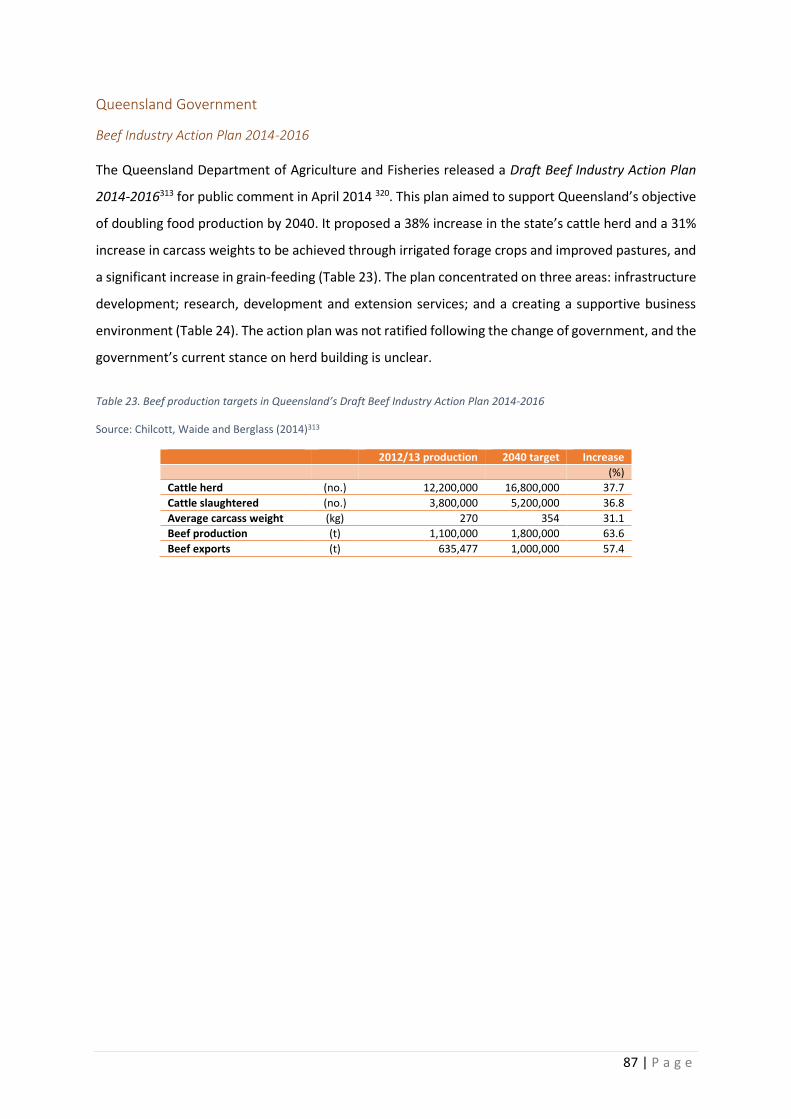
87 | P a g e
Queensland Government
Beef Industry Action Plan 2014-2016
The Queensland Department of Agriculture and Fisheries released a Draft Beef Industry Action Plan
2014-2016313 for public comment in April 2014 320. This plan aimed to support Queensland’s objective
of doubling food production by 2040. It proposed a 38% increase in the state’s cattle herd and a 31%
increase in carcass weights to be achieved through irrigated forage crops and improved pastures, and
a significant increase in grain-feeding (Table 23). The plan concentrated on three areas: infrastructure
development; research, development and extension services; and a creating a supportive business
environment (Table 24). The action plan was not ratified following the change of government, and the
government’s current stance on herd building is unclear.
Table 23. Beef production targets in Queensland’s Draft Beef Industry Action Plan 2014-2016
Source: Chilcott, Waide and Berglass (2014)313
2012/13 production 2040 target Increase
(%)
Cattle herd (no.) 12,200,000 16,800,000 37.7
Cattle slaughtered (no.) 3,800,000 5,200,000 36.8
Average carcass weight (kg) 270 354 31.1
Beef production (t) 1,100,000 1,800,000 63.6
Beef exports (t) 635,477 1,000,000 57.4

88 | P a g e
Table 24. Actions to support development of the beef industry in Queensland’s Draft Beef Industry Action Plan 2014-2016
Source: Chilcott, Waide and Berglass (2014)313
Resource availability
Attract investment into grazing land
Promote new opportunities in the regulatory framework for investment to increase production from current grazing areas
Support producers to prepare for drought
Support beef producers to manage climate risks Productivity
Invest in new research
Invest in RD&E to improve cattle production
Promote best practice to producers
Support increased adoption of existing innovations across the beef supply chain
Support intensification of production
Support feedlot development, use of forage crops and improved pastures to intensify production
Support processing expansion
Support long term investments by meat processors Market Access
Build relationships
Support building international relationships between Queensland and key beef markets
Advocate for market access
Support industry to realise market opportunities by advocating for market access for beef
Promote Queensland’s standards
Promote Queensland’s excellent food safety and cattle biosecurity standards Reducing costs
Reduce red tape
Identify and promote opportunities to reduce regulation compliance costs in the beef supply chain, across portfolios and jurisdictions
Improve transport efficiency
Work with industry to identify and promote opportunities to reduce cattle transport costs
High-level industry bodies
A hierarchy of organisations to represent the interests of beef and other meat producers has been
established through a memorandum of understanding (MOU) under the Australian Meat and Live-
stock Industry Act 1997 (Cth). Its purpose is to collect and distribute levies collected from producers
and processors for research, development and marketing; and to liaise with government on cross-
sectoral and whole-of-industry matters321. The overarching body in this arrangement is the Red Meat
Advisory Council (RMAC), whose members include six peak industry councils (including the Cattle
Council of Australia (CCA), Australian Livestock Exporters’ Council (ALEC)) and Australian Lot Feeders’
Association (ALFA) and the three research, development and marketing corporations: Meat and
Livestock Australia (MLA), Australian Meat Processors Corporation (AMPC) and LiveCorp (Figure 36).
The Cattle Council of Australia represents the interests of producers of grass-fed cattle through state
farming organisations (SFOs) as well as through direct membership. Its roles include advocacy;
strategic direction and planning; and industry oversight and strategic policy development. Levies

89 | P a g e
collected from producers and processors fund research, development and marketing undertaken by
MLA to assist both grass-fed and grain-fed meat production; by AMPC to assist processing; and by
LiveCorp to assist live export. These corporations also collaborate to meet industry-wide strategic
objectives.
The work of the corporations is funded by levies on the sale or transfer of grass-fed or grain-fed cattle
($0.90 for animals weighing less than 80 kg and $5 per head for all other cattle)322. The levy on grass-
fed cattle is distributed to MLA for marketing (73.2%) and research and development (18.4%); the
remainder being used for animal health (2.6%) and residue testing (5.8%).
Figure 36. Hierarchy of peak bodies representing the interests of the northern beef industry
Adapted from Rural and Regional Affairs and Transport References Committee (2014)321
See Figure 35 for explanation of abbreviations relevant to the northern Beef Industry
In 2013-14, MLA’s income from levies amounted to $106 million, of which 58% came from levies on
grass-fed cattle and 9% from grain-fed cattle323. With additional income from government and private
contributions and corporation activities, MLA’s income amounted to $188.5 million in 2013-14, and
its expenditure to $181.1 million. MLA’s investment in marketing and research and development,
therefore, has the potential to have significant impact on the direction of the industry.
90 | P a g e
MLA’s areas of activity and achievement fall into four key areas:
Maintaining and improving market access
Growing demand
Increasing productivity across the supply chain
Supporting industry integrity and sustainability.
For at least the last two decades, MLA’s northern Australian operations have included the
development of extension programs to improve sustainability of grazing practices and viability of
business operations. These include Grazing Land Management, CashCow and BreedPlan. National
initiatives of benefit to the northern industry include supporting development of free-trade
agreements (e.g. Korea and Japan); promotion of Australia beef at overseas trade shows and domestic
marketing campaigns; assisting producers meet ESCAS requirements; and improving disease
detection.
In 2014, a Senate Inquiry was held into “Industry structures and systems governing levies on grass-fed
cattle”321. The inquiry was held in response to discontent in the industry that levies were not delivering
benefits to the industry, particularly because their investment failed to address issues that led to the
live-export ban.
The inquiry delivered its findings in September 2014, recommending the formation of a producer-
owned body (possibly by reforming CCA) to receive and disperse the research and development and
marketing components of levies paid by cattle producers and processors and matching government
contributions. It also recommended that RMAC be replaced by a new system to manage and disperse
earnings from the Red Meat Industry Reserve Fund; and that private contributions to MLA no longer
attract matching government contributions. It also recommended transparency and efficiency of levy
collection be improved; allocation of voting rights according to levy payments; and consideration be
given to legislation to improve transparency in pricing and trade practices.
In a dissenting report321, Senator Ian MacDonald argued for retention of the current system and
organisations, instead arguing for improving the value of the current system to producers of grass-fed
cattle by increasing their representation on MLA’s board of directors, and allocating a proportion of
levies to CCA for strategic development.

91 | P a g e
State farming organisations
State/territory farming organisations (SFOs) are the recognised peak bodies representing pastoralists’
interests. SFOs representing the interests of the northern beef industry are AgForce, Northern
Territory Cattlemen’s Association, Pastoralists and Graziers Association of Western Australia, and
WAFarmers. These organisations advocate on behalf of the northern beef industry to further its
economic viability and sustainability in a range of policy areas, including:
Regulation reform, including more flexible lease and operating conditions
Trade, market access
Marketing, labelling, food safety, standards and quality assurance
Improvements to transport and infrastructure
Disaster relief
Animal health and biosecurity
Technological innovation and identification of improved practices
Land-use diversification
Industry leadership and succession
Targeted RD&E.
SFOs advocate for policy development in these areas by directly lobbying state/territory governments
and the Australian Government and through submissions to government inquiries and participation
on advisory committees. They also contribute to policy indirectly through their membership of higher-
level representative bodies, notably CCA, which reports to the Australian Government through RMAC.
While industry viability is a core interest of SFOs, these organisations do not appear to have a fixed
opinion on the size of the industry or the number of cattle required to achieve sustainability in the
north. Instead, they actively assist development of best-practice codes and adoption of management
practices to improve productivity and profitability.
SFOs also influence the direction of beef industry research and development in the north through their
participation in NABRC. Both RMAC and NABRC were members of the Northern Beef Industry Working
Group (NBIWC), an advisory body set up by NAMF to “provide coordinated advice on developing the
northern Australia beef industry based on the range of initiatives committed, or being advanced, by
Australian Government agencies, the northern jurisdictions and the industry”310. Hence SFOs are key
drivers to the direction of the beef industry in northern Australia. In recent years, they have been
particularly active in representing pastoralists’ interest in the live-export market; lease renewal

92 | P a g e
arrangements; vegetation management; and food labelling. In Queensland, AgForce has also been
central in supporting the development and delivery of best management practice adoption through
the Grazing BMP324.
Financial institutions
Most producers across the north have mortgages with banks (see Profitability). High debt levels across
the industry mean that mortgages must be regularly renegotiated with the banks, with renewal often
being conditional on specific practices being undertaken, including stocking regimes. Pastoralists in
debt are likely to overstock their properties in an attempt to service their loans325, and in the Burdekin
it has been shown that, on average, as farm debt increases, grass cover decreases326. However, there
is no evidence that banks insist on unsustainable stocking rates. Rather, the drive to repay loans may
be an incentive for pastoralists to overstock in the short-term despite the long-term degradation that
will result327,a. A high level of dependence on the volatile live-export cattle trade exposed many
producers to high debt-servicing costs, with some having to pay interest rates that were up to 2%
higher than those paid by neighbouring producers51.
Banks also have a role in advising investors about the viability of prospective investments. In 2014,
ANZ commended the incorporation of irrigated pasture crop into northern beef operations, but was
dismissive of the economic viability of developing a new grain and oilseed industry in the north328.
Such recommendations are likely to affect the capacity of these developments to attract investors.
Research organisations
Numerous organisations undertake, fund, facilitate and communicate research to support the
northern beef industry (Figure 35), and can, therefore, have an impact on the direction the industry
takes. Key research findings and their adoption by the industry are detailed in earlier sections this
report (see Practice improvement). Beef industry research has focused on:
Improving animal health and performance
Improving land condition and minimising environmental impacts
On-property management to improve enterprise viability
Improving greenhouse gas (GHG) budgets
a http://www.abc.net.au/news/5969748

93 | P a g e
Supply chain development to reduce costs and improve industry viability
Diversification options.
MLA is central to the majority of industry-related research, development and extension. Rural
Industries Research and Development Corporation (RIRDC) also funds research into expanding
pastoralism into non-traditional areas, such the development of Indigenous pastoralism. NABRC helps
these organisations define research priorities for northern Australia (Table 25). NABRC holds
conferences every few years to showcase northern research. The Australian Rangelands Society (ARS)
publishes much of the research that is relevant to the northern cattle industry, and holds a biennial
conference at which some of this research is presented.
Through the 1990s and 2000s, cross-regional research supporting the beef industry was facilitated by
the Tropical Savannas Cooperative Research Centre (TS-CRC), in which state and territory agencies
were active participants. With the closure of CRCs, collaborative research continued, but without a
formalised structure to support or bolster cross-regional research capacity. The proposed Cooperative
Research Centre for Northern Development may fill this gap. An earlier CRC proposal (growNORTH)
included $75 m of Australian Government investment and $316 m from industry, partners and
researchers, with an estimated a gross benefit of $1,200 m to the Australian economy329. The Northern
Australian White Paper has now committed $75 m to a revised CRC model, but this funding is to be
allocated across agricultural development and tropical medicine.
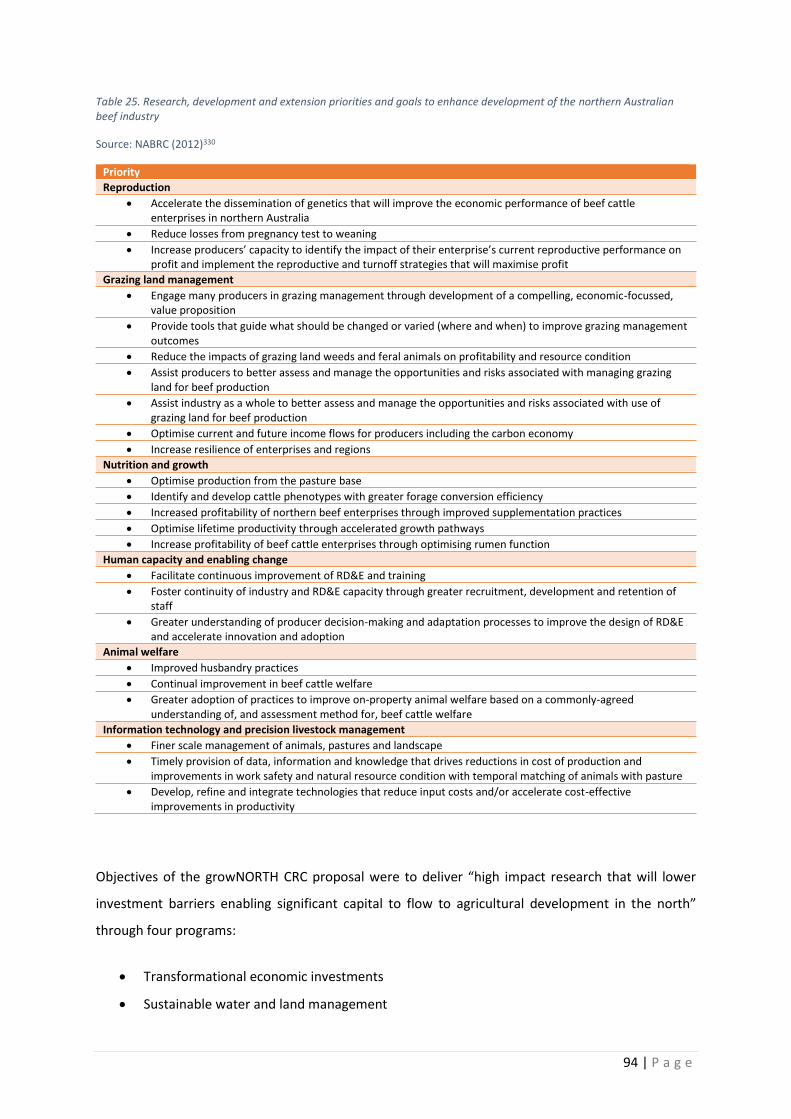
94 | P a g e
Table 25. Research, development and extension priorities and goals to enhance development of the northern Australian beef industry
Source: NABRC (2012)330
Priority
Reproduction
Accelerate the dissemination of genetics that will improve the economic performance of beef cattle enterprises in northern Australia
Reduce losses from pregnancy test to weaning
Increase producers’ capacity to identify the impact of their enterprise’s current reproductive performance on profit and implement the reproductive and turnoff strategies that will maximise profit
Grazing land management
Engage many producers in grazing management through development of a compelling, economic-focussed, value proposition
Provide tools that guide what should be changed or varied (where and when) to improve grazing management outcomes
Reduce the impacts of grazing land weeds and feral animals on profitability and resource condition
Assist producers to better assess and manage the opportunities and risks associated with managing grazing land for beef production
Assist industry as a whole to better assess and manage the opportunities and risks associated with use of grazing land for beef production
Optimise current and future income flows for producers including the carbon economy
Increase resilience of enterprises and regions
Nutrition and growth
Optimise production from the pasture base
Identify and develop cattle phenotypes with greater forage conversion efficiency
Increased profitability of northern beef enterprises through improved supplementation practices
Optimise lifetime productivity through accelerated growth pathways
Increase profitability of beef cattle enterprises through optimising rumen function
Human capacity and enabling change
Facilitate continuous improvement of RD&E and training
Foster continuity of industry and RD&E capacity through greater recruitment, development and retention of staff
Greater understanding of producer decision-making and adaptation processes to improve the design of RD&E and accelerate innovation and adoption
Animal welfare
Improved husbandry practices
Continual improvement in beef cattle welfare
Greater adoption of practices to improve on-property animal welfare based on a commonly-agreed understanding of, and assessment method for, beef cattle welfare
Information technology and precision livestock management
Finer scale management of animals, pastures and landscape
Timely provision of data, information and knowledge that drives reductions in cost of production and improvements in work safety and natural resource condition with temporal matching of animals with pasture
Develop, refine and integrate technologies that reduce input costs and/or accelerate cost-effective improvements in productivity
Objectives of the growNORTH CRC proposal were to deliver “high impact research that will lower
investment barriers enabling significant capital to flow to agricultural development in the north”
through four programs:
Transformational economic investments
Sustainable water and land management
95 | P a g e
Technologies for agriculture/aquaculture
Development policies and regional change.
The Northern Australia White Paper and associated CRC commitments305 made no mention of broad
landscape planning or economic development. Research programs with an environmental focus are
covered elsewhere in this document.
Extension providers
Extension is provided to the northern beef industry by a wide range of organisations (Figure 35), many
of whom also have other roles in the industry. State primary industries departments (DPIs), SFOs and
NRM groups are all involved in programs to facilitate practice improvement. This includes running land
and business management courses and best-practice frameworks, as well as managing devolved
grants to support adoption of specific technologies or land management practices.
Digital technology and social media are increasingly important in extension delivery, and have been
supported by the FutureBeef platform331. Digital technologies being adopted by the industry include
stocking rate calculators; pasture monitoring programs (e.g. Stocktake); fire mapping (North
Australian Fire Information website (NAFI)); and programs to assess the economic impacts of different
management regimes (e.g. BreedCow-Dynama)332. The most effective programs are those that involve
the pastoral managers in collecting and assessing data from their own properties, and allowing them
to compare their results with regional performance (e.g. CashCow)60.
Climate change
Concerted international efforts to avert climate change began in 1992 in the Rio Earth Summit with
the signing of the United Nations Framework Convention on Climate Change333. By signing this
convention, Australia has committed to setting policies that are climate-change aware and take
actions to minimise its contribution to climate change. Under the Kyoto Protocol (which lapsed in
2012), Australia was obliged to limit GHG emissions.
Countries attending Kyoto in 1997 committed to reducing emissions of GHGs (carbon dioxide (CO2),
methane (CH4) and nitrous oxide (N2O)) that contribute most to climate change334. Under the resultant
Kyoto Protocol, developed countries were expected to stabilise their emissions at 1990-levels by 2008-
2012. Because of its dependence on coal, Australia was given dispensation to stabilise its emissions at

96 | P a g e
108% of 1990 levels. This commitment was largely met through bans on land clearing, which resulted
in Australia’s emissions in 2007 to be calculated at 104%—rather than 125%—of 1990-levels335,336.
In 2012, the Australian Government pledged:
1. An unconditional 2020 GHG emission reduction target of 5% below 2000-levels
2. A 2020 target of 15-25% below 2000, subject to international action
3. A non-binding 2050 target of 80% below 2000 levels.
The first two commitments had bipartisan support and are now obligations under the 2012 Doha
amendment to the Kyoto Protocol337. When Australia had an emission trading schemea, it appeared
likely to reach its unconditional target, but not its conditional one339,340. The energy sector lobbied
hard against these targets341. Carbon pricing has since been abandoned in Australiab and the
Renewable Energy Target (RET) settled at 33,000 GWh by 2020 (ca. 23.5% by 2020)342. However,
climate policy is still in a state of flux, and even industry believes that carbon pricing is likely be
reinstated343.
Australian Government legislation relating to climate change includes:
National Greenhouse and Energy Reporting Act 2007 (Cth)
Establishes the framework reporting greenhouse gas emissions, greenhouse gas projects and
energy consumption and production by corporations in Australia
Clean Energy (Consequential Amendments) Act 2011 (Cth)
Ensures carbon pricing is integrated with existing regulatory schemes and processes,
including the National Greenhouse and Energy Reporting scheme, the Carbon Farming
Initiative (CFI), the Australian National Registry of Emissions Units, the regulation of financial
services and competition and consumer laws
A host of Acts that regulate markets for clean energy, greenhouse gasses and ozone
Climate Change Authority Act 2011 (Cth)
Establishes the Climate Change Authority to conduct reviews of the Climate Change laws.
Western Australia has a climate change strategy covering mitigation and adaptation344, which includes
supporting land managers to engage in the carbon economy. The Northern Territory’s Climate Change
a with a price on carbon and a renewable energy target for electricity generation (RET) of 20% by 2020 338 b http://www.abc.net.au/news/5604246

97 | P a g e
Policy345, introduced by the Henderson government in 2009a, was discontinued by the current Country
Liberal Party Government.
The Queensland Government’s climate change initiatives were dismantled by the Newman
government and are being revitalised by the Palaszczuk government. Emerging adaptation and
mitigation commitments include:
A Queensland Climate Change Adaptation Strategy
A Climate Change Coastal Hazard Adaptation Program
Reinstating world class coastal planning laws
Reducing GHG emissions and supporting increased use of renewable energy.
One aspect of carbon policy that has so far survived through this period of instability has been an
Australian Government commitment to land sector participation in the carbon economy through the
Emission Reduction Fund (ERF)b. The ERF enable pastoralists to derive income from accredited options
for GHG sequestration and abatement (see Greenhouse gas budgets).
Producers have mixed opinions about climate change, but none dispute the impact of on-going climate
extremes. However, at least one group of farmers is concerned about climate change and has written
an open letter asking for politicians to take action on climate change (Box 1).
a Which included support for carbon abatement and capture by land management sector b Which replaced the CFI in 2014 under the Carbon Credits (Carbon Farming Initiative) Act 2011 (Cth) 346
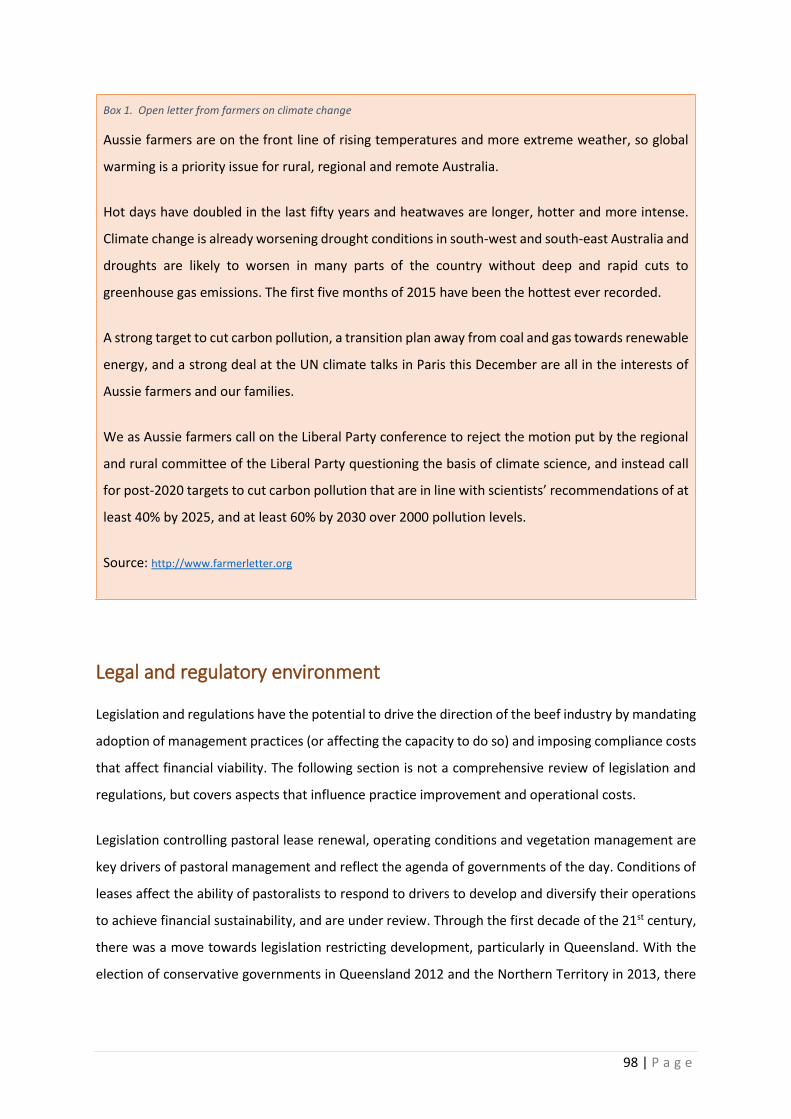
98 | P a g e
Box 1. Open letter from farmers on climate change
Aussie farmers are on the front line of rising temperatures and more extreme weather, so global
warming is a priority issue for rural, regional and remote Australia.
Hot days have doubled in the last fifty years and heatwaves are longer, hotter and more intense.
Climate change is already worsening drought conditions in south-west and south-east Australia and
droughts are likely to worsen in many parts of the country without deep and rapid cuts to
greenhouse gas emissions. The first five months of 2015 have been the hottest ever recorded.
A strong target to cut carbon pollution, a transition plan away from coal and gas towards renewable
energy, and a strong deal at the UN climate talks in Paris this December are all in the interests of
Aussie farmers and our families.
We as Aussie farmers call on the Liberal Party conference to reject the motion put by the regional
and rural committee of the Liberal Party questioning the basis of climate science, and instead call
for post-2020 targets to cut carbon pollution that are in line with scientists’ recommendations of at
least 40% by 2025, and at least 60% by 2030 over 2000 pollution levels.
Source: http://www.farmerletter.org
Legal and regulatory environment
Legislation and regulations have the potential to drive the direction of the beef industry by mandating
adoption of management practices (or affecting the capacity to do so) and imposing compliance costs
that affect financial viability. The following section is not a comprehensive review of legislation and
regulations, but covers aspects that influence practice improvement and operational costs.
Legislation controlling pastoral lease renewal, operating conditions and vegetation management are
key drivers of pastoral management and reflect the agenda of governments of the day. Conditions of
leases affect the ability of pastoralists to respond to drivers to develop and diversify their operations
to achieve financial sustainability, and are under review. Through the first decade of the 21st century,
there was a move towards legislation restricting development, particularly in Queensland. With the
election of conservative governments in Queensland 2012 and the Northern Territory in 2013, there

99 | P a g e
has been a move to self-assessment of activities associated with pastoral purposes, with permits being
largely restricted to non-pastoral activities or for high value conservation areas.
Legislation and regulations are imposing increasing obligations on pastoralists with respect to the
treatment of livestock and wages and conditions. There is general recognition for the need to maintain
standards in these areas, but also of the financial and transactional costs of complying with these
regulations. This is reflected in policies labelled “red tape reduction” that aim to assist industry
development in the north (see Policy environment).
Tenure and Native Title
Cattle grazing occurs on a number of tenures across northern Australia, including pastoral and
perpetual leases, freehold and Indigenous lands. However, the vast majority of grazing in the
Monsoonal North occurs on pastoral leases (see Land use and tenure). Security of tenure affects a
cattle operation’s capacity to obtain finance. This becomes more difficult approaching the end of the
lease tenure, and pastoralists may become reluctant to make improvements—and financial
institutions to underwrite them347. Also, current tenure arrangements discourage diversification into
non-pastoral pursuits, at least in Western Australia (see Diversification). Recent recognition of the
limited management options on pastoral leases has led to a widespread review of tenure and lease
renewal arrangements347-351.
Properties that are not subject to Native Title can be sold, subleased or used as security for loans or
converted to a new tenure type351. Most pastoral leases coexist with Native Title352, which restricts
land use diversification whether the land is owned by Indigenous or non-Indigenous people353. The
Native Title Act 1993 (Cth) guarantees that a pastoral lease can be renewed without compensation
being paid to the Native Title holders354. However, it does not guarantee rights to non-pastoral uses
on pastoral leases, and the rights of Native Title holders must be met before such permits can be
granted. Tenure conversion for the purposes of land use diversification would require the unlikely
repeal of the Racial Discrimination Act 1975 (Cth) to enable Native Title to be extinguished355, so a
negotiated outcome is probably the only option. This is usually achieved through an Indigenous Land
Use Agreement (ILUA) to be negotiated. ILUAs cover the use of, and access to, traditional land and
waters356 and have been negotiated over pastoral properties in all three jurisdictions.

100 | P a g e
Table 26. Rights and responsibilities associated with grazing land tenures in Queensland
Source: Adapted from Holmes (2014)355 ©2014 Institute of Australian Geographers
* = subject to lease conditions
Freehold
Grazing Homestead Perpetual lease Pastoral lease
Landholder rights relevant to use of land and related resources
Graze livestock Yes Yes Yes
Cultivate land Yes No No
Introduce plant species Yes No No
Clear vegetation Yes No No
Take timber Yes No No
Ownership of water No No No
Ownership of minerals No No No
Ownership of wildlife No No No
Exclusive occupation (Native Title extinguished) Yes Yes No
Use at discretion of titleholder Yes No No
Landholder responsibilities and duties
Develop and maintain improvements No * *
Be in residence No * No
Maintain stock numbers above a prescribed minimum No * *
Duty of care for the land No Yes Yes
Control stocking levels No * *
Engage in property planning No * *
Tenure security and transferability
Perpetual title awarded Yes Yes No
Unrestricted transferability Yes No No
Unlimited right to subdivide Yes No No
Unlimited right to aggregate Yes No Yes
Surrender of some land on lease expiry No No Yes
Liability to forfeiture No Yes Yes
Landholder financial and other obligations
Payment of rent No Yes No
Accountability to QDNRM No Yes Yes
Different approaches to realising diversification ambitions are appropriate under different
combinations of lease ownership and Native Title rights. In the North Kimberley and to the west of the
Gulf of Carpentaria, where Indigenous landholdings predominate, there is potential to reform land
tenure while consolidating Indigenous rights, as has occurred on Cape York Peninsula (Figure 37)355.
Elsewhere in the Monsoonal North, it is likely that pastoral intensification will take precedence over
Indigenous rights, but diversification to other forms of land uses remain uncertain.

101 | P a g e
Figure 37. Potential recognition of Native Title on pastoral leases in relation to assumed level of Aboriginal connection to the land
Source: Holmes (2014)355 ©2014 Institute of Australian Geographers
Zone A: Limited ongoing connection to land; Limited recognition of Native Title rights; Protection of sacred sites with negotiated access. Zone B: Extensive ongoing connection to land; Native Title rights recognised but curtailed by ongoing development; Rights of access and traditional use under extensively managed areas. Zone C: Widespread, ongoing physical and spiritual connection; Widespread recognition of Native Title rights assured by limited scope for agricultural development; Comprehensive restructuring of land tenure and use through negotiated regional agreements.
Environmental management
As with all industries, beef operations are subject to environmental legislation protecting threatened
species and ecosystems and heritage sites at both the national and state/territory level.
Environmental matters are most likely to come into play when new developments are proposed.
Australia is a signatory to the international Biodiversity Convention 1992357, which aims to ensure
conservation and sustainable and equitable use of biological diversity. In signing this convention,
Australia has agreed to institute measures to protect biodiversity, including through a protected area
estate and management of environmental values outside that estate. Each Australian jurisdiction has
a different process by which environmental matters are managed. Relevant legislation includes the
Environment Protection and Biodiversity Conservation Act 1999, Wildlife Conservation Act 1950 (WA),
Territory Parks and Wildlife Conservation Act (NT), and the Nature Conservation Act 1992 (Qld). Each
of these Acts and their associated regulations provide a list of threatened species and ecosystems that
are a priority for conservation management, as well as threats that need managing and mechanisms
for doing so. Each jurisdiction has a range of environmental policies through which environmental
damage can be avoided and addressed.
102 | P a g e
This hierarchy of laws, regulations and policies has implications for pastoralism, including through
promotion or imposition of sustainable management of resources and control of weeds and pest
animals, and restriction of vegetation clearance (see Land clearing). Alongside regulation, mechanisms
are also provided for payment for environmental services as a means to incorporate biodiversity
conservation into commercial enterprises. These shift the emphasis from penalising pastoralists for
the presence of threatened species or ecosystems on their land by resuming land or restricting
development to rewarding them for good environmental management that protects biodiversity
values.
Mechanisms also exist for conservation agreements in each state and territory. These agreements
generally involve the landholders voluntarily entering into an agreement to protect sections of the
property in return for fencing (see Environmental service delivery). Conservation agreements may be
entered into by landholders in return for a development approval, or as a means of delivering an
environmental benefit or offset sought by the Australian Government, or a state or territory
government. NRM groups may be closely involved in negotiating conservation agreements. However,
the relevant pastoral lands Acts (see Tenure and Native Title) currently provide no legislative backing
for conservation reserves on pastoral leases, so conservation agreements are subject to the
indulgence of the relevant minister358, and Native Title considerations may come into play where the
conservation agreement precludes grazing over significant sections of a pastoral lease. This tension is
recognised in the Kimberley Science and Conservation Strategy359, which identifies a number of
measures required to support conservation in the region360.
Pastoral lease conditions
The duration of pastoral leases varies across the three jurisdictions. Under the Pastoral Land Act (NT),
pastoral leases in the Northern Territory may be extended for a period of up to 25 years and renewed
within two years of expiry. In Western Australia, the Lands Administration Act 1997 (WA) stipulates
that the duration of a new pastoral lease over a property must be no more than that of the pre-existing
lease (between 18 and 50 years), with the right to renew specified in the lease350. Amendments to the
Queensland Lands Act 1994 in 2007 introduced a stepped renewal process (which came to be known
as the Delbessie process) in which all pastoral leases could be renewed for 30 years, with an addition
of 10 years where the land was assessed to be in good condition; and a further 10 years where an
Indigenous Land Use Agreement (ILUA) and a conservation agreement or covenant were in place. The
Queensland Lands Act 1994 was further amended in 2014 to remove the stepped renewal process and
requirements for ILUAs, and conservation and land management agreements. Queensland pastoral
103 | P a g e
leases can now be extended (rolled over) for a period equivalent to the original term of that lease (but
for no more than 50 years), and renewal can be granted once 80% of the lease term has expired. It
remains to be seen whether the Palaszczuk government maintains these changes. Significantly,
restrictions preventing Aboriginal- and family-owned corporations from owning pastoral leases in
Queensland and individuals from holding multiple pastoral holdings were not removed until the Act
was amended in 2014361.
Conditions for the management of pastoral leases are similar under the three jurisdictions, each
requiring the lease to be used for pastoral purposes and for the leaseholder to exercise a duty of care.
Under the Northern Territory Pastoral Land Act, leaseholders are required to prevent land
degradation; participate in land condition monitoring; and improve land condition. Duty-of-care
provisions introduced in the 2007 amendments to the Queensland Lands Act 1994a were retained in
the 2014 amendments (Section 199).
In 1997, the Land Act 1933 (WA)—the Act under which pastoral leases in Western Australia were
recognised—was repealed. As a result, all pastoral leases in Western Australia (along with their
mortgage interests) expired on 30 June 2015 and had to be renewed362. The replacement Act, Lands
Administration Act 1997 (WA) stipulates that a pastoral lease must be managed “to its best advantage
as a pastoral property” and pastoralists must use “methods of best pastoral and environmental
management practice, appropriate to the area where the land is situated, for the management of
stock and for the management, conservation and regeneration of pasture for grazing”. In preparation
for lease renewal, the Western Australian Government issued new lease documents describing these
duty-of-care obligations in detail. Pastoralists and their representative bodies objected to these
conditions. Most contentious was the strengthening of obligations for the leaseholder to meet,
monitor and report on environmental conditionsb. In responses to these and other concerns, the
Department of Lands offered pastoralists the option of new leases on “substantially the same
conditions” as the expiring leases. However, this is more form than function, as the conditions of Lands
Administration Act 1997 (WA) apply to all leases, regardless of what is contained in the lease papers.
Land condition monitoring has historically been undertaken by the Western Australian Rangeland
Monitoring System (WARMS) in Western Australia363,c and the Two Tier Land Monitoring in the
a in relation to land salinisation; soil and water resources; riparian vegetation; perennial and productive pastures; woody thickening of grasslands; declared pests; and biodiversity conservation b http://www.abc.net.au/news/5061552 c 6th WARMS assessment completed in 2011364
104 | P a g e
Northern Territorya. While legal mechanisms for biodiversity protection are theoretically in place, the
capacity to assess conservation impact is minimal. There is no formalised monitoring system in
Queensland, although condition assessment methods have been developed for both pastoral land
condition366 and biodiversity367. Across the region, there has been a move to transfer the responsibility
of monitoring pastoral land condition to the pastoral leaseholder, who is unlikely to have the capacity
to do so.
Water
All rights to water and its use, flow and control are vested in the relevant state or territory
government. In Western Australia, the agency responsible for water is the Department of Water; in
Northern Territory, the Department of Land and Resource Management; and in Queensland, the
Department of Natural Resources and Mines. In Queensland, water quality and environmental values
are the responsibility of the Department of Environment and Heritage Protection. The relevant
legislation is the Rights in Water & Irrigation Act 1914 (WA), Water Act (NT), Water Act 2000 (Qld),
and Environment Protection Act 1994 (Qld). These Acts stipulate the purposes for which water can be
taken without a specific authorisation being granted (Table 27); the conditions that must be met for
an authorisation to be approved; and the conditions that can be imposed on any authorisation. Where
a water allocation is granted, the volume of water is not guaranteed in times of low water availability.
a Tier One involves on-ground monitoring and Tier Two uses remote sensing to assess changes in land condition365

105 | P a g e
Table 27 Rights to take for various uses across the Monsoonal North without a permit
Sources: Rights in Water & Irrigation Act 1914 (WA); Water Act (NT); Water Act 2000 (Qld); Environment Protection Act 1994 (Qld)
NB: “Yes” indicates that water rights exist to take or interfere with water without a special authorisation being granted. In all other cases, an application for an authorisation (licence, permit or water allocation) is required
Activity Capture environment Purpose Region
Kimberley Top End/ Gulf
Savanna Queensland Gulf/
Burdekin
Take water Watercourse
Non-intensive grazing Yes Yes Yes
Agriculture - - -
Mining - Yes -
Construct dam
Overland flow – not on a permanent watercourse
Non-intensive grazing Yes Yes Yes
Agriculture - Yes -
Mining - Yes -
In-stream flow –water-course, waterhole, lake or spring
Non-intensive grazing - - -
Agriculture - - -
Mining - Yes -
Divert drainage
Watercourse
Non-intensive grazing - - -
Agriculture - - -
Mining - - -
Sink bore Groundwater
Non-intensive grazing - Yes Yes
Agriculture - - -
Mining - Yes Yes
Western Australia and Queensland have designated water management areas, which are covered by
specific water management plans defining water licencing and allocation arrangements (Canning-
Kimberley and Broome Groundwater Management areas; and Ord and Le Grange Surface Water
Management Areas in Western Australia; and Burdekin Basin and Gulf Water Management Areas in
Queensland).
Across the Monsoonal North, pastoralists can water their stock using water from watercourses on or
adjoining their property, or from a dam that traps overland flow on that property without a specific
authorisation. In Queensland and the Northern Territory, pastoralists may also extract and use
groundwater without a permit. A specific authorisation must be obtained for extracting groundwater
in Western Australia, and for constructing a dam on a watercourse in all three jurisdictions.
Water rights for grazing livestock are generally more liberal than are those for agriculture (for which
authorisation is required for most uses), but more stringent than are those for mining. In the Northern
Territory, miners can capture, use and store water without any specific authorisation. In Queensland,
mining, petroleum and gas companies can divert watercourses and take groundwater from a bore
sunk by a landholder, subject to make-good arrangements and identification and monitoring of
impacts. Under the Water Act 2000 (Qld), make-good arrangements should ensure that the owners of

106 | P a g e
bores in the “immediately affected and long-term affected areas” have access to adequate water
supplies. These areas (and, therefore, affected landholders) must be identified in an Underground
Water Impact Report (UWIR) (see Legal and regulatory environment: Mining). A water management
plan must also be prepared explaining the treatment of water generated in CSG production (see
Mining). Hence, while the legislation aims to minimise its impact on pastoral agricultural land use,
miners can access any water resource on a pastoral property. In a case objecting to the Alpha Coal
Mine proceeding in the Galilee Basin included that impacts of the mine on groundwater may not be
reliable (particularly in relation to the impacts of multiple mines), and so make-good arrangements
were inadequatea. The Queensland Land Court agreed with this assessment, and recommended that
the mine not be approved until corrections were made to the impact assessment368.
Land clearing
Pastoral operations rely on productive pastures. The majority of the Monsoonal North is native
pasture, but operations are increasingly developing parts of their properties to improve viability (see
Diversification). Developments such as mosaic irrigation of pasture crops will require vegetation
clearance59. Moreover, thinning may be required to restore the productivity of vegetation that has
been degraded by woody thickening using fire or other means272-274,369,370. Pastoralists may also wish
to clear vegetation to establish introduced pasture species to improve productivity. Each jurisdiction
has controls on where and how much clearance can occur. Land clearing legislation varies between
jurisdictions, and has seen momentous changes over the last decade. In their current form, regulations
have converged between the three jurisdictions, with an increasing emphasis on self-assessment and
facilitation of clearing for pastoral-related activities.
In Western Australia, land on a pastoral lease may be cleared without a permit for purposes that are
consistent with the lease conditions (Table 28) as long clearing is done in accordance with the Best
Management Practice guidelines produced by the Pastoral Lands Board371. Clearance and other
activities consistent with pastoral uses may be permitted as long as they comply with the
requirements of environmental legislation, including the Biosecurity and Agriculture Management Act
2007 (WA); the Environmental Protection Act 1986 (WA); the Soil and Land Conservation Act 1945
a http://www.abc.net.au/news/6867330

107 | P a g e
(WA); and the Wildlife Conservation Act 1950 (WA). Leaseholders clearing land without correct
permissions have recently been prosecuteda.
Table 28. Conditions for vegetation management for pastoral purposes in Western Australia
Source: Anon. (2007)371 http://www.lands.wa.gov.au/Pastoral-Leases
Purpose of vegetation clearance
Permit not required
Manage and work the land under the lease to its best advantage as a pastoral property
Pastoral improvements, including fences
Fire suppression or fuel hazard reduction
Permit required
Other purposes
Sowing or cultivation of introduced pasture species
Use of land for crop, fodder, horticultural or other specified kind of agricultural production if the proposed use is reasonably related to the pastoral use of the land
Low-key pastoral-based tourism
In the Northern Territory, the Pastoral Land Act stipulates that pastoralists may clear vegetation
without a permit for activities required for pastoral operations (Table 29). Permits are required for
clearing or vegetation thinning for all other purposes. Applications for permission to clear vegetation
must include information on potential impacts of the clearing (and how they intend to mitigate them)
in relation to native flora and fauna; soils, surface water and ground water; heritage and Aboriginal
sacred sites; and greenhouse gas emissions, paying particular regard to impacts that may cross
property boundaries. Applications for non-pastoral uses must comply with the Native Title Act 1993
(Cth) and Native Title holders having the right to object.
Table 29. Conditions for vegetation management for pastoral purposes in the Northern Territory
Source: http://www.lrm.nt.gov.au/
Purpose of clearance
Permit not required
Vegetation clearance for infrastructure development
Vegetation clearance for cutting of hay from native pasture
Maintaining areas from which vegetation had been cleared under a permit obtained after 1992
Permit required
Vegetation clearance or thinning for other purposes
Use of pastoral lease for non-pastoral purposes (e.g. forestry, horticulture, agriculture, tourism)
Not covered in lease conditions
Sow or cultivate introduced pasture species
a http://www.abc.net.au/news/6309098
108 | P a g e
The Vegetation Management Act 1999 (Qld) was amended in 2004 with the aim of phasing out
broadscale clearing of remnant vegetation by 2006a. In 2009, the Act was amended to include
protection of high value regrowth (i.e. regrowth not cleared since 31 December 1989) as well as
regrowth vegetation adjacent to watercourses in the Burdekin, Mackay-Whitsundays and the Wet
Tropics catchments, as these drain to the Great Barrier Reef. From mid-2014, Queensland landholders
have been able to clear native vegetation for most pastoral purposes, using self-assessable codes and
submitting a notification form (Table 30). Clearing for environmental works can also be conducted
under a self-assessable code, enabling the clearing of native vegetation where clearing is necessary to
restore the environmental condition of the land or prepare for a natural disaster. However,
restrictions are still in place for vegetation with recognised conservation value. The Palaszczuk
government came to power promising to re-introduce strict tree clearing lawsb, although such changes
face stiff oppositionc.
a Vegetation Management and Other Legislation Amendment Bill 2004 (Qld) b http://www.abc.net.au/news/6032484 c http://www.abc.net.au/news/6280876; http://www.abc.net.au/news/6892172
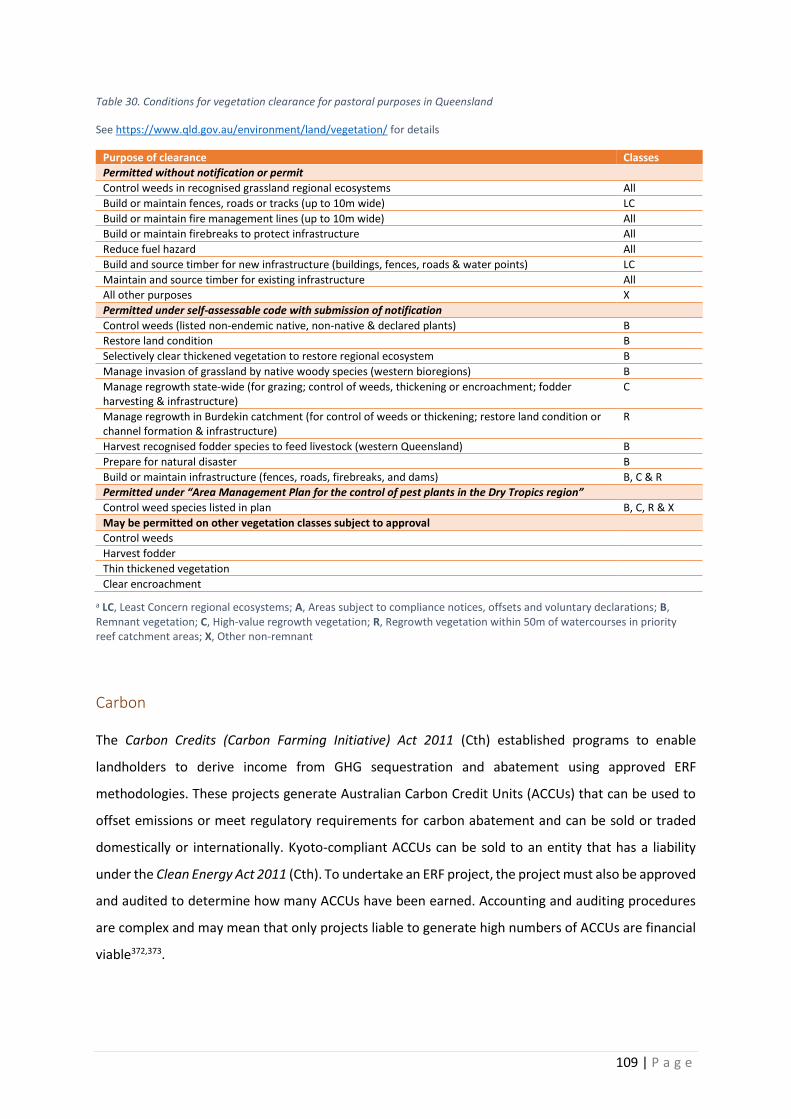
109 | P a g e
Table 30. Conditions for vegetation clearance for pastoral purposes in Queensland
See https://www.qld.gov.au/environment/land/vegetation/ for details
Purpose of clearance Classes
Permitted without notification or permit
Control weeds in recognised grassland regional ecosystems All
Build or maintain fences, roads or tracks (up to 10m wide) LC
Build or maintain fire management lines (up to 10m wide) All
Build or maintain firebreaks to protect infrastructure All
Reduce fuel hazard All
Build and source timber for new infrastructure (buildings, fences, roads & water points) LC
Maintain and source timber for existing infrastructure All
All other purposes X
Permitted under self-assessable code with submission of notification
Control weeds (listed non-endemic native, non-native & declared plants) B
Restore land condition B
Selectively clear thickened vegetation to restore regional ecosystem B
Manage invasion of grassland by native woody species (western bioregions) B
Manage regrowth state-wide (for grazing; control of weeds, thickening or encroachment; fodder harvesting & infrastructure)
C
Manage regrowth in Burdekin catchment (for control of weeds or thickening; restore land condition or channel formation & infrastructure)
R
Harvest recognised fodder species to feed livestock (western Queensland) B
Prepare for natural disaster B
Build or maintain infrastructure (fences, roads, firebreaks, and dams) B, C & R
Permitted under “Area Management Plan for the control of pest plants in the Dry Tropics region”
Control weed species listed in plan B, C, R & X
May be permitted on other vegetation classes subject to approval
Control weeds
Harvest fodder
Thin thickened vegetation
Clear encroachment
a LC, Least Concern regional ecosystems; A, Areas subject to compliance notices, offsets and voluntary declarations; B, Remnant vegetation; C, High-value regrowth vegetation; R, Regrowth vegetation within 50m of watercourses in priority reef catchment areas; X, Other non-remnant
Carbon
The Carbon Credits (Carbon Farming Initiative) Act 2011 (Cth) established programs to enable
landholders to derive income from GHG sequestration and abatement using approved ERF
methodologies. These projects generate Australian Carbon Credit Units (ACCUs) that can be used to
offset emissions or meet regulatory requirements for carbon abatement and can be sold or traded
domestically or internationally. Kyoto-compliant ACCUs can be sold to an entity that has a liability
under the Clean Energy Act 2011 (Cth). To undertake an ERF project, the project must also be approved
and audited to determine how many ACCUs have been earned. Accounting and auditing procedures
are complex and may mean that only projects liable to generate high numbers of ACCUs are financial
viable372,373.

110 | P a g e
To participate in (and derive income from) a carbon abatement or sequestration project, the
proponent must have a carbon right over the land on which the project occurs. Under the Carbon
Rights Act 2003 (WA) a pastoral leaseholder in Western Australia must obtain permission from the
state governments before diversifying into carbon farming. The Act enables a carbon right to be
registered on the land title as a separate interest in that land, and allows for a covenant to protect the
carbon to be drawn up between the person with the carbon rights and other interested parties.
In Queensland, the situation is far more complex, but a pastoral leaseholder must also gain permission
from the relevant minister(s) before entering into a carbon abatement project. The Forestry Act 1959
(Qld) and the Nature Conservation Act 1992 (Qld) endow ownership of all forest products on Crown
Land and all natural resources (including carbon) in the state, but enable leaseholders to apply for a
right to abate carbon on their land and derive income from doing so. Carbon sequestration rights are
recognised by the Waste Reduction and Recycling Act 2011 (Qld). The Land Act 1994 (Qld) enables
carbon abatement interests to be created that enable the rights holder to carry out abatement
projects. The Land Title Act 1994 (Qld) allows carbon sequestration projects to be undertaken on
freehold land only.
The Northern Territory has no legislation to clarify carbon rights372. On pastoral leases, carbon projects
related to pastoral activities (e.g. reducing methane emissions from livestock) should be allowable
without specific permission being granted. Non-pastoral activities require permission of the Pastoral
Lands Board, which has so far provided no impediment to Savanna Burning projects. A more
comprehensive review of the legislation covering carbon rights in all jurisdictions can be found in Dore
et al372.
Reef regulations
Under the Environmental Protection Act 1994 (Qld) and the Chemical Usage Act 1988 (Qld), grazing
properties larger than 2,000 ha in the Burdekin and other catchments draining to the Great Barrier
Reef are required to manage their properties to minimise reef pollution374. Under this legislation,
which came into force in 2010, Burdekin graziers must prepare environmental risk management plans
(ERMPs) explaining how they intend to maintain ground cover and land condition in order to reduce
erosion and runoff from their paddocks, and limit the impacts of chemicals (especially Tebuthiuron,
which is used for tree clearing). Graziers must also report annually on their ERMP implementation. By
July 2011, 319 Burdekin graziers had ERMPs in place and 200 had been granted extensions375.
Following the change of government in 2012, pastoralists could elect to either continue with the ERMP

111 | P a g e
process or enter into the Grazing Best Management Practice (BMP) program324. A taskforce has been
set up to determine the direction of reef protection under the Palaszczuk government and advise on
whether a regulatory approach should be reintroduced 376.
Pest, weed and disease management
Under state and territory legislationa, landowners are responsible for managing declared weeds and
pest animals on their properties. Obligations vary with the perceived severity of the threat posed,
ranging from not to introduce, through keep under control, through to eradicate. Producers are also
responsible for detecting and reporting diseases affecting animals in their careb. Costs of disease,
weeds and pest animals to the beef industry and of their control are covered elsewhere in this
document (see Pests and diseases).
National Livestock Identification System
State and territory regulationsc require pastoralists across northern Australia to microchip their cattle
using tags linked to the National Livestock Identification System (NLIS) in order to assist tracing of
cattle during disease and food incidents and, more recently, through the live-export chain. NLIS tags
cost around $3.50 each, set-up costs amount to between $5,000 and $10,000 and processing costs
are minimal377.
Animal health and welfare
Animal welfare codes covering cattle have been in place at state, territory and federal levels since
1983378. Standards and codes of practice govern animal welfare during routine animal management
and transportation are policed by state and territory governments44. Australian Animal Welfare
a Western Australia: Biosecurity and Agriculture Management Act 2007; Northern Territory: Weeds Management Act and Territory Parks and Wildlife Conservation Act; Queensland: Land Protection (Pest and Stock Route Management) Act 2002 b Western Australia: Biosecurity and Agriculture Management Act 2007; Northern Territory: Livestock Act; Queensland: Stock Act 1915 c Western Australia: Biosecurity and Agriculture Management (Identification and Movement of Stock and Apiaries) Regulations 2013 under the Biosecurity and Agriculture Management Act 2007; Northern Territory: 2013 amendments to the Livestock Regulations under the Livestock Act; Queensland: Stock Identification Regulation 2005 under the Stock Act 1915

112 | P a g e
Standards and Guidelines for Cattle were developed in 2014 and are awaiting endorsement from state,
territory and Australian agriculture ministers379. These standards cover:
Feed and water
Risk management of extreme weather, natural disasters, disease, injury and predation
Facilities and equipment
Handling and management
Castration, dehorning and spaying
Breeding management
Feedlots
Slaughter.
The cost of implementing these standards, which were widely endorsed by the industry, has been
estimated at $1.90 per animal380. The animal welfare lobby proposed more stringent standards, which
were estimated to cost an additional $41.46 per animal, but these were not adopted.
The Primary Industries Ministerial Committee has recently endorsed Australian Animal Welfare
Standards and Guidelines — Land Transport of Livestock381. These standards are now compulsory in
Queensland and the Northern Territory, and will be adopted in Western Australia in the near future.
These standards cover:
Stock-handling competency
Transport vehicles and facilities
Pre-transport selection of livestock
Loading, transporting and unloading.
There are additional requirements covering provision of food and water, and treatment of bobby
calvesa and pregnant or lactating cows. While these regulations have industry support, adhering to
them adds to the costs of handling cattle, which have been estimated to cost the cattle industry
between $10.8 million and $12.1 million a year382.
Following the suspension of the live-export trade with Indonesia in 2011, the Australian Department
of Agriculture introduced the Exporter Supply Chain Assurance System (ESCAS), with the aim of
a a calf that has not been weaned

113 | P a g e
improving animal welfare during transport and allowing animals to be traced through to slaughter in
the destination country47. This system covers:
Animal handling and slaughter in the importing country
Exporter-control of all arrangements for livestock transport, management and slaughter
Requirement that the exporter is able to trace cattle through the supply chain
Independent audit of the supply chain in the importing country
Compliance measures and sanctions, including revocation of export licences and non-
approval of future export applications.
In addition, exporters must comply with Australian Standards for the Export of Livestock383, covering:
Sourcing and on-farm preparation of livestock
Land transport of livestock
Management of livestock in registered premises
Vessel preparation and loading
On-board management of livestock
Air transport of livestock.
By the end of November 2014, 8 million livestock had been processed by ESCAS in 1,139 consignments
sent to 18 countries48, and 866 abattoirs and feedlots in 19 countries were certified as compliant with
the World Organisation for Animal Health animal welfare standards384. The vast majority of compliant
facilities are in Indonesia, Malaysia and Vietnam. From the 1,139 consignments, 59 breaches of ESCAS
conditions were identified, 23 of which concerned cattle. These included seven cases of confirmed
animal welfare breaches and 16 where movement of cattle to unaccredited facilities meant animal
welfare could not be assured. Action was taken to mitigate against further breaches in all cases.
Industry was largely supportive of the tightening of live export procedures, and the program has been
successful in improving animal handling385,386. However, compliance imposes a significant financial
burden, costing the Australian Government $5.7 million to administer in 2013-14 and adding between
$8 and $45 per head of cattle to the cost of live export48. There was, therefore, industry wide support
for the review of ESCAS and identification of opportunities to reduce this impost. Any modifications
to the system are yet to be determined.
114 | P a g e
Workforce management
Under the Fair Work Act 2009 (Cth), wages and conditions, including training, of pastoral workers in
the Northern Territory and Queensland are covered by the Pastoral Award (2010), with oversight by
the Fairwork Ombudsman387. In Western Australia, pastoral workers employed by corporations are
also covered by this award, but non-corporate employees are covered by the Farm Employees’ Award
1985a, with oversight by the Western Australian Industrial Relations Commission.
Occupational health and safety (OH&S) laws cover an employer’s duty of care to employees, codes of
practice, education, inspection, advice, compliance activities and prosecution388. Obligations of the
employer66 include:
Provide a safe and healthy workplace for all concerned
Institute work systems designed to prevent injury, illness and disease
Train employees to work in a safe and competent manner
Allow access to inspectors to assess compliance, investigate accidents and enforce
legislation
Include employees and their representatives in decisions regarding OH&S matters.
Workplace health and safety laws are being harmonised across Australia, with minor variations in each
jurisdiction389. Relevant legislation and regulations are the Work Health and Safety (National Uniform
Legislation) Act 2011 and the Work Health and Safety (National Uniform Legislation) Regulations in
the Northern Territory; and the Work Health and Safety Act 2011 and the Work Health and Safety
Regulation 2011 in Queensland. In Western Australia, the Occupational Safety and Health Act 1984
and the Occupational Safety and Health Regulations 1996 currently apply, but alignment with other
jurisdictions was proposed though the Work Health and Safety Bill 2014, which was tabled in the
Western Australian Parliament in October 2014. National awards and harmonisation of OH&S laws
should simplify workplace arrangements for companies operating across borders.
Labour is one of the biggest input costs in pastoral businesses, accounting for about 70% of overhead
expenses and 50% of the total expenses78. Improving wages and conditions and strengthening of
OH&S laws increases costs to pastoral enterprises and have resulted in a steady reduction in the labour
a Advice from Department of Commerce Wageline on 3 March 2015: Pastoral workers in Western Australia employed by Sole Traders or Partnerships are covered by the Farm Employees’ Award 1985, even though it expressly excludes “employees who are bound by the award of the Australian Conciliation and Arbitration Commission and known as the Pastoral Industry Award, 1965 as varied or replaced from time”. As the Pastoral Industry Award (1965) no longer exists, this exclusion does not apply.

115 | P a g e
force on pastoral stations. Before 1967, up to 200 Aboriginal stockmen were employed on the larger
cattle stations255. When Aboriginal workers were awarded equal pay in 1967, most Aboriginal
stockmen lost their jobs64. Pastoral enterprises continue to reduce the number of staff they employ,
increasingly depending on owner/manager and family to provide the workforce52. This is increasingly
difficult where there is a reliance on off-farm income, leading to financial stress and associated health
issues (see Health and well-being). On the smallest properties (with fewer than 1,000 cattle) employed
labour accounts for less than 20% of the workforce78. Even on the largest properties (more than 10,000
cattle), this figure only rises to 57%, so pastoral operations have minimal impact on regional
employment. However, finding skilled labour remains a challenge78 and will be increasingly important
if new technologies, such as mosaic irrigation are adopted59. In summary, employing staff is a
significant cost, and lack of capacity to employ skilled staff can be a barrier to innovation.
Mining
Mining is covered by a raft of legislation at national and state/territory levels (Table 31). The salient
points for mining impacts on pastoral enterprises are briefly described below. This legislation aims to
facilitate the exploitation of mineral and gas and fuel resources while safeguarding other interests,
notably environmental matters.
In almost all cases the resources are owned by the government of the state or territory in which they
are found; the exception being for uranium and other sources of atomic energy in the Northern
Territory, which are owned by the Australian Government. While Native Title extends over much of
the land in the north, it does not include rights to mineral resources, gas or fuel. So while negotiation
with Traditional Owners is required for mining to proceed where Native Title exists, that negotiation
is more about access and impact than about ownership. There are mechanisms for over-riding non-
cooperation of Native Title holders, including by extinguishing Native Title where a project is
designated of State Significance (or a Major Project in the Northern Territory) 390. Similarly, where
pastoral lease holders deny access or place unreasonable conditions on access, they can be overruled
by the relevant minister or department.
Applications for a mining exploration or extraction permit are advertised in newspapers. In
Queensland, notice is given to owners and occupiers when an application is made for mining activity
is made over their land or on adjoining land. Landholders may object to a mine’s approval. All of the
29 mining and related infrastructure developments considered by the Queensland Coordinator
General between 2005 and 2014 were approved with conditions. Objections rarely prevent a mine

116 | P a g e
proceeding on pastoral land, but result in strict conditions being imposed and/or compensation for
losses resulting from mining activity. Once a mining title is granted, requirements to inform or seek
consent of landholders vary between jurisdictions. Mining operators give written notice of intent to
enter a pastoral property over which they hold mining rights in Queensland and the Northern
Territory, but apparently not in Western Australia, although stockyards and gardens are off limits.
Exemptions are made in cases where landholders cannot be contacted or on remote sections of
Northern Territory properties, where access does not require coming in sight of the homestead.
Queensland also has a comprehensive Land Access Code, which includes everything from shutting
gates to informing land holders of all completed activities and any potential adverse impacts.
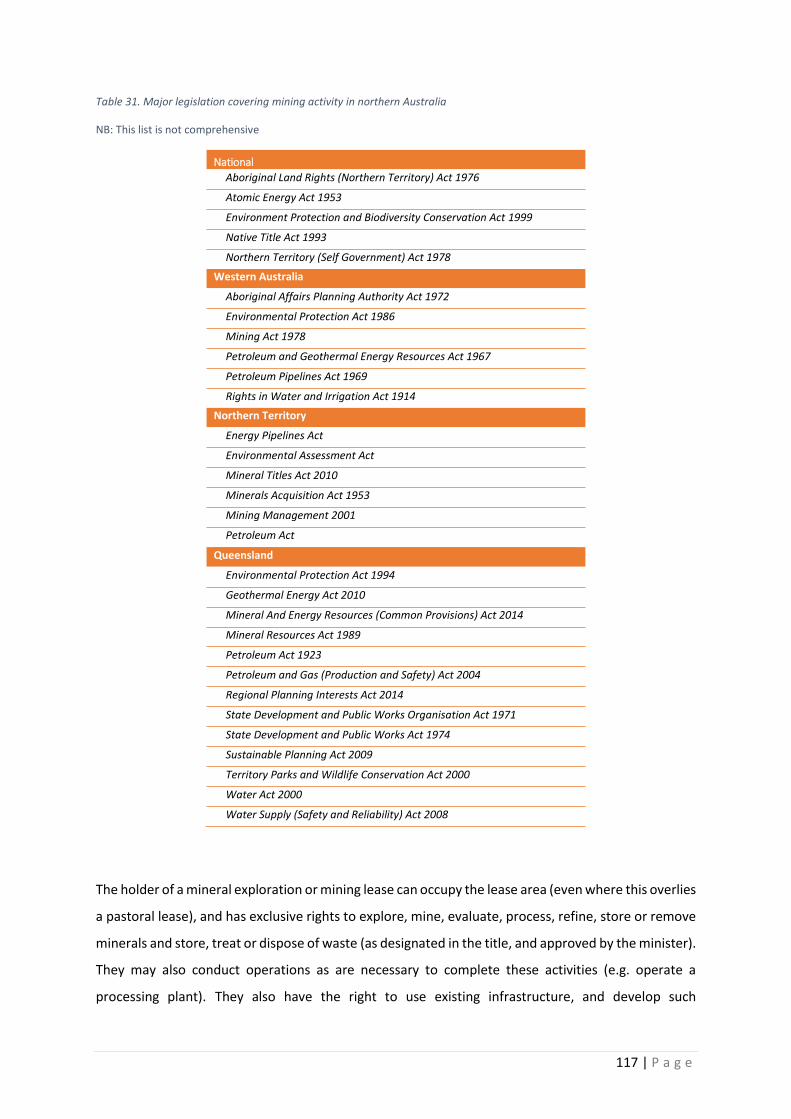
117 | P a g e
Table 31. Major legislation covering mining activity in northern Australia
NB: This list is not comprehensive
National
Aboriginal Land Rights (Northern Territory) Act 1976
Atomic Energy Act 1953
Environment Protection and Biodiversity Conservation Act 1999
Native Title Act 1993
Northern Territory (Self Government) Act 1978
Western Australia
Aboriginal Affairs Planning Authority Act 1972
Environmental Protection Act 1986
Mining Act 1978
Petroleum and Geothermal Energy Resources Act 1967
Petroleum Pipelines Act 1969
Rights in Water and Irrigation Act 1914
Northern Territory
Energy Pipelines Act
Environmental Assessment Act
Mineral Titles Act 2010
Minerals Acquisition Act 1953
Mining Management 2001
Petroleum Act
Queensland
Environmental Protection Act 1994
Geothermal Energy Act 2010
Mineral And Energy Resources (Common Provisions) Act 2014
Mineral Resources Act 1989
Petroleum Act 1923
Petroleum and Gas (Production and Safety) Act 2004
Regional Planning Interests Act 2014
State Development and Public Works Organisation Act 1971
State Development and Public Works Act 1974
Sustainable Planning Act 2009
Territory Parks and Wildlife Conservation Act 2000
Water Act 2000
Water Supply (Safety and Reliability) Act 2008
The holder of a mineral exploration or mining lease can occupy the lease area (even where this overlies
a pastoral lease), and has exclusive rights to explore, mine, evaluate, process, refine, store or remove
minerals and store, treat or dispose of waste (as designated in the title, and approved by the minister).
They may also conduct operations as are necessary to complete these activities (e.g. operate a
processing plant). They also have the right to use existing infrastructure, and develop such

118 | P a g e
infrastructure as is required for mining activities. In Queensland, the government may declare a State
Development Area (SDA) to facilitate the development of mines and associated transport corridors,
as has been done in support of the Galilee Basin coal mining projects (see Industry challenges: Mining).
Under the State Development and Public Works Organisation Act 1971 (Qld), the Queensland
Coordinator-General may compulsorily acquire land needed for private infrastructure, if agreement
cannot be reached with the land owners and/or Native Title holders.
Environmental approvals
Before a mining activity is approved in Australia, it requires an assessment of potential impacts on
matters of national environmental significance (e.g. threatened species or communities) and how any
such impacts are to be managed. For CSG and large coal mining developments, this includes impact
on water resources. The assessment process is undertaken by state and territory governments, but
the Australian Minister for the Environment uses the assessment to decide whether to approve the
mining activity.
Additional state/territory-level requirements for environmental assessments of mining activities vary
between jurisdictions. In Western Australia and Queensland, all mining proposals must include an
environmental impact assessment (EIA). In the Northern Territory, the Environment Protection
Agency (NT EPA) and Minister for Lands, Planning and Environment decide whether a mining activity
requires an EIA.
In Western Australia, the Environmental Protection Authority runs the EIA process and provides advice
on the acceptability of the mining proposal to the Minister for the Environment, who then confers
with other ministers before deciding whether the project should proceed391. In the Northern Territory,
the EIA process is run by NT EPA and the decision to approve a mining activity is made by the Minister
for Mines and Energy. In Queensland, the EIA process for most mining proposals is handled by the
Department of Environment and Heritage Protection, whose minister makes the approval decision.
However, for projects involving major infrastructure development, the Coordinator-General in the
Department of State Development runs the EIA process, and the Minister for State Development
makes the approval decision. This has been the case for all CSG projects in the Galilee Basin, along
with their associated infrastructure.
In each case, the responsible minister may impose specific conditions to safeguard environmental
values. A financial surety is usually required to cover costs of rehabilitation in the event of the

119 | P a g e
developer defaulting on these obligations. The Queensland Government monitors compliance and
environmental impacts and may impose conditions on operators to address breaches.
Requirements for EIA content and format differ between jurisdictions, but generally cover
biodiversity, biosecurity, water, atmosphere, cultural values and social factors. Assessments include a
description of values; potential impacts on them; and actions to avoid adverse impacts, and mitigate,
rehabilitate or offset unavoidable damage. In Queensland Coordinator-General Projects, both positive
and negative impacts must be assessed.
Although a separate assessment of impacts on future gas and petroleum recovery is required in
Queensland, EIAs do not cover economic values, such as pastoral values. The Regional Planning
Interests Act 2014 (Qld) aims to prevent mining or infrastructure development significantly reducing
or disrupting production of irrigated crops and pastures, but not of rangeland grazing.
The public generally has the right to comment at various stages of the EIA process, and their views
may or may not be addressed in the final decision. In all three jurisdictions, preparation of an
environmental assessment is preceded by a stage in which the terms of reference are defined, which
is open to public comment. The assessment is then prepared and may be modified at the request of
the relevant department, with each version being open for public comment. As stated above,
comments are more likely to result in conditions being placed on a mining activity, than in the proposal
being rejected.
Water resources
In Western Australia, use of water for mining activities must be licenced by the Department of
Water392. In the Northern Territory, mineral title holders can use or divert ground or surface water for
mining and exploration activities. They do not need a special permit to do so, but must include water
use and management must be included in an approved Mining Management Plan393 and is subject to
environmental assessment. They must not use water stored in dams without the landholders’ consent.
In Queensland, permits are not required to extract groundwater for use in mining, gas or petroleum
operations, and landholders are required to provide information on the property’s water supplies and
their locations to the miners. However, this right does not appear to extend to the use of dam water,
and landholders’ access to ground water must be assured.
Under the National Partnership Agreement on Coal Seam Gas and Large Mining Development394, the
Queensland Government can seek advice from the Independent Expert Scientific Committee about
120 | P a g e
the likely impact of CSG projects and large coal projects on water resources. Where significant impacts
appear likely, the proponent must also prepare an UWIR covering:
Underground water extraction
Aquifer information and underground water flow
Predicted water level declines
Water monitoring strategy (including impacts of fraccing)
Spring impact management strategy.
Any wider impacts should be addressed under the EIA. Where cumulative impact of one or more
operators is likely to occur, UWIR responsibilities are assigned to the Office of Groundwater Impact
Assessment, in the Department of Natural Resources and Mines.
CSG proposals must include a water management plan covering the amount and quality of water
expected to be generated; how it is to be treated, stored, used and disposed of; and monitoring and
management when acceptable levels are breached. Objections to a mining proposal being approved
because of impacts on water resources or inadequacy of impact assessment are heard by the
Queensland Land Court.
Practice improvement
Identification and uptake of practice improvement
The impetus for practice improvement in northern beef production is the need to improve profitability
and sustainability. Inefficient herd management (especially retention of animals regardless of their
contribution to turn-off) leads to poor performance and profitability, as well as unnecessarily high
stocking rates and elevated carbon emissions44,395. Research and extension has identified where
inefficiencies exist and how they can be overcome.
Extensive research has shown that reproductive performance can be improved through herd
management, vaccination, supplementary feeding and matching stocking rate to long-term carrying
capacity92. Many of these improvements not only increase herd performance but also effectively
reduce stocking rates for the same level of beef production, and so have benefits to pasture
production and biodiversity396,397. Improving efficiency of livestock production should also reduce
emissions at the enterprise scale395. Hence, the drive to improve herd performance without increasing
stock numbers is likely to have both biodiversity and carbon benefits. Land management principles to
121 | P a g e
improve sustainability and financial viability of the northern grazing lands, are also well understood
and include managing stocking rates, resting pasture, managing fire and strategic placement of
infrastructure171. Grazing extension programs, such as Grazing Land Management courses and the
Grazing BMP, aim to increase uptake of these practices and cover all aspects of enterprise
management398,399, and have been shown to be successful at stimulating practice improvement400. The
remainder of this section details each practice change identified as having financial and or
environmental benefits and assesses the level of uptake based on pastoral surveys undertaken in the
region between 1994 and 2011/12 and the CashCow research project undertaken in 2008-2011a.
Land condition and economic returns
Good land condition (a healthy cover of perennial grasses, and minimal weeds or bare ground)
provides good quality forage to cattle through the year, and is, therefore, essential for profitable
enterprises171. Persistent overstocking causes land degradation, eliminating perennial grasses,
exposing bare ground and increasing run-off and soil erosion. Maintaining ground cover is important
for minimising soil loss from the paddock, but a good cover of deep-rooted perennial grasses is needed
to minimise the runoff responsible for gully and bank erosion402. A long-term study at Wambiana, near
Charters Towers, Queensland, demonstrated that adjusting stocking rates in response to variation in
climate280,403 not only increased profitability85,86, but also protected the grazing resource in the long-
term404 and improved conditions for biodiversity397. Adjusting stocking rates to carrying capacity
requires an assessment of forage availability171.
Adjusting the stocking rate is most easily done on backgrounding properties, where weaner steers are
purchased and grown for sale to feedlots37,403. Stocking rates can be adjusted on such properties by
reducing the number of animals purchased and increasing the number sold. However, breeding
properties are dependent on their reproductive stock to produce weaners for sale, so have less
capacity to reduce numbers, as this also reduces capacity to re-build the herd when conditions
improve. Nevertheless, modelling has also shown varying stock numbers in response to seasonal
conditions can also be profitable on breeding-finishing properties405.
a Surveys: Pilbara and Kimberley in 201028,268, in the Northern Territory in 2011-1230, in the Burdekin Dry Tropics in 2008-934 and 2010401, and in the Dalrymple region of the Burdekin Dry Tropics226. CashCow research project: Mitchell Grass region (Northern Downs) and remainder of the Monsoonal North (Northern Forest) in 2008-201160
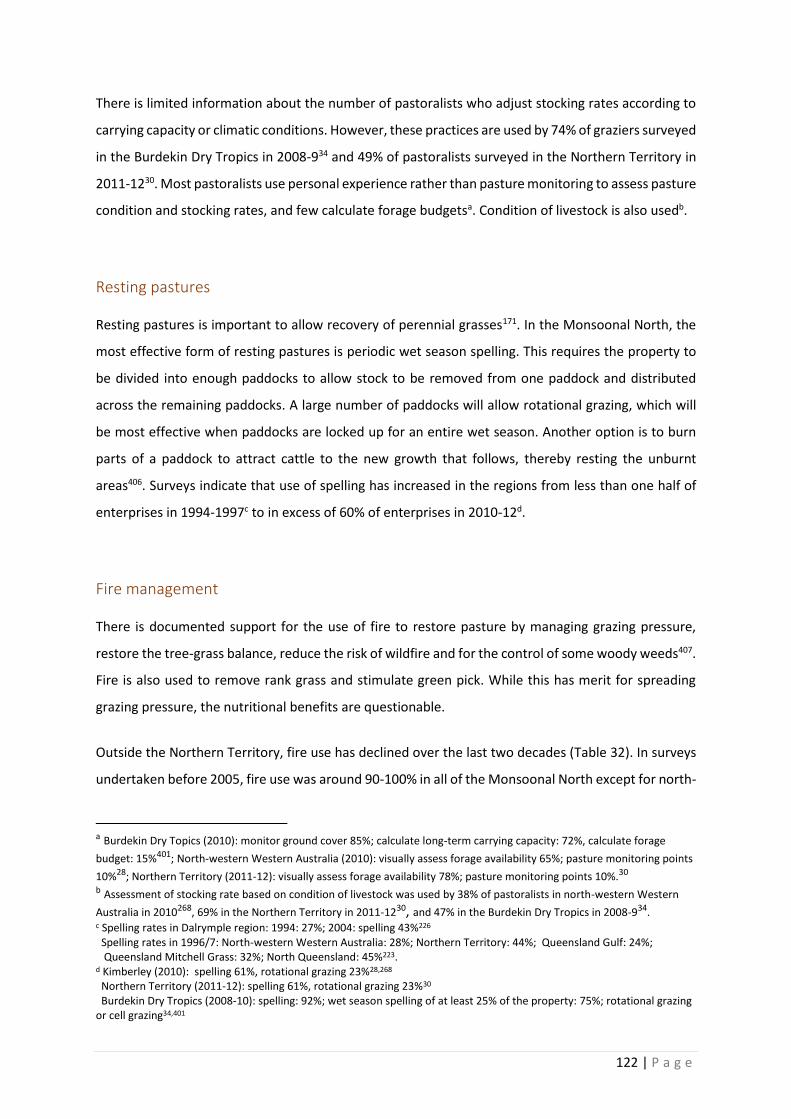
122 | P a g e
There is limited information about the number of pastoralists who adjust stocking rates according to
carrying capacity or climatic conditions. However, these practices are used by 74% of graziers surveyed
in the Burdekin Dry Tropics in 2008-934 and 49% of pastoralists surveyed in the Northern Territory in
2011-1230. Most pastoralists use personal experience rather than pasture monitoring to assess pasture
condition and stocking rates, and few calculate forage budgetsa. Condition of livestock is also usedb.
Resting pastures
Resting pastures is important to allow recovery of perennial grasses171. In the Monsoonal North, the
most effective form of resting pastures is periodic wet season spelling. This requires the property to
be divided into enough paddocks to allow stock to be removed from one paddock and distributed
across the remaining paddocks. A large number of paddocks will allow rotational grazing, which will
be most effective when paddocks are locked up for an entire wet season. Another option is to burn
parts of a paddock to attract cattle to the new growth that follows, thereby resting the unburnt
areas406. Surveys indicate that use of spelling has increased in the regions from less than one half of
enterprises in 1994-1997c to in excess of 60% of enterprises in 2010-12d.
Fire management
There is documented support for the use of fire to restore pasture by managing grazing pressure,
restore the tree-grass balance, reduce the risk of wildfire and for the control of some woody weeds407.
Fire is also used to remove rank grass and stimulate green pick. While this has merit for spreading
grazing pressure, the nutritional benefits are questionable.
Outside the Northern Territory, fire use has declined over the last two decades (Table 32). In surveys
undertaken before 2005, fire use was around 90-100% in all of the Monsoonal North except for north-
a Burdekin Dry Topics (2010): monitor ground cover 85%; calculate long-term carrying capacity: 72%, calculate forage
budget: 15%401; North-western Western Australia (2010): visually assess forage availability 65%; pasture monitoring points
10%28; Northern Territory (2011-12): visually assess forage availability 78%; pasture monitoring points 10%.30 b Assessment of stocking rate based on condition of livestock was used by 38% of pastoralists in north-western Western
Australia in 2010268, 69% in the Northern Territory in 2011-1230, and 47% in the Burdekin Dry Tropics in 2008-934. c Spelling rates in Dalrymple region: 1994: 27%; 2004: spelling 43%226 Spelling rates in 1996/7: North-western Western Australia: 28%; Northern Territory: 44%; Queensland Gulf: 24%; Queensland Mitchell Grass: 32%; North Queensland: 45%223. d Kimberley (2010): spelling 61%, rotational grazing 23%28,268 Northern Territory (2011-12): spelling 61%, rotational grazing 23%30 Burdekin Dry Tropics (2008-10): spelling: 92%; wet season spelling of at least 25% of the property: 75%; rotational grazing or cell grazing34,401

123 | P a g e
west Queensland and the Queensland Mitchell Grass region. In subsequent surveys, fire use halved in
north Queensland and declined to a trickle in the Kimberley. However, more recently, Savanna Burning
projects for carbon abatement have reinstated fire use in the Kimberley (see Indigenous pastoralism).
Table 32. Use of fire on grazing land of the Monsoonal North
Source: Compiled by Crowley, Felderhof, McIvor and Bolam (2013)407
N/R = not recorded
Year Use fire
Wildfire prevention
Green pick/ Rank grass
Open up country
Pasture composition
Weed control
Pastoralists surveyed Source
(%) (%) (%) (%) (%) (%) (no.)
Kimberley
1996/7 92 77 77 27 15 N/R 26 223
2010 N/R 4 N/R 6 6 N/R 49 a
Top End
1996/7 100 94 71 53 24 N/R 17 408
2004 96 64 44 65 3 N/R 25 227
2010 80 65 15 20 0 20 20 b
Gulf Savanna (Katherine Pastoral Region)
2004 N/R 45 58 53 3 N/R 24 232
2010-12 90 63 65 32 3 11 62 b
Victoria River District
1996/7 91 64 73 45 36 N/R 11 228
2010 100 72 62 33 0 17 18 b
Queensland Mitchell Grass
1996/7 67 50 55 55 23 NR 33 223
North-west Queensland
1996/7 59 50 66 78 19 N/R 54 223
North Queensland
1996/7 100 58 62 73 23 N/R 52 223
Great Barrier Reef catchments
2010 48 6 4 6 10 19 266 401
Burdekin Dry Tropics
2010 50 N/R N/R N/R N/R N/R 60 401
Dalrymple Shire
2004 51 20 23 27 N/R 39 53 226
Paddocks and water points
Cattle rarely venture more than 5 km from water409, so large paddocks with few permanent waters
tend to be patchily grazed, with areas close to water being over-utilised and water-remote areas being
under-utilised410. Providing accessible water points across the property, therefore, helps to spread
a Department of Agriculture and Food, Western Australia unpubl. data b Department of Primary Industries and Fisheries, Northern Territory unpubl. data

124 | P a g e
grazing pressure409. Intensification of paddocks and water points also allows paddocks to be closed-
off for spelling. In the extensive rangelands, a maximum distance to water of 3-4 km is recommended,
providing a grazing area of about 25 km2 around each water point. This can be achieved using
paddocks of 30–40 km2 each having two water points. In the intensively managed areas of North
Queensland, paddocks of up to 20 km2 with two water points are recommended.
In 2008, the majority of the Monsoonal North was more than 3 km from water. Only in the Desert
Uplands and around Mount Isa did the area within 3 km of water exceed 30% (Figure 38). However,
Monsoonal North properties participating in the CashCow project had an average of 78-79% within
2.5 km of water, with a range of 6% to 100%60. In 2009-10, new water points were established on 45%
of properties in the Top End and 77% of those in the Gulf Savanna, and new paddocks were
constructed on 65% and 54% of properties, respectively. By 2011-12, properties in the Top End had
the desired ratio between area of grazing land and number of water pointsa, but those in the Gulf
Savannab still had half the number of water points needed for effective grazing30. The 2010-11 work
plans of 63% of pastoral properties in the Kimberley included constructing water points and 71%
included building fences268. Similar information is not available for other parts of the Monsoonal
North.
Figure 38. Percentage of grazing lands within 3 km of water
Source: Bastin and the ACRIS Management Committee (2008)411
a One point for every 24 km2 b One point for every 66 km2

125 | P a g e
Water-remote areas are important for biodiversity conservation250,412,413. To avoid biodiversity decline,
retention of 10% of key land type as water-remote is, therefore, recommended171. Hence, the impact
of increased infrastructure development on biodiversity will depend on its configuration. It is likely to
deliver biodiversity benefits in areas where grazing pressure is reduced, but is likely to be negative
where significant areas do not remain water-remote.
Fencing can also be used to separate land types with different grazing characteristics so that all parts
of the paddock attract similarly moderate grazing pressure36,409. Survey results in the Burdekin Dry
Tropics indicate the percentage properties that were fenced to land type increased from 25.5% in
200834 to 67% in 2010401. Such a massive improvement is worthy of further investigation. Similar
information is not available for other parts of the Monsoonal North. However, fencing to land type
may be difficulty where paddock size is large.
Herd size
Large herd size appears to be the key to enterprise profitability78. However, it is important that herds
are not simply increased by increasing stocking rates, as this has adverse impacts on long-term
viability, pasture condition and biodiversity280,397,414. As noted above, where substantial portions of the
property are under-utilised through the lack of infrastructure, herd size may be increased by strategic
placement of new fences and water points. But rather than just increasing stock numbers, strategic
infrastructure development needs to spread grazing pressure and improve land condition171. Cattle
numbers increased on 40% of Top End properties between 2004 and 2011-12, and on 38% of
properties in the Gulf Savanna30. Decreases had occurred on only 5% and 8% of properties,
respectively. Roughly half (48%) of the Monsoonal North producers in the CashCow project and only
8% of those on Mitchell Grass country had intentions to increase their herd size by at least 10%60.
Herd management
Reproductive performance can be improved by culling infertile cows and sub-fertile bulls; early
weaning; and segregating pregnant and lactating cows younger than five years for preferential
nutritional management92,415. Culling of poor performing cows and bulls not only improves genetic
stock but means non-productive animals are not eating forage that could be used by productive ones,
or unnecessarily degrading pasture condition. Early weaning at the end of the pasture growth season

126 | P a g e
and segregating different classes of animal allow producers to maintain cows in good condition,
maximising the number that conceive for the next breeding round44,60,415.
In the Northern Territory, around one-third of pastoralists surveyed reported culling cows, early
weaning and/or early sale of steers30. Across the Monsoonal North, CashCow producers routinely
culled females when they reached 10 years of age, and weaned calves when they were 5 to 6 months
old. Bulls with poor semen quality were culled on 29% of properties60. Across the study, 10-22% of
cows failed to conceive, and culling and replacement of cows was suggested as a strategy for
increasing production. While it appears that cows that fail to conceive are culled on some properties,
the level of culling is unknown. In the Northern Territory, segregation of cattle is based on age on 37%
of properties, and on pregnancy status on 27% of properties30. In north-western Western Australia,
young heifers are held separately from other cattle on only 17% of properties28. Small numbers of
large paddocks are an impediment to effective herd management. Along with the poor performance
rates in Table 9, these figures indicate there is much room for improvement, especially in the more
systematic culling of poor performing cows and bulls, and segregation of different animal classes.
Vaccination
Vaccination against reproductive disease is important for maintaining fertility, and vaccination against
tick fever and botulism for reducing mortality44,60,415. Monsoonal North producers in the CashCow
project rarely vaccinated for reproductive diseases60. Approximately two thirds of producers
vaccinated maiden heifers and cows for botulism, and 44% vaccinated bulls. Vaccination to prevent
tick fever in breeding females was practised on 14% of properties.
Supplementation
Soils in the grazing lands of the Monsoonal North are typically phosphorus-deficient (Figure 39). This
impedes both weight gain and reproductive productivity416. Phosphorus supplements are, therefore,
important for maintaining the nutritional health and productivity of cattle, particularly in the wet
season, when grass contains high levels of protein needed for animal production44,415,417. Phosphorus
supplementation is of particular interest because of the poor performance of cattle on most
performance measures when compared with other parts of northern Australia where phosphorus
availability is higher60.
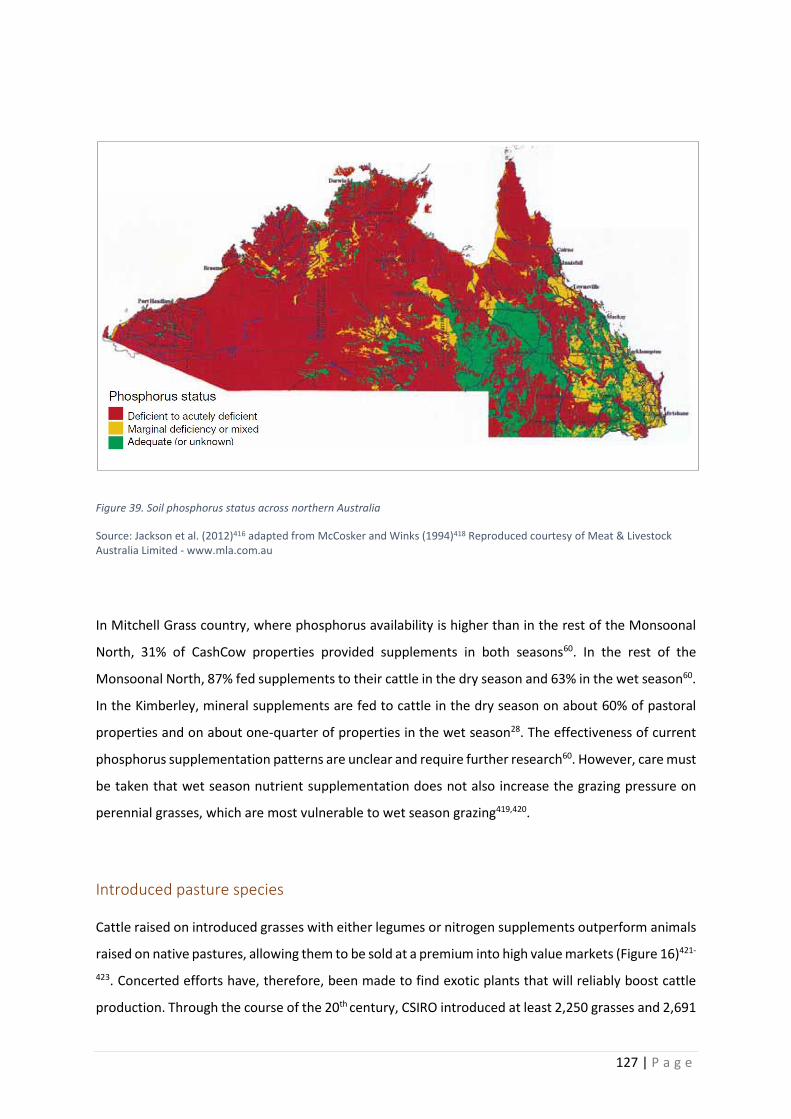
127 | P a g e
Figure 39. Soil phosphorus status across northern Australia
Source: Jackson et al. (2012)416 adapted from McCosker and Winks (1994)418 Reproduced courtesy of Meat & Livestock Australia Limited - www.mla.com.au
In Mitchell Grass country, where phosphorus availability is higher than in the rest of the Monsoonal
North, 31% of CashCow properties provided supplements in both seasons60. In the rest of the
Monsoonal North, 87% fed supplements to their cattle in the dry season and 63% in the wet season60.
In the Kimberley, mineral supplements are fed to cattle in the dry season on about 60% of pastoral
properties and on about one-quarter of properties in the wet season28. The effectiveness of current
phosphorus supplementation patterns are unclear and require further research60. However, care must
be taken that wet season nutrient supplementation does not also increase the grazing pressure on
perennial grasses, which are most vulnerable to wet season grazing419,420.
Introduced pasture species
Cattle raised on introduced grasses with either legumes or nitrogen supplements outperform animals
raised on native pastures, allowing them to be sold at a premium into high value markets (Figure 16)421-
423. Concerted efforts have, therefore, been made to find exotic plants that will reliably boost cattle
production. Through the course of the 20th century, CSIRO introduced at least 2,250 grasses and 2,691

128 | P a g e
legume species, mostly for assessing their grazing potential424. Several exotic pasture species have had
adverse impacts on the natural environment, as has the tree clearing that is often required to establish
introduced pastures424,425. In northern Australia, the most vigorous introduced grasses—Gamba Grass
(Andropogon gayanus), Para Grass (Urochloa mutica), Olive Hymenachne (Hymenachne
amplexicaulis), Aleman Grass (Echinochloa polystachya), Buffel Grass (Cenchrus ciliaris or Pennisetum
ciliare) and Mission Grass (Pennisetum polystachion and P. pedicellatum)—are called “transformer”
species or “green bulldozers”a because they exclude other species and the increased fuel loads they
produce can cause fires of sufficient intensity to destroy canopy trees426-430. Five of these grasses have
been identified as key threats to biodiversity conservation431. Gamba Grass is a Weed of National
Significance432, and a management plan has been prepared for its containment and control in the
Northern Territory433. Buffel Grass has become invasive to the detriment of biodiversity in both central
Australia and Queensland sections of the Monsoonal North428,434-437, but has not been identified as an
issue in the Top End or Gulf Savanna. Some pastoralists are also concerned about their ability to
control the spread of Gamba Grass, Wynn Cassia, Leucaena (Leucaena leucocephala), Mission Grass,
Stylosanthes spp. and Indian Blue Grass (Bothriochloa pertusa)224,227.
Despite adverse biodiversity effects, introduced pastures continue to be an important part of
productivity improvement. In the Northern Territory, exotic pasture species are used on most Top End
Properties and around half the properties in the Gulf Savanna (Katherine Pastoral region), but only
cover a small proportion of each region (Top End: 3%, Gulf Savanna: 4.8%)30. The main species used in
the Top End are Jarra Grass (Digitaria milanjiana), Tully Grass, (Brachiaria humidicola), Seca Stylo
(Stylosanthes scabra) and Wynn Cassia (Chamaechrista rotundifolia); and in the Gulf Savanna are
Buffel Grass, Nixon Sabi Grass (Urochloa mosambicensis), Seca Stylo and Verano (Stylosanthes
hamata). The most common use of exotic pasture species is to over-sow native pastures to improve
diet quality (Top End: 56%, Gulf Savanna: 61%), followed by hay production (56%, 32%) and improved
pasture systems (67%, 19%)30. Most Top Enders (80%) and 29% of Katherine pastoralists planned to
increase their use of exotic pasture species between 2011 and 201430. Pasture species recommended
for irrigated forage production include the low impact species Rhodes Grass (Chloris gayanus), Forage
Sorghum (Sorghum spp. hybrids) and Lablab (Lablab purpureus), but also include some invasive
species, such as Buffel Grass59.
a http://www.abc.net.au/am/content/2007/s2144436.htm

129 | P a g e
Reef water quality
Efforts to reduce sediment and chemicals in run-off to the Great Barrier Reef have been a significant
driver of practice change in the Burdekin Dry Tropics and other reef catchments since 2010375. These
efforts have been spearheaded by industry bodies, NRM groups and the Queensland and Australian
Government. Details of legislation underpinning practice improvement are covered under Legal and
regulatory environment.
The most damaging sediment to reef water quality is fine material that remains suspended in the
water column long enough to reach the reef lagoon438,439. Flood plumes laden with this fine sediment
both smother the coral and stimulate growth of the macro-algae that provide food for Crown of
Thorns Starfish (COTS)440. COTS outbreaks are also driven by nutrients from cane fields438,441. While
COTS outbreaks are a natural phenomenon associated with elevated river discharge, their frequency
has increased roughly five-fold over historical times440, in response to increases river loads of both
sediment and nitrogen of similar magnitude442.
The main water quality issue for pastoral operations in the Burdekin catchment is loss of fine-grained
sediment. Most of the damaging suspended sediment fraction reaching the Great Barrier Reef lagoon
comes from the Bowen (~45%) and Upper Burdekin (~27%) and Lower Burdekin (~26%) sub-
catchments (Figure 40)443. In the absence of the filtering effect of the Burdekin Falls Dam, the Upper
Burdekin would be by far the greatest contributor. Features that render these sub-catchments most
vulnerable to sediment loss are the erodible soils and high relief (Table 33). Only the Bowen
catchment, which enters the Burdekin down-stream of the Burdekin Falls Dam, has both high levels
of exposed soil and high contributions to reef sediment.

130 | P a g e
Figure 40. Sub-catchments of the Burdekin catchment (left) and their contribution to suspended sediments (right)
Source: Catchment data: NQ Dry Tropics (2015)444; Righthand image: Bainbridge, Lewis, Smithers, Kuhnet, Henderson and Brodie (2014)443 ©2014 American Geophysical Union.

131 | P a g e
Table 33. Characteristics of the Burdekin River sub-catchments
Source of data: Ground cover: calculated from NQ Dry Tropics (2015)444; all other parameters from Bainbridge, Lewis, Smithers, Kuhnet, Henderson and Brodie (2014)443
Upstream area Terrain Soils Land use Area with <50%
ground cover Sediment to GBR
(km2) (%) (%)
Below Burdekin Falls Dam
Bowen
7,110 Steep Red-brown earths, yellow soils, granite/sandstone-derived gravely/ sandy soils, black earths
Grazing 36 45
Lower Burdekin/Bogie
129,600 Low relief alluvial levees, floodplains and delta
Black cracking clays, silts, sands, duplex and sodic soils
Cane & grazing 19.6 26
Above Burdekin Falls Dam
Upper Burdekin
36,140 Steep Erodible red duplex soils, black & red basaltic soils, sodic duplex soils
Grazing 11 27
Cape
15,860 Gently undulating
Remnant sedimentary basins, cracking clay soils
Grazing 46 <11%
Belyando
35,055 Gently undulating
Remnant sedimentary basins, cracking clay soils, grey/ brown clays, red/yellow earths
Grazing & dryland cropping
48 <11%
Suttor
10,870 Gently undulating
Remnant sedimentary basins, cracking clay soils, grey/ brown clays, red/yellow earths
Grazing & dryland cropping
41 <11%
Efforts to reduce erosion rates in the Burdekin region focus on maintaining high levels of ground cover.
Loss of groundcover can lead to increased run-off and soil loss from hillslopes402,445. Increased run-off
also drives gullying downslope, producing even more sediment loss402. Most sediment reaching the
Great Barrier Reef is lost from subsurface soils coming out of gullies446. While lower levels of ground
cover may be necessary for maintaining surface soil and pasture productivity, retention of 75% ground

132 | P a g e
cover appears to be necessary to ensure water from high rain events infiltrate the soil rather than run
across the surface402,447.
Of particular concern is the percentage of the region with less than 50% ground cover which reached
a peak in 1996 and 2004, both after dry spells of several years (Figure 41). However, ground cover
fluctuates between years depending on rainfall and grazing pressure (Figure 42). Therefore, particular
attention needs to be paid to ground cover in dry years.
Figure 41. Percentage of Burdekin Dry Tropics with less than 50% ground cover, 1987-2010
Source: Department of Environment and Heritage Protection (2015)448
Figure 42. Ground cover in the Burdekin Dry Tropics in relation to annual rainfall, 1987-2010
Source: Department of Environment and Heritage Protection (2015)448

133 | P a g e
Efforts to maintain ground cover have involved implementing best practice grazing management to
maintain land condition (see Land condition and economic returns), initially as part of the Reef
Regulations374 and later as part of the Grazing Best Management Practice Program (BMP) (see Legal
and regulatory environment). The Grazing BMP has been developed by AgForce and the Fitzroy Basin
Association in partnership with Queensland Department of Agriculture and Fisheries (QDAF), with the
Queensland Department of Environment and Heritage Protection (QEHP) having oversight of reef-
related elements. The industry partners are responsible for benchmarking the performance of cattle
producers.
The Grazing BMP program goes beyond reef regulations requirements and guides pastoralists through
a self-assessment process to identify practice improvements that could help improve the long term
profitability of their enterprise324. It includes modules on:
Animal health and welfare
Animal production
Grazing land management
People and business
Soil health.
By June 2015, 1,300 pastoralists were participating in the Grazing BMP449, by September 2015, 1,000
pastoralists had completed an Accelerated Grazing BMP course324, and by the end of October, 450
pastoralists had completed all five modulesa. This means that 6.7 million ha of land in Queensland
under the ownership of people who have completed the Grazing BMP modules.
Use of Tebuthiuron to control regrowth on grazing lands is also a concern as elevated levels of this
herbicide have been found in reef waters off the mouth of Burdekin River450, where it is likely to reduce
photosynthesis of mangroves, seagrass and marine algae451. The Reef Regulations also required
pastoralists in the Burdekin Catchment to record their use of Tebuthiuron. Use of this herbicide also
requires a Commercial Operators Licence or national competencies for preparing, transporting
chemicals and controlling weeds. Record keeping protocols have been incorporated into the Grazing
BMP.
a http://www.abc.net.au/news/6897372

134 | P a g e
Greenhouse gas budgets
Agriculture produces around 13.5% of global GHG emissions452 and 16% of emissions generated in
Australia453. However, agriculture is not currently included in emission reduction targets at a national
or global level, so farmers are not required to reduced their emissions454 although this reprieve may
be short-lived455. It has been estimated that mitigation actions could reduce emissions from Australian
agriculture by around 126 Mt CO2-e per year456.
Beef cattle produced about 6.8% of the Australia’s GHG emissions in 2012a and 10-12% of global
emissions459. As well as methane produced from enteric fermentation, pastoral operations generate
significant GHG emissions through electricity and fuel consumption460. Global demand for beef is,
therefore, an important driver of GHG emissions461. So it is important that beef is produced as
efficiently as possible to minimise contribution to climate change, with emphasis being on production
efficiency (i.e. carbon-equivalent units per kilogram of meat, rather than total GHG emissions)462.
Livestock grazing is the only agricultural land use that can be undertaken sustainably on savanna
grasslands and open woodlands while maintaining its ecological values463. GHG emissions from
grassfed beef production in Australia has been estimated at 12 CO2-e/kg meat produced, which is low
relative to world standards464, and agricultural emissions per unit of land in the Monsoonal North are
amongst the lowest in the country (Figure 43).
a Beef cattle were estimated to produce 1.8 Mt CH4 in 2012, with 0.06% generated by manure management and the remainder from enteric fermentation457. This constitutes 42.5% of Australia’s agricultural GHG emissions, which is in turn 16.1% of Australia’s total GHG emissions458.
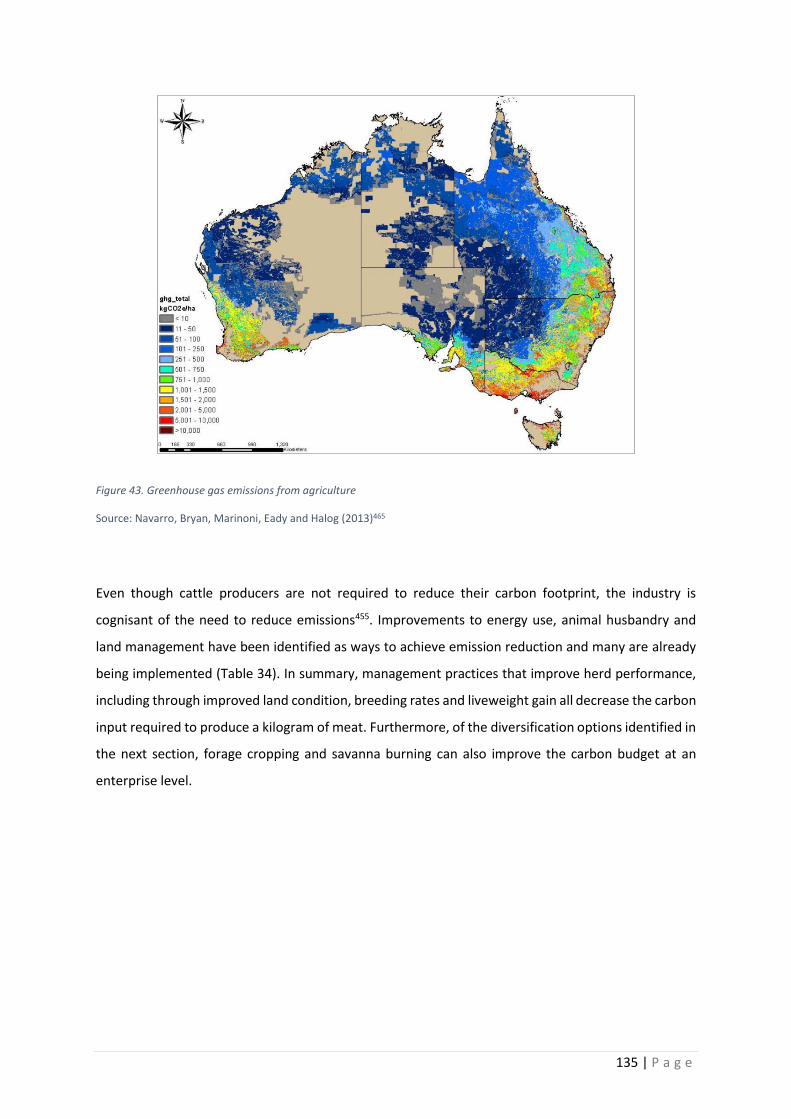
135 | P a g e
Figure 43. Greenhouse gas emissions from agriculture
Source: Navarro, Bryan, Marinoni, Eady and Halog (2013)465
Even though cattle producers are not required to reduce their carbon footprint, the industry is
cognisant of the need to reduce emissions455. Improvements to energy use, animal husbandry and
land management have been identified as ways to achieve emission reduction and many are already
being implemented (Table 34). In summary, management practices that improve herd performance,
including through improved land condition, breeding rates and liveweight gain all decrease the carbon
input required to produce a kilogram of meat. Furthermore, of the diversification options identified in
the next section, forage cropping and savanna burning can also improve the carbon budget at an
enterprise level.

136 | P a g e
Table 34. Strategies to improve greenhouse gas footprint of pastoral properties
* = ERF/CFI methodology approved (see Environmental service delivery)
Strategy Sources
Energy consumption and production
Switch to renewable energy 462
Produce biofuel crops 456
Improve feed conversion efficiency
Genetic selection of livestock 462,455,466,467
Nitrogen and phosphorus supplements, especially in the wet season* 468
Phosphorus supplements, especially in the wet season 469
Improved feed-base 462
Dietary additives e.g. Saponins 470
Reduce ruminant protozoa 471
Improve feed quality
Moderating stocking rate to improve pasture quality 455,456
Grain-based feed-lotting 462,472,473,474
Improve herd management and growth rates
Genetic selection of livestock 474
Herd management (e.g. Improve reproductive performance, Culling infertile cows, Early joining)* 462,471,475
Property infrastructure 462
Sequester carbon
Restore native tree cover through planting and/or regrowth* 456,181
Improve soil carbon (e.g. by promoting deep-rooted perennial grasses)* 456
Abate greenhouse emissions
Fire management to reduce extent of late dry season fires (Savanna Burning/Fire management)* 456,476
Animal welfare and community expectations
The Australian community expects meat to be humanely produced, whether it is slaughtered in
Australia or after it leaves the country423. On 30 May 2011, community outcry against the live export
trade was roused when mistreatment of Australian cattle in Indonesian abattoirs was broadcast on an
Australian Broadcasting Corporation Four Corners programa. The footage revealed cattle experiencing
slow and painful deaths, as well as being actively taunted and tortured. In response to this program,
the Australian Government suspended the live cattle export trade on 8 June 2011 while it reviewed
options for imposing more stringent conditions on export operations. Animals Australia477, World
Animal Protection478 and RSPCA479 were at the forefront of the campaign to ban live export.
On 6 July 2011, the Australian Department of Agriculture lifted the trade suspension and introduced
ESCAS in addition pre-existing obligations for exporters to comply with Australian Standards for the
Export of Livestock (see Legal and regulatory environment). Live export resumed in August 2011.
While ESCAS has done much to improve animal welfare, and the Four Corners program exposed no
a http://www.abc.net.au/4corners/special_eds/20110530/cattle/

137 | P a g e
instances of shipboard maltreatment, objections to the live export trade remain. Some of these
objections are based on opposition to any animal being raised for slaughter115. RSPCA’s campaign
website indicates an opposition to live export regardless of conditions:
RSPCA Australia is opposed to the export of live food animals for immediate slaughter or
further fattening. RSPCA Australia will continue to pressure government to end the live export
trade in favour of a chilled and frozen meat-only trade.a
Although introduced as an animal welfare measure37, the live export ban led to thousands of cattle
suffering starvation on properties where there was inadequate feed, or being transported thousands
of kilometres by road to Australian abattoirs115. The sea journey between northern Australian and
Asian ports is relatively short and cattle often arrive in better condition than they were in when they
left480. Even before ESCAS, mortalities during live export were very low, with mortality rates on
voyages to south-east Asia averaging 0.08%, and 45% of all voyages reporting zero deaths44. Rates of
0.04% were recorded in 2010, 2011 and 2012, after which shipboard performance reports were no
longer issued165-167. Over these three years, between 49% and 53% of shipments from northern ports
were death-free. These mortality rates are an order of magnitude better than required by the
Australian standard481 and compare favourably with the only available assessments of mortalities
during land transport482. Welfare issues related to feed and water deprivation, heat stress, physical
exhaustion and rough treatment483 appear more easily managed on dedicated cattle ships, where feed
and water are continually provided, than they are in trucks or rail carriages.
Once the export ban was lifted, many of animals that had been destined for Indonesia now exceeded
the size permitted, and so were retained on properties to the detriment of pasture and environmental
conditions. There were claims that producers were driven to shooting cattle because the properties
had run out of feed and the prices of cattle would not cover the cost of transporting them to
saleyardsb. So the animals, the environment and the pastoralists all suffered51.
De-horning and de-budding are also in the sights of the animal welfare lobby484. Investments have
been made into selecting poll breeding stock that are naturally hornlessc. Campaigns within Australia
have also seen major supermarkets sourcing hormone-free beef485 and food that is humanely
produced486,487, and some beef is specifically promoted as being grass-fed485. Certification by Meat
a Policy was last reviewed on 24 Dec 2012, and website indicated it was still current 27 Jan 2016 b http://www.abc.net.au/news/4671318, http://www.theaustralian.com.au/news/latest-news/farmer-shoots-cattle-as-a-result-of-live-export-ban-says-chamber-of-commerce/story-fn3dxiwe-1226100150834 c http://www.abc.net.au/news/5322242
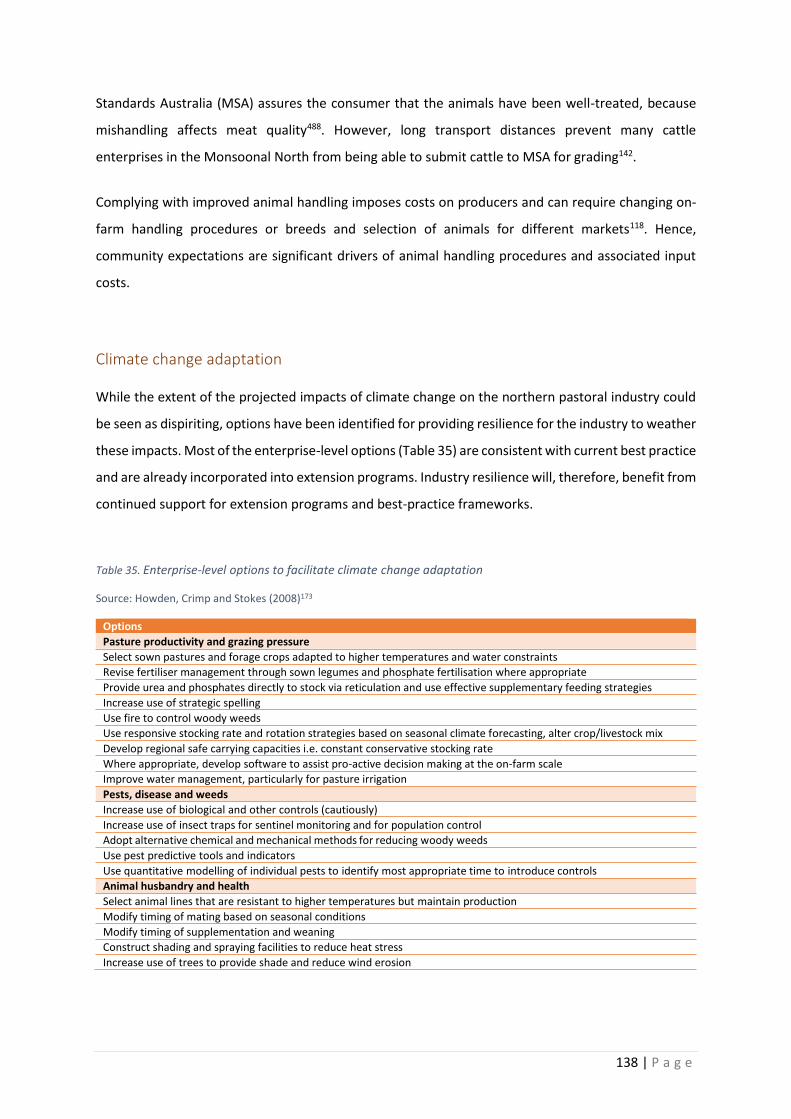
138 | P a g e
Standards Australia (MSA) assures the consumer that the animals have been well-treated, because
mishandling affects meat quality488. However, long transport distances prevent many cattle
enterprises in the Monsoonal North from being able to submit cattle to MSA for grading142.
Complying with improved animal handling imposes costs on producers and can require changing on-
farm handling procedures or breeds and selection of animals for different markets118. Hence,
community expectations are significant drivers of animal handling procedures and associated input
costs.
Climate change adaptation
While the extent of the projected impacts of climate change on the northern pastoral industry could
be seen as dispiriting, options have been identified for providing resilience for the industry to weather
these impacts. Most of the enterprise-level options (Table 35) are consistent with current best practice
and are already incorporated into extension programs. Industry resilience will, therefore, benefit from
continued support for extension programs and best-practice frameworks.
Table 35. Enterprise-level options to facilitate climate change adaptation
Source: Howden, Crimp and Stokes (2008)173
Options
Pasture productivity and grazing pressure
Select sown pastures and forage crops adapted to higher temperatures and water constraints
Revise fertiliser management through sown legumes and phosphate fertilisation where appropriate
Provide urea and phosphates directly to stock via reticulation and use effective supplementary feeding strategies
Increase use of strategic spelling
Use fire to control woody weeds
Use responsive stocking rate and rotation strategies based on seasonal climate forecasting, alter crop/livestock mix
Develop regional safe carrying capacities i.e. constant conservative stocking rate
Where appropriate, develop software to assist pro-active decision making at the on-farm scale
Improve water management, particularly for pasture irrigation
Pests, disease and weeds
Increase use of biological and other controls (cautiously)
Increase use of insect traps for sentinel monitoring and for population control
Adopt alternative chemical and mechanical methods for reducing woody weeds
Use pest predictive tools and indicators
Use quantitative modelling of individual pests to identify most appropriate time to introduce controls
Animal husbandry and health
Select animal lines that are resistant to higher temperatures but maintain production
Modify timing of mating based on seasonal conditions
Modify timing of supplementation and weaning
Construct shading and spraying facilities to reduce heat stress
Increase use of trees to provide shade and reduce wind erosion

139 | P a g e
Similarly, peak bodies and government agencies are already progressing industry-wide and policy-
level options (Table 36). These efforts were spearheaded by the cross-regional collaboration under
NABIWG, and will further benefit from other collaborative initiatives, such as growNORTH and several
of the commitments from the Northern Australia and the Agricultural Competitiveness white papers.
Despite the progress that was made through NABIWG, there was no indication in either white paper
that this working group is likely to be re-established.
Table 36. Industry and policy-level options to facilitate climate change adaptation
Source: Howden, Crimp and Stokes (2008)173
Details
Policy
‘Mainstream’ climate change into existing government policies and initiatives (e.g. on drought, greenhouse sinks, natural resource management, water resource allocation, rural development) and into integrated catchment management.
Managing transitions
Policies and mechanisms to provide technical and financial support during transitions to new systems that are more adapted to the emerging climate.
Communication
Ensure communication of broader climate change information as well as industry-specific and region-specific information as it becomes available.
Climate data and monitoring
Maintenance of effective climate data collection, distribution and projection systems with monitoring and analysis systems addressing livestock sector-specific impacts to support/facilitate adaptive management.
Research and development and training
Undertake further adaptation studies that include broad-based costs and benefits to inform policy decisions. Maintain the research and development base (people, skills, institutions) to enable ongoing evaluation of climate/CO2/industry/management relationships, and to streamline rapid research and development responses. This
research and development needs to be developed in a participatory way so that it can contribute to training to improve self-reliance in the agricultural sector and to provide the knowledge base for farm-scale adaptation.
Breeding and selection
Maintain public sector support for agricultural biotechnology and conventional breeding with access to global gene pools so as to have suitable options for higher temperature regimes and changed moisture availability and possible more climate variability.
Model development and application
Develop livestock systems models that can translate climate/CO2 information to economic outputs, to implications for
enterprises, livelihoods, industries and regions for use in decisions from enterprise to policy scale.
Improve pest predictive tools and indicators.
Improve quantitative modelling of individual pests to identify most appropriate time to introduce controls.
Seasonal forecasting
Facilitate the adoption of seasonal climate forecasts (e.g. those based on El Niño and La Niña, sea-surface temperatures, etc.) to help farmers, industry and policy incrementally adapt to climate change whilst managing for climate variability. Maximise the usefulness of forecasts by combining them with on-ground measurements (i.e. soil moisture, standing forage), market information and systems modelling.
Pests, diseases and weeds
Maintain or improve quarantine capabilities, sentinel monitoring programs and commitment to identification and management of pests, diseases and weed threats. Improve the effectiveness of pest, disease and weed management practices through predictive tools such as quantitative models, integrated pest management, area-wide pest management, routine record keeping of climate and pest/disease/weed threat, and through development of resistant bloodlines and improved management practices.
…/continued

140 | P a g e
Table 36. continued
Details
Water
Increase water use efficiency by: i. a combination of policy settings that encourage development of effective water-trading systems that allow for
climate variability and climate change and that support development of related information networks ii. improve water distribution systems to reduce leakage and evaporation
iii. developing farmer expertise in water management tools and enhancing adoption of appropriate water-saving technologies.
Land use change and diversification: Undertake risk assessments to evaluate needs and opportunities for changing species, management or land use/location in response to climate trends or climate projections. Support assessments of the benefits (and costs) of diversifying farm enterprises.
Natural resource base
Determine the impact of climate change (interacting with land management) on natural resource degradation issues such as erosion and salinisation risks and inform policymakers.
Diversification
The difficult financial situation faced by many in the northern pastoral industry is a driver to find other
sources of income to future-proof pastoral businesses. So, many enterprises already derive income
from off-farm work (Figure 11). On-farm diversification opportunities for northern pastoral operations
include forage crops, crop production and ecosystem service delivery37.
Forage crops
Small-scale production of irrigated pasture and pasture crops on the most fertile parts of the property
to allow animals to be fattened on the property has been proposed as means of improving enterprise
profitability59,136. It is thought that most properties in northern Australia have adequate water and soil
resources to support such development. Modelling was undertaken of the economics of rearing cattle
on native pasture then supplementing their diet with irrigated pasture crops in late spring and
summer. Three test properties used for the modelling were three hypothetical properties in the
Monsoonal North and adjoining Barkly Tablelands with typical stocking rates. The models were used
to find the best outcome from different combinations of irrigated crops and stocking rates. The most
profitable scenarios used irrigated tropical perennial grass or Lablab with between 18% more and 8%
fewer stock that was typical for the area (Table 37). In comparison to cattle reared under no-irrigation
scenarios, cattle finished on the irrigated pastures were shown to have faster growth rates and
improved reproductive rates, thus allowing early weaning and an increased turn-off of superior quality
animals. Increased growth rates also means that animals should be market-ready at a younger age,
and thus can be sold in higher value markets (see Figure 16). Hence, the modelled scenarios increased

141 | P a g e
both beef production and profitability. It has been estimated that up to 120,000 ha of irrigation is
possible across the north, with the potential to increase beef exports by $150-250 million annually489.
Table 37. Details of the most profitable mosaic irrigation scenarios modelled for northern Australian beef cattle enterprises
Source: Grice, Watson and Stone (2013)59
Kimberley Western Australia North Queensland
Barkly Northern Territory
Property size (km2) 2,795 300 5,000
Irrigated area (ha) 300 550 50
Pasture grown Tropical perennial grass (e.g. Perennial Rye Grass)
Tropical legume (Lablab)
Return on investment (%) 19 24 20
Total stock carried
- baseline (AE1) 10,876 2,867 26,774
- with irrigation development (AE1) 12,378 2,647 31,502
Change (AE1) +13.8 -7.7 +17.7
1AE = Animal equivalents, allows standardised adjustment of stocking rate based on feed requirements, as follows: Weaner up to 18 months: AE=0.5; Heifer, 18–30 months: AE=0.75; 2-year old steer: AE=0.8; 3-year old, non-breeding animal of 450 kg: AE=1; Breeder cow or 4-year old steer, AE=1.2; Bull: AE=1.5490.
Production of forage crops on Indigenous-held pastoral land also has the potential to boost Indigenous
employment and economic development. However, mosaic irrigation may also adversely affect
Indigenous interests through physical damage to sacred sites; impact of groundwater extraction on
significant springs or in-stream pools; and impact on fish resources59,491. On non-Indigenous pastoral
leases, production of irrigated pasture crops for use on the property are likely to be viewed as within
current lease conditions, and so not invoke Native Title conflicts59.
Additional adverse environmental impacts potentially include soil disturbance; decline in plant species
richness as a result of vegetation clearance; conditions conducive to weed spread; risk of pollution
from fertiliser and pesticide over-application; changed hydrology; and salinisation. The authors
consider that, as the operations are of a small scale (covering less than 0.1% of the northern pastoral
area), adverse impacts should also be minimal and manageable59. However, the sites most suitable
for mosaic irrigation—the most fertile and well-watered areas—are also likely to have the highest
natural and cultural values59. Such areas are already the focus of grazing operations across the
rangelands and so may be in an already degraded condition and in need of restoration186. Careful
placement of irrigation developments, with reference to the Environmental Protection and
Biodiversity Conservation Act 1999 (Cth) and relevant state or territory legislation will, therefore, be
required to minimise risks to endangered flora and fauna or sites of high cultural or biodiversity value.

142 | P a g e
What is not discussed in the report is how pastoralists using mosaic irrigation will change their
management of grazing pressure on the non-irrigated parts of the property. Managed wisely, mosaic
irrigation should allow stocking rates to be adjusted in line with land condition. However, by providing
feed during the late dry season “protein drought”59, pastoralists may be tempted to maintain herds at
unsustainable densities through the wet season. This appears to be the intention of the Water for
Food program in the Kimberley, which has identified mosaic irrigation as a means of producing dry
season feed317. Also, while the pasture species used in the model have a low invasion risk, any use of
more invasive species, such as Gamba Grass, would have serious implications for biodiversity. It is,
therefore, important that pastoralists are provided with suitable advice and extension services to
enable them to adopt sustainable irrigation practices37. Equally important will be continuing extension
programs, such as the GLM courses, that explain maintenance of land condition and its link to
profitability.
Fencing, water points and irrigation all require up-front capital investment 59. Where a business case
demonstrates suitable return on investment, mosaic irrigation is likely to attract investment, as it has
been endorsed as a viable investment by ANZ economists (along with the dismissal of other forms of
agricultural expansion as unprofitable)489. However, capital will be hard to raise for enterprises already
having difficulty servicing their debts78 or where security of land tenure is uncertain349.
Other cropping
Another option for pastoral enterprises to improve their profitability may be a shift into broadscale
agriculture. An assessment of the potential for irrigated agriculture across northern Australia
concluded that small-scale irrigation enterprises are likely to be viable on most northern properties.
However, it identified limited potential to expand extensive irrigated agriculture. The most suitable
areas have access to reliable overland flow (such the Ord, Douglas-Daly, Mitchell, Lower Burdekin,
Flinders and Gilbert catchments) or are fed by identified ground-water resources (Daly-Mataranka
area of the Northern Territory)19,59,492. The viability of such schemes has been questioned489, as more
northern irrigation schemes have failed than have succeeded, although failures have been more the
result of bad management than of difficult environmental conditions5.
Irrigated agriculture may conflict with Indigenous interests, which are required to be addressed where
Native Title coexists with pastoral operations491,493. Moreover, until recently, irrigated agriculture on
pastoral leases was not permitted under land tenure conditions across the three jurisdictions unless
it contributed to cattle production on the property. Hence, land tenure reforms to support

143 | P a g e
diversification have been made, or are underway, in all jurisdictions349. An amendment to the
Northern Territory Pastoral Land Act in 2013 enables permission to be granted for non-pastoral uses,
as long as Native Title considerations are addressed. However, tenure issues remain a barrier to
diversification in Western Australiaa, and while the Queensland Government claims that permits for
non-pastoral uses can be granted within Native Title constraints494, no information on applying for
such permits is available on any Queensland Government website.
Any venture into irrigated agriculture will involve substantial costs to pay for water and agricultural
infrastructure, water access permits, skills training and high labour requirements37,59, so will probably
require financial backing. ANZ’s assessment of broadscale irrigated agriculture as financially unviable
may cause difficulties for those seeking venture capital to underwrite such projects489.
Environmental service delivery
Environmental service delivery presents additional opportunities for northern pastoralists to diversify
their businesses. The majority of pastoralists across the Monsoonal North are receptive to the idea of
incorporating fee-for-service biodiversity conservation on their land495. Payments required to attract
participation vary from $1–$32 per hectare per year depending on land productivity, and there is a
preference for short-term contracts with flexible arrangements that allow for exceptional
circumstances. A thorough assessment of ecosystem services opportunities in the Monsoonal North
has identified improved herd and fire management as options with the greatest potential for earning
income from GHG abatement on pastoral lands373. In priority areas, the cost of managing parts of the
property for biodiversity may be subsidised in return for conservation management. However, the
greatest financial returns for environmentally sensitive management will come from the improved
profitability gained from adopting best practice herd and pastoral land management.
Pastoralists are concerned that entering into Savanna Burning GHG abatement fire management
projects may not be compatible with beef production. These projects use strategic early dry season
burning to reduce the spread of late dry season wildfires. Early dry season burning in the Victoria River
District has been estimated to result in production losses of $85/km2 annually because of the resultant
woody thickening and pasture degradation273,409. Woody thickening may also have biodiversity
implications274,275,496,497. However, using early dry season burning to create strategic fire breaks to
reduce the costs of fighting wildfires can be profitable at a whole-of-enterprise scale270. Moreover,
a http://www.abc.net.au/news/6677232
144 | P a g e
Savanna Burning projects can be used to subsidise fire management in undeveloped sections of the
property that have low grazing value, and thereby reduce fire risk across the whole property498.
Natural resource management implications
Herd building
Asian economic growth is driving demand for beef from north Australia. All northern governments
have a policy of increasing herd size across the region, and recent studies show that enterprise viability
improves with herd size78. Property development for herd building proceeds apace in the Northern
Territory and the Kimberley28,30. However, market analysis continually shows that cattle price is highly
sensitive to supply and demand ratios, so to ensure industry profitability it is important that herds do
not grow faster than demand. Price instability continued through 2015, with prices rising and falling
in response to changing supply and demand. However, despite short-term fluctuations, oversupply
appears unlikely in the near future, as the cattle herd is currently expected to take several years to
recover to the peak numbers of 201349. So herd-building is likely to continue whether or not it is
specifically supported by governments.
Herd growth in recent years has been achieved through both expansion of area grazed and stocking
rate, raising fears about the impact on environmental capital78. Overstocking of many parts of
Australia was identified as an issue more than three decades ago35,42,43, and since then stock numbers
have almost doubled. Most research and extension programs stress the importance of using moderate
stocking rates to protect land condition and long term production and profitability171,280,403. So it is
important for the industry that herd building is not done through increasing stocking rates beyond
sustainable carrying capacity. It is also important for biodiversity, as most biodiversity measures
improve with improving land condition and deteriorate with increasing grazing pressure249,397.
Herd building is also being achieved by grazing previously underutilised sections of the northern
landscape. These areas are important as refuges for rare species231 and even non-threatened species
decline in abundance around water points because of grazing impacts250. Grazing management
guidelines, therefore, recommend that 10% of key land types on any property are excluded from
grazing, along with 5% of more resilient landscapes171,499,500. Development of underutilised areas both
through the development of waters on individual properties and the expansion of cattle operations

145 | P a g e
across undeveloped lands therefore risks the loss of important biodiverse areas as well as a general
decline in biodiversity condition across the northern landscape.
Some areas are more robust to grazing than others. Grazing trials at Pigeon Hole, in the Victoria River
District, showed biodiversity was relatively insensitive to different levels of grazing up to 20%
utilisation rates501. Work at Mornington, in the Kimberley, showed significant species recovery when
grazing was excluded502. However, biodiversity failed to recover in response to withdrawal of grazing
pressure in the Queensland Gulf region503.
Undoubtedly, grazing pressure will increase across northern Australia, whether it is by increased stock
numbers or expansion of area grazed. It is, therefore, important that areas with high biodiversity
values are identified and managed appropriately and that impacts of any increases in grazing pressure
on grazing land condition and biodiversity are properly assessed. Development of Beetaloo Station on
the Barkly Tableland, Northern Territory, aims to combine intensifying production with enhancing
biodiversity values, and has instituted a monitoring program to test the success of their efforts504.
Their results should be instructive for other property developers.
Performance improvement
Increasing stocking rates and herd size is not the only means of increasing production and enterprise
profitability. Good herd management—retaining only cattle that are contributing to reproduction and
keeping animals healthy to improve pregnancy rates and liveweight gain—results in significant
increases in meat production at the same or reduced stocking rates (see Herd performance and
market access). Moreover, the healthier, faster growing animals produced can be sold more profitably
at the high end of the market (Figure 16). When combined with moderate stocking rates that are
adjusted for climatic variation, which also improves liveweight gain and profitability280,403,405,
improving herd performance could, therefore, be one of the most significant contributions to
biodiversity health.
Mosaic agriculture and irrigated cropping
Capacity to finish cattle on-property also improves market access and prices that can be achieved. So
mosaic irrigation of pasture crops is another development that can increase meat production without
substantial increases in stocking rates (see Diversification). Where such developments occur on land
that is already developed, the impact on regional scale biodiversity values are likely to be minimal,

146 | P a g e
particularly as these developments are likely to cover less than 0.1% of the region59. However, the
areas of fertile alluvial soils along drainage lines with a good supply of surface or groundwater that are
most suitable for irrigated crops are also likely to have high biodiversity values7,505,506. And even a local
lowering of groundwater could adversely affect biodiversity that remains in these areas177,507. Hence,
“the impact of grazing is often disproportionately higher on the more fertile, alluvial parts of the
landscape, riparian zones beside watercourses, and on important refugial habitats”506. These are the
very areas that are most likely to be developed for mosaic irrigation. Again, while mosaic irrigation is
a good thing for enterprise viability, it needs to be progressed in sympathy with biodiversity values.
Extending diversification to include other irrigated crops raises even greater biodiversity concerns.
The land clearing and water extraction needed to support viable agricultural enterprises is at least an
order of magnitude greater than that required for production of pasture crops. In addition, water
impoundments may exclude bottom-dwelling species, such as the Vulnerable Freshwater Sawfish
(Pristis microdon) and Freshwater Whipray (Himantura dalyensis) from critical habitat.
Environmental services
Many pastoral companies have entered into conservation agreements, particularly in the Northern
Territory (see Environmental service delivery). While these are useful for assisting parts of pastoral
properties to be managed for conservation, they do not provide a regular income stream. Currently
Savanna Burning is the only payment of environmental services system that is providing ongoing
income on pastoral properties. This is despite both conceptual models being developed and
willingness of pastoralist to participate being demonstrated. Offset programs hold the most promise
as governance arrangements are already in place.
The rapid uptake of Savanna Burning Carbon Farming by pastoralists across northern Australia
demonstrates the willingness of pastoralists to diversify into areas that do not impinge on pastoral
production. Along with carbon abatement, reduction of late dry season fires provides many
indisputable biodiversity benefits508-511. However, caution should be exercised where biodiversity has
evolved under a diversity of fire regimes512,513. Moreover, repeated early dry season burning may
degrade pasture condition and result in woody thickening, particularly when combined with grazing273.
So, as with all changes in management, a thorough assessment of the values and consequences should
be undertaken before entering into a Savanna Burning program and the outcomes for biodiversity and
grazing land condition should be assessed.
147 | P a g e
Enterprise viability and uptake of sustainable practices
While the outlook for the northern beef industry is positive, and further growth is projected, many
enterprises are under pressures threatening their viability. Live export has periodically improved
income on many northern pastoral properties, particularly in the Northern Territory and the
Kimberley. However, market volatility, especially the live export ban in 2001, pushed many enterprises
further into debt (see Profitability). Market volatility has flow on effects for land condition, with
between one-third and one-half of pastoralists affected by the live export ban believing that their
inability to sell stock had caused land degradation46,88. Elevated stocking rates continued for some
time after the ban was lifted, as there was no market for cattle that were now too heavy to be
exported to Indonesia46.
Historical assessment of northern herd dynamics indicates that managing resource condition is
challenging in a volatile market, even without closure of the dominant live export market. Increases
in demand and price stimulate herd building, but decreases in price make it unprofitable to destock,
as the resultant oversupply keeps prices low for an extended period41. This has led to continual
increases in cattle numbers along with grazing pressure on the land.
Practices to improve viability and resource condition mostly go hand in hand, but the many
publications reviewed for this report indicate that many enterprises are so stretched that they have
neither the human, nor the financial capacity to make the changes required. Not only are staff
numbers low on most properties, but many owners/managers are undertaking off-farm work just to
survive. Added pressures of projected climate change, such as having to recover from category five
cyclones on a regular basis, will create extra difficulties for programs to improve practices or resource
condition.
It is widely believed that landholders are more likely to adopt sustainable practices if these are
perceived to improve profitability514. However, this was not found to be the case among pastoralists
in the Burdekin Dry Tropics515, even though financial, climate and policy impediments rated as the
highest disincentives to adopting best practice management. What does seem to be clear is that
pastoralists are most likely to overstock when they are under severe financial pressure. Therefore,
finding pathways to guide struggling enterprises back into the black should be a high priority for any
program promoting sustainable natural resource management.

148 | P a g e
References
1. Moise A, Abbs D, Bhend J, Chiew F, Church J, Ekström M, et al. Monsoonal north cluster Report. In: Ekström M, Whetton P, Gerbing C, Grose M, Webb L, Risbey J, editors. Climate change in Australia projections for Australia’s natural resource management regions: cluster reports Australia [Internet]. CSIRO and Bureau of Meteorology; 2015 [cited 2016 Feb 1]. Available from: http://www.climatechangeinaustralia.gov.au/media/ccia/2.1.5/cms_page_media/172/MONSOONAL_NORTH_CLUSTER_REPORT_1.pdf
2. Australian Bureau of Meteorology. Climate data online [Internet]. Commonwealth of Australia; 2015 [cited 2016 Feb 1]. Available from: http://www.bom.gov.au/climate/data
3. Australian Bureau of Meteorology. Tropical cyclones [Internet]. Melbourne: Commonwealth of Australia; 2010 [cited 2016 Feb 1]. Available from: http://www.bom.gov.au/cyclone/
4. Mott JJ, Williams J, Andrew MH, Gillison AN. Australian savanna ecosystems. In: Tothill JC, Mott JJ, editors. Ecology and management of the world's savannas. Canberra: Australian Academy of Science; 1985. p. 56-82.
5. Ash AJ. Factors driving the viability of major cropping investments in northern Australia - a historical analysis [Internet]. Australia: CSIRO; 2014 [cited 2016 Feb 1]. Available from: http://www.industry.gov.au/ONA/Reports-and-publications/Documents/NA-food-fibre-supply-chain-appendix-3-1.pdf
6. NVIS. National Vegetation Information System (NVIS) Version 4.1 - Australia - Key layer for the sources of present (extant) vegetation data [Internet]. Canberra: Department of the Environment, Commonwealth of Australia; 2012 [cited 2016 Feb 2]. Available from: https://www.environment.gov.au/fed/catalog/search/resource/details.page?uuid={4EB110CB-7038-4C4E-AAD5-EF766AC4C883}
7. Woinarski JCZ, Mackey BG, Nix HA, Traill BJ. The nature of northern Australia: Its natural values, ecological processes and future prospects [Internet]. Canberra: ANU ePress; 2007 [cited 2016 Feb 2]. Available from: http://epress.anu.edu.au/nature_na_citation.html
8. Woinarski JCZ. Critical-weight-range marsupials in northern Australia are declining: a commentary on Fisher et al. (2014) ‘The current decline of tropical marsupials in Australia: is history repeating?’. Glob Ecol Biogeogr. 2015;24(1):118-22. doi: 10.1111/geb.12165
9. Sattler P, Creighton C, editors. Australian terrestrial biodiversity assessment 2002 [Internet]. Canberra: National Land and Water Resources Audit; 2003 [cited 2016 Feb 2]. Available from: http://nrmonline.nrm.gov.au/downloads/mql:1835/content
10. Stein JL, Stein JA, Nix HA. Spatial analysis of anthropogenic river disturbance at regional and continental scales: identifying the wild rivers of Australia. Landsc Urban Plan. 2002;60(1):1-25. doi: 10.1016/S0169-2046(02)00048-8
11. Morrison RJ, Delaney JR. Marine pollution in the Arafura and Timor Seas. Mar Pollut Bull. 1996;32(4):327-34. doi: 10.1016/0025-326X(96)00004-5
12. Kennett R, Robinson CJ, Kiessling I, Yunupingu D, Munungurritj, Yunupingu D. Indigenous initiatives for co-management of Miyapunu/sea turtle. Ecological Management & Restoration 2004;5(3):159-66. doi: 10.1111/j.1442-8903.2004.00204.x
13. Fabricius KE. Effects of terrestrial runoff on the ecology of corals and coral reefs: review and synthesis. Mar Pollut Bull. 2005;50(2):125-46. doi: 10.1016/j.marpolbul.2004.11.028
149 | P a g e
14. Hoegh-Guldberg O. Climate change, coral bleaching and the future of the world's coral reefs. Mar Freshw Res. 1999;50(8):839-66. doi: 10.1071/MF99078
15. Mantyka-Pringle CS, Martin TG, Moffatt DB, Linke S, Rhodes JR. Understanding and predicting the combined effects of climate change and land-use change on freshwater macroinvertebrates and fish. J Appl Ecol. 2014;51(3):572-81. doi: 10.1111/1365-2664.12236
16. Johnson JE, Holbrook NJ. Adaptation of Australia’s marine ecosystems to climate change: using science to inform conservation management. Int J Ecol. 2014;2014. doi: 10.1155/2014/140354.
17. National Water Commission. Australian Water Resources 2005: A baseline assessment of water resources for the National Water Initiative [Internet]. National Water Commission; 2005 [cited 2016 Feb 1]. Available from: http://www.regionalaustralia.org.au/archive-report/australian-water-resources-2005-a-baseline-assessment-of-water-resources-for-the-national-water-initiative-level-1-assessment/
18. Bureau of Meteorology. Australian Water Resources 2010 – A baseline assessment of water resources for the National Water Initiative [Internet]. Bureau of Meteorology; 2010 [cited 2016 Feb 2]. Available from: http://www.bom.gov.au/water/awra/2010/
19. CSIRO. Agricultural resource assessment for the Flinders catchment. An overview report to the Australian Government from the CSIRO Flinders and Gilbert Agricultural Resource Assessment, part of the North Queensland Irrigated Agriculture Strategy [Internet]. Canberra: CSIRO Water for a Healthy Country and Sustainable Agriculture flagships; 2013 [cited 2016 Feb 2]. Available from: http://www.csiro.au/en/Research/LWF/Areas/Water-resources/Assessing-water-resources/Flinders-Gilbert/Flinders-report
20. Northern Australian Land and Water Taskforce. Sustainable development of northern Australia: a report to Government from the Northern Australia Land and Water Taskforce [Internet]. Canberra: Department of Infrastructure, Transport, Regional Development and Local Government; 2009 [cited 2016 Feb 2]. Available from: http://industry.gov.au/ONA/Documents/NLAW.pdf
21. Geoscience Australia. GEODATA TOPO 10M 2002 (Double precision) [Internet]. Canberra: Geoscience Australia. 2004 [cited 2016 Feb 2]. Available from: http://www.ga.gov.au/corporate_data/60803/60803_user_guide.pdf
22. Australian Surveying and Land Information Group. Nested catchments and sub-catchments for the Australian Continent. Centre for Resource and Environmental Studies ANU. Canberra: National Land and Water Resources Audit; 2000.
23. Geoscience Australia. Australian Land Tenure System 1993. Canberra: Geoscience Australia; 2004.
24. Australian Bureau of Statistics. Regional population growth, Australia, 2013-14. [Internet]. 2014 [cited 2016 Feb 2]; ABS cat. no. 3218.0. Available from: http://www.abs.gov.au/AUSSTATS/[email protected]/Lookup/3218.0Main+Features12013-14?OpenDocument
25. Baxter J, Gray M, Hayes A. Families in regional, rural and remote Australia [Internet]. Melbourne: Australian Institute of Family Studies; 2011 [cited 2016 Feb 2]. Available from: http://www.aifs.gov.au/institute/pubs/factssheets/2011/fs201103.pdf
26. Australian Bureau of Statistics. Estimates of Aboriginal and Torres Strait Islander Australians, June 2011 [Internet]. 2013 [cited 2016 Feb 2]; ABS cat. no. 3238.0.55.001. Available from: http://www.abs.gov.au/AUSSTATS/[email protected]/Lookup/3238.0.55.001Main+Features1June%202011?OpenDocument

150 | P a g e
27. Meat and Livestock Australia. Cattle numbers – as at June 2011 natural resource management region [Internet]. MLA; 2012 [cited 2016 Feb 1]. Available from: http://www.mla.com.au/files/d0faf79a-7218-4f5a-85db-a1110102aaf8/Cattle-Numbers-Map_as-at-June-2011.pdf
28. Dray R, Huey A-M, Fletcher M, Stockdale M, Smith PC. Kimberley and Pilbara RD&E program: phase 1. Pastoral industry survey of the Kimberley and Pilbara regions, Western Australia – 2010 [Internet]. Meat and Livestock Australia; 2011 [cited 2016 Feb 1]. Available from: http://www.mla.com.au/Research-and-development/Final-report-details?projectid=15151
29. Department of Agriculture and Food. Plan to support livestock industry development 2009–2012 [Internet]. South Perth: Department of Agriculture and Food, Western Australia; 2009 [cited 2016 Jan 20]. Available from: http://www.parliament.wa.gov.au/Parliament/commit.nsf/(Evidence+Lookup+by+Com+ID)/B2E90A0DADA3793B4825794F0029AEC3/$file/ef.aar10.111116.001.aqton.Attachment+9F+Ag&Food.pdf
30. Cowley T, Oxley T, MacDonald N, Cameron A, Conradie P, Collier C, et al. 2010 Northern Territory wide pastoral industry survey [Internet]. Northern Territory Department of Primary Industries and Fisheries; 2013 [cited 2016 Feb 2]. Available from: http://www.nt.gov.au/d/Content/File/p/pi/PastoralSurvey/NT%20Wide.pdf
31. Department of Primary Indistries and Fisheries NT. Outlook and overview 2013 [Internet]. Department of Primary Industry and Fisheries, Northern Territory; 2013 [cited 2016 Apr 5]. Available from: http://www.nt.gov.au/d/Content/File/p/pi/Outlook_Overview_2013.pdf
32. NTNRMB. Northern Territory integrated natural resource management plan 2010-2015 [Internet]. Darwin: Northern Territory Natural Resource Management Board; 2010 [cited 2016 Apr 5]. Available from: http://www.territorynrm.org.au/about-us/the-inrm-plan/
33. Department of Environment and Heritage Protection. WetlandInfo [Internet]. Brisbane: Queensland Government; 2015 [cited 2016 Feb 1]. Available from: http://wetlandinfo.ehp.qld.gov.au/
34. Australian Bureau of Statistics. Land management practices in the Great Barrier Reef catchments, Final, 2008-09 [Internet]. 2010 [cited 2016 Feb 2]; ABS cat. no. 4619.0.55.001. Available from: http://www.abs.gov.au/ausstats/[email protected]/mf/4619.0.55.001
35. Ash AJ, McIvor JG, Mott JJ, Andrew MH. Building grass castles: integrating ecology and management of Australia's tropical tallgrass rangelands. Rangel J. 1997;19(2):123-44.
36. Ash A, Stafford Smith M. Pastoralism in tropical rangelands: seizing the opportunity to change. Rangel J. 2003;25(2):113-127. doi: 10.1071/RJ03010
37. Gleeson T, Martin P, Mifsud C. Northern Australian beef industry: assessment of risks and opportunities. Canberra: Australian Bureau of Agricultural and Resource Economics and Sciences; 2012.
38. Australian Bureau of Statistics. Historical selected agricultural commodities, by state (1861 to Present), 2010-2011 [Internet]. 2013 [cited 2016 Feb 2]; ABS cat. no. 7124.0. Available from: http://www.abs.gov.au/AUSSTATS/[email protected]/Lookup/7124.0Main+Features12010-11?OpenDocument
39. United States Department of Agriculture. Production, supply and distribution online [Internet]. United States Department of Agriculture Foreign Agricultural Service; 2015 [cited 2016 Feb 1]. Available from: https://apps.fas.usda.gov/psdonline/psdHome.aspx
40. Matthews R, Ryan T. The history of Australian cattle prices since 1970. North Sydney: Meat and Livestock Australia; 2015.

151 | P a g e
41. Smith AW, Smith RL. The Australian cattle industry: prospects and consequences. Aust Econ Rev. 1979;12(3):57-68. doi: 10.1111/j.1467-8462.1979.tb00231.x
42. Winter WH. Australia's northern savannas: a time for change in management philosophy. J Biogeog. 1990;17:525-9.
43. Mott JJ, Bridge BJ, Arndt W. Soil seals in tropical tall grass pastures of Northern Australia. Aust J Soil Res. 1979;30:483-94.
44. Perkins N, Hill A, Tynan R. Linking pre export factors to post delivery performance in cattle exported from northern Australia to Indonesia. Meat & Livestock Australia; 2010.
45. Martin PAJ, Mellor TV, Hooper S. Live cattle export trade: importance to northern and southern Australian beef industries Australian Bureau of Agricultural and Resource Economics; 2007.
46. Australian Bureau of Agricultural and Resource Economics. ABARES survey of beef cattle producers in northern live cattle export regions: Results of the survey undertaken 24 June to 1 July 2011 following the suspension of trade to Indonesia of cattle intended for slaughter. Australian Bureau of Agricultural and Resource Economics; 2011.
47. Department of Agriculture. Exporter supply chain assurance system [Internet]. Canberra: Commonwealth of Australia; 2015 [cited 2016 Feb 1]. Available from: http://www.agriculture.gov.au/export/controlled-goods/live-animals/livestock/information-exporters-industry/escas
48. Commonwealth of Australia. Exporter supply chain assurance system report [Internet]. Canberra: Commonwealth of Australia; 2015 [cited 2016 Feb 1]. Available from: http://www.agriculture.gov.au/SiteCollectionDocuments/biosecurity/export/live-animals/livestock/escas/escas-report.pdf
49. Thomas B. Australian cattle industry projections 2015 [Internet]. North Sydney: Meat & Livestock Australia; 2015 [cited 2016 Feb 1]. Available from: http://www.mla.com.au/Prices-markets/Trends-analysis/Cattle-projections/MLA-Australian-cattle-industry-projections-2015
50. Keogh M. Live cattle export suspension aftershocks affecting all beef farmers [Internet]. 2013 [cited 2015 Dec 19]. Available from: http://www.farminstitute.org.au/_blog/Ag_Forum/post/live-cattle-export-suspension-aftershocks-affecting-all-beef-farmers/
51. Hydros Consulting. The financial impacts of cattle export restrictions on producers and other stakeholders in Northern Australia. Report to the Australian Department of Agriculture Fisheries and Forestry. Hydros Consulting; 2011.
52. Thompson T, Martin P. Australian beef: Financial performance of beef cattle producing farms, 2011‒12 to 2013‒14. Australian Bureau of Agricultural and Resource Economics and Sciences; 2014. Report No.:Report 14.7.
53. Thomas B. Australian cattle industry projections 2015 [Internet]. North Sydney: Meat & Livestock Australia; 2015 [cited 2016 Feb 1]. Available from: http://www.mla.com.au/Prices-and-markets/Trends-and-analysis/Beef/Forecasts/MLA-Australian-cattle-industry-projections-2015
54. McRae T, Thomas B. Australian cattle industry projections 2014. North Sydney: Meat and Livestock Australia; 2014.
55. Linehan V, Thorpe S, Andrews N, Kim Y, Beaini F. Food demand to 2050: Opportunities for Australian agriculture. In: ABARES conference, March 2012; Canberra; 2012.

152 | P a g e
56. Meat and Livestock Australia. Australian livestock export. Industry statistical review 2013-14. North Sydney: Meat and Livestock Australia; 2014 September 2014.
57. Ryan T. North of the Tropic beef report - October 2015 [Internet]. Meat and Livestock Australia; 2015 [cited 2016 February 1]. Available from: http://www.mla.com.au/Prices-markets/Trends-analysis/Live-exports-and-northern-markets
58. Australian Bureau of Statistics. Livestock products [Internet]. 2015 [cited 2016 Feb 1]; ABS cat. no. 7215.0. Available from: http://www.abs.gov.au/AUSSTATS/[email protected]/DetailsPage/7215.0Mar%202015?OpenDocument
59. Grice AC, Watson I, Stone P. Mosaic irrigation for the northern Australian Beef Industry. An assessment of sustainability and potential. Technical report [Internet]. Brisbane: CSIRO; 2013 [cited 2016 Feb 1]. Available from: http://industry.gov.au/ONA/Reports-and-publications/Documents/mosaic_irrigation_technical_report.pdf
60. McGowan M, McCosker KD, Fordyce G, Smith DR, O'Rourke P, Perkins N, et al. North Australian beef fertility project: CashCow [Internet]. North Sydney: Meat and Livestock Australia report B.NBP.0382. University of Queensland; 2014 [cited 2016 Feb 1]. Report No.:B.NBP.0382. Available from: http://www.mla.com.au/Research-and-development/Search-RD-reports/RD-report-details/Productivity-On-Farm/Northern-Australian-beef-fertility-project-CashCow/370
61. Department of Employment, Economic Development and Innovation. The Queensland beef industry: current trends and future projections [Internet]. DEEDI, Queensland; 2010 [cited 2016 Feb 1]. Available from: https://futurebeefnew-daff.netdna-ssl.com/wp-content/uploads/2011/09/Beef-situation-analysis-2010.pdf
62. Ausvet Animal Health Services. A review of the structure and dynamics of the Australian beef cattle industry. A report to the Australian Department Of Agriculture, Fisheries And Forestry. 2006.
63. May D. Aboriginal labour and the cattle industry in Queensland from white settlement to the present. Cambridge: Cambridge University Press; 1994.
64. Skyring F. Low wages, low rents, and pension cheques: The introduction of equal wages in the Kimberley, 1968-1969. In: Fijn N, Keen I, Lloyd C, Pickering M, editors. Indigenous participation in Australian economies. II Historical engagements and current enterprises [Internet]. Canberra: ANU ePress; 2012 [cited 2016 Feb 2]. Available from: http://press.anu.edu.au/apps/bookworm/view/Indigenous+Participation+in+Australian+Economies+II/9511/ch08.html
65. Indigenous Land Corporation. ILC agricultural businesses: strategic plan 2013-17 [Internet]. Adelaide: Indigenous Land Corporation; 2013 [cited 2016 Feb 1]. Available from: https://www.ilc.gov.au/IndigenousLandCorporation/media/Items/Content/Publications/Corporate%20Documents/ILC_Agricultural_Businesses_Strategic_Plan_2013-17.pdf
66. McClelland Rural Services Pty Ltd. Managing indigenous pastoral lands [Internet]. Barton, ACT: Rural Industries Research and Development Corporation; 2014 [cited 2016 1 Feb]. Available from: https://rirdc.infoservices.com.au/items/14-014
67. Indigenous Land Corporation. ILC agricultural businesses: strategic plan 2013-17 [Internet]. Indigenous Land Corporation; 2013 [cited 2016 Feb 1]. Available from: https://www.ilc.gov.au/IndigenousLandCorporation/media/Items/Content/Publications/Corporate%20Documents/ILC_Agricultural_Businesses_Strategic_Plan_2013-17.pdf
153 | P a g e
68. Chilcott CR. Growing the North - Opportunities and threats to developing agriculture in the north west of Western Australia. Farm Policy Journal 2009;May 2009:11-23.
69. Novelly PE, Warburton D. A report on the viability of pastoral leases in the Northern Rangelands Region based on biophysical assessment [Internet]. Department of Agriculture and Food, Western Australia; 2011 [updated 2012 Sep 7; cited 2016 Feb 1]; Available from: http://www.parliament.wa.gov.au/publications/tabledpapers.nsf/displaypaper/3912364c1b580013185459e748257da30004e106/$file/tp-2364.pdf
70. Department of Water, Department of Regional development, Department of Lands, Department of Agriculture and Food. Water for Food: West Kimberley projects and alternative land tenure options [Internet]. Perth: Government of Western Australian; 2014 [cited 2016 Feb 1]. Available from: https://www.premier.wa.gov.au/Ministers/Terry-Redman/Documents/programs/waterForFood_factSheet_201407.pdf
71. Central Land Council, Indigenous Land Corporation, Department of Primary Industry, Fisheries and Mines, Northern Land Council, Northern Territory Cattlemen's Association. Breaking new ground: Indigenous pastoral program, Northern Territory [Internet]. Central Land Council; Indigenous Land Corporation; Department of Primary Industry; Fisheries and Mines, Northern Territory; Northern Land Council; and Northern Territory Cattemen's Association; 2003 [cited 2016 Feb 1]. Available from: http://www.nt.gov.au/d/Primary_Industry/Content/File/publications/books_reports/indigenous_pastoral_program.pdf
72. Northern Territory Cattlemen's Association. The Indigenous pastoral program [Internet]. Darwin: Northern Territory Cattlemen's Association; 2015 [cited 2016 Feb 2]. Available from: www.ntca.org.au/our_industry/indigenous.html
73. Indigenous Land Corporation. Indigenous pastoral program [Internet]. Adelaide: Commonwealth of Australia; 2015 [cited 2016 Feb 1]. Available from: http://www.ilc.gov.au/Home/Our-Land-Projects/Indigenous-Pastoral-Program
74. Rural Industries Research and Development Corporation. Indigenous pastoral project [Internet]. Canberra: Commonwealth of Australia; 2015 [cited 2016 Feb 1]. Available from: http://www.rirdc.gov.au/research-programs/rural-people-issues/indigenous-pastoral-project
75. Indigenous Land Corporation. RILS: Regional Indigenous Land Strategy, People, land opportunity: Queensland 2013-2017 [Internet]. ILC; 2013 [cited 2016 Feb 1]. Available from: https://www.ilc.gov.au/IndigenousLandCorporation/media/Items/Content/Publications/Corporate%20Documents/QLD_Regional_Indigenous_Land_Strategy_-_low_res.pdf
76. Indigenous Land Corporation. RILS: Regional Indigenous Land Strategy, People, land opportunity: Northern Territory 2013-2017 [Internet]. ILC; 2013 [cited 2016 Feb 1]. Available from: https://www.ilc.gov.au/IndigenousLandCorporation/media/Items/Content/Publications/Corporate%20Documents/NT-RILS-2013-17-high-res.pdf
77. Department of Aboriginal and Torres Strait Islander Partnerships. Cape York Peninsula tenure resolution program [Internet]. Brisbane: State of Queensland; 2016 [cited 2016 Feb 1]. Available from: http://www.datsip.qld.gov.au/programs-initiatives/cape-york-peninsula-tenure-resolution-program
78. McLean I, Holmes P, Counsell D, Bush AgriBusiness Pty Ltd, Holmes & Co. The Northern beef report: 2013 Northern beef situation analysis [Internet]. North Sydney: Meat and Livestock Australia; 2014 [cited 2016 Feb 1]. Available from:
154 | P a g e
http://www.northerngulf.com.au/sites/default/files/downloads/b.com_.0348_northern_beef_report.pdf
79. McCosker T, McLean D, Holmes P. Northern beef situation analysis 2009. North Sydney: Meat & Livestock Australia; 2010.
80. Hafi A, Addai D, Zhang K, Gray EM. The value of Australia’s biosecurity system at the farm gate: an analysis of avoided trade and on-farm impacts [Internet]. Canberra: Australian Bureau of Agricultural and Resource Economics and Sciences; 2015 [cited 2016 Feb 1]. Available from: http://www.agriculture.gov.au/abares/display?url=http://143.188.17.20/anrdl/DAFFService/display.php?fid=pb_fgvbsd9aab_20150610.xml
81. Richards CA, Lawrence G, Kelly N. Beef production and the environment: is it really 'Hard to be green when you are in the red'? Rural Society 2005;15(2):192-209. doi: 10.5172/rsj.351.15.2.192
82. Paton S. Drought and poverty in central western Queensland [Internet]. Rockhampton: Regional Development Australia, Fitzroy and Central West; 2014 [cited 2016 Feb 1]. Available from: http://rdafcw.com.au/wp-content/uploads/Anti-Poverty-Short-Report.pdf
83. Martin P, Phillips P, Leith R, Caboche T. Australian beef: financial performance of beef cattle producing farms, 2010–11 to 2012–13 [Internet]. Canberra: Australian Bureau of Agricultural and Resource Economics and Sciences; 2014. Report No.:13.8 [cited 2016 1 Feb]. Available from: http://www.agriculture.gov.au/abares/publications/display?url=http://143.188.17.20/anrdl/DAFFService/display.php?fid=pb_abfpfd9aabf00420130724_11a.xml
84. Australian Bureau of Agricultural and Resource Economics and Sciences. Regional farm debt: northern Queensland gulf, south west Queensland and north west New South Wales [Internet]. Canberra: ABARES; 2014 [cited 2016 Feb 1]. Available from: http://www.agriculture.gov.au/abares/publications/display?url=http://143.188.17.20/anrdl/DAFFService/display.php?fid=pb_rfmdtd9aasf20141203.xml
85. Nason J. Gulf cattlemen take debt survey results to Canberra. Beef Central [Internet]. 2014 Aug 27 [cited 2015 Jan 27]. Available from: http://www.beefcentral.com/news/gulf-cattlemen-take-debt-survey-results-to-canberra/
86. Australian Bureau of Agricultural and Resource Economics and Sciences. Australian agricultural and grazing industries survey data. Commonwealth of Australia; 2012.
87. Queensland Government. Rural debt Queensland survey 2011. Brisbane: State of Queensland; 2011.
88. Nason J. Gulf cattlemen take debt survey results to Canberra. Beef Central [Internet]. 2014 Aug 27 [cited 2016 Feb 2]. Available from: http://www.beefcentral.com/news/gulf-cattlemen-take-debt-survey-results-to-canberra/
89. Department of Agriculture and Water Resources. Assistance measures [Internet]. Canberra: Commonwealth of Australia; 2015 [cited 2016 Feb 2]. Available from: http://www.agriculture.gov.au/ag-farm-food/drought/assistance
90. Productivity Commission. Government drought support [Internet]. Melbourne: Productivity Commission Report No. 46 Final Inquiry Report; 2009 [cited 2016 Feb 2]. Available from: http://www.pc.gov.au/inquiries/completed/drought
91. Cockfield G, Botterill L. Rural adjustment schemes: Juggling politics, welfare and markets. Australian Journal of Public Administration 2006;65(2):70-82. doi: 10.1111/j.1467-8500.2006.00483.x

155 | P a g e
92. Burns BM, Fordyce G, Holroyd RG. A review of factors that impact on the capacity of beef cattle females to conceive, maintain a pregnancy and wean a calf—Implications for reproductive efficiency in northern Australia. Anim Reprod Sci. 2010;122(1–2):1-22. doi: 10.1016/j.anireprosci.2010.04.010
93. Gramshaw D, Lloyd P. Grazing the north. Creating wealth and sustaining the land. Brisbane: Information Series, QI92042 Queensland Department of Primary Industries; 1993. (Information Series QI92042).
94. Australian Bureau of Agricultural and Resource Economics and Sciences. Australian agricultural and grazing industries survey [Internet]. 2014 [cited 2016 Feb 2]. Available from: http://www.agriculture.gov.au/abares/surveys
95. Kõlves K, Milner A, McKay K, Leo DD, editors. Suicide in rural and remote areas of Australia [Internet]. Brisbane: Australian Institute for Suicide Research and Prevention; 2012 [cited 2016 Feb 2]. Available from: https://www.griffith.edu.au/__data/assets/pdf_file/0007/471985/Suicide-in-Rural-and-Remote-Areas-of-Australia.pdf
96. McKay K, Milner A, Kõlves K, De Leo D. Suicidal behaviours in rural and remote areas in Australia: A review. In: Kõlves K, Milner A, McKay K, De Leo D, editors. Suicide in rural and remote areas of Australia [Internet]. Brisbane: Australian Institute for Suicide Research and Prevention; 2012 [cited 2016 Feb 2]. Chapter 1. Available from: https://www.griffith.edu.au/__data/assets/pdf_file/0007/471985/Suicide-in-Rural-and-Remote-Areas-of-Australia.pdf
97. Department of Agriculture and Water Resources. Rural Financial Counselling Service (RFCS) [Internet]. Canberra: Commonwealth of Australia; 2015 [cited 2016 Feb 1]. Available from: http://www.agriculture.gov.au/ag-farm-food/drought/assistance/assistancerural-financial-counselling-service
98. Drought Policy Review Expert Social Panel. It's about people: changing perspective. A report to government by an expert social panel on dryness [Internet]. Canberra: Report to the Minister for Agriculture, Fisheries and Forestry; 2008 [cited 2016 Feb 1]. Available from: http://www.agriculture.gov.au/ag-farm-food/drought/drought-policy/history/national_review_of_drought_policy/dryness-report
99. Andersen K, Hawgood J, Klieve H, Kõlves K, De Leo D. Suicide in selected occupations in Queensland: evidence from the state suicide register. Aust N Z J Psychiatry. 2010;44(3):243-9. doi: 10.3109/00048670903487142
100. Kõlves K, McKay K, Leo DD. Individual-level factors related to suicide in rural and remote areas of Queensland. In: Kõlves K, Milner A, McKay K, Leo DD, editors. Suicide in rural and remote areas of Australia [Internet]. Brisbane: Australian Institute for Suicide Research and Prevention; 2012 [cited 2016 Feb 2]. Chapter 3. Available from: https://www.griffith.edu.au/__data/assets/pdf_file/0007/471985/Suicide-in-Rural-and-Remote-Areas-of-Australia.pdf
101. Organisation for Economic Co-operation and Development. Meat consumption (indicator). 2015 [cited 2015 October 29]. Available from: http://dx.doi.org/10.1787/fa290fd0-en
102. Australian Bureau of Statistics. Australian historical population statistics, 2014 [Internet] 2014 [cited 2015 Feb 2]; ABS cat. no. 3105.0.65.001. Available from: http://www.abs.gov.au/ausstats/[email protected]/mf/3105.0.65.001
103. McRae R, Thomas B. Australian cattle industry projections 2014 - mid-year update. North Sydney: Meat and Livestock Australia; 2014.

156 | P a g e
104. Beghin JC, Roland-Holst D, Van Der Mensbrugghe D. Global agricultural trade and the Doha Round: what are the implications for north and south [Internet]. Center for Agricultural and Rural Development, Iowa State University; 2002 [cited 2016 Feb 2]. Available from: http://www.card.iastate.edu/publications/dbs/pdffiles/02wp308.pdf
105. Vanclay F. The impacts of deregulation and agricultural restructuring for rural Australia. Aust J Soc Issues. 2003;38(1):81-94.
106. Productivity Commission. Trends in Australian agriculture [Internet]. Canberra: Productivity Commission; 2005 [cited 2016 Feb 2]. Available from http://www.pc.gov.au/research/completed/agriculture
107. Anderson KYM, Tyers ROD. Agricultural policies of industrial countries and their effects on traditional food exporters. Econ Rec. 1986;62(4):385-99. doi: 10.1111/j.1475-4932.1986.tb00905.x
108. Ravenhill J. Preferential trade agreements and the future of Australian trade policy. Australian Journal of International Affairs 2008;62(2):121-8. doi: 10.1080/10357710802060501
109. McCarthy G, Taylor D. The politics of the float: Paul Keating and the deregulation of the Australian exchange rate1. Aust J Polit Hist. 1995;41(2):219-38. doi: 10.1111/j.1467-8497.1995.tb01259.x
110. Department of Foreign Affairs and Trade. Free trade agreements [Internet]. Canberra: Commonwealth of Australia; 2015 [cited 2016 Feb 1]. Available from: http://dfat.gov.au/trade/agreements/pages/trade-agreements.aspx
111. Directorate General of Livestock and Animal Health Services. Blue Print Program Swasembada Daging Sapi 2014 (Blue Print Self-Sufficiency Program Beef 2014) [Internet]. Jakarta: Ministry of Agriculture Directorate General of Livestock and Animal Health Services; 2010 [cited 2016 Feb 1]. Available from: http://id.pdfsb.com/blue+print+swasembada+daging
112. Meat and Livestock Australia. Statistics database [Internet]. North Sydney: Meat and Livestock Australia; 2015 [cited 2016 Feb 1]. Available from: http://statistics.mla.com.au/Report/List
113. Meat and Livestock Australia. Beef cattle market specifications [Internet]. North Sydney: Meat and Livestock Australia; 2015 [cited 2016 Feb 1]. Available from: http://mbfp.mla.com.au/meeting-market-specifications/Tool-71-beef-cattle-market-specifications
114. Bilharinho C. Brazil red meat update - July 2013 [Internet]. North Sydney: Meat and Livestock Australia; 2012 [cited 2016 Feb 2]. Available from: http://www.mla.com.au/files/225c9ab4-dd77-49ee-b19c-a20500b44114/RMMR_Brazil_July-2013.pdf
115. Poppi DP. Live cattle export industry. In: Kahn L, Cottle D, editors. Beef cattle production and trade. Collingwood: CSIRO Publishing; 2014. p. 235-50.
116. LiveCorp, MLA. Manual for South-East Asian cattle feedlots. Module 1, The Australian production system for live cattle exports [Internet]. LiveCorp and Meat and Livestock Australia; 2013 [cited 2016 Feb 1]. Available from: https://www.livecorp.com.au/sites/default/files/publication/file/manual_for_south_east_asian_cattle_feedlots.pdf
117. Drum F, Gunning-Trant C. Live animal exports: a profile of the Australian industry, ABARE Canberra; 2008.
118. Department of Agriculture, Fisheries and Forestry. Independent review of Australia’s livestock export trade [Internet]. Canberra: Commonwealth of Australia; 2011 [cited 2016 Feb 2]. Available from:

157 | P a g e
http://www.agriculture.gov.au/Style%20Library/Images/DAFF/__data/assets/pdffile/0010/2378197/independent-review-australias-livestock-export-trade.pdf
119. Nason J. Indonesian Government reviewing import policies. Beef Central [Internet]. 2014 Dec [cited 2016 Feb 2]. Available from: http://www.beefcentral.com/trade/export/indonesian-government-reviewing-import-policies/
120. Wong L, Selvanathan EA, Selvanathan S. Modelling the meat consumption patterns in Australia. Econ Model. 2015;49:1-10. doi: 10.1016/j.econmod.2015.03.002
121. Chalfant JA, Alston JM. Accounting for changes in tastes. J Polit Econ. 1988;96(2):391-410. doi: 10.1086/261543
122. Piggott NE, Chalfant JA, Alston JM, Griffith GR. Demand response to advertising in the Australian meat industry. Am J Agric Econ. 1996;78(2):268-79. doi: 10.2307/1243701
123. Jorgensen B. To meat or not to meat?: An analysis of on-line vegetarian persuasive rhetoric. Poroi 2015;11(1):1-19. doi: 10.13008/2151-2957.1220
124. Alexander DD, Weed DL, Miller PE, Mohamed MA. Red meat and colorectal cancer: A quantitative update on the state of the epidemiologic science. J Am Coll Nutr. 2015;34(6):521-43. doi: 10.1080/07315724.2014.992553
125. Bouvard V, Loomis D, Guyton KZ, Grosse Y, Ghissassi FE, Benbrahim-Tallaa L, et al. Carcinogenicity of consumption of red and processed meat. Lancet Oncol. 2015:1-2. doi: 10.1016/S1470-2045(15)00444-1
126. Chan DSM, Lau R, Aune D, Vieira R, Greenwood DC, Kampman E, et al. Red and processed meat and colorectal cancer incidence: Meta-analysis of prospective studies. PLoS One. 2011;6(6):e20456. doi: 10.1371/journal.pone.0020456
127. Meat and Livestock Australia. Human nutrition [Internet]. North Sydney: Meat and Livestock Australia; 2015 [cited 2016 Feb 2]. Available from: http://www.mla.com.au/Research-and-development/Human-nutrition
128. National Health and Medical Research Council. Australian dietary guidelines [Internet]. Canberra: NHMRC; 2013 [cited 2016 Feb 2]. Available from: https://www.nhmrc.gov.au/guidelines-publications/n55
129. Australian Bureau of Statistics. Australian health survey: nutrition first results – foods and nutrients, 2011–12 [Internet]. 2014 [cited 2016 Feb 1]; ABS cat. no. 4364.0.55.007. Available from: http://www.abs.gov.au/AUSSTATS/[email protected]/DetailsPage/4364.0.55.0072011-12?OpenDocument
130. Lea E, Worsley A. Australian consumers’ food-related environmental beliefs and behaviours. Appetite 2008;50(2–3):207-14. doi: 10.1016/j.appet.2005.07.012
131. Harris SM. Does sustainability sell? Market responses to sustainability certification. Management of Environmental Quality: An International Journal 2007;18(1):50-60. doi: 10.1108/14777830710717712
132. Driver T, Saunders C, Guenther M. Sustainability trends in emerging markets: market drivers for sustainable consumption in China and India [Internet]. New Zealand: Agriculture Research Group on Sustainability; 2011 [cited 2016 Feb 2]. Report No.: 11/05; 2011. Available from: http://hdl.handle.net/10182/5596
133. Paull J. The greening of China's food-green food, organic food and eco-labelling [Internet]. In: Sustainable Consumption and Alternative Agri-Food Systems Conference; 2008 May 27-30; Liege University, Arlon, Belgium; [cited 2016 Feb 2]. Available from: http://orgprints.org/13563/1/13563.pdf

158 | P a g e
134. Chang H-S, Kristiansen P. Selling Australia as ‘clean and green’. Aust J Agric Resour Econ. 2006;50(1):103-13. doi: 10.1111/j.1467-8489.2006.00330.x
135. Pahl LI. Adoption of environmental assurance in pastoral industry supply chains – market failure and beyond. Aust J Exp Agric. 2007;47(3):233-44. doi: 10.1071/EA06031
136. Cresswell R, Petheram C, Harrington G, Buettikofer H, Hodgen M, Davies P, et al. Water resources of northern Australia. In: Northern Australia land and water science review 2009: CSIRO; 2009 [cited 2016 Feb 2]. p. 1-40. Chapter 1. Available from: http://www.industry.gov.au/ONA/Reports-and-publications/Documents/Chapter_01-Water_Resources_in_northern_Australia_Final.pdf
137. Martin P. Effect of the Queensland drought on farm financial performance. Agricultural Commodities 2013;December Quarter 2013:25-7.
138. Ash A, Gleeson T, Cui H, Hall M, Heyhoe E, Higgins A, et al. Northern Australia: Food and fibre supply chains study project report [Internet]. Australia: CSIRO & ABARES; 2014 [cited 2016 Feb 2]. Available from: http://industry.gov.au/ONA/Reports-and-publications/Documents/NA-food-fibre-supply-chain-report.pdf
139. Jie F, Parton KA, Cox RJ. Supply chain practice, supply chain performance indicators and competitive advantage of Australian beef enterprises: a conceptual framework. In: Australian Agricultural and Resource Economics Society 51st Annual Conference [Internet]; 2007 Feb 13-16; Queenstown, New Zealand: Australian Agricultural and Resource Economics Society; 2007 [cited 2016 Feb 2]. Available from: http://ageconsearch.umn.edu/handle/10116
140. Queensland Government. Tick clearing facilities. Brisbane: State of Queensland; 2016.
141. García-Flores R, Higgins A, Prestwidge D, McFallan S. Optimal location of spelling yards for the northern Australian beef supply chain. Comput Electron Agric. 2014;102:134-45. doi: 10.1016/j.compag.2014.01.015
142. Queensland Department of Agriculture, Fisheries and Forestry. Investment opportunity: northern outback Queensland abattoir [Internet]. Report prepared for Queensland Department of Agriculture, Fisheries and Forestry by Meateng, Felix Domus, and Tim Hoffman Advisor; 2012 [cited 2016 Feb 2]. Available from: https://www.daf.qld.gov.au/__data/assets/pdf_file/0020/68501/opportunities-doc.pdf
143. Higgins AJ, editor. Livestock industry logistics: optimising industry capital investment and operations [Internet]. CSIRO Sustainable Agriculture Flagship; 2013 [cited 2016 Feb 2]. Available from: http://www.industry.gov.au/ONA/Reports-and-publications/Documents/csiro_final_report_livestock_logistics.pdf
144. Sd+D. Livestock & meat supply chain pilot study. Stage one final report [Internet]. Epping, NSW: National Transport Commission; 2008 [cited 2016 Feb 2]. Available from: http://s3.amazonaws.com/zanran_storage/www.ntc.gov.au/ContentPages/15083173.pdf
145. Landmark. Virtual saleyard sells cattle from Kimberley in minutes. Landmark [Internet]. 2010 Oct [cited 2016 Feb 2]. Available from: http://www.landmark.com.au/livestock-news-194_699.html
146. auctionsplus. Today's auctions. Sydney: AuctionsPlus Pty Ltd; 2015 [cited 2016 Feb 2]. Available from: http://www.auctionsplus.com.au
147. Australian Livestock Markets Association. Index of saleyards [Internet]. 2015 [cited 2016 Feb 2]. Available from: http://www.saleyards.info
148. Berry J. The northern Australian beef sector: A processor’s perspective. In: ABARES Conference, 7th March 2012; Canberra; 2012.

159 | P a g e
149. Australian Agricultural Company. Livingstone beef [Internet]. Brisbane: AACo; 2015 [cited 2016 Feb 2]. Available from: http://www.aaco.com.au/operations/beef-processing-facility/
150. Bloomfield J. Australian Abattoirs: History of Australian canneries, slaughterhouses, meathouses and abattoirs [Internet]. 2015 [cited 2016 Feb 2]. Available from: https://australianabattoirs.wordpress.com/category/australian-abattoirs/northern-territory/top-end/livingstone/
151. Parliament of Australia. Effect of market consolidation on the red meat processing sector [Internet]. Canberra: Commonwealth of Australia; 2015 [cited 2016 Feb 2]. Available from: http://www.aph.gov.au/Parliamentary_Business/Committees/Senate/Rural_and_Regional_Affairs_and_Transport/Red_meat_processing
152. Higgins A, Watson I, Chilcott C, Zhou M, García-Flores R, Eady S, et al. A framework for optimising capital investment and operations in livestock logistics. Rangel J. 2013;35(2):181-91. doi: 10.1071/RJ12090
153. Australian Government. Agricultural competitiveness white paper: stronger farmers, stronger economy [Internet]. Commonwealth of Australia; 2015 [cited 2016 Feb 2]. Available from: https://agriculturalcompetitiveness.dpmc.gov.au/sites/default/files/green_paper.docx
154. Minister for Infrastructure and Regional Development. Beef roads roundtable kicks off in Rockhampton [Internet]. Canberra: Commonwealth of Australia; 2015 [cited 2016 Feb 2]. Available from: http://minister.infrastructure.gov.au/wt/releases/2015/October/wt316_2015.aspx
155. Senate Standing Committee on Rural and Regional Affairs and Transport. Supplementary estimates October 2006, Transport and Regional Services. Answers to questions on notice (AUSL 01 attachment) [Internet]. 2006 [cited 2016 Feb 2]. Available from: http://www.aph.gov.au/~/media/Estimates/Live/rrat_ctte/estimates/sup_0607/dotars/attachments/ausl01attach.ashx
156. ACIL Tasman. The economic impact of the proposed AAco abattoir: an economic impact assessment of the proposed AAco Darwin beef processing facility [Internet]. ACIL Tasman; 2012 [cited 2016 Feb 2]. Available from: http://www.acilallen.com.au/cms_files/ACIL_EconomicImpact_AAcoAbattoir.pdf
157. Norris RT, Norman GJ. National livestock exports mortality summary – 2002 [Internet]. Meat & Livestock Australia; 2003 [cited 2016 Feb 2]. Available from: http://www.livecorp.com.au/LC/files/c3/c3b9e25f-62a9-4940-8f25-5b6518e87319.pdf
158. Norris RT, Norman GJ. National livestock exports mortality summary – 2003 [Internet]. Meat & Livestock Australia; 2004 {cited 2016 Feb 2]. Available from: http://www.livecorp.com.au/LC/files/0f/0fee8f43-9207-4db3-811a-e3a1745c8a38.pdf
159. Norris RT, Norman GJ. National livestock exports mortality summary – 2004 [Internet]. Meat & Livestock Australia; 2005 [cited 2016 Feb 2]. Available from: http://www.livecorp.com.au/LC/files/c2/c2fa879c-ed72-49d4-8579-f231dbd87e0a.pdf
160. Norris RT, Norman GJ. National livestock exports mortality summary – 2005 [Internet]. Meat & Livestock Australia; 2006 [cited 2016 Feb 2]. Available from: http://www.livecorp.com.au/LC/files/3b/3be8919d-d0bf-4cbb-a44d-f34db01d82a3.pdf
161. Norris RT, Norman GJ. National livestock exports mortality summary 2006 [Internet]. Meat & Livestock Australia; 2007 [cited 2016 Feb 2]. Available from: http://www.livecorp.com.au/LC/files/42/42c7a3d6-6186-47bf-8ad6-11aaaa7c3f4a.pdf
162. Norris RT, Norman GJ. National livestock export industry shipboard performance report 2007 [Internet]. Meat & Livestock Australia; 2008 [cited 2016 Feb 2]. Available from:

160 | P a g e
http://www.livecorp.com.au/research-development/reports/national-livestock-export-industry-shipboard-p-(4)
163. Norris RT, Norman GJ. National livestock export industry shipboard performance report 2008 [Internet]. Meat & Livestock Australia; 2009 [cited 2016 Feb 2]. Available from: http://www.livecorp.com.au/research-development/reports/national-livestock-export-industry-shipboard-p-(6)
164. Norris RT, Norman GJ. National livestock export industry shipboard performance report 2009 [Internet]. Meat & Livestock Australia; 2010 [cited 2016 Apr 5]. Available from: http://www.livecorp.com.au/research-development/reports/national-livestock-export-industry-shipboard-p-(5)
165. Norris RT, Norman GJ. National livestock export industry shipboard performance report 2010 [Internet]. Meat & Livestock Australia; 2011 [cited 2016 Feb 2]. Available from: http://www.livecorp.com.au/research-development/reports/national-livestock-export-industry-shipboard-p-(7)
166. Norris RT, Norman GJ. National livestock export industry shipboard performance report 2011 [Internet]. Meat & Livestock Australia; 2012 [cited 2016 Feb 2]. Available from: http://www.livecorp.com.au/research-development/reports/national-livestock-export-industry-shipboard-p-(8)
167. Norris RT, Norman GJ. National livestock export industry shipboard performance report 2012 [Internet]. Meat & Livestock Australia; 2013 [cited 2016 Feb 2]. Available from: http://www.livecorp.com.au/research-development/reports/national-livestock-export-industry-shipboard-p-(9)
168. Meat and Livestock Australia. LiveLink November 2014 [Internet]. Meat and Livestock Australia; 2014 [cited 2016 Feb 2]. Available from: http://www.mla.com.au/CustomControls/PaymentGateway/ViewFile.aspx?HWhUkIXW2DET5JoZn0IC5yHN8eRBhkoQ3a3TBjMrrDyOu2OkSsgVkRbDmNma1iuWTmRqcq2JNktxyff86MAU2kSVrVfHSrJOnZ1IhEDlrv8Wit16GJGuYf0qUR6W038+
169. Australian and New Zealand Environment and Conservation Council and Agriculture and Resource Management Council of Australia and New Zealand. Australian and New Zealand guidelines for fresh and marine water quality Paper No 4. Primary industries — rationale and background information (Irrigation and general water uses, stock drinking water, aquaculture and human consumers of aquatic foods) [Internet]. ANZECC, ARMCANZ; 2000 [cited 2016 Feb 2]. Available from: http://www.environment.gov.au/system/files/resources/e080174c-b267-455e-a8db-d3f79e3b2142/files/nwqms-guidelines-4-vol3.pdf
170. Luke GJ. Consumption of water by livestock [Internet]. Western Australian Department of Agriculture, Division of Resource Management; 1987 [cited 2016 Feb 2]. Available from: http://researchlibrary.agric.wa.gov.au/cgi/viewcontent.cgi?article=1053&context=rmtr
171. Hunt LP, McIvor JG, Grice AC, Bray SG. Principles and guidelines for managing cattle grazing in the grazing lands of northern Australia: stocking rates, pasture resting, prescribed fire, paddock size and water points – a review. Rangel J. 2014;36(2):105-19. doi: 10.1071/RJ13070
172. Petheram C, McMahon TA, Peel MC. Flow characteristics of rivers in northern Australia: implications for development. J Hydrol (Amst). 2008;357(1–2):93-111. doi: 10.1016/j.jhydrol.2008.05.008
173. Howden SM, Crimp SJ, Stokes CJ. Climate change and Australian livestock systems: impacts, research and policy issues. Aust J Exp Agr. 2008;48(7):780-8. doi: 10.1071/EA08033
161 | P a g e
174. McJannet D, Marvanek S, Henderson A, Petheram C, Jim W. Instream waterholes: a technical report to the Australian Government from the CSIRO Flinders and Gilbert Agricultural Resource Assessment, part of the North Queensland Irrigated Agriculture Strategy [Internet]. Australia: CSIRO Water for a Healthy Country and Sustainable Agriculture flagships; 2013 [cited 2016 Feb 2]. Report No.:1835095X. Available from: https://publications.csiro.au/rpr/pub?pid=csiro:EP132036
175. Evans R. The impact of groundwater use on Australia’s rivers [Internet]. Canberra: Sinclair Knight Merz; 2007 [cited 2016 Feb 2]. Available from: http://www.srw.com.au/Files/Technical_reports/The_Impact_of_Groundwater_Use_on_Australia%E2%80%99s_Rivers.pdf
176. Braithwaite RW, Muller WJ. Rainfall, groundwater and refuges: Predicting extinctions of Australian tropical mammal species. Austral Ecol. 1997;22:57-67. doi: 10.1111/j.1442-9993.1997.tb00641.x
177. Anderegg WRL, Kane JM, Anderegg LDL. Consequences of widespread tree mortality triggered by drought and temperature stress. Nat Clim Chang. 2013;3(1):30-6. doi: 10.1038/nclimate1635
178. Herczeg AL, Love AJ. Review of recharge mechanisms for the Great Artesian Basin [Internet]. Glen Osmond, South Australia: CSIRO; 2007 [cited 2016 Feb 2]. Available from: https://www.environment.gov.au/resource/review-recharge-mechanisms-great-artesian-basin
179. Cook PG, Hatton TJ, Pidsley D, Herczeg AL, Held A, O’Grady A, et al. Water balance of a tropical woodland ecosystem, Northern Australia: A combination of micro-meteorological, soil physical and groundwater chemical approaches. J Hydrol (Amst). 1998;210(1–4):161-77. doi: 10.1016/S0022-1694(98)00181-4
180. Hunt C. Economy and ecology of emerging markets and credits for bio-sequestered carbon on private land in tropical Australia. Ecol Econ. 2008;66(2–3):309-18. doi: 10.1016/j.ecolecon.2007.09.012
181. Walsh D. “Better farming” or “carbon farming”? Show me the money! In: Proceedings of the Northern Beef Research Update Conference, 2013; Cairns. Gympie: Queensland North Australia Beef Research Council; 2013. p. 100.
182. Queensland. Department of Agriculture, Fisheries and Forestry. Queensland’s agriculture strategy: A 2040 vision to double agricultural production [Internet]. State of Queensland; 2013 [cited 2016 Feb 2]. Available from: http://rti.cabinet.qld.gov.au/documents/2013/jun/qld%20ag%20strat/Attachments/Attachment%20-%20Queensland%20Agriculture%20Strategy.PDF
183. Petheram C, Watson I, Stone P, editors. Agricultural resource assessment for the Flinders catchment. A report to the Australian Government from the CSIRO Flinders and Gilbert Agricultural Resource Assessment, part of the North Queensland Irrigated Agriculture Strategy [Internet]. CSIRO Water for a Healthy Country and Sustainable Agriculture flagships, Canberra, Australia; 2013 [cited 2016 Feb 2]. Available from: https://publications.csiro.au/rpr/pub?pid=csiro:EP1312940
184. Petheram C, Watson I, Stone P, editors. Agricultural resource assessment for the Gilbert catchment. A report to the Australian Government from the CSIRO Flinders and Gilbert Agricultural Resource Assessment, part of the North Queensland Irrigated Agriculture Strategy [Internet]. CSIRO Water for a Healthy Country and Sustainable Agriculture flagships, Canberra, Australia; 2013 [cited 2016 Feb 2]. Available from: http://www.industry.gov.au/ONA/Reports-and-publications/Documents/FGARA_GilbertSummaryReport_WEB_140201.pdf

162 | P a g e
185. Stokes C, McAllister R, Ash A, Gross J. Changing Patterns of Land Use and Tenure in the Dalrymple Shire, Australia. Fragmentation in Semi-Arid and Arid Landscapes. 2008. p. 93-112. doi: 10.1007/978-1-4020-4906-4_4
186. Stokes CJ, McAllister RRJ, Ash AJ. Fragmentation of Australian rangelands: processes, benefits and risks of changing patterns of land use. Rangel J. 2006;28(2):83-96. doi: 10.1071/RJ05026
187. Department of Mines and Petroleum. Mineral titles online [Internet]. Perth: Western Commonwealth of Australia; 2016 [cited 2016 Feb 2]. Available from: http://www.dmp.wa.gov.au/Mineral-Titles-online-MTO-1464.aspx
188. Department of Mines and Energy. Strike - Tenure and geoscience information [Internet]. Darwin: Northern Territory Government; 2015 [cited 2016 Feb 2]. Available from: http://strike.nt.gov.au
189. Department of Natural Resources and Mines. MinesOnlineMaps [Internet]. Brisbane: State of Queensland; 2015 [cited 2016 Feb 2]. Available from: https://minesonlinemaps.business.qld.gov.au/
190. Geoscience Australia, BREE. 2012, Australian gas resource assessment 2012 [Internet]. Canberra: Geoscience Australia and Bureau of Resources and Energy Economics; 2012 [cited 2016 Feb 2]. Available from: http://www.appea.com.au/wp-content/uploads/2013/05/BREE-2012-GasResource_Assessment.pdf
191. Geoscience Australia, ABARE. Australian energy resource assessment report 2010 [Internet]. Canberra: Geoscience Australia and Australian Bureau of Agricultural and Resource Economics; 2010 [cited 2016 Feb 2]. Available from: http://www.ga.gov.au/metadata-gateway/metadata/record/gcat_70142
192. Bradshaw M, Hall L, Copeland A, Hitchins N. Australian gas resource assessment 2012 [Internet]. Canberra: Department of Resources, Energy and Tourism; Geoscience Australia; and Bureau of Resources and Energy Economics; 2012 [cited 2016 Feb 2]. Available from: https://researchdata.ands.org.au/australian-gas-resource-assessment-2012/571579
193. Department of State Development. Major projects [Internet]. Brisbane: State of Queensland; 2015 [cited 2016 Feb 2]. Available from: http://www.statedevelopment.qld.gov.au/major-projects/major-projects.html
194. Geoscience Australia. Australian mines and mineral deposits map [Internet]. Canberra: Commonwealth of Australia; 2004 [cited 2016 Feb 2]. Available from: http://www.ga.gov.au/metadata-gateway/metadata/record/gcat_68473
195. Duus S. Coal contestations: Learning from a long, broad view. Rural Society 2013;22(2):96-110. doi: 10.5172/rsj.2013.22.2.96
196. Barclay MA, Everingham J-A, Cheshire L, Brereton D, Pattenden C, Lawrence G. Local government, mining companies and resource development in regional Australia: meeting the governance challenge [Internet]. Centre for Social Responsibility in Mining, University of Queensland; 2012 [cited 2016 Feb 2]. Available from: http://espace.library.uq.edu.au/view/UQ:283884/Governance_of_mining_regions_Final_report_2012.pdf
197. Taylor MP, Mackay AK, Hudson-Edwards KA, Holz E. Soil Cd, Cu, Pb and Zn contaminants around Mount Isa city, Queensland, Australia: potential sources and risks to human health. Appl Geochem. 2010;25(6):841-55. doi: 10.1016/j.apgeochem.2010.03.003
198. Mackay AK, Taylor MP, Munksgaard NC, Hudson-Edwards KA, Burn-Nunes L. Identification of environmental lead sources and pathways in a mining and smelting town: Mount Isa, Australia. Environ Pollut. 2013;180:304-11. doi: 10.1016/j.envpol.2013.05.007

163 | P a g e
199. Hamawand I, Yusaf T, Hamawand SG. Coal seam gas and associated water: a review paper. Renewable and Sustainable Energy Reviews 2013;22:550-60. doi: 10.1016/j.rser.2013.02.030
200. Swayne N. Regulating coal seam gas in Queensland: lessons in an adaptive environmental management approach? Environmental and Planning Law Journal 2012;29(2):163-85.
201. Geoscience Australia, Habermehl M. Summary of advice in relation to the potential impacts of coal seam gas extraction in the Surat and Bowen Basins, Queensland: phase one [Internet]. Canberra: Report Summary for the Australian Government Department of Sustainability, Environment, Water, Population and Environment; 2010 [cited 2016 Feb 2]. Available from: www.environment.gov.au/epbc/notices/pubs/gladstone-ga-report.pdf
202. Moya CE, Raiber M, Cox ME. Three-dimensional geological modelling of the Galilee and central Eromanga basins, Australia: New insights into aquifer/aquitard geometry and potential influence of faults on inter-connectivity. Journal of Hydrology: Regional Studies 2014;2:119-39. doi: 10.1016/j.ejrh.2014.08.007
203. Comino M, Tan P-L, George D. Between the cracks: water governance in Queensland, Australia and potential cumulative impacts from mining coal seam gas. Journal of Water Law 2014;23:219-28.
204. Moomen AW, Dewan A. Mining, agricultural space and land use conflicts: The role of local government. In: Agro-Geoinformatics (Agro-geoinformatics), 2015 Fourth International Conference on, 20-24 July 2015; 2015. p. 228-33. doi: 10.1109/Agro-Geoinformatics.2015.7248103
205. Chen C, Randall A. The economic contest between coal seam gas mining and agriculture on prime farmland: it may be closer than we thought. Journal of Economic and Social Policy [Internet]. 2013 [cited 2016 Feb 2];15(3):5. Available from: http://epubs.scu.edu.au/jesp/vol15/iss3/5
206. Bodenmann J, Cameron M, O’Hare K, Solomon E. A comparative study into the rights of landholders to prevent access to land by mining companies [Internet]. University of Queensland; 2012 [cited 2016 Feb 2]. Available from: http://www.law.uq.edu.au/documents/pro-bono-centre/publications/Research-note-comparative-study-landholders-rights-July-2012.pdf
207. Andrews A. Fragmentation of habitat by roads and utility corridors: a review. Aust Zool. 1990;26(3):130-41. doi: 10.7882/AZ.1990.005
208. Grech A, Bos M, Brodie J, Coles R, Dale A, Gilbert R, et al. Guiding principles for the improved governance of port and shipping impacts in the Great Barrier Reef. Mar Pollut Bull. 2013;75(1–2):8-20. doi: 10.1016/j.marpolbul.2013.07.013
209. McCook LJ, Schaffelke B, Apte SC, Brinkman R, Brodie J, Erftemeijer P, et al. Synthesis of current knowledge of the biophysical impacts of dredging and disposal on the Great Barrier Reef: report of an Independent Panel of Experts [Internet]. Townsville: Great Barrier Reef Marine Park Authority; 2015 [cited 2016 Feb 1]. Available from: http://elibrary.gbrmpa.gov.au/jspui/bitstream/11017/2935/1/DredgeSynthesisReport_Mar15Update.pdf
210. Department of State Development. Galilee Basin State Development Area [Internet]. Brisbane: State of Queensland; 2015 [cited 2016 Feb 2]. Available from: http://www.statedevelopment.qld.gov.au/coordinator-general/galilee-basin-state-development-area.html
211. Walton A, McCrea R, Leonard R. CSIRO survey of community wellbeing and responding to change: Western Downs region in Queensland [Internet]. CSIRO Technical report. Australia:
164 | P a g e
CSIRO; 2014 [cited 2016 Feb 2]. Available from: http://www.gisera.org.au/publications/tech_reports_papers/socioeco-proj-3-community-wellbeing-report.pdf
212. Hossain D, Gorman D, Chapelle B, Mann W, Saal R, Penton G. Impact of the mining industry on the mental health of landholders and rural communities in southwest Queensland. Australas Psychiatry. 2013;21(1):32-7. doi: 10.1177/1039856212460287
213. Lockie S, Franettovich M, Petkova-Timmer V, Rolfe J, Ivanova G. Coal mining and the resource community cycle: a longitudinal assessment of the social impacts of the Coppabella coal mine. Environ Impact Assess Rev. 2009;29(5):330-9. doi: 10.1016/j.eiar.2009.01.008
214. Franks DM, Brereton D, Moran CJ. Managing the cumulative impacts of coal mining on regional communities and environments in Australia. Impact Assessment and Project Appraisal 2010;28(4):299-312. doi: 10.3152/146155110X12838715793129
215. Blainey G, Cumming M. The rush that never ended: A history of Australian mining. Melbourne: Melbourne University Press; 1969.
216. Centre for the Government of Queensland. Queensland places: Dalrymple Shire [Internet]. Brisbane: University of Queensland; 2015 [cited 2016 Feb 3]. Available from: http://queenslandplaces.com.au/dalrymple-shire
217. Storey K. Fly-in/fly-out and fly-over: mining and regional development in Western Australia. Aust Geogr. 2001;32(2):133-48. doi: 10.1080/00049180120066616
218. Hajkowicz SA, Heyenga S, Moffat K. The relationship between mining and socio-economic well being in Australia’s regions. Resources Policy 2011;36(1):30-8. doi: 10.1016/j.resourpol.2010.08.007
219. Carrington K, Pereira M. Social impact of mining survey: aggregate results Queensland communities [Internet]. School of Justice, Queensland University of Technology; 2011 [cited 2016 Feb 3]. Available from: http://eprints.qut.edu.au/42056/1/42056.pdf
220. Charters Towers Regional Council. Hervey Range [Internet]. Charters Towers, Qld: Charters Towers Regional Council; 2015 [cited 2016 Feb 3]. Available from: www.charterstowers.qld.gov.au/hervey-range
221. Adamson D. Determining the economic impact of parthenium on the Australian beef industry: a comparison of static and dynamic approaches [Internet]. St Lucia: University of Queensland; 1996 [cited 2016 Feb 1]. Available from: http://www.researchgate.net/profile/David_Adamson/publication/236248632_Determining_the_Economic_Impact_of_Parthenium_on_the_Australian_Beef_Industry_A_Comparison_of_Static_and_Dynamic_Approaches/links/004635179e4597bee4000000.pdf
222. Department of Land Resource Management. Weeds [Internet]. Darwin: Northern Territory Government; 2010 [cited 2016 Feb 3]. Available from: http://www.lrm.nt.gov.au/weeds
223. Bortolussi G, McIvor JG, Hodgkinson JJ, Coffey SG, Holmes CR. The northern Australian beef industry, a snapshot. 4. Condition and management of natural resources. Aust J Exp Agric. 2005;45(9):1109-20. doi: 10.1071/EA03262
224. Department of Primary Industries Fisheries and Mines. Pastoral industry survey – Katherine [Internet]. Darwin: Department of Primary Industries Fisheries and Mines, Northern Territory Government; 2004 [cited 2016 Feb 3]. Available from: http://www.futurebeef.com.au/wp-content/uploads/2011/09/2004_Pastoral_Survey_Report-Katherine.pdf
165 | P a g e
225. Anon. Roper River rangers in control. Landcare in Focus [Internet]. 2012 [cited 2016 Feb 3];(2 Feb 2012):5. Available from: http://www.landcareonline.com.au/wp-content/uploads/2012/02/LIF_Feb12_compressed.pdf
226. Gordon A, Reid A, Shepherd RN, Vitelli M. A survey of Dalrymple Shire graziers grazing land management practices 1994 to 2004 [Internet]. 2008 [cited 2016 Feb 3]. Available from: www.dalrymplelandcare.org.au/wp-content/uploads/GRAZING-LAND-MANAGEMENT-SURVEY.pdf
227. Department of Primary Industries Fisheries and Mines. Pastoral industry survey – Darwin [Internet]. Darwin: Department of Primary Industries Fisheries and Mines, Northern Territory Government; 2004 [cited 2016 Feb 3]. Available from: http://www.futurebeef.com.au/wp-content/uploads/2011/09/2004_Pastoral_Survey_Report-Darwin.pdf
228. Bortolussi G, Hodgkinson JJ, Holmes CR, McIvor JG, Coffey SG. Victoria River District region report: report on the northern Australian beef industry survey activity. Indooroopilly: CSIRO Division of Tropical Agriculture; 1999.
229. Dyer R. Russell-Smith J, Hill G, Djoeroemana S, Myers BA, editors. The role of fire on pastoral lands in Northern Australia. In: Russell-Smith J, Hill G, Djoeroemana S, Myers BA, editors. Fire and Sustainable Agricultural and Forestry Development in Eastern Indonesia and Northern Australia, 13–15 April 1999; Darwin, Australia: Australian Centre for International Agricultural Research; 2000. p. 108-12.
230. Department of Primary Industries and Fisheries. Using fire to manage thickened woody vegetation in the Gulf region [Internet]. Department of Primary Industries and Fisheries, Queensland; 2012 [cited 2016 Feb 3]. Available from: http://www.futurebeef.com.au/wp-content/uploads/2011/11/Using_fire_in_the_Gulf_region_of_Queensland.pdf
231. Bastin G, Ludwig JA, Eager R, Liedloff A, Andison R, Cobiac M. Vegetation changes in a semiarid tropical savanna, northern Australia: 1973-2002. Rangel J. 2003;25(1):3-19. doi: 10.1071/RJ03001
232. McIvor JG, Coffey SG, Hodgkinson JJ, Holmes CR. Katherine region report: report on the northern Australian beef industry survey activity. CSIRO Division of Tropical Agriculture, Indooroopilly, Australia; 1999.
233. Dyer R. Fire and vegetation management in pasture lands of the Victoria River District, Northern Territory [master’s thesis]. Brisbane: University of Queensland; 2001. 194 p.
234. Burrows WH, Henry BK, Back PV, Hoffmann MB, Tait LJ, Anderson ER, et al. Growth and carbon stock change in eucalypt woodlands in northeast Australia: ecological and greenhouse sink implications. Glob Chang Biol. 2002;8(8):769-84. doi: 10.1046/j.1365-2486.2002.00515.x
235. Fensham RJ, Fairfax RJ, Archer SR. Rainfall, land use and woody vegetation cover change in semi-arid Australian savanna. J Ecol. 2005;93(3):596-606. doi: 10.1111/j.1365-2745.2005.00998.x
236. AEC Group. Economic impact of state and local government expenditure on weed and pest animal management in Queensland. Newstead, Queensland: Local Government Association of Queensland; 2002.
237. Sinden J, Jones R, Hester S, Odom D, Kalisch C, James R, et al. The economic impact of weeds in Australia [Internet]. CRC for Weed Management Technical Series #8; 2004 [cited 2016 Feb 3]. Available from: https://www.cbd.int/financial/values/australia-economicweeds.pdf
238. Martin TG, van Klinken RD. Value for money? Investment in weed management in Australian rangelands. Rangel J. 2006;28(1):63-75. doi: 10.1071/RJ06015

166 | P a g e
239. Kloessing K. Estimating the financial loss caused by parthenium weed in the Queensland grazing industry. Brisbane: CRC for Tropical Pest Management; 1994.
240. Chippendale JF, Panetta FD. The cost of parthenium weed to the Queensland cattle industry. Plant Prot Q. 1994;9(2):73-6.
241. Adamson D, Lynch K. An economic assessment of SWEEP, RDE Connections, NRSM. University of Queensland; 2000.
242. Queensland Government. War on western weeds (Woww) [Internet]. Brisbane: State of Queensland; 2015 [cited 2016 Feb 3]. Available from: http://www.business.qld.gov.au/industry/agriculture/land-management/health-pests-weeds-diseases/weeds-and-diseases/war-on-western-weeds
243. Kriticos DJ, Sutherst RW, Brown JR, Adkins SW, Maywald GF. Climate change and the potential distribution of an invasive alien plant: Acacia nilotica ssp. indica in Australia. J Appl Ecol. 2003;40(1):111-24. doi: 10.1046/j.1365-2664.2003.00777.x
244. Gong W, Sinden J, Braysher M, Jones R. The economic impacts of vertebrate pests in Australia [Internet]. Canberra: Invasive Animals Cooperative Research Centre; 2009 [cited 2016 Feb 3]. Available from: http://www.feral.org.au/wp-content/uploads/2010/03/IACRC_EconomicImpactsReport.pdf
245. Fleming PJS, Allen LR, Lapidge SJ, Robley A, Saunders GR, Thomson PC. A strategic approach to mitigating the impacts of wild canids: proposed activities of the Invasive Animals Cooperative Research Centre. Aust J Exp Agric. 2006;46(7):753-62. doi: 10.1071/EA06009
246. Prowse TAA, Johnson CN, Cassey P, Bradshaw CJA, Brook BW. Ecological and economic benefits to cattle rangelands of restoring an apex predator. J Appl Ecol. 2014;52(2):455-66. doi: 10.1111/1365-2664.12378
247. Pople T, Grigg GC. Commercial harvesting of kangaroos in Australia. Canberra: Environment Australia; 1999.
248. Nimmo DG, Watson SJ, Forsyth DM, Bradshaw CJA. Dingoes can help conserve wildlife and our methods can tell. J Appl Ecol. 2014;52(2):281-85. doi: 10.1111/1365-2664.12369
249. Fisher A, Hunt L, James C, Landsberg J, Phelps D, Smyth A, et al. Review of total grazing pressure management issues and priorities for biodiversity conservation in rangelands: a resource to aid NRM planning [Internet]. Darwin: Desert Knowledge CRC, Alice Springs, and Tropical Savannas Management CRC; 2004 [cited 2016 Feb 3]. Available from: https://www.environment.gov.au/system/files/resources/ac936913-ec96-4c30-8a5c-4d1d45f0db5d/files/grazing-management.pdf
250. James CD, Landsberg J, Morton SR. Provision of watering points in the Australian arid zone: a review of effects on biota. J Arid Environ. 1999;41(1):87-121. doi: 10.1006/jare.1998.0467
251. McLeod R, Norris RT. Counting the cost: impact of invasive animals in Australia [Internet]. Cooperative Research Centre for Pest Animal Control; 2004 [cited 2016 Feb 3]. Available from: http://www.feral.org.au/counting-the-cost-impact-of-invasive-animals-in-australia-2004/
252. Bailey PT, editor. Pests of field crops and pastures: Identification and control. Collingwood: CSIRO Publishing; 2007.
253. Hunter DM, Elder RJ. Rainfall sequences leading to population increases of Austracris guttulosa (Walker) (Orthoptera: Acrididae) in arid north-eastern Australia. Australian J Entomol. 1999;38(3):204-18. doi: 10.1046/j.1440-6055.1999.00105.x
254. Walker BH. Ecological consequences of atmospheric and climate change. Clim Change. 1991;18(2-3):301-16. doi: 10.1007/BF00139003

167 | P a g e
255. Lehane R. Beating the odds in a big country: the eradication of bovine brucellosis and tuberculosis in Australia. Collingwood: CSIRO Publishing; 1996.
256. Souza-Monteiro DM, Caswell JA. The economics of implementing traceability in beef supply chains: trends in major producing and trading countries [Internet]. Amherst: Department of Resource Economics, University of Massachusetts; 2004 [cited 2016 Feb 3]. Available from: http://courses.umass.edu/resec/workingpapers/documents/resecworkingpaper2004-6.pdf
257. Department of Agriculture and Water Resources. Foot-and-mouth disease [Internet]. Canberra: Commonwealth of Australia; 2016 [cited 2016 Feb 3]. Available from: http://www.agriculture.gov.au/pests-diseases-weeds/animal/fmd
258. Australian Quarantine and Inspection Service. Animal quarantine policy on bovine spongiform encephalopathy (BSE) [Internet]. Canberra: Commonwealth of Australia; 1999 [cited 2016 Feb 3]. Available from: http://www.agriculture.gov.au/SiteCollectionDocuments/ba/memos/1999/animal/99-022a.doc
259. Tozer P, Marsh TL. Domestic and trade impacts of foot-and-mouth disease on the Australian beef industry. Aust J Agric Resour Econ. 2012;56(3):385-404. doi: 10.1111/j.1467-8489.2012.00586.x
260. Buetre B, Wicks S, Kruger H, Millist N, Yainshet A, Garner G, et al. Potential socio‐economic impacts of an outbreak of foot‐and‐mouth disease in Australia [Internet]. Canberra: Australian Bureau of Agricultural and Resource Economics and Sciences; 2013 [cited 2016 Feb 3]. Research Report No.: 13.11. Available from: http://www.agriculture.gov.au/abares/publications/display?url=http://143.188.17.20/anrdl/DAFFService/display.php?fid=pb_pseiFMDd9abbl20131011_11a.xml
261. Sackett D, Holmes P, Abbott K, Jephcott S, Barber M. Assessing the economic cost of endemic disease on the profitability of Australian beef cattle and sheep producers [Internet]. Meat and Livestock Australia Final Report for Project AHW.087; 2006 [cited 2016 Feb 3]. Available from: http://www.mla.com.au/Research-and-development/Search-RD-reports/RD-report-details/Animal-Health-and-Biosecurity/Assessing-the-economic-cost-of-endemic-disease-on-the-profitability-of-Australian-beef-cattle-and-sheep-producers/120
262. Animal Health Australia. BJD zones and areas [Internet]. Canberra: Animal Health Australia; 2015 [cited 2016 Feb 3]. Available from: http://www.animalhealthaustralia.com.au/what-we-do/endemic-disease/johnes-disease/bjd-and-cattle-trading/bjd-zones-and-areas
263. Finlay MB, Hill J. Bovine Johne’s D review: future directions - independent review. Report prepared for Minister John McVeigh April 30, 2013 [Internet]; 2013 [cited 2016 Feb 3]. Available from: https://www.daf.qld.gov.au/__data/assets/pdf_file/0006/85299/BJD-report-independent-review.pdf
264. Department of Agriculture, Fisheries and Forestry. Summary of factors and costs associated with different bovine Johne’s disease management options in Queensland [Internet]. State of Queensland; 2014 [cited 2016 Feb 3]. Available from: https://www.daff.qld.gov.au/__data/assets/pdf_file/0020/127442/summary-of-factors-and-costs-associated-with-different-bjd-management-options-in-qld.pdf
265. McKeon GM, Stone GS, Syktus JI, Carter JO, Flood NR, Ahrens DG, et al. Climate change impacts on northern Australian rangeland livestock carrying capacity: a review of issues. Rangel J. 2009;31(1):1-29. doi: 10.1071/RJ08068
266. Ward MP. Climatic factors associated with the prevalence of bluetongue virus infection of cattle herds in Queensland, Australia. Veterinary Record 1994;134(16):407-10. doi: 10.1136/vr.134.16.407

168 | P a g e
267. Purse BV, Mellor PS, Rogers DJ, Samuel AR, Mertens PPC, Baylis M. Climate change and the recent emergence of bluetongue in Europe. Nat Rev Micro. 2005;3(2):171-81. doi: 10.1038/nrmicro1090
268. Stockdale M, Huey A-M, Dray R, Holmes P, Smith PC. Kimberley and Pilbara RD&E program: phase 1 [Internet]. Meat and Livestock Australia; 2012 [cited 2016 Feb 3]. Available from: http://www.mla.com.au/CustomControls/PaymentGateway/ViewFile.aspx?3SpITZbH+jINq/0QXlEEmLfIUpy7LZHlqZABsed9y6TAkQxF/7KHSCHXdT+g3+Lc3EYMKKAfsht7d1Tnt3BqiA==
269. Russell-Smith J. Pre-contact Aboriginal, and contemporary fire regimes of the savanna landscapes of northern Australia: patterns, changes and ecological processes. In: Australian fire regimes: contemporary patterns (April 1998-March 200) and changes since European settlement Australia: State of Environment Second Technical Paper Series (Biodiversity), Series 2 [Internet]. Canberra: Department of Environment and Heritage; 2002 [cited 2016 Feb 3]. Available from: http://laptop.deh.gov.au/soe/2001/publications/technical/fire/part4.html
270. Drucker AG, Garnett ST, Luckert MK, Crowley GM, Gobius N. Manager-based valuations of alternative fire management regimes on Cape York Peninsula, Australia. International Journal of Wildland Fire 2008;17(5):660-73. doi: 10.1071/WF07102
271. Dyer R, Stafford Smith M. Ecological and economic assessment of prescribed burning impacts in semi-arid pastoral lands of northern Australia. International Journal of Wildland Fire 2003;12:403-13. doi: 10.1071/WF03026
272. Bray SG, Liedloff AC, Sim AK, Back PV, Cook GD, Hoffmann MB. Comparison of woody vegetation change datasets from the grazed woodlands of central Queensland. In: Pattie B, Restall B, editors. Northern Beef Research Update Conference 2007; Townsville; 2007. Park Ridge: Northern Beef Research Council; 2007. p. 70–7.
273. Cowley RA, Hearnden MH, Joyce KE, Tovar-Valencia M, Cowley TM, Pettit CL, et al. How hot? How often? Getting the fire frequency and timing right for optimal management of woody cover and pasture composition in northern Australian grazed tropical savannas. Kidman Springs fire experiment 1993–2013. Rangel J. 2014;36(4):323-45. doi: 10.1071/RJ14030
274. Crowley GM, Garnett ST. Vegetation change in the grasslands and grassy woodlands of east-central Cape York Peninsula, Australia. Pac Conserv Biol. 1998;4:132-48. doi: 10.1071/PC980132
275. Crowley GM, Garnett ST. Changing fire management in the pastoral lands of Cape York Peninsula: 1623 to 1996. Aust Geogr Stud. 2000;38:10-26. doi: 10.1111/1467-8470.00097
276. NAFI. North Australian fire information [Internet]. Darwin: Charles Darwin University; 2015 [cited 2016 Feb 3]; Available from: http://www.firenorth.org.au
277. Payne AL, Watson IW, Novelly PE. Spectacular recovery in the Ord River catchment [Internet]. South Perth: Department of Agriculture Western Australia; 2004 [cited 2016 Feb 3]. Available from: http://researchlibrary.agric.wa.gov.au/misc_pbns/6/
278. Pickup G. Desertification and climate change-the Australian perspective. Climate Research 1998;11(1):51-63. doi: 10.3354/cr011051
279. Mifsud C. Effect of the Queensland drought on livestock and crop production. Agricultural Commodities 2013;3(4):22-4.
280. O’Reagain P, Scanlan J, Hunt L, Cowley R, Walsh D. Sustainable grazing management for temporal and spatial variability in north Australian rangelands – a synthesis of the latest evidence and recommendations. Rangeland J. 2014;36(3):223-32. doi: . 10.1071/RJ13110

169 | P a g e
281. Etheridge DM, Steele LP, Langenfelds RL, Francey RJ, Barnola JM, Morgan VI. Natural and anthropogenic changes in atmospheric CO2 over the last 1000 years from air in Antarctic ice and firn. J Geophys Res Atmos. 1996;101(D2):4115-28. doi: 10.1029/95JD03410
282. National Oceanic and Atmospheric Administration. Trends in atmospheric carbon dioxide [Internet]. Boulder, Colorado: United States Department of Commerce; 2015 [cited 2016 Feb 3]. Available from: http://www.esrl.noaa.gov/gmd/ccgg/trends/global.html
283. Huang S, Pollack HN, Shen P-Y. Temperature trends over the past five centuries reconstructed from borehole temperatures. Nature 2000;403(6771):756-8. doi: 10.1038/35001556
284. Mann ME, Bradley RS, Hughes MK. Global-scale temperature patterns and climate forcing over the past six centuries. Nature 1998;392(6678):779-87. doi: 10.1038/33859
285. IPCC. The physical science basis. Contribution of Working Group I to the Fifth Assessment Report of the Intergovernmental Panel on Climate Change [Internet]. Stocker TF, Qin D, Plattner G-K, Tignor M, Allen SK, Boschung J, et al., editors. Cambridge: Cambridge University Press; 2013. Available from: http://www.climatechange2013.org/report/full-report/
286. Hansen J, Sato M, Ruedy R, Schmidt GA, Lo K. Global temperature in 2014 and 2015 [Internet]. 2015 [cited 2016 Feb 3]. Available from: http://www.wijstoppensteenkool.nl/wp-content/uploads/2015/01/20150116_Temperature2014james-hansen.pdf
287. National Oceanic and Atmospheric Administration. Climate at a glance: Time series [Internet]. Boulder, Colorado: United States Department of Commerce; 2015 [cited 2016 Feb 3]. Available from: http://www.ncdc.noaa.gov/cag/time-series/global
288. McKeon G, Hall W, Crimp S, Howden S, Stone R, Jones D. Climate change in Queensland's grazing lands. I. Approaches and climatic trends. Rangeland J. 1998;20(2):151-76.
289. Whish GL, Cowley RA, Pahl LI, Scanlan JC, MacLeod ND. Impacts of projected climate change on pasture growth and safe carrying capacities for 3 extensive grazing land regions in northern Australia. Tropical Grasslands-Forrajes Tropicales 2014;2(1):151-3. doi: 10.17138/TGFT(2)151-153
290. Cobon DH, Stone GS, Carter JO, Scanlan JC, Toombs NR, Zhang X, et al. The climate change risk management matrix for the grazing industry of northern Australia. Rangeland J. 2009;31(1):31-49. doi: 10.1071/RJ08069
291. Nakićenović N, Alcamo J, Davis G, de Vries HJM, Fenhann J, Gaffin S, et al. Emissions scenarios: a special report of Working Group III of the Intergovernmental Panel on Climate Change. Cambridge; 2000.
292. IPCC. The physical science basis. Contribution of Working Group I to the Fifth Assessment Report of the Intergovernmental Panel on Climate Change [Internet]. Stocker TF, Qin D, Plattner G-K, Tignor M, Allen SK, Boschung J, et al., editors. Cambridge: Cambridge University Press; 2013. Available from: http://www.climatechange2013.org/report/full-report/
293. McCallum JL, Crosbie RS, Walker GR, Dawes WR. Impacts of climate change on groundwater in Australia: a sensitivity analysis of recharge. Hydrogeol J. 2010;18(7):1625-38. doi: 10.1007/s10040-010-0624-y
294. Green TR, Taniguchi M, Kooi H, Gurdak JJ, Allen DM, Hiscock KM, et al. Beneath the surface of global change: Impacts of climate change on groundwater. J Hydrol (Amst). 2011;405(3–4):532-60. doi: 10.1016/j.jhydrol.2011.05.002
295. Edwards G, Walker D. C3, C4: mechanisms, and cellular and environmental regulation, of photosynthesis. Berkeley: University of California Press; 1983.

170 | P a g e
296. Crimp SJ, Flood MR, Carter JO, Conroy JP, McKeon G. Evaluation of the potential impacts of climate change on native pasture production: Implications for livestock carrying capacity. Canberra: Australian Greenhouse Office; 2002.
297. Meat and Livestock Australia. QLD weekly cattle summary: 26 February 2015 [Internet]. 2015 [cited 2016 Feb 3]. Available from: http://www.mla.com.au/Prices-and-markets/Market-news/QLD-weekly-cattle-summary-26022015
298. Meat and Livestock Australia. QLD weekly cattle summary: 05 March 2015 [Internet]. 2015 [cited 2016 Feb 3]. Available from: http://www.mla.com.au/Prices-and-markets/Market-news/QLD-weekly-cattle-summary-05032015
299. Turton SM. Securing landscape resilience to tropical cyclones in Australia's Wet Tropics under a changing climate: Lessons from Cyclones Larry (and Yasi). Geogr Res. 2012;50(1):15-30. doi: 10.1111/j.1745-5871.2011.00724.x
300. Fraser CE, Smith KB, Judd F, Humphreys JS, Fragar LJ, Henderson A. Farming and mental health problems and mental illness. Int J Soc Psychiatry. 2005;51(4):340-9. doi: 10.1177/0020764005060844
301. Kent J, Alston M. The big dry: The link between rural masculinities and poor health outcomes for farming men. J Sociol (Melb). 2008;44(2):133-47. doi: 10.1177/1440783308089166
302. CSIRO, Maunsell Australia Pty Ltd, Phillips Fox. Infrastructure and climate change risk assessment for Victoria. Aspendale, VIC: CSIRO Report to the Victorian Government, Victorian Government; 2007.
303. Stevens L. Assessment of impacts of climate change on Australia's physical infrastructure [Internet]. Academy of Technological Sciences and Engineering; 2008 [cited 2016 Feb 3]. Available from: http://www.atse.org.au/
304. Marsh SP, Pannell D. Agricultural extension policy in Australia: the good, the bad and the misguided. Aust J Agric Resour Econ. 2000;44(4):605-27. doi: 10.1111/1467-8489.00126
305. Australian Government. Our north, our future: white paper on developing northern Australia [Internet]. 2015 [cited 2016 Feb 2]. Available from: http://apo.org.au/resource/our-north-our-future-white-paper-developing-northern-australia
306. Joint Select Committee on Northern Australia. Pivot North: Inquiry into the development of northern Australia: final report [Internet]. Canberra: Commonwealth of Australia; 2014 [cited 2016 Feb 3]. Available from: http://www.aph.gov.au/Parliamentary_Business/Committees/Joint/Northern_Australia/Inquiry_into_the_Development_of_Northern_Australia/Tabled_Reports
307. Infrastructure Australia. Northern Australia audit: infrastructure for a developing north report: January 2015 [Internet]. Sydney: Australian Government; 2015 [cited 2016 Feb 3]. Available from: http://infrastructureaustralia.gov.au/policy-publications/publications/Northern-Australia-Infrastructure-Audit.aspx
308. Australian Government. Budget 2015: growing jobs and small business [Internet]. Canberra: Commonwealth of Australia; 2015 [cited 2016 Feb 3]. Available from: http://www.budget.gov.au/2015-16/content/glossy/sml_bus/html/index.htm
309. Australian Government. Re:think: Better tax for Australia [Internet]. Canberra: Commonwealth of Australia; 2015 [cited 2016 Feb 3]. Available from: http://bettertax.gov.au/
310. Department of Regional Australia, Local Government, Arts and Sport. Strategic directions for the northern Australia beef industry [Internet]. Canberra: Commonwealth of Australia; 2013

171 | P a g e
[cited 2016 Feb 3]. Available from: http://pandora.nla.gov.au/pan/141331/20130628-1353/www.regional.gov.au/regional/ona/nabis.html
311. Indigenous Land Corporation. NILS: National Indigenous Land Strategy, People, land opportunity [Internet]. ILC; 2013 [cited 2016 Feb 3]. Available from: http://www.ilc.gov.au/IndigenousLandCorporation/media/Items/Content/Publications/Corporate%20Documents/National_Indigenous_Land_Strategy_2013-17_for_download.pdf
312. Northern Territory Government. Growing our primary industries: partnerships for productivity [Internet]. Darwin: Department of Regional Development, Primary Industry, Fisheries and Resources; 2009 [cited 2016 Feb 3]. Available from: www.nt.gov.au/d/Content/File/p/pi/growingourPI_21_10.pdf
313. Chilcott C, Waide C, Berglass R. Draft beef industry action plan 2014-2016. Brisbane: Queensland Department of Agriculture, Fisheries and Forestry, State of Queensland; 2014.
314. Department of Agriculture and Food. AGRIFOOD 2025+ Department of Agriculture and Food, Western Australia Strategic plan 2014–17: Supporting your success [Internet]. Western Australian Agriculture Authority; 2013 [cited 2016 Apr 5]. Available from: https://www.agric.wa.gov.au/strategic-plan-2014%E2%80%9317
315. Department of Water, Department of Regional Development, Department of Lands, Department of Agriculture and Food. Water for food [Internet]. Perth: Government of Western Australia; 2015 [cited 2016, Feb 2]. Available from: http://www.waterforfood.wa.gov.au
316. Department of Agriculture and Food. Northern beef futures [Internet]. Perth: Western Commonwealth of Australia; 2015 [cited 2016 Feb 3]. Available from: http://www.agric.wa.gov.au/r4r/northern-beef-futures
317. Department of Water, Department of Regional Development, Department of Lands, Department of Agriculture and Food. Water for Food: Mowanjum irrigation trial [Internet]. Western Australian Government (Department of Water, Department of Regional Development, Department of Lands & Department of Agriculture and Food); 2014 [cited 2016 Feb 3]. Available from: http://www.waterforfood.wa.gov.au/pdf/mowanjum-irrigation-trial-flyer.pdf
318. Department of Primary Industries and Fisheries. Northern Territory Department of Primary Industry and Fisheries Industry Development Plan 2013–2017 [Internet]. Darwin: Department of Primary Industry and Fisheries; 2013 [cited 2016 Feb 3]. Available from: http://www.nt.gov.au/d/Content/File/p/pi/DPIF_Development_Plan1.pdf
319. Australian Bureau of Statistics. Agricultural commodities, Australia, 2012-2013 [Internet]. 2014 [cited 2016 Feb 2]; ABS cat. no. 7121.0. Available from: http://www.abs.gov.au/AUSSTATS/[email protected]/DetailsPage/7121.02012-2013?OpenDocument
320. Minister for Agriculture, Fisheries and Forestry. Media release Friday, April 11, 2014: Beef industry action plan released for comment [Internet]. Brisbane: State of Queensland; 2014 [cited 2016 Feb 3]. Available from: http://statements.qld.gov.au/Statement/2014/4/11/beef-industry-action-plan-released-for-comment
321. Rural and Regional Affairs and Transport References Committee. Senate Inquiry into industry structures and systems governing levies on grass-fed cattle [Internet]. Canberra: Commonwealth of Australia; 2014 [cited 2016 Feb 2]. Available from: http://www.aph.gov.au/parliamentary_business/committees/senate/rural_and_regional_affairs_and_transport/beef_levies

172 | P a g e
322. Department of Agriculture. Information on cattle and livestock transaction levy [Internet]. Brisbane: Commonwealth of Australia; 2014 [cited 2016 Feb 3]. Available from: http://www.agriculture.gov.au/SiteCollectionDocuments/ag-food/levies/livestock/cattle-livestock-levy.pdf
323. Meat and Livestock Australia. Meat and Livestock Australia annual report 2013-2014 [Internet]. Sydney: MLA; 2014 [cited 2016 Feb 3]. Available from: http://www.mla.com.au/About-MLA/Planning-and-reporting/Annual-reporting
324. AgForce. Grazing BMP certification and accreditation overview [Internet]. Brisbane: AgForce; 2014 [cited 2016 Feb 3]. Available from: http://www.bmpgrazing.com.au
325. Greiner R, Lankester A. Designing incentives for achieving biodiversity targets in the Burdekin Dry Tropics NRM region with specific emphasis on the Bowen Broken and Bogie River subcatchments [Internet]. Townsville: River Consulting; 2006 [cited 2016 Feb 3]. Available from: http://www.riverconsulting.com.au/publications.html
326. Greiner R, Lankester A. Supporting on-farm biodiversity conservation through debt-for-conservation swaps: concept and critique. Land Use Policy 2007;24(2):458-71. doi: 10.1016/j.landusepol.2006.07.001
327. Quiggin J. Behavioural causes. In: Chisholm A, Dumsday R, editors. Land degradation: Problems and policies. Cambridge, UK: Cambridge University Press; 1987. p. 203-12.
328. Deane P, Hogan W, Pervan M. Molehill to mountain: agriculture in northern Australia [Internet]. ANZ; 2014 [cited 2016 Feb 3]. Available from: http://www.indepth.anz.com/pdf/IIB_InDepth_Report_Short_form_Molehill_AW.pdf
329. growNORTH. Our economic base case [Internet]. Canberra: growNORTH; 2015 [cited 2016 Feb 3]. Available from: http://grownorth.createsend.com/t/ViewEmailArchive/t/D5A53C34F3BD03CC/C67FD2F38AC4859C/
330. North Australian Beef Research Council. Research, development and extension (RD&E): priorities prospectus for the northern Australian beef industry [Internet]. North Australian Beef Research Council; 2012 [cited 2016 Feb 3]; Available from: http://www.jackiekyte.com.au/nabrc/public/files/Prospectus.pdf
331. Department of Agriculture and Fisheries, Department of Primary Industry and Fisheries, Department of Agriculture and Food, Meat and Livestock Australia. FutureBeef website [Internet]. State of Queensland, Northern Territory Government, Western Commonwealth of Australia, and Meat and Livestock Australia; 2015 [cited 2016 Feb 3]. Available from: http://futurebeef.com.au
332. Department of Agriculture and Fisheries, Department of Primary Industry and Fisheries, Department of Agriculture and Food, Meat and Livestock Australia. FutureBeef: tools and services [Internet]. State of Queensland, Northern Territory Government, Western Commonwealth of Australia, and Meat and Livestock Australia; 2015 [cited 2016 Feb 3]. Available from: http://futurebeef.com.au
333. Bernstein PM, Montgomery WD, Rutherford TF. Global impacts of the Kyoto agreement: results from the MS-MRT model. Resource Energ Econ. 1999;21(3–4):375-413. doi: 10.1016/S0928-7655(99)00009-3
334. Bolin B. The Kyoto negotiations on climate change: A science perspective. Science 1998;279(5349):330-1. doi: 10.1126/science.279.5349.330
335. Crowley K. Is Australia Faking It? The Kyoto Protocol and the greenhouse policy challenge. Glob Environ Polit. 2007;7(4):118-39. doi: 10.1162/glep.2007.7.4.118

173 | P a g e
336. Newman J, Head BW. Categories of failure in climate change mitigation policy in Australia. Publ Pol Admin. 2015;30(3-4):342-58. doi: 10.1177/0952076714565832
337. Peel J. Divergent responses to climate change in a multipolar world: a view from down under. P Am S In L. 2013;107:76-8. doi: 10.5305/procannmeetasil.107.0076
338. Department of Climate Change. Carbon pollution reduction scheme: Australia’s low pollution future. White paper [Internet]. Canberra: Commonwealth of Australia; 2008 [cited 2016 Feb 3]. Available from: http://pandora.nla.gov.au/pan/102841/20130419-0058/www.climatechange.gov.au/en/publications/cprs/white-paper/cprs-whitepaper.html
339. Roelfsema M, den Elzen M, Höhne N, Hof AF, Braun N, Fekete H, et al. Are major economies on track to achieve their pledges for 2020? An assessment of domestic climate and energy policies. Energy Policy 2014;67:781-96. doi: 10.1016/j.enpol.2013.11.055
340. Caripis L, Peel J, Godden L, Keenan RJ. Australia's carbon pricing mechanism. Climate Law 2011;2(4):583-603. doi: 10.3233/CL-2011-052
341. Crowley K. Climate policy failure: Was Australia’s CPRS more politics than policy? In: Crowley K, Walker KJ, editors. Environmental policy failure: the Australian story. Melbourne: Tilde University Press; 2012. p. 29–43.
342. Department of the Environment. The Renewable Energy Target (RET) scheme [Internet]. Canberra: Commonwealth of Australia; 2015 [cited 2016 Feb 2]. Available from: http://www.environment.gov.au/climate-change/renewable-energy-target-scheme
343. ShahNazari M, McHugh A, Maybee B, Whale J. The effect of political cycles on power investment decisions: Expectations over the repeal and reinstatement of carbon policy mechanisms in Australia. Appl Energy. 2014;130:157-65. doi: 10.1016/j.apenergy.2014.05.040
344. Department of Environment and Conservation. Adapting to our changing climate October 2012 [Internet]. Department of Environment and Conservation, Western Australian Government; 2012 [cited 2016 Feb 4]. Available from: http://coastaladaptationresources.org/PDF-files/1084-adapting-to-our-changing-climate-october-2012-2.pdf
345. Department of the Chief Minister. Northern Territory climate change policy 2009 [Internet]. Darwin: Department of the Chief Minister, Northern Territory Government; 2009 [cited 2016 Feb 4]. Available from: https://senate.aph.gov.au/submissions/comittees/viewdocument.aspx?id=8346c351-ff4e-4364-94a4-42a4e1f01b46
346. Clean Energy Regulator. Carbon farming initiative [Internet]. Canberra: Commonwealth of Australia; 2016 [cited 2016 Feb 4]. Available from: http://www.cleanenergyregulator.gov.au/Infohub/CFI/Carbon-Farming-Initiative
347. State Development Infrastructure and Industry Committee. Final report: inquiry into the future and continued relevance of government land tenure across Queensland [Internet]. State of Queensland Parliamentary Committees 2013 [cited 2016 Feb 2]. Report No. 25. Available from: http://www.cabinet.qld.gov.au/documents/2013/aug/land%20tenure/Attachments/Report.pdf
348. Holmes J. Pastoral lease tenures as policy instruments. In: Dovers S, editor. Environmental history and policy: still settling Australia. . Melbourne: Oxford U.P.; 2000. p. 212–42.

174 | P a g e
349. James Cook University, CSIRO. Land tenure in northern Australia: opportunities and challenges for investment [Internet]. Brisbane: CSIRO; 2013 [cited 2016 Feb 4]. Available from: http://industry.gov.au/ONA/Documents/land-tenure-20130717.pdf
350. Department of Regional Development and Lands. Rangelands tenure options: discussion paper April 2011 [Internet]. Department of Regional Development and Lands, Western Australian Government; 2011 [cited 2016 Feb 4]. Available from: http://www.lands.wa.gov.au/Publications/Documents/Rangelands_Tenure_Options_Discussion_Paper.pdf
351. Wensing E, Taylor J. Secure tenure options for home ownership and economic development on land subject to native title. AIATSIS research discussion paper no. 31 [Internet]. Canberra: AIATSIS Research Publications; 2012 [cited 2016 Feb 4]. Available from: http://aiatsis.gov.au/sites/default/files/products/discussion_paper/secure-tenure-options-home-ownership.pdf
352. Stevenson B. The Wik decision and after [Internet]. Brisbane: Queensland Parliamentary Library. Publications and Resources Section; 1997 [cited 2016 Feb 4]. Available from: https://www.parliament.qld.gov.au/documents/explore/ResearchPublications/researchBulletins/rb0497bs.pdf
353. Wensing E. Land justice for Indigenous Australians: dealings in native title lands and statutory Aboriginal land rights regimes in northern Australia and why land tenure reform is critical for the social, economic and cultural reconstruction of Aboriginal people and communities [Internet]. In: CRN Northern Australia Development Conference: A Northern Perspective, 2014 Nov 27; Canberra; 2014 [cited 2016 Feb 4]. Available from: http://www.cdu.edu.au/northern-institute/nad-conference-2014-presentations
354. Brennan F. Pastoral leases, Mabo and the Native Title Act 1993. Issues Paper 1. In: Land, rights, laws: issues of Native Title. Canberra: Native Title Research Unit Australian Institute of Aboriginal and Torres Strait Islander Studies; 2001. p. 2-5.
355. Holmes J. Explorations in Australian legal geography: The evolution of lease tenures as policy instruments. Geogr Res. 2014;52(4):411-29. doi: 10.1111/1745-5871.12083
356. National Native Title Tribunal. About Indigenous Land Use Agreements (ILUAs) [Internet]. Commonwealth of Australia; 2015 [cited 2016 Feb 4]. Available from: http://www.nntt.gov.au/ILUAs/Pages/default.aspx
357. United Nations. Convention on biological diversity [Internet]. United Nations Environment Programme; 1992 [cited 2016 Feb 4]. Available from: https://www.cbd.int/doc/legal/cbd-en.pdf
358. Fitzsimons JA, Wescott G. The classification of lands managed for conservation: existing and proposed frameworks, with particular reference to Australia. Environ Sci Policy. 2004;7(6):477-86. doi: 10.1016/j.envsci.2004.08.005
359. Government of Western Australian. Kimberley science and conservation strategy [Internet]. Perth: Government of Western Australia; 2011 [cited 2016 Feb 4]. Available from: http://www.dpaw.wa.gov.au/management/kimberley-strategy
360. Government of Western Australian. Kimberley science and conservation strategy [Internet]. Perth: Government of Western Australia; 2011 [cited 2016 Feb 4]. Available from: http://www.dpaw.wa.gov.au/management/kimberley-strategy
361. Queensland Parliament. Land and other legislation amendment bill [Internet]. 2014 [updated 19 Mar 2014; cited 2016 Feb 4]. p. 708-711. Available from: https://www.parliament.qld.gov.au/documents/hansard/2014/2014_03_19_WEEKLY.pdf
175 | P a g e
362. Department of Lands. Pastoral lease renewals [Internet]. Perth: Government of Western Australia; 2015 [cited 2016 Feb 4]. Available from: http://www.lands.wa.gov.au/Pastoral-Leases/Pastoral-Lease-Renewals/Pages/default.aspx
363. Novelly PE, Watson IW, Thomas PWE, Duckett NJ. The Western Australian Rangeland Monitoring System (WARMS) – operating a regional scale monitoring system. Rangeland J. 2008;30(3):271-81. doi: 10.1071/RJ07047
364. Ryan K, Huey A-m, Fletcher M. Assessing rangeland condition [Internet]. Perth: Government of Western Australia, Department of Agriculture and Food; 2015 [cited 2016 Feb 4]. Available from: http://www.agric.wa.gov.au/rangelands/assessing-rangeland-condition
365. Department of Land Resource Management. Tier 2 monitoring system [Internet]. Darwin: Northern Territory Government; 2015 [cited 2016 Feb 4]. Available from: http://www.lrm.nt.gov.au/rangeland/monitor/tier2
366. Department of Natural Resources and Mines. Guidelines for determining land condition. Version 3.0. July 2013 [Internet]. Queensland Department of Natural Resources and Mines; 2013 [cited 2016 Feb 4]. Available from: https://www.dnrm.qld.gov.au/__data/assets/pdf_file/0017/110474/guidelines-determining-land-condition.pdf
367. Eyre TJ, Kelly AL, Neldner VJ, Wilson BA, Ferguson DJ, Laidlaw MJ, et al. BioCondition: a condition assessment framework for terrestrial biodiversity in Queensland. Assessment manual. Version 2.2 [Internet]. Brisbane: Department of Science, Information Technology, Innovation and the Arts; 2015 [cited 2016 Feb 4]. Available from: https://www.qld.gov.au/environment/assets/documents/plants-animals/biodiversity/biocondition-assessment-manual.pdf
368. Land Court of Queensland. Hancock Coal Pty Ltd v Kelly & Ors and Department of Environment and Heritage Protection (No. 4) [2014] QLC 12 [Internet]. 2014 [cited 2016 Feb 4]. Available from: http://www.courts.qld.gov.au/__data/assets/pdf_file/0009/272349/MRA082-13-etc-4-12.pdf
369. Lewis D. Slower than the eye can see: environmental change in northern Australia's cattle lands: a case study from the Victoria River District, Northern Territory. Darwin: Tropical Savannas Cooperative Research Centre; 2002.
370. Cook GD, Williams RJ, Stokes CJ, Hutley LB, Ash AJ, Richards AE. Managing sources and sinks of greenhouse gases in Australia's rangelands and tropical savannas. Rangeland Ecol Manag. 2010;63(1):137-46. doi: 10.2111/08-101.1
371. Anon. Clearing native vegetation on pastoral leases. Pastoral Lines: The official magazine of the Pastoral Lands Board [Internet]. 2007;5 February:24-6. Available from: http://www.lands.wa.gov.au/Publications/Documents/Pastoral_Lines_Issue_No.5.pdf
372. Dore J, Michael C, Russell-Smith J, Tehan M, Caripis L. Carbon projects and Indigenous land in northern Australia. Rangel J. 2014;36(4):389-402. doi: 10.1071/RJ13128
373. Crowley GM. Trends in natural resource management in Australia’s Monsoonal North: the conservation economy. Cairns: James Cook University; 2015.
374. Queensland Government. Reef regulations [Internet]. Brisbane: State of Queensland; 2015 [cited 2016 Feb 4]. Available from: http://www.qld.gov.au/environment/agriculture/sustainable-farming/reef-legislation
375. Reef Water Quality Protection Plan Secretariat. Interim activity report and performance outlook. Reef Water Quality Protection Plan [Internet]. State of Queensland; 2011 [cited 2016

176 | P a g e
Feb 4]; Available from: http://www.reefplan.qld.gov.au/measuring-success/report-cards/assets/interim-activity-report.pdf
376. Department of Environment and Heritage Protection. Government priorities. Brisbane: State of Queensland; 2016.
377. McKellar K. Getting more from the National Livestock Identification Scheme (NLIS): producer demonstration site Charters Towers, North Queensland. Final Report for project B.NBP.0504 [Internet]. Meat and Livestock Australia 2011 [cited 2016 Feb 4]. Available from: http://www.mla.com.au/Research-and-development/Search-RD-reports/RD-report-details/Capability-Building/Getting-more-from-the-National-Livestock-Identification-Scheme-NLIS/394
378. Hughes C. Australian live cattle export trade. In: Lapworth J, editor. The expanding live cattle trade in northern Australia [Internet]. Townsville: Queensland Beef Industry Institute, Department of Primary Industries; 2004 [cited 2016 Feb 4]. p. 4-6. Available from: http://era.daf.qld.gov.au/587/1/LapworthExpandingCattle-SEC.pdf
379. Australian Animal Welfare Standards and Guidelines. Cattle [Internet]. 2016 [cited 2016 Feb 4]. Available from: http://www.animalwelfarestandards.net.au/cattle
380. Animal Health Australia. Proposed Australian animal welfare standards and guidelines: cattle: decision regulation impact statement [Internet]. Canberra: Animal Health Australia; 2014 [cited 2016 Feb 4]. Available from: http://www.animalwelfarestandards.net.au/files/2011/02/Final-Cattle-Welfare-Decision-RIS-May-2014-010714.pdf
381. Australian Animal Welfare Standards and Guidelines. Land transport [Internet]. 2016 [cited 2016 Feb 4]. Available from: http://www.animalwelfarestandards.net.au/land-transport
382. Animal Health Australia. Australian standards and guidelines for the welfare of animals: land transport of livestock: regulatory impact statement March, 2008 [Internet]. Canberra: Animal Health Australia; 2008 [cited 2016 Feb 4]. Available from: http://www.animalwelfarestandards.net.au/files/2011/02/Regulatory-Impact-Statement-RIS-March-2008.pdf
383. Department of Agriculture, Fisheries and Forestry. Australian standards for the export of livestock (version 2.3) 2011 and Australian position statement on the export of livestock [Internet]. Canberra: Commonwealth of Australia; 2011 [cited 2016 Feb 4]. Available from: http://www.agriculture.gov.au/SiteCollectionDocuments/animal-plant/animal-welfare/standards/version2-3/australian-standards-v2.3.pdf
384. World Organisation for Animal Health. OIE's achievements in animal welfare [Internet]. Paris: Office International des Epizooties; 2016 [cited 2016 Feb 4]. Available from: http://www.oie.int/animal-welfare/animal-welfare-key-themes
385. AgForce. Media release: findings released on live export investigation [Internet]. Brisbane: AgForce; 2012 [cited 2016 Feb 4]. Available from: http://www.agforceqld.org.au/edm/?story=2884
386. Northern Territory Cattlemen's Association. Animal welfare [Internet]. Darwin: Northern Territory Cattlemen's Association; 2012 [cited 2016 Feb 4]. Available from: http://www.ntca.org.au/our_industry/animal_welfare.html
387. Fair Work Ombudsman. Awards and agreements [Internet]. Canberra: Commonwealth of Australia; 2016 [cited 2016 Feb 4]. Available from: http://www.fairwork.gov.au/awards-and-agreements
177 | P a g e
388. Australian Government. National review into model occupational health and safety laws: second report January 2009 [Internet]. 2009 [cited 2016 Feb 4]. Available from: http://docs.employment.gov.au/documents/national-review-model-occupational-health-and-safety-laws-second-report
389. Safe Work Australia. Model work health and safety laws [Internet]. Canberra: Commonwealth of Australia; 2015 [cited 2016 Feb 4]. Available from: http://www.safeworkaustralia.gov.au/sites/swa/model-whs-laws/pages/model-whs-laws
390. Department of the Chief Minister. Major projects [Internet]. Darwin: Northern Territory Government; 2015 [cited 2016 Feb 4]. Available from: http://www.dcm.nt.gov.au/territory_economy/major_projects
391. Environmental Protection Authority Western Australia. Environmental assessment guideline for environmental principles, factors and objectives [Internet]. Environmental Protection Authority Western Australia; 2015 [updated Jan 2015; cited 2016 Feb 4]. Available from: http://www.epa.wa.gov.au/EPADocLib/EAG8-Principles-factors-objectives-RevJan2015.pdf
392. Department of Water, Western Australia. Western Australian water in mining guideline: Looking after all our water needs [Internet]. Perth: Department of Water, Western Australia; 2013 [cited 2016 Feb 4]. Available from: https://www.water.wa.gov.au/__data/assets/pdf_file/0019/1819/105195.pdf
393. Department of Mines and Energy. Mine management plans [Internet]. Darwin: Northern Territory Government; 2008 [cited 2016 Feb 4]. Available from: http://www.nt.gov.au/d/Minerals_Energy/?header=Mining%20Management%20Plans
394. Department of Environment and Heritage Protection. The national partnership agreement on coal seam gas and large mining development [Internet]. Brisbane: State of Queensland; 2012 [cited 2016 Feb 4]. Available from: https://www.ehp.qld.gov.au/management/impact-assessment/national-partnership-agreement.html
395. Berndt A, Tomkins NW. Measurement and mitigation of methane emissions from beef cattle in tropical grazing systems: a perspective from Australia and Brazil. Animal 2013;7(Supplements2):363-72. doi: 10.1017/S1751731113000670
396. Ash AJ, Corfield JP, McIvor JG, Ksiksi TS. Grazing management in tropical savannas: Utilization and rest strategies to manipulate rangeland condition. Rangeland Ecol Manag. 2011;64(3):223-39. doi: 10.2111/REM-D-09-00111.1
397. Fisher A, Kutt AS. Biodiversity and land condition in tropical savanna rangelands: summary report [Internet]. Darwin: Tropical Savannas CRC; 2006 [cited 2016 Feb 4]. Available from: http://savanna.cdu.edu.au/savanna_web/publications/downloads/Biodlc.pdf
398. AgForce. Grazing BMP certification and accreditation overview [Internet]. Brisbane: AgForce; 2014 [cited 2016 Feb 3]. Available from: http://www.bmpgrazing.com.au
399. Department of Business Industry and Regional Development, Queensland Department of Primary Industries & Queensland Department of Natural Resources & Mines. Grazing land management education package: technical manual. Final report for Meat and Livestock Australia project NAP3.325. Northern Territory Department of Business Industry and Regional Development, Queensland Department of Primary Industries & Queensland Department of Natural Resources & Mines; 2002.

178 | P a g e
400. Chudleigh P, Simpson S. External review of MLA Northern Beef Communication and Research Adoption Program 2009 [Internet]. North Sydney: Meat and Livestock Australia; 2009 [cited 2016 Feb 4]. Available from: http://www.mla.com.au/Research-and-development/Search-RD-reports/RD-report-details/Productivity-On-Farm/External-Review-of-MLA-Northern-Beef-Communication-and-Research-Adoption-Program-2009/931
401. Solutions Marketing and Research. Environmental practices amongst beef and sheep producers within the reef catchments of Queensland. Internal report prepared for Meat Livestock Australia & AgForce Queensland; 2010 October 2010.
402. Bartley R, Corfield JP, Hawdon AA, Kinsey-Henderson AE, Abbott BN, Wilkinson SN, et al. Can changes to pasture management reduce runoff and sediment loss to the Great Barrier Reef? The results of a 10-year study in the Burdekin catchment, Australia. Rangel J. 2014;36(1):67-84. doi: 10.1071/RJ13013
403. O’Reagain PJ, Bushell JJ, Holmes B. Managing for rainfall variability: long-term profitability of different grazing strategies in a northern Australian tropical savanna. Anim Prod Sci. 2011;51(3):210-24. doi: 10.1071/AN10106
404. Orr DM, O’Reagain PJ. Rainfall and grazing impacts on the population dynamics of Bothriochloa ewartiana in tropical Australia. In: Milne JA, editor. Pastoral systems in marginal environments: Proceedings of a satellite workshop of the XXth International Grassland Congress, July 2005, Glasgow, Scotland [Internet]. Wageningen, the Netherlands: Wageningen Academic Publishers; 2005 [cited 2016 Feb 4]. p. 149. Available from: http://www.wageningenacademic.com/doi/book/10.3920/978-90-8686-557-4
405. S Scanlan JC, MacLeod ND, O’Reagain PJ. Scaling results up from a plot and paddock scale to a property – a case study from a long-term grazing experiment in northern Australia. Rangel J. 2013;35(2):193-200. doi: 10.1071/RJ12084
406. Andrew MH. Use of fire for spelling monsoon tallgrass pasture grazed by cattle. Trop Grasslands. 1986;20(2):69-78.
407. Crowley GM, Felderhof L, McIvor JG. Business and RD&E plan to determine the value proposition for greater use of fire in the grazing lands of northern Australia [Internet]. North Sydney: Meat and Livestock Australia; 2013 [cited 2016 Feb 4]. Available from: http://www.mla.com.au/CustomControls/PaymentGateway/ViewFile.aspx?a3SQV2RU6ZxW8lvnLES1qPFPyhHfMRCVsZliO3ScLCU1OSyr5dBXbXTOQYjPPgrm3EYMKKAfsht7d1Tnt3BqiA==
408. Bortolussi G, Hodgkinson JJ, Holmes CR, McIvor JG, Coffey SG. Darwin-Douglas Daly region report: report on the northern Australian beef industry survey activity. Indooroopilly, Australia: CSIRO Division of Tropical Agriculture; 1999.
409. Hunt LP. Aboveground and belowground carbon dynamics in response to fire regimes in the grazed rangelands of northern Australia: initial results from field studies and modelling. Rangel J. 2014;36(4):347-58. doi: 10.1071/RJ13123
410. Hunt LP, Petty S, Cowley R, Fisher A, Ash AJ, MacDonald N. Factors affecting the management of cattle grazing distribution in northern Australia: preliminary observations on the effect of paddock size and water points1. Rangel J 2007;29(2):169-79. doi: 10.1071/RJ07029
179 | P a g e
411. Bastin G, The ACRIS Management Committee. Rangelands 2008 — Taking the pulse [Internet]. Canberra: Published on behalf of the ACRIS Management Committee by the National Land & Water Resources Audit; 2008 [cited 2016 Feb 4]. Available from: http://www.environment.gov.au/land/publications/acris/report08.html
412. Landsberg J, James CD, Morton SR, Hobbs TJ, Stol J, Drew A, et al. The effects of artificial sources of water on rangeland biodiversity: Final report to the Biodiversity Convention and Strategy Section of the Biodiversity Group, Environment Australia [Internet]. Canberra: Environment Australia & CSIRO; 1997 [cited 2016 Feb 4]. Available from: http://www.environment.gov.au/archive/biodiversity/publications/technical/artificial-water/
413. Landsberg J, James CD, Morton SR, Müller WJ, Stol J. Abundance and composition of plant species along grazing gradients in Australian rangelands. J Appl Ecol. 2003;40(6):1008-24. doi: 10.1111/j.1365-2664.2003.00862.x
414. Ash A, Stafford Smith M. Pastoralism in tropical rangelands: seizing the opportunity to change. Rangel J. 2003;25(2):113-27. doi: 10.1071/RJ03010
415. Ash A, McIvor J, Corfield J, Winter W. How land condition alters plant-animal relationships in Australia's tropical rangelands. Agric Ecosyst Environ. 1995;56(2):77-92.
416. Holroyd RG, McGowan MR. Reproductive management of beef cattle. In: Kahn L, Cottle D, editors. Beef cattle production and trade. Collingwood: CSIRO Publishing; 2014. p. 291-338.
417. Jackson D, Rolfe J, English B, Holmes B, Matthews R, Dixon R, et al. Phosphorus management of beef cattle in northern Australia [Internet]. Meat and Livestock Australia; 2012 [cited 2016 Feb 4]. Available from: http://www.mla.com.au/News-and-resources/Publication-details?pubid=6024
418. McCosker TH, O'Rourke PK, Eggington AR. Effects of providing supplements during the wet season on beef production in the Darwin district of the Northern Territory. Rangel J. 1991;13(1):3-13. doi: 10.1071/RJ9910003
419. McCosker T, Winks L. Phosphorus nutrition of beef cattle in northern Australia. Brisbane: Department of Primary Industries; 1994.
420. Smith EL. Effects of burning and clipping at various times during the wet season on tropical tall grass range in Northern Australia. J Rangel Manage. 1960;13:197-203.
421. Crowley GM, Garnett ST. Growth, seed production and effect of defoliation in an early flowering perennial grass, Alloteropsis semialata (Poaceae), on Cape York Peninsula, Australia. Aust J Bot. 2001;49:735-43. doi: 10.1071/BT00090
422. Winter W, Winks L, Seebeck R. Sustaining productive pastures in the tropics. 10. Forage and feeding systems for cattle. Trop Grasslands. 1991;25:145-52.
423. Petty SR, Poppi DP, Triglone T. Effect of maize supplementation, seasonal temperature and humidity on the liveweight gain of steers grazing irrigated Leucaena leucocephala/Digitaria eriantha pastures in north-west Australia. J Agric Sci. 1998;130(1):95-105.
180 | P a g e
424. Burrow HM. Northern Australian beef production. In: Kahn L, Cottle D, editors. Beef cattle production and trade. Collingwood: CSIRO Publishing; 2014. Chapter 9.
425. Cook GD, Dias L. Turner Review No. 12. It was no accident: deliberate plant introductions by Australian government agencies during the 20th century. Aust J Bot. 2006;54(7):601-25. doi: 10.1071/BT05157
426. Lonsdale WM. Inviting trouble: Introduced pasture species in northern Australia. Austral Ecol. 1994;19(3):345-54. doi: 10.1111/j.1442-9993.1994.tb00498.x
427. Setterfield S, Douglas M, Petty A, Bayliss P, Ferdinands K, Winderlich S. Invasive plants in the floodplains of Australia’s Kakadu National Park. In: Foxcroft LC, Pyšek P, Richardson DM, Genovesi P, editors. Plant invasions in protected areas. Dordrecht: Springer Netherlands; 2013. vol 7 p. 167-89.
428. Humphries SE, Groves RH, Mitchell DS. Plant invasions: the incidence of environmental weeds in Australia. Canberra: Australian National Parks and Wildlife Service; 1991.
429. Butler DW, Fairfax RJ. Buffel Grass and fire in a Gidgee and Brigalow woodland: a case study from central Queensland. Ecol Manag Restor. 2003;4(2):120-5.
430. Rossiter-Rachor NA, Setterfield SA, Douglas MM, Hutley LB, Cook GD, Schmidt S. Invasive Andropogon gayanus (gamba grass) is an ecosystem transformer of nitrogen relations in Australian savanna. Ecol Appl. 2009;19(6):1546-60. doi: 10.1890/08-0265.1
431. Rossiter NA, Setterfield SA, Douglas MM, Hutley LB. Testing the grass-fire cycle: alien grass invasion in the tropical savannas of northern Australia. Divers Distrib. 2003;9(3):169-76. doi: 10.1046/j.1472-4642.2003.00020.x
432. Department of Sustainability, Environment, Water, Population and Communities. Threat abatement plan to reduce the impacts on northern Australia's biodiversity by the five listed grasses [Internet]. Canberra: Department of Sustainability, Environment, Water, Population and Communities; 2012 [cited 2016 Feb 4]. Available from: http://www.environment.gov.au/resource/threat-abatement-plan-reduce-impacts-northern-australias-biodiversity-five-listed-grasses
433. Department of the Environment. Weeds of national significance [Internet]. Canberra: Commonwealth of Australia; 2014 [cited 2016 Feb 4]. Available from: http://www.environment.gov.au/biodiversity/invasive/weeds/weeds/lists/wons.html
434. Department of Land Resource Management. Weed management plan for Andropogon gayanus (Gamba Grass) 2010 [Internet]. Darwin: Northern Territory Department of Land Resource Management; 2010 [cited 2016 Feb 4]. Available from: http://www.lrm.nt.gov.au/__data/assets/pdf_file/0008/351449/Weed-Management-Plan-for-gamba-grass-2014.pdf
435. Miller G, Friedel M, Adam P, Chewings V. Ecological impacts of buffel grass (Cenchrus ciliaris L.) invasion in Central Australia - does field evidence support a fire invasion feedback? Rangel J. 2010;32(4):353-65. doi: 10.1071/RJ09076

181 | P a g e
436. Eyre TJ, Wang J, Venz MF, Chilcott C, Whish G. Buffel grass in Queensland's semi-arid woodlands: response to local and landscape scale variables, and relationship with grass, forb and reptile species. Rangel J. 2009;31:293-305. doi: 10.1071/RJ08035
437. Franks AJ. The ecological consequences of buffel grass Cenchrus ciliaris establishment within remnant vegetation of Queensland. Pac Conserv Biol. 2002;8:99-107.
438. Brodie J, Fabricius K, De’ath G, Okaji K. Are increased nutrient inputs responsible for more outbreaks of crown-of-thorns starfish? An appraisal of the evidence. Mar Pollut Bull. 2005;51(1):266-78. doi: 10.1016/j.marpolbul.2004.10.035
439. Bartley R, Bainbridge ZT, Lewis SE, Kroon FJ, Wilkinson SN, Brodie JE, et al. Relating sediment impacts on coral reefs to watershed sources, processes and management: a review. Sci Total Environ. 2014;468–469:1138-53. doi: 10.1016/j.scitotenv.2013.09.030
440. De’ath G, Fabricius KE, Sweatman H, Puotinen M. The 27–year decline of coral cover on the Great Barrier Reef and its causes. P Natl Acad Sci USA. 2012;109(44):17995-9. doi: 10.1073/pnas.1208909109
441. Fabricius KE, Okaji K, De’ath G. Three lines of evidence to link outbreaks of the crown-of-thorns seastar Acanthaster planci to the release of larval food limitation. Coral Reefs 2010;29(3):593-605. doi: 10.1007/s00338-010-0628-z
442. Kroon FJ, Kuhnert PM, Henderson BL, Wilkinson SN, Kinsey-Henderson A, Abbott B, et al. River loads of suspended solids, nitrogen, phosphorus and herbicides delivered to the Great Barrier Reef lagoon. Mar Pollut Bull. 2012;65(4–9):167-81. doi: 10.1016/j.marpolbul.2011.10.018
443. Bainbridge ZT, Lewis SE, Smithers SG, Kuhnert PM, Henderson BL, Brodie JE. Fine-suspended sediment and water budgets for a large, seasonally dry tropical catchment: Burdekin River catchment, Queensland, Australia. Water Resour Res. 2014;50(11):9067-87. doi: 10.1002/2013WR014386
444. NQ Dry Tropics. Dry tropics Wiki [Internet]. Townsville: NQ Dry Tropics; 2015 [updated 2014 Mar 11; cited 2016 Feb 4]. Available from: http://wiki.bdtnrm.org.au
445. Waterhouse J, Brodie J, Lewis S, Mitchell A. Quantifying the sources of pollutants in the Great Barrier Reef catchments and the relative risk to reef ecosystems. Mar Pollut Bull. 2012;65(4–9):394-406. doi: 10.1016/j.marpolbul.2011.09.031
446. Wilkinson SN, Hancock GJ, Bartley R, Hawdon AA, Keen RJ. Using sediment tracing to assess processes and spatial patterns of erosion in grazed rangelands, Burdekin River basin, Australia. Agric Ecosyst Environ. 2013;180:90-102. doi: 10.1016/j.agee.2012.02.002
447. Roth CH. A framework relating soil surface condition to infiltration and sediment and nutrient mobilization in grazed rangelands of northeastern Queensland, Australia. Earth Surf Proc Land. 2004;29(9):1093-104. doi: 10.1002/esp.1104
448. Department of Environment and Heritage Protection. Second Report Card (2010): catchment indicators: groundcover [Internet]. Brisbane: State of Queensland; 2015 [cited 2016 Feb 4]. Available from: http://www.reefplan.qld.gov.au/measuring-success/report-cards/second-report-card/catchment-indicators/groundcover/#burdekin
449. Beef Central. Grazing BMP showing beef and reef can co-exist. Beef Central [Internet]. 2015 [cited 2016 Feb 4];1 June. Available from: http://www.beefcentral.com/production/grazing-bmp-showing-beef-and-reef-can-co-exist/
450. Lewis SE, Schaffelke B, Shaw M, Bainbridge ZT, Rohde KW, Kennedy K, et al. Assessing the additive risks of PSII herbicide exposure to the Great Barrier Reef. Mar Pollut Bull. 2012;65(4–9):280-91. doi: 10.1016/j.marpolbul.2011.11.009
182 | P a g e
451. Lewis SE, Brodie JE, Bainbridge ZT, Rohde KW, Davis AM, Masters BL, et al. Herbicides: a new threat to the Great Barrier Reef. Environ Pollut. 2009;157(8–9):2470-84. doi: 10.1016/j.envpol.2009.03.006
452. Bernstein L, Bosch P, Canziani O, Chen Z, Christ R, Davidson O. Climate change 2007: synthesis report. Summary for policymakers {Internet]. Intergovernmental Panel on Climate Change; 2007 [cited 2016 Feb 4]. Available from: http://www.ipcc.ch/publications_and_data/ar4/syr/en/spm.htmll
453. Department of the Environment. Australian greenhouse emissions information system: National greenhouse gas inventory - Kyoto protocol classifications [Internet]. Canberra: Commonwealth of Australia; 2015 [cited 2016 Feb 4]. Available from: http://ageis.climatechange.gov.au/
454. Chiodi A, Donnellan T, Breen J, Deane P, Hanrahan K, Gargiulo M, et al. Integrating agriculture and energy to assess GHG emissions reduction: a methodological approach. Climate Policy 2015:1-22. doi: 10.1080/14693062.2014.993579
455. Rolfe J. Economics of reducing methane emissions from beef cattle in extensive grazing systems in Queensland. Rangel J. 2010;32(2):197-204. doi: 10.1071/RJ09026
456. Smith P, Martino D, Cai Z, Gwary D, Janzen H, Kumar P, et al. Greenhouse gas mitigation in agriculture. Philos Trans R Soc Lond B Biol Sci. 2008;363(1492):789-813. doi: 10.1098/rstb.2007.2184
457. Department of the Environment. National inventory report 2012 Volume 1. The Australian Government submission to the United Nations Framework Convention on Climate Change. Australian National Greenhouse Accounts. Common reporting format [Internet]. Commonwealth of Australia; 2014 [cited 2016 Feb 4]. Available from: http://unfccc.int/national_reports/annex_i_ghg_inventories/national_inventories_submissions/items/8108.php
458. Department of the Environment. National inventory report 2012 Volume 1. The Australian Government submission to the United Nations Framework Convention on Climate Change. Australian National Greenhouse Accounts [Internet]. Department of the Environment; 2014 [cited 2016 Feb 4]. Available from: http://unfccc.int/national_reports/annex_i_ghg_inventories/national_inventories_submissions/items/8108.php
459. Hristov AN, Oh J, Lee C, Meinen R, Montes F, Ott T, et al, editors. Mitigation of greenhouse gas emissions in livestock production: a review of technical options for non-CO2 emissions [Internet]. Rome: Food and Agricultural Organisation of the United Nations; 2013 [cited 2016 Feb 4]. (FAO animal production and health paper no. 177). Available from: http://www.fao.org/docrep/018/i3288e/i3288e00.htm
460. McHenry M. Australian agricultural, energy & climate change policies & trends in performance of stand-alone power supply systems in pastoral Western Australia [Honours dissertation on the internet]. Perth: Murdoch University; 2006 [cited 2016 Feb 4]. Available from: http://researchrepository.murdoch.edu.au/6037/
461. McAlpine CA, Etter A, Fearnside PM, Seabrook L, Laurance WF. Increasing world consumption of beef as a driver of regional and global change: a call for policy action based on evidence from Queensland (Australia), Colombia and Brazil. Glob Environ Change. 2009;19(1):21-33. doi: 10.1016/j.gloenvcha.2008.10.008
462. Bentley D, Hegarty RS, Alford AR. Managing livestock enterprises in Australia’s extensive rangelands for greenhouse gas and environmental outcomes: a pastoral company perspective. Aust J Exp Agric. 2008;48(2):60-4. doi: 10.1071/EA07210

183 | P a g e
463. Wahlquist AK. Eating beef: cattle, methane and food production. Asia Pac J Clin Nutr. 2013;22(1):16-24. doi: 10.6133/apjcn.2013.22.1.04
464. Peters GM, Rowley HV, Wiedemann S, Tucker R, Short MD, Schulz M. Red meat production in Australia: Life cycle assessment and comparison with overseas studies. Environ Sci Technol. 2010;44(4):1327-32. doi: 10.1021/es901131e
465. Navarro J, Bryan B, Marinoni O, Eady S, Halog A. Production of a map of greenhouse gas emissions and energy use from Australian agriculture. In: 20th International Congress on Modelling and Simulation [Internet]; 2013 Dec 1-6; Adelaide; 2013 [cited 2016 Feb 4]. p. 621-7. Available from http://www.mssanz.org.au/modsim2013
466. Basarab JA, Beauchemin KA, Baron VS, Ominski KH, Guan LL, Miller SP, et al. Reducing GHG emissions through genetic improvement for feed efficiency: effects on economically important traits and enteric methane production. Animal 2013;7(Supplements2):303-15. doi: 10.1017/S1751731113000888
467. Alford AR, Hegarty RS, Parnell PF, Cacho OJ, Herd RM, Griffith GR. The impact of breeding to reduce residual feed intake on enteric methane emissions from the Australian beef industry. Aust J Exp Agric. 2006;46(7):813-20. doi: 10.1071/EA05300
468. Hennessy DW, Williamson PJ, Darnell RE. Feed intake and liveweight responses to nitrogen and/or protein supplements by steers of Bos taurus, Bos indicus and Bos taurus × Bos indicus breed types offered a low quality grass hay. J Agric Sci. 2000;135(1):35-45.
469. Bray S, English B, Sullivan M, Eady S, Holmes B. Evaluation of wet season phosphorus supplementation to improve production and greenhouse gas emissions in northern Australia [Internet]. Department of Agriculture, Fisheries and Forestry; 2013 [cited 2016 Feb 4]. Available from: http://futurebeef.com.au/wp-content/uploads/Phosphorous-factsheet_web.pdf
470. Guo YQ, Liu JX, Lu Y, Zhu WY, Denman SE, McSweeney CS. Effect of tea saponin on methanogenesis, microbial community structure and expression of mcrA gene, in cultures of rumen micro-organisms. Lett Appl Microbiol. 2008;47(5):421-6. doi: 10.1111/j.1472-765X.2008.02459.x
471. Clemens J, Ahlgrimm H-J. Greenhouse gases from animal husbandry: mitigation options. Nutr Cycl Agroecosys. 2001;60(1-3):287-300. doi: 10.1023/A:1012712532720
472. Hegarty RS. Minimising greenhouse gas emissions from the Australian feedlot sector. In: Beefworks 2007 proceedings; Toowoomba; 2007. p. 99-103.
473. Beauchemin KA, Kreuzer M, O’Mara F, McAllister TA. Nutritional management for enteric methane abatement: a review. Aust J Exp Agric. 2008;48(2):21-7. doi: 10.1071/EA07199
474. McCrabb GJ, Hunter RA. Prediction of methane emissions from beef cattle in tropical production systems. Aust J Exp Agric. 1999;50(8):1335-40. doi: 10.1071/AR99009
475. Phelps D, Eckard R, Cullen B, Timms M, Whip P, Bray SG. Early joining and improved fertility improve profitability and reduce greenhouse gas emissions in the Longreach district. In: Northern Beef Research Update Conference, 12-15 August 2013; Cairns; 2013.
476. Walsh D, Russell-Smith J, Cowley R. Fire and carbon management in a diversified rangelands economy: Research, policy and implementation challenges for northern Australia. Rangel J. 2014;36(4):313-22. doi: 10.1071/RJ13122
477. Animals Australia. Exposing live export cruelty [Internet]. Melbourne: Animals Australia; 2015 [cited 2016 Feb 4]. Available from: http://www.animalsaustralia.org/investigations/live-export/
184 | P a g e
478. World Animal Protection. Let's end the cruelty of live export [Internet]. St Leonards, NSW: World Animal Protection; 2014 [cited 2016 Feb 4]. Available from: http://www.worldanimalprotection.org.au/our-work/animals-in-farming/live-export
479. RSPCA. RSPCA Policy F3 Export of live food animals [Internet]. RSPCA; 2012 [cited 2016 Feb 4]. Available from: http://kb.rspca.org.au/RSPCA-Policy-F3-Export-of-live-food-animals_200.html
480. Dodt R. Research development and extension activities for the live cattle export trade. In: Lapworth J, editor. The expanding live cattle trade in northern Australia. Brisbane: Queensland Beef Industry Institute, Department of Primary Industries; 2004. p. 6-9.
481. Department of Agriculture, Fisheries and Forestry. Australian standards for the export of livestock (version 2.3) 2011 and Australian position statement on the export of livestock [Internet]. Canberra: Commonwealth of Australia; 2011 [cited 2016 Feb 4]. Available from: http://www.agriculture.gov.au/SiteCollectionDocuments/animal-plant/animal-welfare/standards/version2-3/australian-standards-v2.3.pdf
482. Fisher AD, Ferguson DM, Lee C, Colditz IG, Benson S, Lapworth J, et al. Cataloguing land transport science and practices in Australia. Final Report for Project AHW.126 [Internet]. Meat and Livestock Australia: North Sydney; 2006 [cited 2016 Feb 4]. Available from: http://www.mla.com.au/Research-and-development/Search-RD-reports/RD-report-details/Animal-Welfare/Cataloguing-Land-Transport-Science-and-Practices-in-Australia/130
483. Petherick JC. Animal welfare issues associated with extensive livestock production: the northern Australian beef cattle industry. Appl Anim Behav Sci. 2005;92(3):211-34. doi: 10.1016/j.applanim.2005.05.009
484. Animal Justice Party. Policies: farming [Internet]. Strawberry Hills, NSW: Animal Justice Party; 2014 [cited 2016 Feb 4]. Available from: http://animaljusticeparty.org/policies/farming
485. Coles. Responsible sourcing [Internet]. Hawthorn East, Victoria: Coles Supermarkets Australia Pty Ltd; 2016 [cited 2016 Feb 4]. Available from: http://www.coles.com.au/corporate-responsibility/responsible-sourcing/responsible-sourcing
486. Coles. Ethical sourcing in Coles supply chain [Internet]. Hawthorn East, Victoria: Coles Supermarkets Australia Pty Ltd; 2016 [cited 2016 Feb 4]. Available from: http://www.coles.com.au/corporate-responsibility/responsible-sourcing/ethics-in-practice
487. RSPCA. Shop humane [Internet]. Australia: RSPCA; 2015 [cited 2016 Feb 4]. Available from: http://www.shophumane.org.au
488. Mulley R, Lean I, Wright VE. Market preparation. In: Cottle DJ, Kahn L, editors. Beef cattle production and trade. Collingwood: CSIRO Publishing; 2014. Chapter 3
489. Deane P, Hogan W, Pervan M. Molehill to mountain: agriculture in northern Australia [Internet]. ANZ; 2014 [cited 2016 Feb 3]. Available from: http://www.indepth.anz.com/pdf/IIB_InDepth_Report_Short_form_Molehill_AW.pdf
490. Department of Regional Development, Primary Industry, Fisheries and Resources. Cattle and land management best practices for the Katherine region [Internet]. Department of Regional Development, Primary Industry, Fisheries and Resources; 2009 [cited 2016 Feb 4]. Available from: www.nt.gov.au/d/Content/File/p/pi/KBP_Apr09_web_96dpi.pdf
491. Jackson S, Storrs M, Morrison J. Recognition of Aboriginal rights, interests and values in river research and management: perspectives from northern Australia. Ecol Manag Restor. 2005;6(2):105-10. doi: 10.1111/j.1442-8903.2005.00226.x

185 | P a g e
492. Petheram C, Watson I, Stone P. Agricultural resource assessment for the Flinders catchment. A report to the Australian Government from the CSIRO Flinders and Gilbert Agricultural Resource Assessment, part of the North Queensland Irrigated Agriculture Strategy [Internet]. Canberra: CSIRO; 2013 [cited 2016 Feb 4]. Available from: https://publications.csiro.au/rpr/pub?pid=csiro:EP1312940
493. Head L. The northern myth revisited? Aborigines, environment and agriculture in the Ord River Irrigation Scheme, Stages One and Two. Aust Geogr. 1999;30(2):141-58. doi: 10.1080/00049189993684
494. Department of Natural Resources and Mines. Queensland Government response to the Inquiry into the Future and Continued Relevance of Government Land Tenure across Queensland [Internet]. Department of Natural Resources and Mines; 2014 [cited 2016 Feb 4]. Available from: http://www.parliament.qld.gov.au/documents/tableOffice/TabledPapers/2013/5413T3307.pdf
495. Greiner R. Willingness of north Australian pastoralists and graziers to participate in contractual biodiversity conservation. In: Contributed paper prepared for presentation at the 58th AARES Annual Conference, 2014 Feb 4-7; Port Macquarie, New South Wales; 2014.
496. Crowley GM, Garnett ST, Shephard S. Impact of storm-burns on Melaleuca viridiflora invasion of grasslands and grassy woodlands on Cape York Peninsula, Australia. Austral Ecol. 2009;34:196-209. doi: 10.1111/j.1442-9993.2008.01921.x
497. Tassicker AL, Kutt AS, Vanderduys E, Mangru S. The effects of vegetation structure on the birds in a tropical savanna woodland in north-eastern Australia. Rangel J. 2006;28(2):139-52. doi: 10.1071/RJ05029
498. Walton N, Smith H, Bowen L, Mitchell P, Pethybridge E, Hayes T, et al. Opportunities for fire and carbon on pastoral properties in the savanna rangelands: perspectives from the Indigenous Land Corporation and the Northern Territory Cattlemen’s Association. Rangel J. 2014;36(4):403-9. doi: 10.1071/RJ14025
499. James CD, Stafford Smith M, Landsberg J, Fisher A, Tynan R, Maconochie J, et al. Biograze - melding off-reserve conservation of native species with animal production in Australian rangelands. In: Craig JL, Mitchell N, Saunders DA, editors. Nature conservation 5: Conservation in production environments: managing the matrix. Chipping Norton, Sydney: Surrey Beatty and Sons; 2000. p. 290-300.
500. Biograze. Biograze: waterpoints and wildlife. Final Project Report November 2000 [Internet]. Alice Springs: CSIRO; 2000 [cited 2016 Feb 5]. Available from: http://savanna.cdu.edu.au/downloads/biograze.pdf
501. Hunt LP, Petty S, Cowley R, Fisher A, White A, MacDonald N, et al. Sustainable development of Victoria River District (VRD) grazing lands. Final report project B.NBP.0375. Meat and Livestock Australia [Internet]. North Sydney, NSW: Meat and Livestock Australia; 2013 [cited 2016 Feb 5]. Available from: http://www.mla.com.au/Research-and-development/Search-RD-reports/RD-report-details/Environment-On-Farm/Sustainable-development-of-Victoria-River-District-grazing-lands-2013/648
502. Legge SM, Kennedy MS, Lloyd RAY, Murphy SA, Fisher A. Rapid recovery of mammal fauna in the central Kimberley, northern Australia, following the removal of introduced herbivores. Austral Ecol. 2011;36(7):791-9. doi: 10.1111/j.1442-9993.2010.02218.x
503. Kutt AS, Vanderduys EP, Perry JJ, Perkins GC, Kemp JE, Bateman BL, et al. Signals of change in tropical savanna woodland vertebrate fauna 5 years after cessation of livestock grazing. Wildl Res. 2012;39(5):386-96. doi: 10.1071/WR11137
186 | P a g e
504. Christianson K, Douglas J, Armstrong J, Walsh D. Production and conservation gains through adaptive grazing – The Beetaloo pilot. In: Territory NRM Conference, 2014 Nov 18-20; Darwin: Territory NRM; 2014
505. Warfe DM, Pettit NE, Davies PM, Pusey BJ, Hamilton SK, Kennard MJ, et al. The ‘wet–dry’ in the wet–dry tropics drives river ecosystem structure and processes in northern Australia. Freshw Biol. 2011;56(11):2169-95. doi: 10.1111/j.1365-2427.2011.02660.x
506. Cork S, Sattler P, Alexandra J. Biodiversity. In: Beeton RJS, Buckley KI, Jones GJ, Morgan D, Reichelt RE, Trewin D, editors. Australia state of the environment 2006. Independent report to the Australian Government Minister for the Environment and Heritage [Internet]. Canberra: Department of the Environment and Heritage; 2006 [cited 2016 Feb 5]. Available from: http://www.environment.gov.au/science/soe/2006-report/contents
507. Fensham R. Spring wetlands of the Great Artesian Basin. Current and emerging issues paper prepared for the 2006 Australian State of the Environment Committee [Internet]. Canberra: Department of Environment and Heritage; 2006 [cited 2016 Feb 5]. Available from: http://www.environment.gov.au/node/22567
508. Edwards AC, Russell-Smith J. Ecological thresholds and the status of fire-sensitive vegetation in western Arnhem Land, northern Australia: implications for management. Int J Wildland Fire. 2009;18(2):127-46. doi: 10.1071/WF08008
509. Williams RJ, Griffin AJ, Allen GE. Fire regimes and biodiversity in the savannas of north Australia. In: Bradstock RA, Williams J, Gill AM, editors. Flammable Australia: fire regimes and biodiversity of a continent. Cambridge: Cambridge University Press; 2002. p. 281-304.
510. Woinarski JCZ, Risler J, Kean L. Response of vegetation and vertebrate fauna to 23 years of fire exclusion in a tropical Eucalyptus open forest, Northern Territory, Australia. Austral Ecol. 2004;29:156-76. doi: 10.1111/j.1442-9993.2004.01333.x
511. Woinarski JCZ, Burbidge AA, Harrison PL. Ongoing unraveling of a continental fauna: decline and extinction of Australian mammals since European settlement. P Natl Acad Sci USA. 2015. doi: 10.1073/pnas.1417301112
512. Petty AM, deKoninck V, Orlove B. Cleaning, protecting, or abating? Making Indigenous fire management “work” in northern Australia. J Ethnobiol. 2015;35(1):140-62. doi: 10.2993/0278-0771-35.1.140
513. Preece ND. Traditional and ecological fires and effects of bushfire laws in north Australian savannas. Int J Wildland Fire. 2007;16(4):378–89. doi: 10.1071/WF05079
514. Greiner R, Stoeckl N, Stokes C, Herr A, Bachmaier J. Natural resource management in the Burdekin Dry Tropics: social and economic issues. Report for the Burdekin Dry Tropics NRM Board [Internet]. Northern Futures, CSIRO Townsville: 2016; 2003 [cited Feb 5]. Available from: http://www.cse.csiro.au/publications/2003/burdekin_socio_economic_profile_f02.pdf
515. Greiner R, Lankester A, Patterson L. Incentives to enhance the adoption of ‘best management practices’ by landholders: achieving water quality improvements in the Burdekin River catchment. Research Report for the Burdekin Dry Tropics NRM and the Coastal Catchment Initiative (Burdekin) [Internet]. 2007 [cited 2016 Feb 5]. Available from: https://research.jcu.edu.au/tropwater/resources/07%2039%20Incentives%20to%20Enhance%20the%20Adoption%20of%20Best%20Management%20Practices%20by%20Landholders.pdf
