trends in hospitalised childhood injury in australia 1999-07 (full
TRANSCRIPT
InJury reseArch And sTATIsTIcs serIes no. 75
Trends in hospitalised childhood injury in Australia
1999–07
Sophie Pointer and Yvonne Helps
INJURY RESEARCH AND STATISTICS SERIES
Number 75
Australian Institute of Health and Welfare
Canberra
Cat. no. INJCAT 151
Trends in hospitalised childhood injury
in Australia
1999–07
Sophie Pointer & Yvonne Helps
The Australian Institute of Health and Welfare is a major national agency
which provides reliable, regular and relevant information and statistics
on Australia’s health and welfare. The Institute’s mission is
authoritative information and statistics to promote better health and wellbeing.
© Australian Institute of Health and Welfare 2012
This product, excluding the AIHW logo, Commonwealth Coat of Arms and any material owned by a
third party or protected by a trademark, has been released under a Creative Commons BY 3.0
(CC-BY 3.0) licence. Excluded material owned by third parties may include, for example, design and
layout, images obtained under licence from third parties and signatures. We have made all reasonable
efforts to identify and label material owned by third parties.
You may distribute, remix and build upon this work. However, you must attribute the AIHW as the
copyright holder of the work in compliance with our attribution policy available at
<www.aihw.gov.au/copyright/>. The full terms and conditions of this licence are available at
<http://creativecommons.org/licenses/by/3.0/au/>.
Enquiries relating to copyright should be addressed to the Head of the Communications, Media and
Marketing Unit, Australian Institute of Health and Welfare, GPO Box 570, Canberra ACT 2601.
This publication is part of the Australian Institute of Health and Welfare’s Injury research and statistics
series. A complete list of the Institute’s publications is available from the Institute’s website
<www.aihw.gov.au>.
ISSN 1444-3791
ISBN 978-1-74249-377-0
Suggested citation
AIHW: Pointer S & Helps Y 2012. Trends in hospitalised childhood injury in Australia 1999–07. Injury
research and statistics series no. 75. Cat. no. INJCAT 151. Canberra: AIHW.
Australian Institute of Health and Welfare
Board Chair
Dr Andrew Refshauge
Director
David Kalisch
Any enquiries about or comments on this publication should be directed to:
Communications, Media and Marketing Unit
Australian Institute of Health and Welfare
GPO Box 570
Canberra ACT 2601
Tel: (02) 6244 1032
Email: [email protected]
Published by the Australian Institute of Health and Welfare
Please note that there is the potential for minor revisions of data in this report.
Please check the online version at <www.aihw.gov.au> for any amendments.
iii
Contents
Abbreviations ...................................................................................................................................... iv
Summary ............................................................................................................................................... v
1 Introduction .................................................................................................................................... 1
Cases included in the report ......................................................................................................... 1
2 Overview of all causes of injury................................................................................................. 2
Trends over time ............................................................................................................................ 2
External causes of injury ............................................................................................................... 7
3 Falls .................................................................................................................................................. 9
Trends over time ............................................................................................................................ 9
Types of fall ................................................................................................................................... 12
4 Other unintentional injury ........................................................................................................ 15
Trends over time .......................................................................................................................... 15
Types of other unintentional injury ........................................................................................... 18
5 Transport injury .......................................................................................................................... 22
Trends over time .......................................................................................................................... 22
Types of transport injury ............................................................................................................. 25
6 Poisoning by pharmaceuticals .................................................................................................. 29
Trends over time .......................................................................................................................... 29
Types of pharmaceutical poisoning ........................................................................................... 32
7 Smoke, fire, heat and hot substances ...................................................................................... 35
Trends over time .......................................................................................................................... 35
Types of exposure to smoke, fire, heat and hot substances ................................................... 38
8 Conclusion .................................................................................................................................... 41
Appendix A: Data issues ............................................................................................................... 42
References ............................................................................................................................................ 45
List of tables ........................................................................................................................................ 46
List of figures ...................................................................................................................................... 48
iv
Abbreviations
ABS Australian Bureau of Statistics
AIHW Australian Institute of Health and Welfare
CI Confidence Interval
ICD-10-AM International Statistical Classification of Diseases and Related Health Problems, 10th revision, Australian Modification
NCCH National Centre for Classification in Health
Symbols
n number
p probability
v
Summary
This report provides summary data on trends in hospitalised childhood injury for the period 1 July 1999 to 30 June 2007. Information is provided for three age groups (0–4, 5–9 and 10–14) for each year; information is also presented on the top five causes of hospitalised injury to children in Australia.
Almost half a million children were hospitalised as a result of an injury during the reporting period, boys outnumbering girls by a factor of 2 to 1.
Falls were the main cause of hospitalised injury (n = 193,141), and transport-related injuries were also common (n = 66,864). For all but one cause, cases of hospitalised injury were more numerous in boys compared with girls: for the category of intentional self-harm 3,514 girls were hospitalised compared with 837 boys.
Falls and other unintentional injuries were the most frequent causes of hospitalised injury in each of the three age groups. The most frequent cause of hospitalised falls in children aged up to 9 was falls involving playground equipment. At older ages falls involving roller-skates and skateboards were more common.
For 0–4 year olds poisoning by pharmaceuticals and the effects of exposure to smoke, fire, heat and hot substances accounted for 17% of hospitalised injuries. In 5–9 and 10–14 year olds transport incidents accounted for 14% and 23% of all hospitalised injuries respectively.
The rate of hospitalised injury changed little during the reporting period, there being about 1,500 cases per 100,000 children each year. A small (less than 1%) but statistically significant decline in the rate of hospitalised injury was seen overall during the period. There were no significant changes in the rates of fall injuries, other unintentional injuries, transport injuries and injuries due to the effects of exposure to smoke, fire, heat and hot substances. The only significant decline in childhood hospitalised injury was seen in the rate for poisoning by pharmaceuticals, for which the average decrease was 7.5% a year.

Trends in hospitalised childhood injury in Australia 1999–07 1
1 Introduction
This report provides summary data on trends in hospitalised childhood injury for the period 1 July 1999 to 30 June 2007, updating information on childhood injury trends for 1979 to 1994 (Moller & Kreisfeld 1997).
The report contains information on hospitalised childhood injuries for three age groups (0–4, 5–9 and 10–14) by financial year; additional information is presented on the top five external causes of injury to children. An ‘external cause’ is defined as the environmental event, circumstance or condition that was the cause of an injury, poisoning or adverse event.
‘Hospitalised injuries’ are defined as injuries requiring admission to hospital following an injury event. They range from fractures to catastrophic injuries (such as spinal cord injury) that result in lifelong disability at substantial cost to the health system. Episodes of hospital care that occur only in emergency departments or outpatient settings are not included.
The injuries reported here—hospital records with a principal diagnosis in the International Statistical Classification of Diseases and Related Health Problems, 10th Revision, Australian Modification (ICD-10-AM) range S00–T75 or T79—are defined as injuries usually sustained in the community setting; for example, workplace, educational institution, street or natural environment (Berry & Harrison 2007).
The report does not include an analysis of the trends in injury of Aboriginal and Torres Strait Islander children. Information on injury among this group of children is available in the report Aboriginal and Torres Strait Islander child safety (AIHW 2011).
Cases included in the report This report covers episodes of admitted (inpatient) care in Australian hospitals that ended during the period from 1 July 1999 to 30 June 2007 where:
• the patient was aged between 0 and 14 at the time of hospitalisation
• the mode of admission was not a transfer from another acute hospital and
• the principal diagnosis code was in the range S00–T75 or T79.
Records for which the mode of admission was recorded as being by transfer from another acute-care hospital are excluded on the ground that such records are likely to result in double-counting of cases. Use of the term ‘cases’ throughout this report reflects this exclusion and forms the basis for case estimation. See Appendix A for more detail.
2 Trends in hospitalised childhood injury in Australia 1999–07
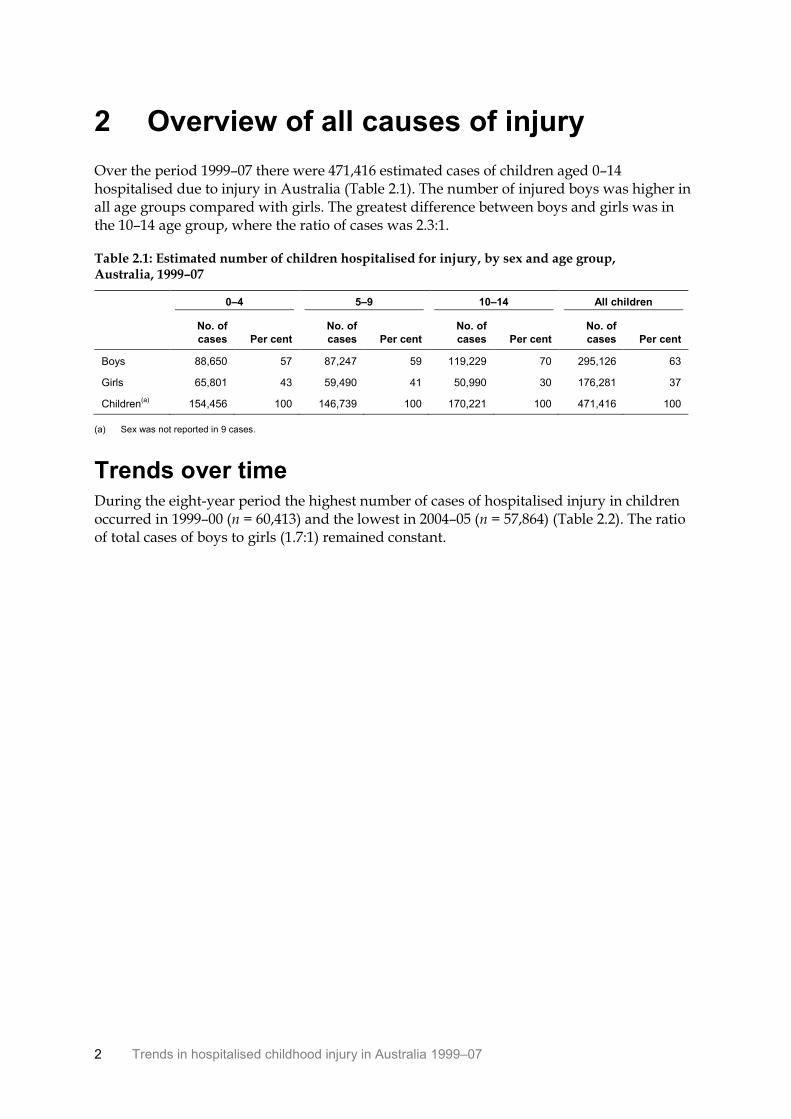
2 Overview of all causes of injury
Over the period 1999–07 there were 471,416 estimated cases of children aged 0–14 hospitalised due to injury in Australia (Table 2.1). The number of injured boys was higher in all age groups compared with girls. The greatest difference between boys and girls was in the 10–14 age group, where the ratio of cases was 2.3:1.
Table 2.1: Estimated number of children hospitalised for injury, by sex and age group, Australia, 1999–07
0–4 5–9 10–14 All children
No. of
cases Per cent
No. of
cases Per cent
No. of
cases Per cent
No. of
cases Per cent
Boys 88,650 57 87,247 59 119,229 70 295,126 63
Girls 65,801 43 59,490 41 50,990 30 176,281 37
Children(a)
154,456 100 146,739 100 170,221 100 471,416 100
(a) Sex was not reported in 9 cases.
Trends over time During the eight-year period the highest number of cases of hospitalised injury in children occurred in 1999–00 (n = 60,413) and the lowest in 2004–05 (n = 57,864) (Table 2.2). The ratio of total cases of boys to girls (1.7:1) remained constant.
Trends in hospitalised childhood injury in Australia 1999–07 3
Table 2.2: Estimated number of children hospitalised for injury, by age group, sex and year, Australia, 1999–07
Age group
Year 0–4 5–9 10–14 All children
1999–00
Boys 11,634 11,534 14,620 37,788
Girls 8,770 7,671 6,184 22,625
Children 20,404 19,205 20,804 60,413
2000–01
Boys 11,297 11,257 14,485 37,039
Girls 8,287 7,586 6,321 22,194
Children 19,584 18,843 20,806 59,233
2001–02
Boys 11,316 11,321 14,702 37,339
Girls 8,420 7,484 6,138 22,042
Children(a)
19,736 18,806 20,841 59,383
2002–03
Boys 11,092 11,058 14,818 36,968
Girls 8,195 7,578 6,305 22,078
Children(a)
19,289 18,636 21,123 59,048
2003–04
Boys 10,629 10,668 14,930 36,227
Girls 7,978 7,355 6,523 21,856
Children(a)
18,608 18,023 21,454 58,085
2004–05
Boys 10,679 10,503 15,124 36,306
Girls 7,866 7,259 6,432 21,557
Children(a)
18,545 17,763 21,556 57,864
2005–06
Boys 10,865 10,224 15,049 36,138
Girls 8,184 7,223 6,468 21,875
Children(a)
19,051 17,447 21,517 58,015
2006–07
Boys 11,138 10,682 15,501 37,321
Girls 8,101 7,334 6,619 22,054
Children(a)
19,239 18,016 22,120 59,375
Total cases(a)
154,456 146,739 170,221 471,416
(a) Includes cases for which sex was not stated.
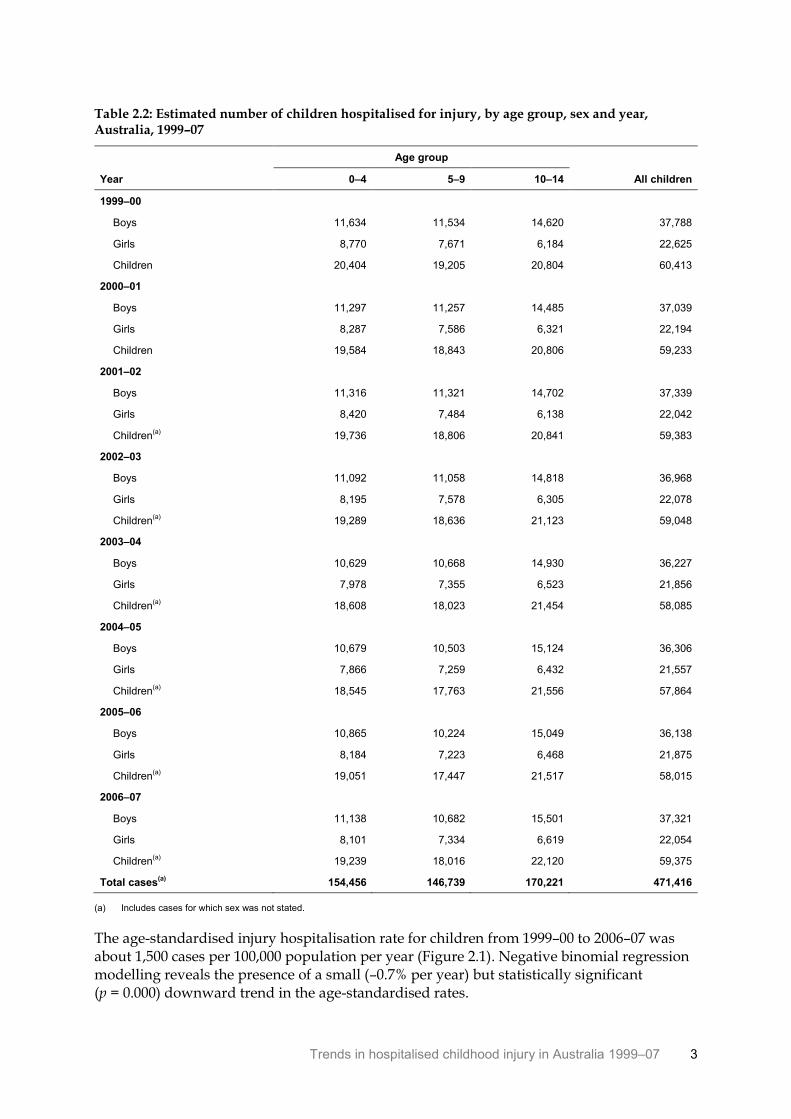
The age-standardised injury hospitalisation rate for children from 1999–00 to 2006–07 was about 1,500 cases per 100,000 population per year (Figure 2.1). Negative binomial regression modelling reveals the presence of a small (–0.7% per year) but statistically significant (p = 0.000) downward trend in the age-standardised rates.
4 Trends in hospitalised childhood injury in Australia 1999–07
Note: Line represents the modelled rate over the 8-year period; symbols represent the actual age-standardised rate value
for each year. See Table A1 for more information.
Figure 2.1: Modelled age-standardised rates of cases due to all causes, Australia, 1999–07
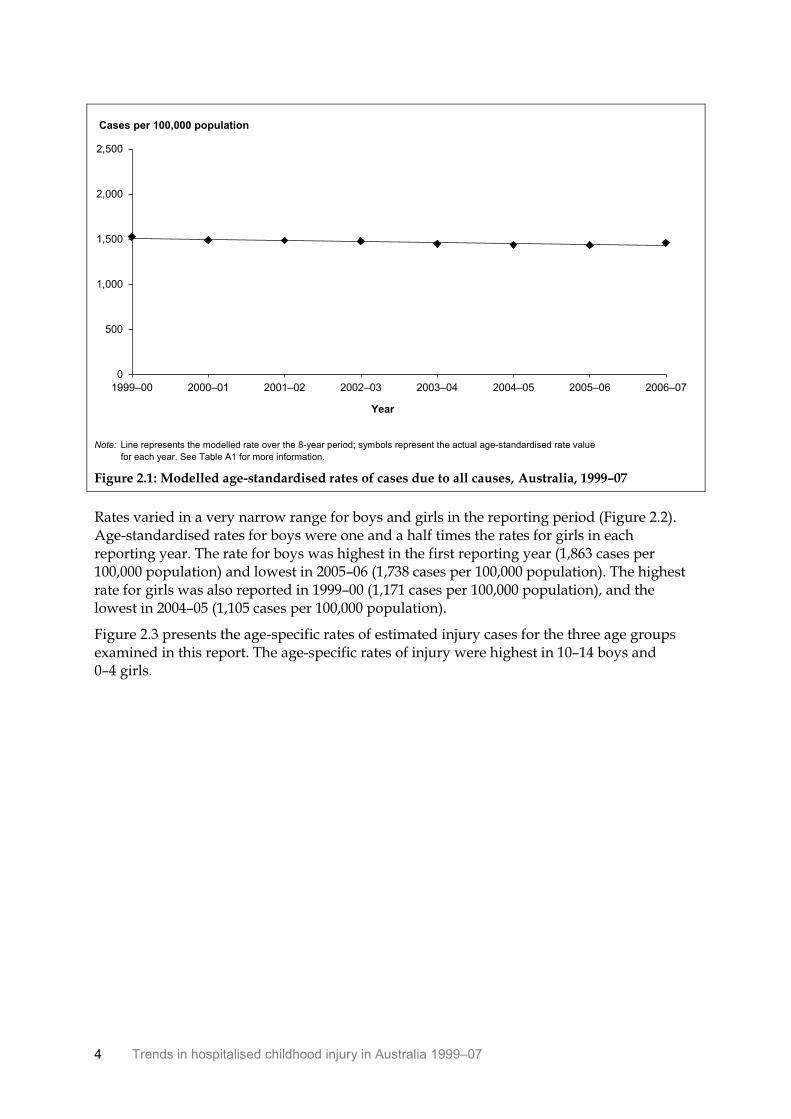
Rates varied in a very narrow range for boys and girls in the reporting period (Figure 2.2). Age-standardised rates for boys were one and a half times the rates for girls in each reporting year. The rate for boys was highest in the first reporting year (1,863 cases per 100,000 population) and lowest in 2005–06 (1,738 cases per 100,000 population). The highest rate for girls was also reported in 1999–00 (1,171 cases per 100,000 population), and the lowest in 2004–05 (1,105 cases per 100,000 population).
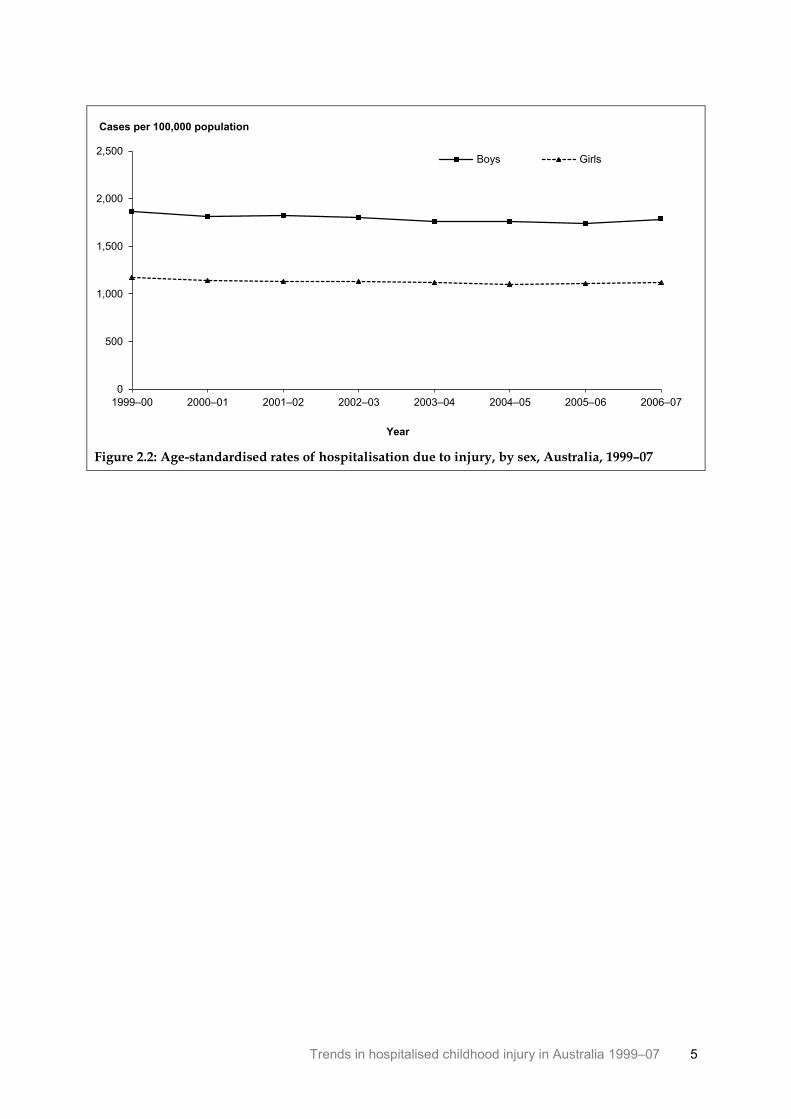
Figure 2.3 presents the age-specific rates of estimated injury cases for the three age groups examined in this report. The age-specific rates of injury were highest in 10–14 boys and 0–4 girls.
0
500
1,000
1,500
2,000
2,500
1999–00 2000–01 2001–02 2002–03 2003–04 2004–05 2005–06 2006–07
Year
Cases per 100,000 population
Trends in hospitalised childhood injury in Australia 1999–07 5
Figure 2.2: Age-standardised rates of hospitalisation due to injury, by sex, Australia, 1999–07
0
500
1,000
1,500
2,000
2,500
1999–00 2000–01 2001–02 2002–03 2003–04 2004–05 2005–06 2006–07
Year
Cases per 100,000 population
Boys Girls
6 Trends in hospitalised childhood injury in Australia 1999–07
Figure 2.3: Age-specific rates of hospitalisation due to injury, by sex and age group, Australia, 1999–07
0
500
1,000
1,500
2,000
2,500
1999–00 2000–01 2001–02 2002–03 2003–04 2004–05 2005–06 2006–07
Year
Cases per 100,000 population Boys 0–4 Girls 0–4
0
500
1,000
1,500
2,000
2,500
1999–00 2000–01 2001–02 2002–03 2003–04 2004–05 2005–06 2006–07
Year
Cases per 100,000 population Boys 5–9 Girls 5–9
0
500
1,000
1,500
2,000
2,500
1999–00 2000–01 2001–02 2002–03 2003–04 2004–05 2005–06 2006–07
Year
Cases per 100,000 population Boys 10–14 Girls 10–14
Trends in hospitalised childhood injury in Australia 1999–07 7
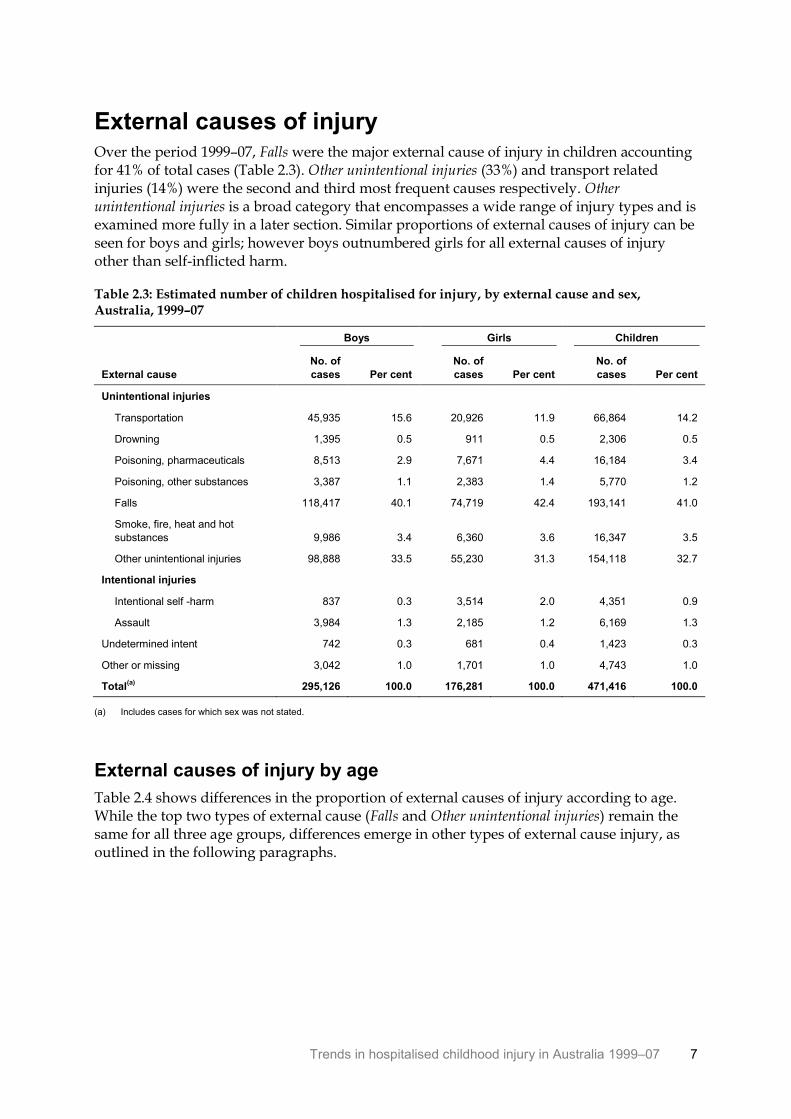
External causes of injury Over the period 1999–07, Falls were the major external cause of injury in children accounting for 41% of total cases (Table 2.3). Other unintentional injuries (33%) and transport related injuries (14%) were the second and third most frequent causes respectively. Other unintentional injuries is a broad category that encompasses a wide range of injury types and is examined more fully in a later section. Similar proportions of external causes of injury can be seen for boys and girls; however boys outnumbered girls for all external causes of injury other than self-inflicted harm.
Table 2.3: Estimated number of children hospitalised for injury, by external cause and sex, Australia, 1999–07
External cause
Boys Girls Children
No. of
cases Per cent
No. of
cases Per cent
No. of
cases Per cent
Unintentional injuries
Transportation 45,935 15.6 20,926 11.9 66,864 14.2
Drowning 1,395 0.5 911 0.5 2,306 0.5
Poisoning, pharmaceuticals 8,513 2.9 7,671 4.4 16,184 3.4
Poisoning, other substances 3,387 1.1 2,383 1.4 5,770 1.2
Falls 118,417 40.1 74,719 42.4 193,141 41.0
Smoke, fire, heat and hot
substances 9,986 3.4 6,360 3.6 16,347 3.5
Other unintentional injuries 98,888 33.5 55,230 31.3 154,118 32.7
Intentional injuries
Intentional self -harm 837 0.3 3,514 2.0 4,351 0.9
Assault 3,984 1.3 2,185 1.2 6,169 1.3
Undetermined intent 742 0.3 681 0.4 1,423 0.3
Other or missing 3,042 1.0 1,701 1.0 4,743 1.0
Total(a)
295,126 100.0 176,281 100.0 471,416 100.0
(a) Includes cases for which sex was not stated.
External causes of injury by age
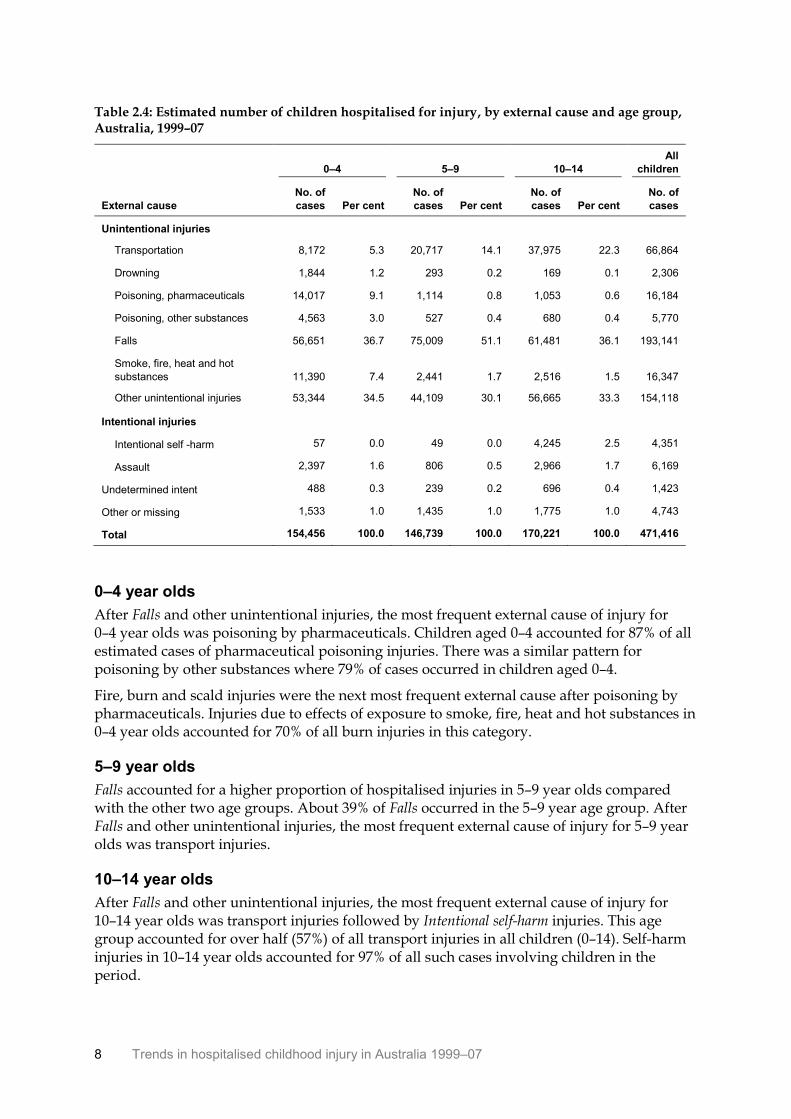
Table 2.4 shows differences in the proportion of external causes of injury according to age. While the top two types of external cause (Falls and Other unintentional injuries) remain the same for all three age groups, differences emerge in other types of external cause injury, as outlined in the following paragraphs.
8 Trends in hospitalised childhood injury in Australia 1999–07
Table 2.4: Estimated number of children hospitalised for injury, by external cause and age group, Australia, 1999–07
External cause
0–4 5–9 10–14
All
children
No. of
cases Per cent
No. of
cases Per cent
No. of
cases Per cent
No. of
cases
Unintentional injuries
Transportation 8,172 5.3 20,717 14.1 37,975 22.3 66,864
Drowning 1,844 1.2 293 0.2 169 0.1 2,306
Poisoning, pharmaceuticals 14,017 9.1 1,114 0.8 1,053 0.6 16,184
Poisoning, other substances 4,563 3.0 527 0.4 680 0.4 5,770
Falls 56,651 36.7 75,009 51.1 61,481 36.1 193,141
Smoke, fire, heat and hot
substances 11,390 7.4 2,441 1.7 2,516 1.5 16,347
Other unintentional injuries 53,344 34.5 44,109 30.1 56,665 33.3 154,118
Intentional injuries
Intentional self -harm 57 0.0 49 0.0 4,245 2.5 4,351
Assault 2,397 1.6 806 0.5 2,966 1.7 6,169
Undetermined intent 488 0.3 239 0.2 696 0.4 1,423
Other or missing 1,533 1.0 1,435 1.0 1,775 1.0 4,743
Total 154,456 100.0 146,739 100.0 170,221 100.0 471,416
0–4 year olds
After Falls and other unintentional injuries, the most frequent external cause of injury for 0–4 year olds was poisoning by pharmaceuticals. Children aged 0–4 accounted for 87% of all estimated cases of pharmaceutical poisoning injuries. There was a similar pattern for poisoning by other substances where 79% of cases occurred in children aged 0–4.
Fire, burn and scald injuries were the next most frequent external cause after poisoning by pharmaceuticals. Injuries due to effects of exposure to smoke, fire, heat and hot substances in 0–4 year olds accounted for 70% of all burn injuries in this category.
5–9 year olds
Falls accounted for a higher proportion of hospitalised injuries in 5–9 year olds compared with the other two age groups. About 39% of Falls occurred in the 5–9 year age group. After Falls and other unintentional injuries, the most frequent external cause of injury for 5–9 year olds was transport injuries.
10–14 year olds
After Falls and other unintentional injuries, the most frequent external cause of injury for 10–14 year olds was transport injuries followed by Intentional self-harm injuries. This age group accounted for over half (57%) of all transport injuries in all children (0–14). Self-harm injuries in 10–14 year olds accounted for 97% of all such cases involving children in the period.
Trends in hospitalised childhood injury in Australia 1999–07 9
3 Falls
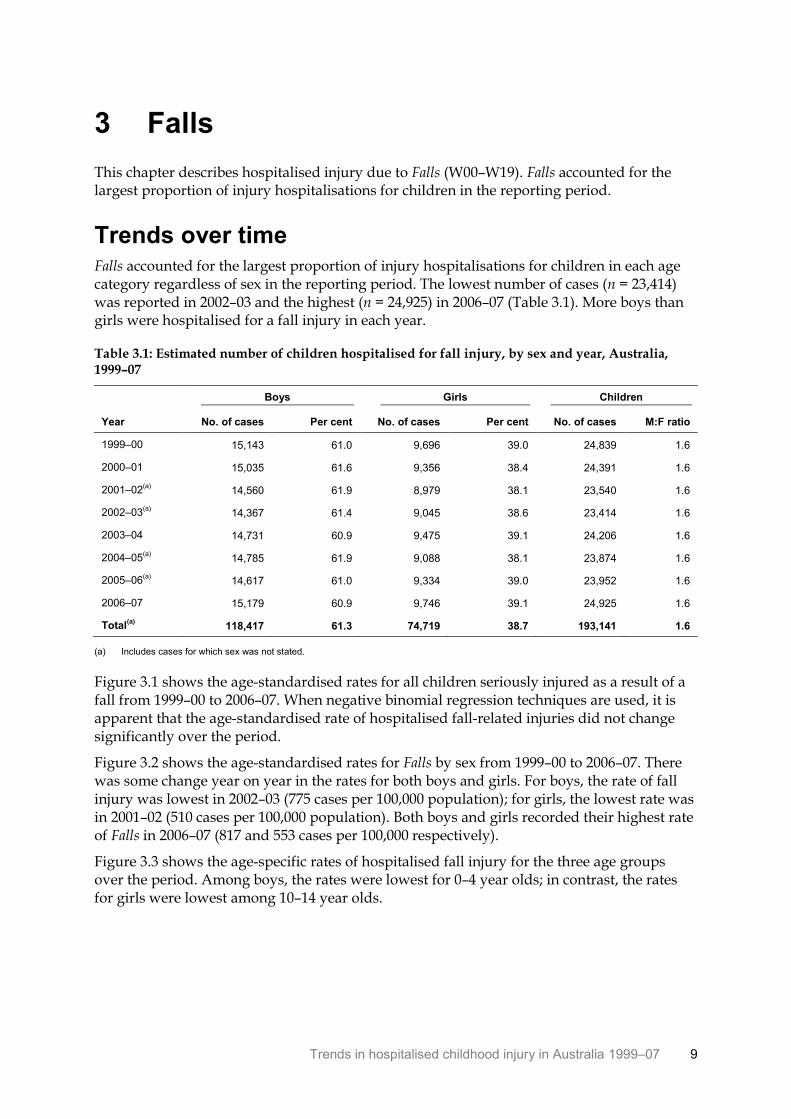
This chapter describes hospitalised injury due to Falls (W00–W19). Falls accounted for the largest proportion of injury hospitalisations for children in the reporting period.
Trends over time Falls accounted for the largest proportion of injury hospitalisations for children in each age category regardless of sex in the reporting period. The lowest number of cases (n = 23,414) was reported in 2002–03 and the highest (n = 24,925) in 2006–07 (Table 3.1). More boys than girls were hospitalised for a fall injury in each year.
Table 3.1: Estimated number of children hospitalised for fall injury, by sex and year, Australia, 1999–07
Boys Girls Children
Year No. of cases Per cent No. of cases Per cent No. of cases M:F ratio
1999–00 15,143 61.0 9,696 39.0 24,839 1.6
2000–01 15,035 61.6 9,356 38.4 24,391 1.6
2001–02(a)
14,560 61.9 8,979 38.1 23,540 1.6
2002–03(a)
14,367 61.4 9,045 38.6 23,414 1.6
2003–04 14,731 60.9 9,475 39.1 24,206 1.6
2004–05(a)
14,785 61.9 9,088 38.1 23,874 1.6
2005–06(a)
14,617 61.0 9,334 39.0 23,952 1.6
2006–07 15,179 60.9 9,746 39.1 24,925 1.6
Total(a)
118,417 61.3 74,719 38.7 193,141 1.6
(a) Includes cases for which sex was not stated.
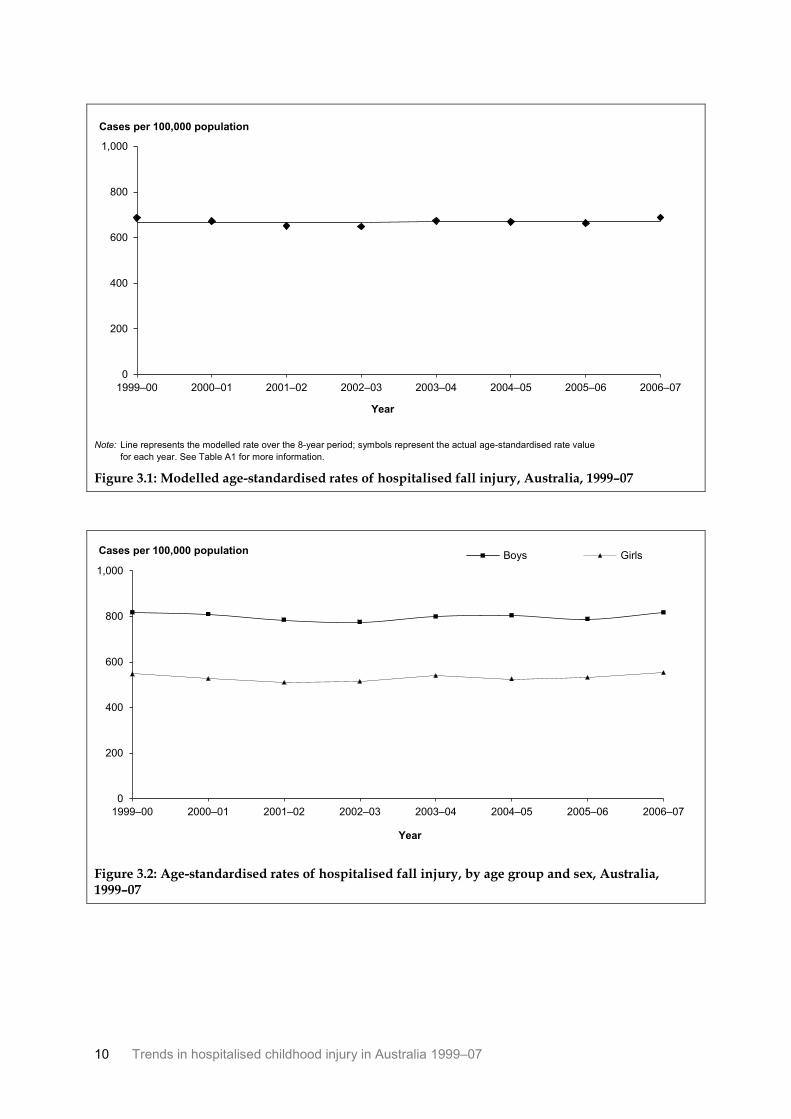
Figure 3.1 shows the age-standardised rates for all children seriously injured as a result of a fall from 1999–00 to 2006–07. When negative binomial regression techniques are used, it is apparent that the age-standardised rate of hospitalised fall-related injuries did not change significantly over the period.
Figure 3.2 shows the age-standardised rates for Falls by sex from 1999–00 to 2006–07. There was some change year on year in the rates for both boys and girls. For boys, the rate of fall injury was lowest in 2002–03 (775 cases per 100,000 population); for girls, the lowest rate was in 2001–02 (510 cases per 100,000 population). Both boys and girls recorded their highest rate of Falls in 2006–07 (817 and 553 cases per 100,000 respectively).
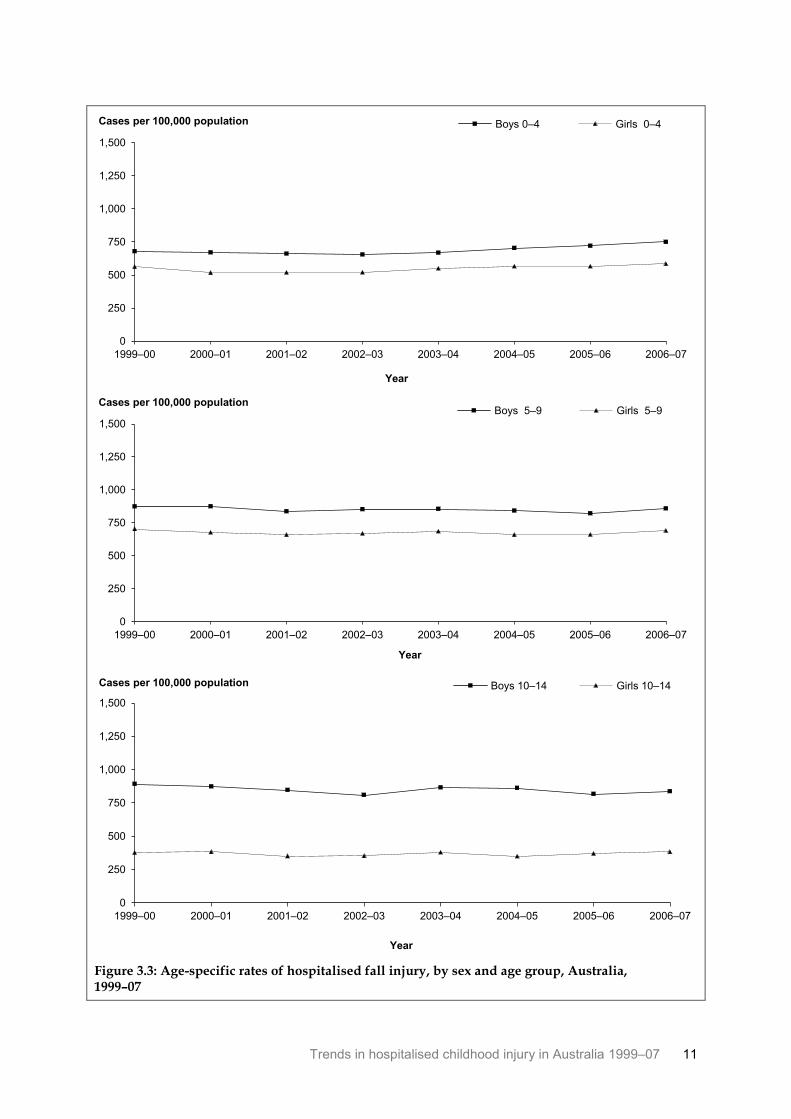
Figure 3.3 shows the age-specific rates of hospitalised fall injury for the three age groups over the period. Among boys, the rates were lowest for 0–4 year olds; in contrast, the rates for girls were lowest among 10–14 year olds.
10 Trends in hospitalised childhood injury in Australia 1999–07
Note: Line represents the modelled rate over the 8-year period; symbols represent the actual age-standardised rate value
for each year. See Table A1 for more information.
Figure 3.1: Modelled age-standardised rates of hospitalised fall injury, Australia, 1999–07
Figure 3.2: Age-standardised rates of hospitalised fall injury, by age group and sex, Australia, 1999–07
0
200
400
600
800
1,000
1999–00 2000–01 2001–02 2002–03 2003–04 2004–05 2005–06 2006–07
Year
Cases per 100,000 population
0
200
400
600
800
1,000
1999–00 2000–01 2001–02 2002–03 2003–04 2004–05 2005–06 2006–07
Year
Cases per 100,000 population Boys Girls
Trends in hospitalised childhood injury in Australia 1999–07 11
Figure 3.3: Age-specific rates of hospitalised fall injury, by sex and age group, Australia, 1999–07
0
250
500
750
1,000
1,250
1,500
1999–00 2000–01 2001–02 2002–03 2003–04 2004–05 2005–06 2006–07
Year
Cases per 100,000 population Boys 0–4 Girls 0–4
0
250
500
750
1,000
1,250
1,500
1999–00 2000–01 2001–02 2002–03 2003–04 2004–05 2005–06 2006–07
Year
Cases per 100,000 population Boys 5–9 Girls 5–9
0
250
500
750
1,000
1,250
1,500
1999–00 2000–01 2001–02 2002–03 2003–04 2004–05 2005–06 2006–07
Year
Cases per 100,000 population Boys 10–14 Girls 10–14
12 Trends in hospitalised childhood injury in Australia 1999–07
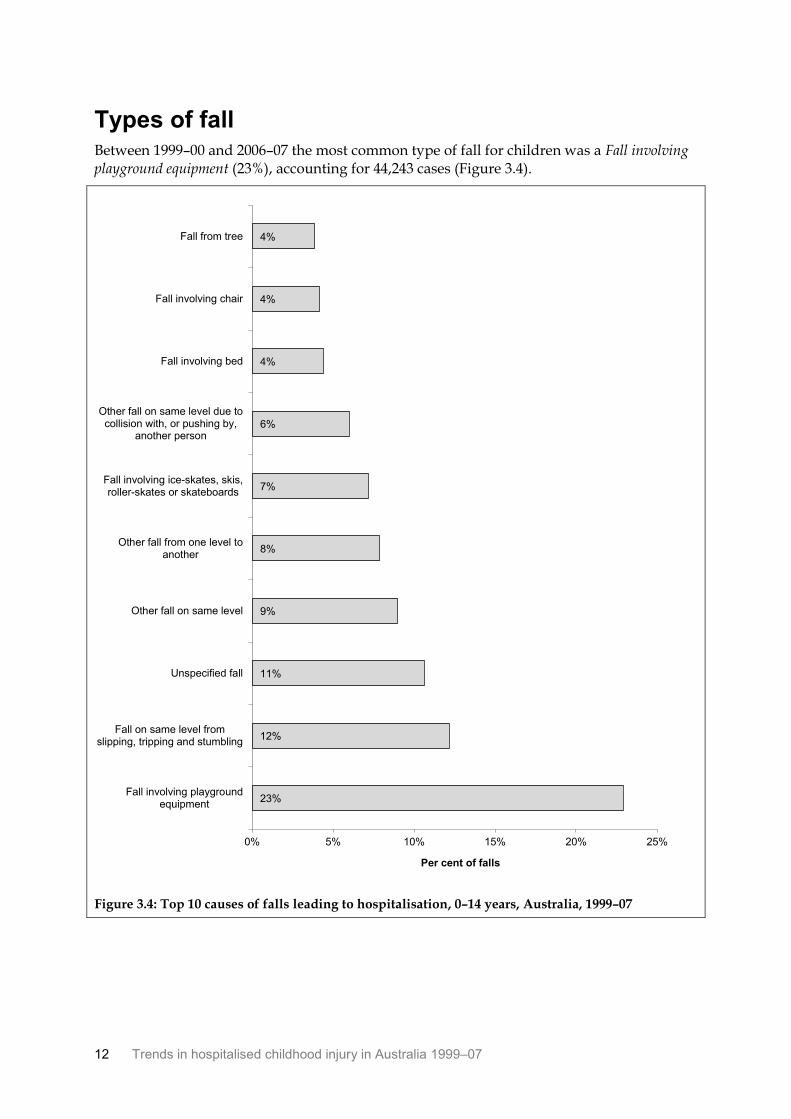
Types of fall Between 1999–00 and 2006–07 the most common type of fall for children was a Fall involving playground equipment (23%), accounting for 44,243 cases (Figure 3.4).
Figure 3.4: Top 10 causes of falls leading to hospitalisation, 0–14 years, Australia, 1999–07
23%
12%
11%
9%
8%
7%
6%
4%
4%
4%
0% 5% 10% 15% 20% 25%
Fall involving playgroundequipment
Fall on same level fromslipping, tripping and stumbling
Unspecified fall
Other fall on same level
Other fall from one level toanother
Fall involving ice-skates, skis,roller-skates or skateboards
Other fall on same level due tocollision with, or pushing by,
another person
Fall involving bed
Fall involving chair
Fall from tree
Per cent of falls
Trends in hospitalised childhood injury in Australia 1999–07 13
0–4 year olds
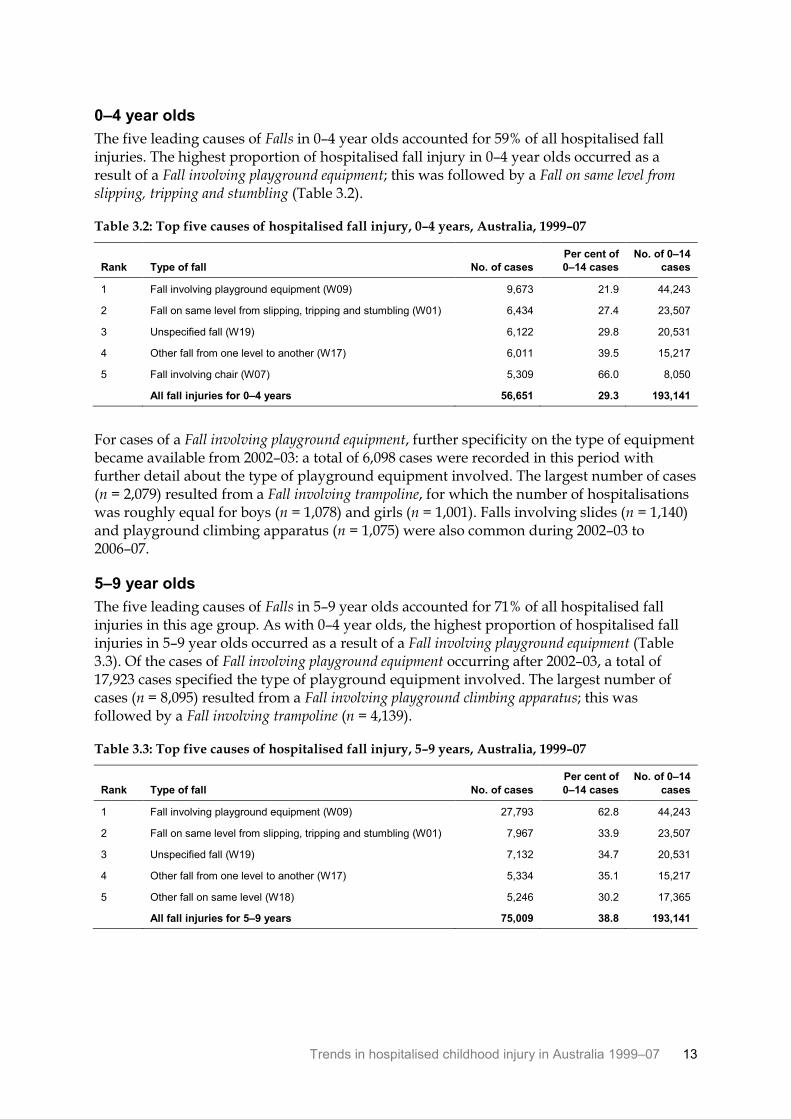
The five leading causes of Falls in 0–4 year olds accounted for 59% of all hospitalised fall injuries. The highest proportion of hospitalised fall injury in 0–4 year olds occurred as a result of a Fall involving playground equipment; this was followed by a Fall on same level from slipping, tripping and stumbling (Table 3.2).
Table 3.2: Top five causes of hospitalised fall injury, 0–4 years, Australia, 1999–07
Rank Type of fall No. of cases
Per cent of
0–14 cases
No. of 0–14
cases
1 Fall involving playground equipment (W09) 9,673 21.9 44,243
2 Fall on same level from slipping, tripping and stumbling (W01) 6,434 27.4 23,507
3 Unspecified fall (W19) 6,122 29.8 20,531
4 Other fall from one level to another (W17) 6,011 39.5 15,217
5 Fall involving chair (W07) 5,309 66.0 8,050
All fall injuries for 0–4 years 56,651 29.3 193,141
For cases of a Fall involving playground equipment, further specificity on the type of equipment became available from 2002–03: a total of 6,098 cases were recorded in this period with further detail about the type of playground equipment involved. The largest number of cases (n = 2,079) resulted from a Fall involving trampoline, for which the number of hospitalisations was roughly equal for boys (n = 1,078) and girls (n = 1,001). Falls involving slides (n = 1,140) and playground climbing apparatus (n = 1,075) were also common during 2002–03 to 2006–07.
5–9 year olds
The five leading causes of Falls in 5–9 year olds accounted for 71% of all hospitalised fall injuries in this age group. As with 0–4 year olds, the highest proportion of hospitalised fall injuries in 5–9 year olds occurred as a result of a Fall involving playground equipment (Table 3.3). Of the cases of Fall involving playground equipment occurring after 2002–03, a total of 17,923 cases specified the type of playground equipment involved. The largest number of cases (n = 8,095) resulted from a Fall involving playground climbing apparatus; this was followed by a Fall involving trampoline (n = 4,139).
Table 3.3: Top five causes of hospitalised fall injury, 5–9 years, Australia, 1999–07
Rank Type of fall No. of cases
Per cent of
0–14 cases
No. of 0–14
cases
1 Fall involving playground equipment (W09) 27,793 62.8 44,243
2 Fall on same level from slipping, tripping and stumbling (W01) 7,967 33.9 23,507
3 Unspecified fall (W19) 7,132 34.7 20,531
4 Other fall from one level to another (W17) 5,334 35.1 15,217
5 Other fall on same level (W18) 5,246 30.2 17,365
All fall injuries for 5–9 years 75,009 38.8 193,141
14 Trends in hospitalised childhood injury in Australia 1999–07
10–14 year olds
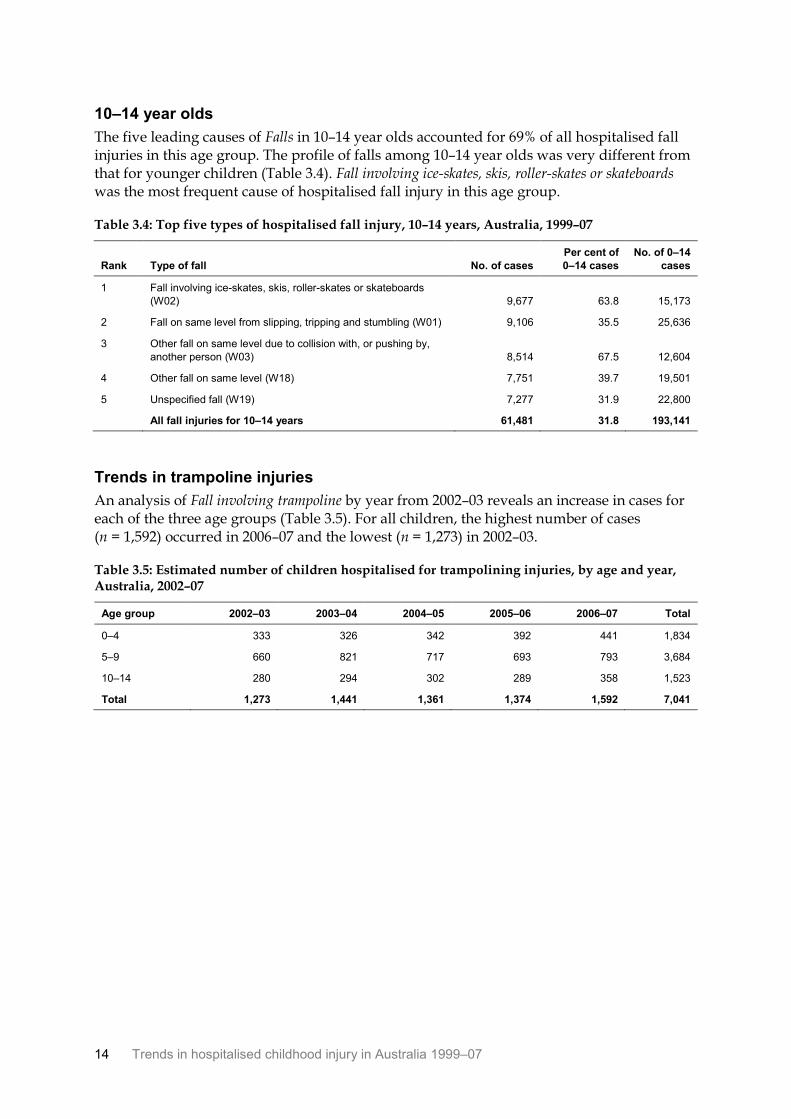
The five leading causes of Falls in 10–14 year olds accounted for 69% of all hospitalised fall injuries in this age group. The profile of falls among 10–14 year olds was very different from that for younger children (Table 3.4). Fall involving ice-skates, skis, roller-skates or skateboards was the most frequent cause of hospitalised fall injury in this age group.
Table 3.4: Top five types of hospitalised fall injury, 10–14 years, Australia, 1999–07
Rank Type of fall No. of cases
Per cent of
0–14 cases
No. of 0–14
cases
1 Fall involving ice-skates, skis, roller-skates or skateboards
(W02) 9,677 63.8 15,173
2 Fall on same level from slipping, tripping and stumbling (W01) 9,106 35.5 25,636
3 Other fall on same level due to collision with, or pushing by,
another person (W03) 8,514 67.5 12,604
4 Other fall on same level (W18) 7,751 39.7 19,501
5 Unspecified fall (W19) 7,277 31.9 22,800
All fall injuries for 10–14 years 61,481 31.8 193,141
Trends in trampoline injuries
An analysis of Fall involving trampoline by year from 2002–03 reveals an increase in cases for each of the three age groups (Table 3.5). For all children, the highest number of cases (n = 1,592) occurred in 2006–07 and the lowest (n = 1,273) in 2002–03.
Table 3.5: Estimated number of children hospitalised for trampolining injuries, by age and year, Australia, 2002–07
Age group 2002–03 2003–04 2004–05 2005–06 2006–07 Total
0–4 333 326 342 392 441 1,834
5–9 660 821 717 693 793 3,684
10–14 280 294 302 289 358 1,523
Total 1,273 1,441 1,361 1,374 1,592 7,041
Trends in hospitalised childhood injury in Australia 1999–07 15
4 Other unintentional injury
After Falls, other unintentional injuries were the most common cause of hospitalised injury among children from 1999–00 to 2006–07, accounting for an estimated 154,118 cases. Other unintentional injury consists of the following external cause categories:
• Exposure to inanimate mechanical forces (W20–W49)
• Exposure to animate mechanical forces (W50–W64)
• Other accidental threats to breathing (W75–W84)
• Exposure to electric current, radiation and extreme ambient air temperature and pressure (W85–W99)
• Contact with venomous animals and plants (X20–X29)
• Exposure to forces of nature (X30–X39)
• Overexertion, travel and privation (X50–X57)
• Accidental exposure to other and unspecified factors (X58–X59)
• Sequelae of external causes of morbidity and mortality (Y85–Y89).
Trends over time Boys were more likely than girls to be hospitalised as a result of other unintentional injury in each of the reporting years (Table 4.1). The number of estimated cases occurring each year did not change markedly during the reporting period.
Table 4.1: Estimated number of children hospitalised for other unintentional injury, by sex and year, Australia, 1999–07
Boys Girls Children
Year
No. of
cases Per cent No. of cases Per cent No. of cases Per cent
1999–00 12,329 64.4 6,827 35.6 19,156 1.8
2000–01 12,172 63.8 6,900 36.2 19,072 1.8
2001–02 12,280 64.2 6,844 35.8 19,124 1.8
2002–03 12,117 64.1 6,783 35.9 18,900 1.8
2003–04 12,248 64.2 6,827 35.8 19,075 1.8
2004–05 12,347 64.5 6,809 35.5 19,156 1.8
2005–06 12,635 63.8 7,180 36.2 19,815 1.8
2006–07 12,760 64.4 7,060 35.6 19,820 1.8
Total 98,888 64.2 55,230 35.8 154,118 1.8
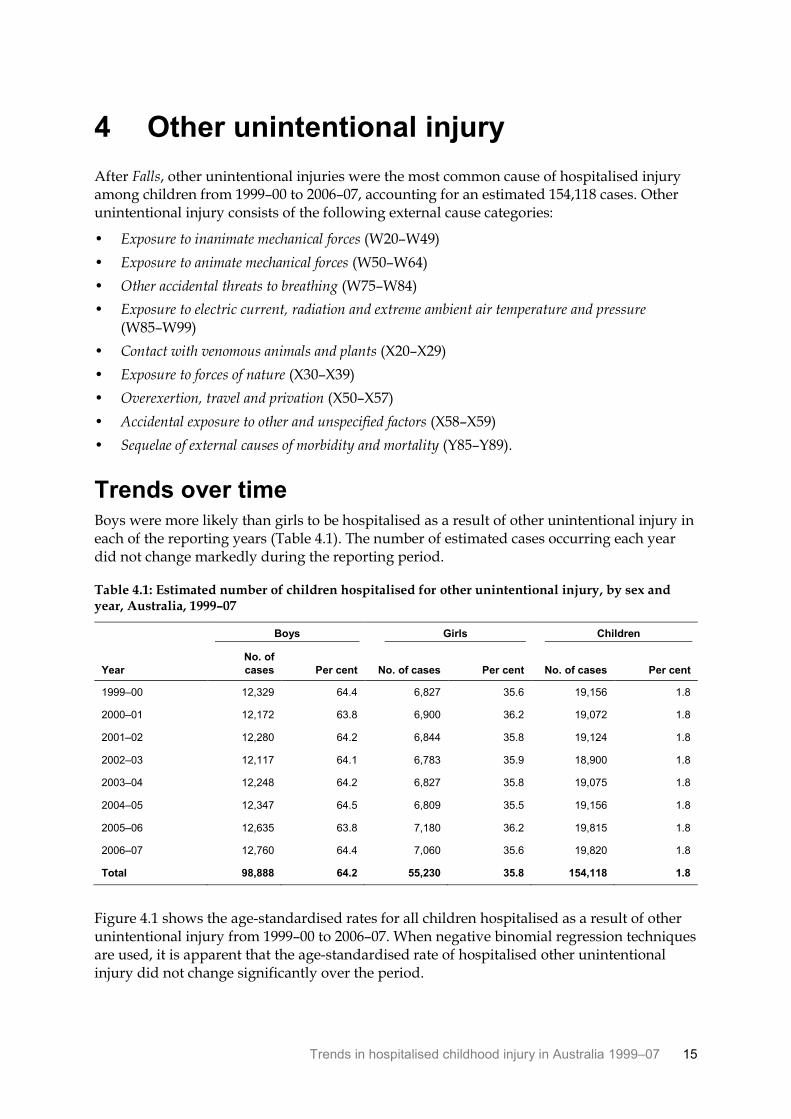
Figure 4.1 shows the age-standardised rates for all children hospitalised as a result of other unintentional injury from 1999–00 to 2006–07. When negative binomial regression techniques are used, it is apparent that the age-standardised rate of hospitalised other unintentional injury did not change significantly over the period.
16 Trends in hospitalised childhood injury in Australia 1999–07
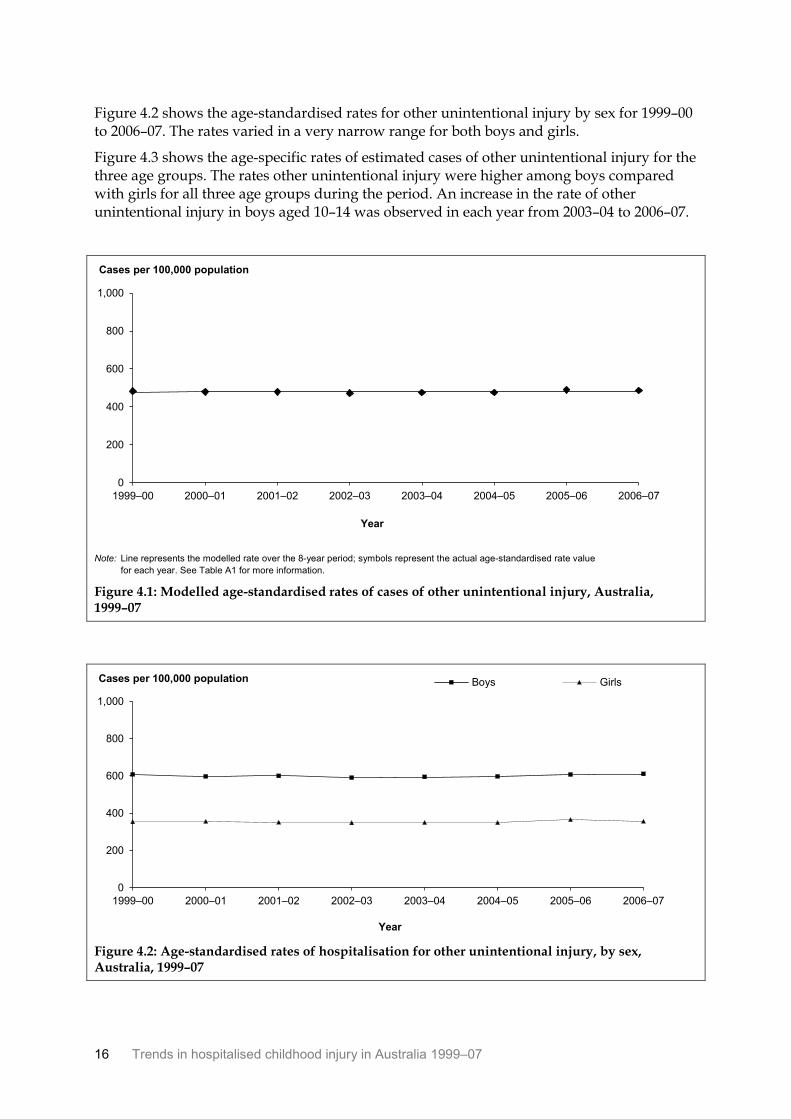
Figure 4.2 shows the age-standardised rates for other unintentional injury by sex for 1999–00 to 2006–07. The rates varied in a very narrow range for both boys and girls.
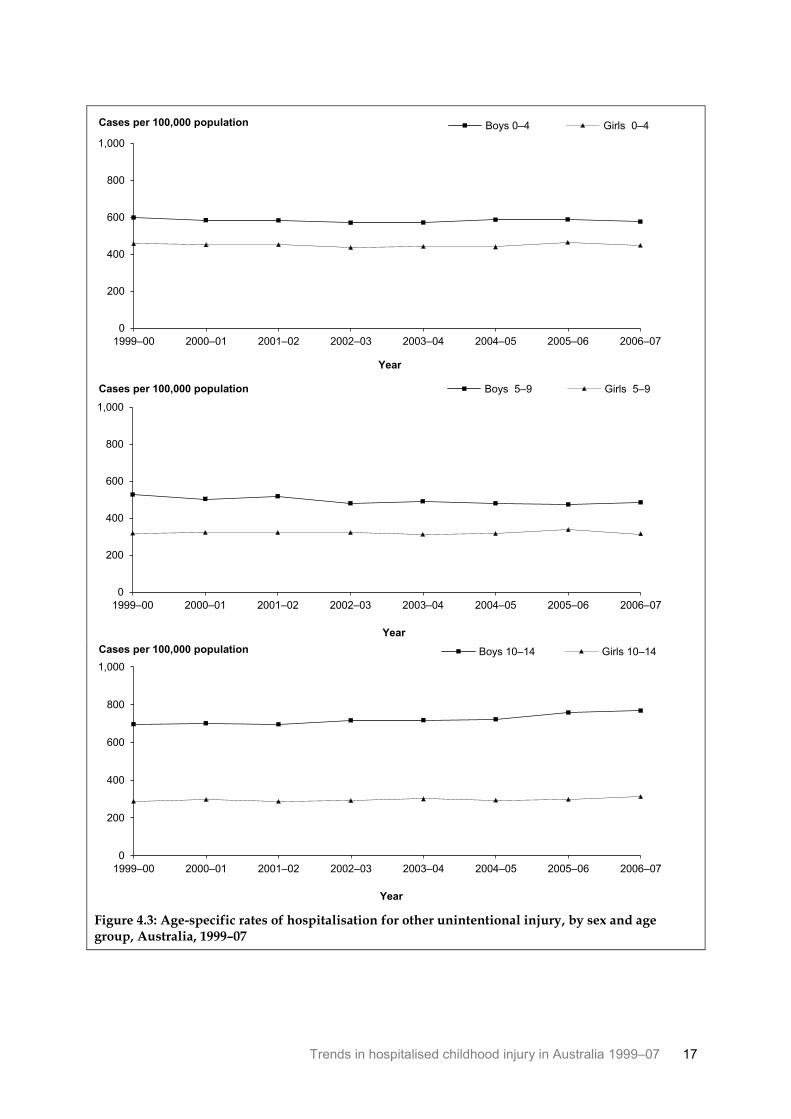
Figure 4.3 shows the age-specific rates of estimated cases of other unintentional injury for the three age groups. The rates other unintentional injury were higher among boys compared with girls for all three age groups during the period. An increase in the rate of other unintentional injury in boys aged 10–14 was observed in each year from 2003–04 to 2006–07.
Note: Line represents the modelled rate over the 8-year period; symbols represent the actual age-standardised rate value
for each year. See Table A1 for more information.
Figure 4.1: Modelled age-standardised rates of cases of other unintentional injury, Australia, 1999–07
Figure 4.2: Age-standardised rates of hospitalisation for other unintentional injury, by sex, Australia, 1999–07
0
200
400
600
800
1,000
1999–00 2000–01 2001–02 2002–03 2003–04 2004–05 2005–06 2006–07
Year
Cases per 100,000 population
0
200
400
600
800
1,000
1999–00 2000–01 2001–02 2002–03 2003–04 2004–05 2005–06 2006–07
Year
Cases per 100,000 population Boys Girls
Trends in hospitalised childhood injury in Australia 1999–07 17
Figure 4.3: Age-specific rates of hospitalisation for other unintentional injury, by sex and age group, Australia, 1999–07
0
200
400
600
800
1,000
1999–00 2000–01 2001–02 2002–03 2003–04 2004–05 2005–06 2006–07
Year
Cases per 100,000 population Boys 0–4 Girls 0–4
0
200
400
600
800
1,000
1999–00 2000–01 2001–02 2002–03 2003–04 2004–05 2005–06 2006–07
Year
Cases per 100,000 population Boys 5–9 Girls 5–9
0
200
400
600
800
1,000
1999–00 2000–01 2001–02 2002–03 2003–04 2004–05 2005–06 2006–07
Year
Cases per 100,000 population Boys 10–14 Girls 10–14
18 Trends in hospitalised childhood injury in Australia 1999–07
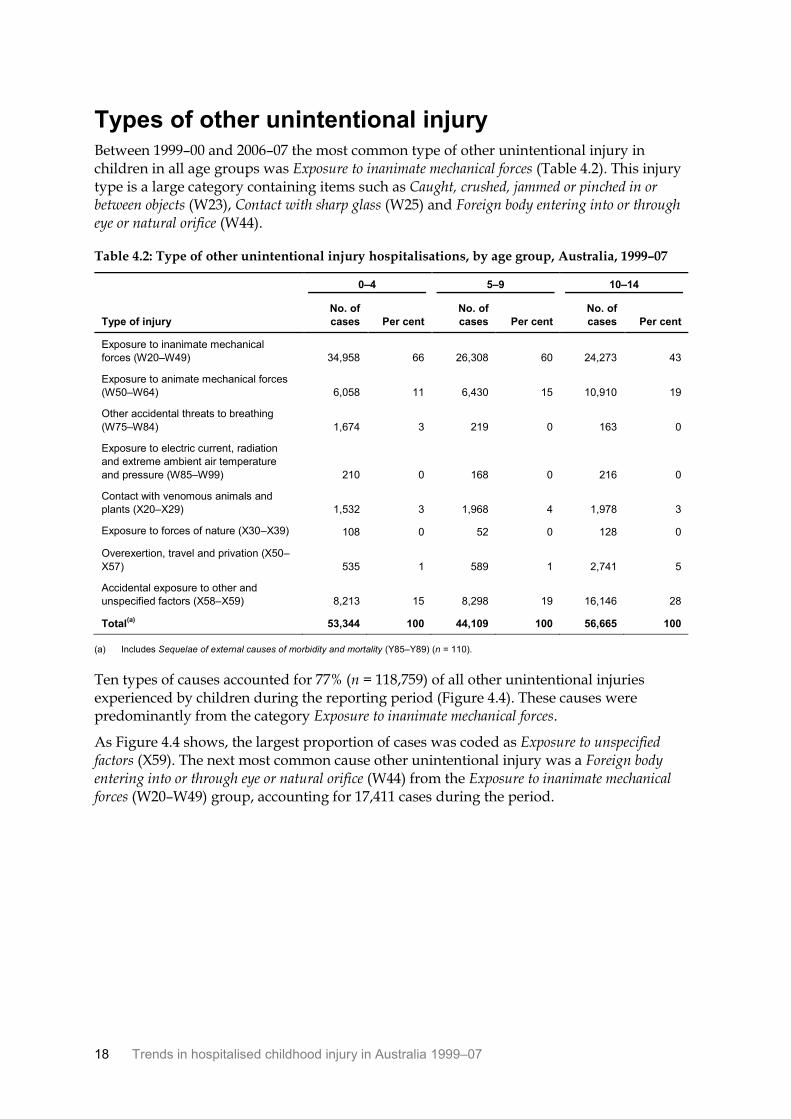
Types of other unintentional injury Between 1999–00 and 2006–07 the most common type of other unintentional injury in children in all age groups was Exposure to inanimate mechanical forces (Table 4.2). This injury type is a large category containing items such as Caught, crushed, jammed or pinched in or between objects (W23), Contact with sharp glass (W25) and Foreign body entering into or through eye or natural orifice (W44).
Table 4.2: Type of other unintentional injury hospitalisations, by age group, Australia, 1999–07
0–4 5–9 10–14
Type of injury
No. of
cases Per cent
No. of
cases Per cent
No. of
cases Per cent
Exposure to inanimate mechanical
forces (W20–W49) 34,958 66 26,308 60 24,273 43
Exposure to animate mechanical forces
(W50–W64) 6,058 11 6,430 15 10,910 19
Other accidental threats to breathing
(W75–W84) 1,674 3 219 0 163 0
Exposure to electric current, radiation
and extreme ambient air temperature
and pressure (W85–W99) 210 0 168 0 216 0
Contact with venomous animals and
plants (X20–X29) 1,532 3 1,968 4 1,978 3
Exposure to forces of nature (X30–X39) 108 0 52 0 128 0
Overexertion, travel and privation (X50–
X57) 535 1 589 1 2,741 5
Accidental exposure to other and
unspecified factors (X58–X59) 8,213 15 8,298 19 16,146 28
Total(a)
53,344 100 44,109 100 56,665 100
(a) Includes Sequelae of external causes of morbidity and mortality (Y85–Y89) (n = 110).
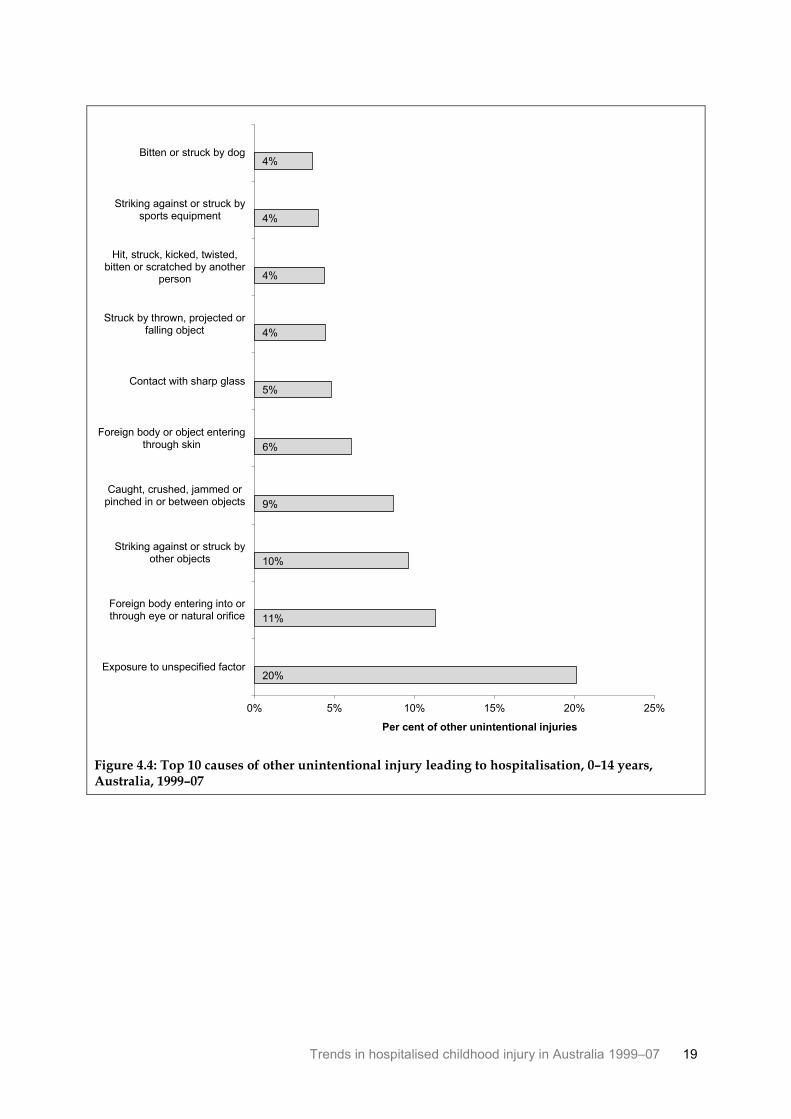
Ten types of causes accounted for 77% (n = 118,759) of all other unintentional injuries experienced by children during the reporting period (Figure 4.4). These causes were predominantly from the category Exposure to inanimate mechanical forces.
As Figure 4.4 shows, the largest proportion of cases was coded as Exposure to unspecified factors (X59). The next most common cause other unintentional injury was a Foreign body entering into or through eye or natural orifice (W44) from the Exposure to inanimate mechanical forces (W20–W49) group, accounting for 17,411 cases during the period.
Trends in hospitalised childhood injury in Australia 1999–07 19
Figure 4.4: Top 10 causes of other unintentional injury leading to hospitalisation, 0–14 years, Australia, 1999–07
20%
11%
10%
9%
6%
5%
4%
4%
4%
4%
0% 5% 10% 15% 20% 25%
Exposure to unspecified factor
Foreign body entering into orthrough eye or natural orifice
Striking against or struck byother objects
Caught, crushed, jammed orpinched in or between objects
Foreign body or object enteringthrough skin
Contact with sharp glass
Struck by thrown, projected orfalling object
Hit, struck, kicked, twisted,bitten or scratched by another
person
Striking against or struck bysports equipment
Bitten or struck by dog
Per cent of other unintentional injuries
20 Trends in hospitalised childhood injury in Australia 1999–07
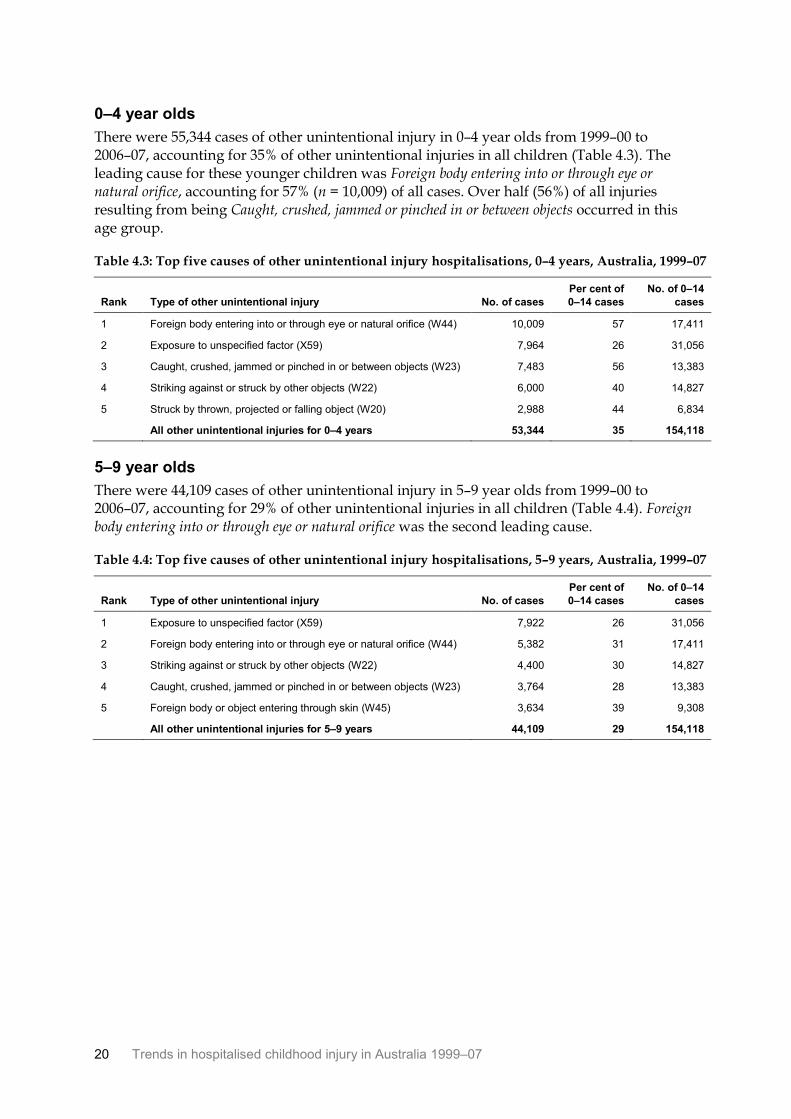
0–4 year olds
There were 55,344 cases of other unintentional injury in 0–4 year olds from 1999–00 to 2006–07, accounting for 35% of other unintentional injuries in all children (Table 4.3). The leading cause for these younger children was Foreign body entering into or through eye or natural orifice, accounting for 57% (n = 10,009) of all cases. Over half (56%) of all injuries resulting from being Caught, crushed, jammed or pinched in or between objects occurred in this age group.
Table 4.3: Top five causes of other unintentional injury hospitalisations, 0–4 years, Australia, 1999–07
Rank Type of other unintentional injury No. of cases
Per cent of
0–14 cases
No. of 0–14
cases
1 Foreign body entering into or through eye or natural orifice (W44) 10,009 57 17,411
2 Exposure to unspecified factor (X59) 7,964 26 31,056
3 Caught, crushed, jammed or pinched in or between objects (W23) 7,483 56 13,383
4 Striking against or struck by other objects (W22) 6,000 40 14,827
5 Struck by thrown, projected or falling object (W20) 2,988 44 6,834
All other unintentional injuries for 0–4 years 53,344 35 154,118
5–9 year olds
There were 44,109 cases of other unintentional injury in 5–9 year olds from 1999–00 to 2006–07, accounting for 29% of other unintentional injuries in all children (Table 4.4). Foreign body entering into or through eye or natural orifice was the second leading cause.
Table 4.4: Top five causes of other unintentional injury hospitalisations, 5–9 years, Australia, 1999–07
Rank Type of other unintentional injury No. of cases
Per cent of
0–14 cases
No. of 0–14
cases
1 Exposure to unspecified factor (X59) 7,922 26 31,056
2 Foreign body entering into or through eye or natural orifice (W44) 5,382 31 17,411
3 Striking against or struck by other objects (W22) 4,400 30 14,827
4 Caught, crushed, jammed or pinched in or between objects (W23) 3,764 28 13,383
5 Foreign body or object entering through skin (W45) 3,634 39 9,308
All other unintentional injuries for 5–9 years 44,109 29 154,118
Trends in hospitalised childhood injury in Australia 1999–07 21
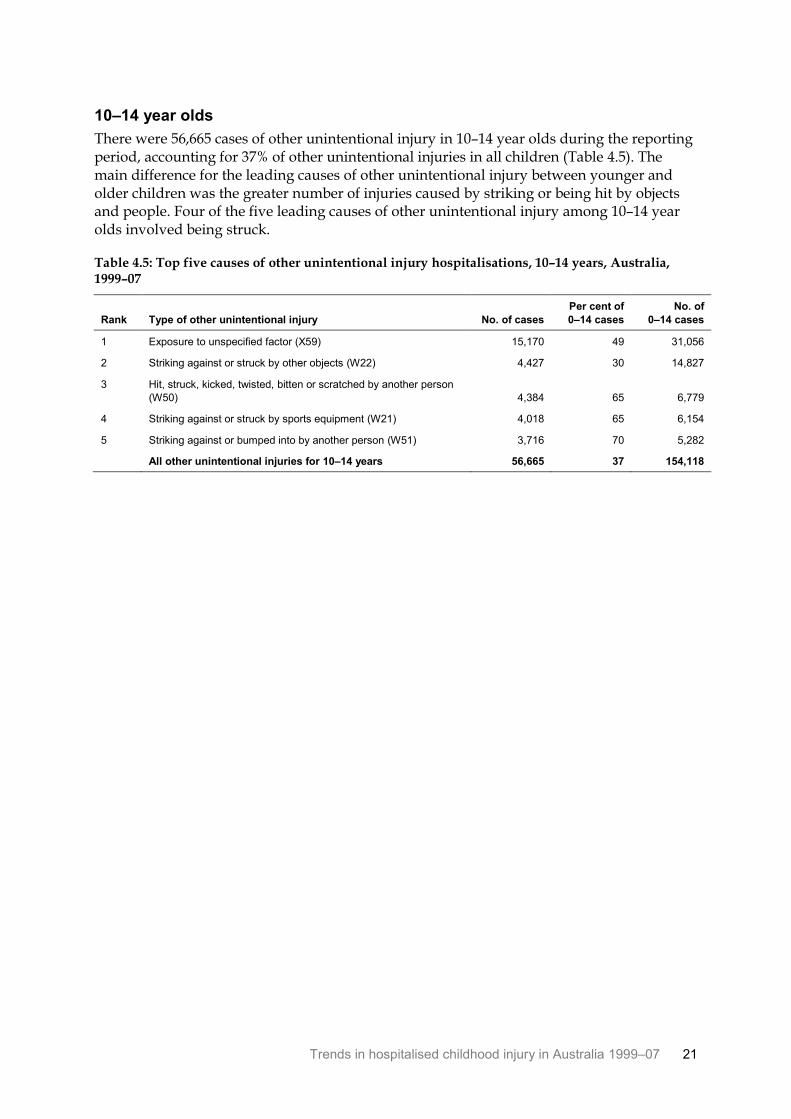
10–14 year olds
There were 56,665 cases of other unintentional injury in 10–14 year olds during the reporting period, accounting for 37% of other unintentional injuries in all children (Table 4.5). The main difference for the leading causes of other unintentional injury between younger and older children was the greater number of injuries caused by striking or being hit by objects and people. Four of the five leading causes of other unintentional injury among 10–14 year olds involved being struck.
Table 4.5: Top five causes of other unintentional injury hospitalisations, 10–14 years, Australia, 1999–07
Rank Type of other unintentional injury No. of cases
Per cent of
0–14 cases
No. of
0–14 cases
1 Exposure to unspecified factor (X59) 15,170 49 31,056
2 Striking against or struck by other objects (W22) 4,427 30 14,827
3 Hit, struck, kicked, twisted, bitten or scratched by another person
(W50) 4,384 65 6,779
4 Striking against or struck by sports equipment (W21) 4,018 65 6,154
5 Striking against or bumped into by another person (W51) 3,716 70 5,282
All other unintentional injuries for 10–14 years 56,665 37 154,118
22 Trends in hospitalised childhood injury in Australia 1999–07
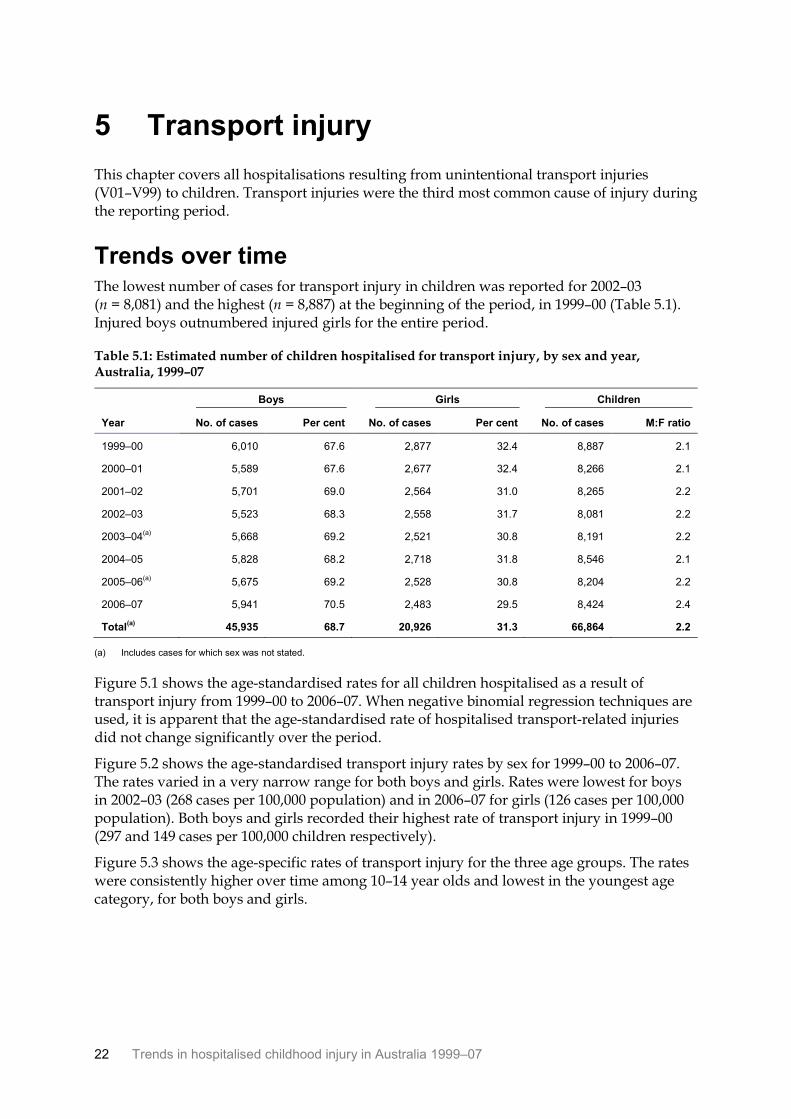
5 Transport injury
This chapter covers all hospitalisations resulting from unintentional transport injuries (V01–V99) to children. Transport injuries were the third most common cause of injury during the reporting period.
Trends over time The lowest number of cases for transport injury in children was reported for 2002–03 (n = 8,081) and the highest (n = 8,887) at the beginning of the period, in 1999–00 (Table 5.1). Injured boys outnumbered injured girls for the entire period.
Table 5.1: Estimated number of children hospitalised for transport injury, by sex and year, Australia, 1999–07
Boys Girls Children
Year No. of cases Per cent No. of cases Per cent No. of cases M:F ratio
1999–00 6,010 67.6 2,877 32.4 8,887 2.1
2000–01 5,589 67.6 2,677 32.4 8,266 2.1
2001–02 5,701 69.0 2,564 31.0 8,265 2.2
2002–03 5,523 68.3 2,558 31.7 8,081 2.2
2003–04(a)
5,668 69.2 2,521 30.8 8,191 2.2
2004–05 5,828 68.2 2,718 31.8 8,546 2.1
2005–06(a)
5,675 69.2 2,528 30.8 8,204 2.2
2006–07 5,941 70.5 2,483 29.5 8,424 2.4
Total(a)
45,935 68.7 20,926 31.3 66,864 2.2
(a) Includes cases for which sex was not stated.
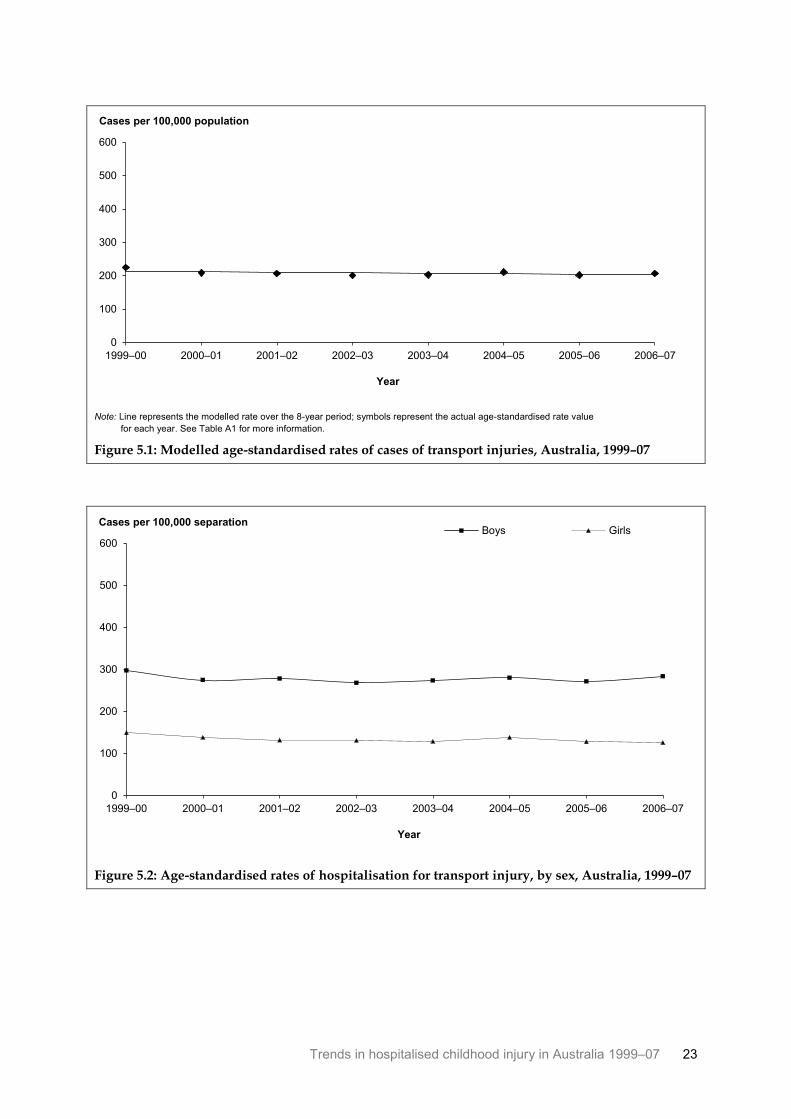
Figure 5.1 shows the age-standardised rates for all children hospitalised as a result of transport injury from 1999–00 to 2006–07. When negative binomial regression techniques are used, it is apparent that the age-standardised rate of hospitalised transport-related injuries did not change significantly over the period.
Figure 5.2 shows the age-standardised transport injury rates by sex for 1999–00 to 2006–07. The rates varied in a very narrow range for both boys and girls. Rates were lowest for boys in 2002–03 (268 cases per 100,000 population) and in 2006–07 for girls (126 cases per 100,000 population). Both boys and girls recorded their highest rate of transport injury in 1999–00 (297 and 149 cases per 100,000 children respectively).
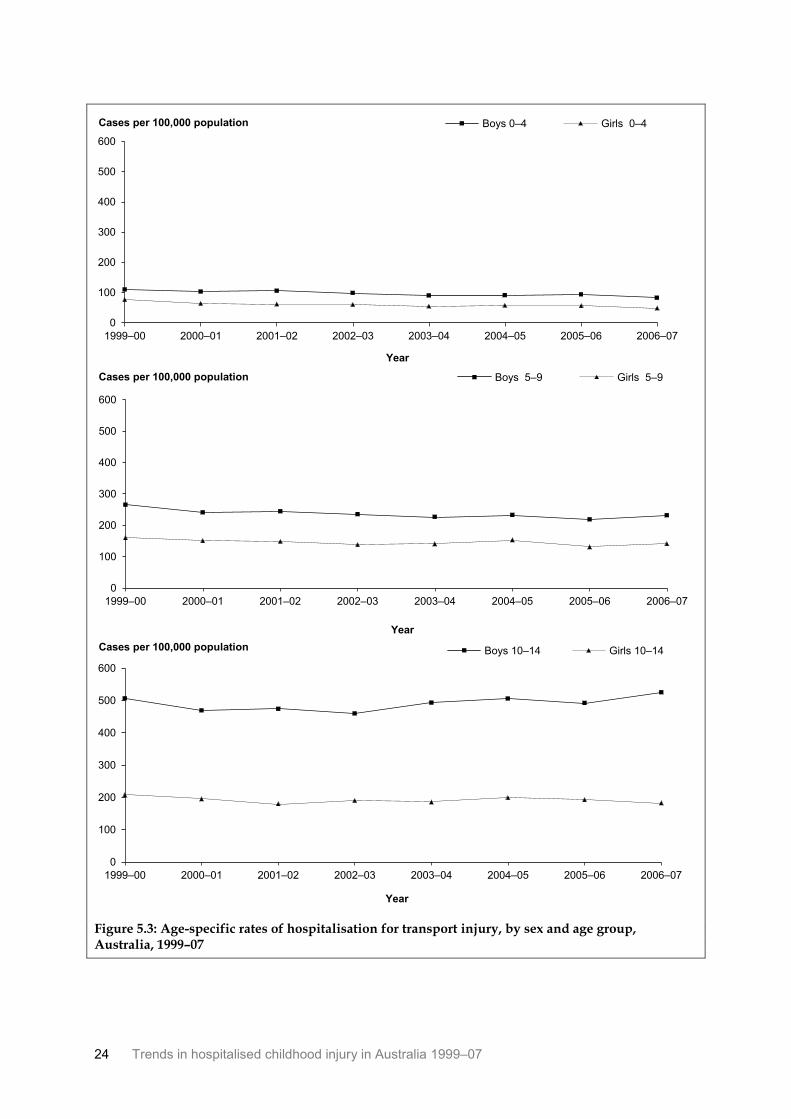
Figure 5.3 shows the age-specific rates of transport injury for the three age groups. The rates were consistently higher over time among 10–14 year olds and lowest in the youngest age category, for both boys and girls.
Trends in hospitalised childhood injury in Australia 1999–07 23
Note: Line represents the modelled rate over the 8-year period; symbols represent the actual age-standardised rate value
for each year. See Table A1 for more information.
Figure 5.1: Modelled age-standardised rates of cases of transport injuries, Australia, 1999–07
Figure 5.2: Age-standardised rates of hospitalisation for transport injury, by sex, Australia, 1999–07
0
100
200
300
400
500
600
1999–00 2000–01 2001–02 2002–03 2003–04 2004–05 2005–06 2006–07
Year
Cases per 100,000 population
0
100
200
300
400
500
600
1999–00 2000–01 2001–02 2002–03 2003–04 2004–05 2005–06 2006–07
Year
Cases per 100,000 separation Boys Girls
24 Trends in hospitalised childhood injury in Australia 1999–07
Figure 5.3: Age-specific rates of hospitalisation for transport injury, by sex and age group, Australia, 1999–07
0
100
200
300
400
500
600
1999–00 2000–01 2001–02 2002–03 2003–04 2004–05 2005–06 2006–07
Year
Cases per 100,000 population Boys 0–4 Girls 0–4
0
100
200
300
400
500
600
1999–00 2000–01 2001–02 2002–03 2003–04 2004–05 2005–06 2006–07
Year
Cases per 100,000 population Boys 5–9 Girls 5–9
0
100
200
300
400
500
600
1999–00 2000–01 2001–02 2002–03 2003–04 2004–05 2005–06 2006–07
Year
Cases per 100,000 population Boys 10–14 Girls 10–14
Trends in hospitalised childhood injury in Australia 1999–07 25
Types of transport injury Table 5.2 presents information on the injured persons mode of transport for hospitalisations due to transport injuries. For all age groups, pedal cycles were the most frequent mode of transport involved in a transport injury. In the 0–4 and 5–9 year age groups, 29% and 13% of children respectively were injured while in a car. Motorcycles were the second most common mode of transport causing transport hospitalisations in the older age group.
Table 5.2: Mode of transport for injury hospitalisations, by age group, Australia, 1999–07
0–4 5–9 10–14
Mode
No. of
cases Per cent
No. of
cases Per cent
No. of
cases Per cent
Pedestrian 1,959 24.0 2,232 10.8 2,225 5.9
Pedal cycle 2,385 29.2 9,646 46.6 17,281 45.5
Motorcycle 340 4.2 2,679 12.9 8,297 21.8
Car 2,345 28.7 2,713 13.1 3,402 9.0
Pick-up truck or van 104 1.3 135 0.7 148 0.4
Heavy transport vehicle 52 0.6 52 0.3 28 0.1
Bus 30 0.4 61 0.3 137 0.4
Animal or animal-drawn vehicle 285 3.5 1,794 8.7 3,984 10.5
Special all-terrain or off-road vehicle 94 1.2 335 1.6 645 1.7
Other land transport 228 2.8 314 1.5 445 1.2
Water transport 66 0.8 141 0.7 306 0.8
Other and unspecified transport(a)
284 3.5 615 3.0 1,077 2.8
Total 8,172 100.0 20,717 100.0 37,975 100.0
(a) Includes cases of Air and space transport accidents (n = 7).
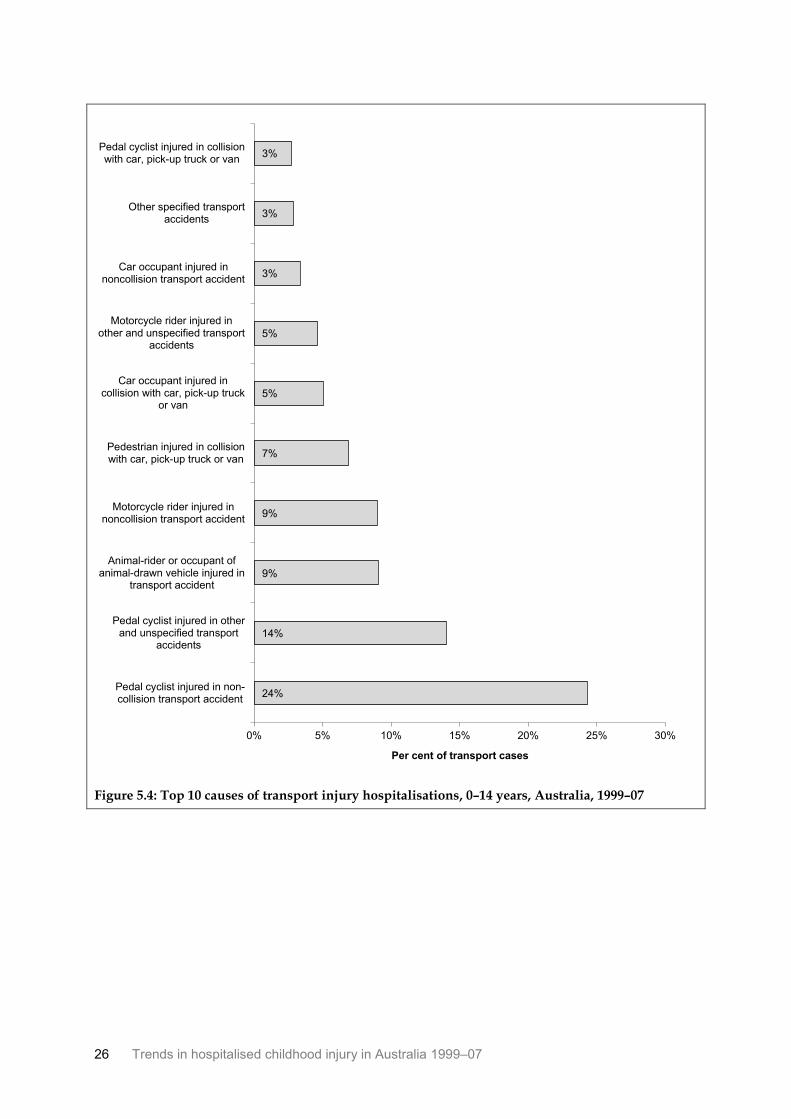
Ten types of specific transport injury accounted for 82% of all hospitalised transport injuries for children during the reporting period (n = 66,864). As Figure 5.4 shows, the largest proportions of cases were for accidents involving pedal cyclists.
26 Trends in hospitalised childhood injury in Australia 1999–07
Figure 5.4: Top 10 causes of transport injury hospitalisations, 0–14 years, Australia, 1999–07
24%
14%
9%
9%
7%
5%
5%
3%
3%
3%
0% 5% 10% 15% 20% 25% 30%
Pedal cyclist injured in non-collision transport accident
Pedal cyclist injured in otherand unspecified transport
accidents
Animal-rider or occupant ofanimal-drawn vehicle injured in
transport accident
Motorcycle rider injured innoncollision transport accident
Pedestrian injured in collisionwith car, pick-up truck or van
Car occupant injured incollision with car, pick-up truck
or van
Motorcycle rider injured inother and unspecified transport
accidents
Car occupant injured innoncollision transport accident
Other specified transportaccidents
Pedal cyclist injured in collisionwith car, pick-up truck or van
Per cent of transport cases
Trends in hospitalised childhood injury in Australia 1999–07 27
0–4 year olds
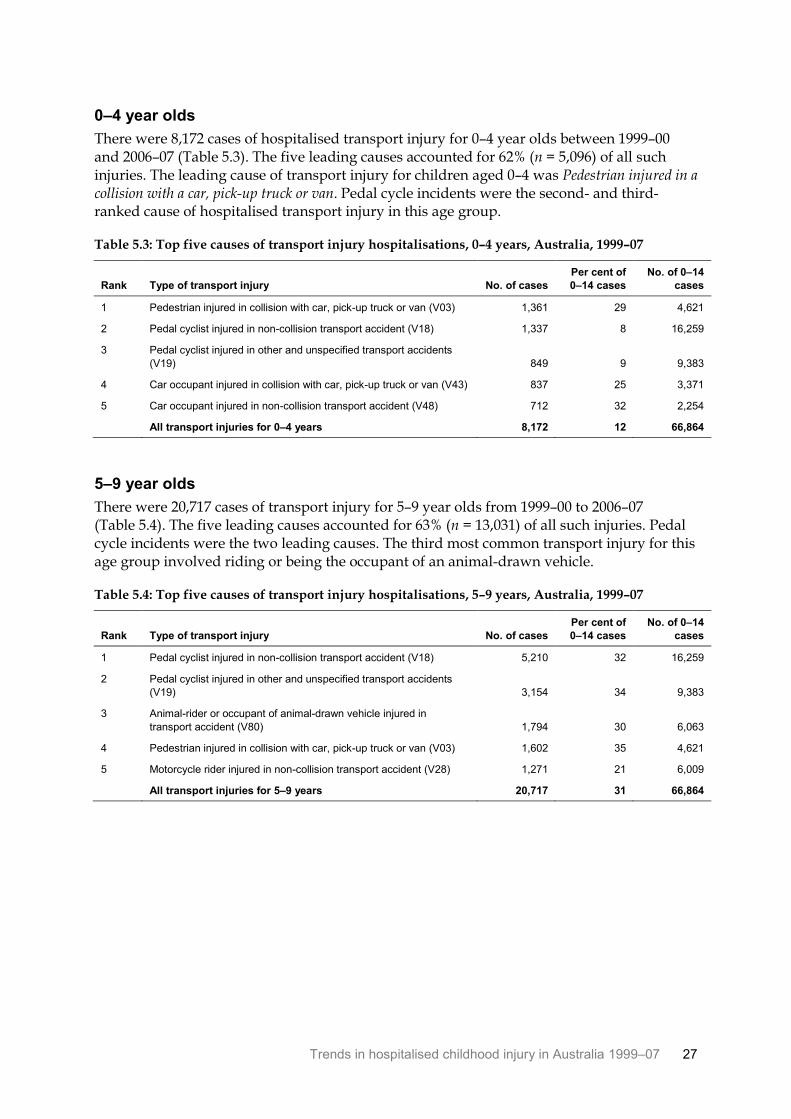
There were 8,172 cases of hospitalised transport injury for 0–4 year olds between 1999–00 and 2006–07 (Table 5.3). The five leading causes accounted for 62% (n = 5,096) of all such injuries. The leading cause of transport injury for children aged 0–4 was Pedestrian injured in a collision with a car, pick-up truck or van. Pedal cycle incidents were the second- and third-ranked cause of hospitalised transport injury in this age group.
Table 5.3: Top five causes of transport injury hospitalisations, 0–4 years, Australia, 1999–07
Rank Type of transport injury No. of cases
Per cent of
0–14 cases
No. of 0–14
cases
1 Pedestrian injured in collision with car, pick-up truck or van (V03) 1,361 29 4,621
2 Pedal cyclist injured in non-collision transport accident (V18) 1,337 8 16,259
3 Pedal cyclist injured in other and unspecified transport accidents
(V19) 849 9 9,383
4 Car occupant injured in collision with car, pick-up truck or van (V43) 837 25 3,371
5 Car occupant injured in non-collision transport accident (V48) 712 32 2,254
All transport injuries for 0–4 years 8,172 12 66,864
5–9 year olds
There were 20,717 cases of transport injury for 5–9 year olds from 1999–00 to 2006–07 (Table 5.4). The five leading causes accounted for 63% (n = 13,031) of all such injuries. Pedal cycle incidents were the two leading causes. The third most common transport injury for this age group involved riding or being the occupant of an animal-drawn vehicle.
Table 5.4: Top five causes of transport injury hospitalisations, 5–9 years, Australia, 1999–07
Rank Type of transport injury No. of cases
Per cent of
0–14 cases
No. of 0–14
cases
1 Pedal cyclist injured in non-collision transport accident (V18) 5,210 32 16,259
2 Pedal cyclist injured in other and unspecified transport accidents
(V19) 3,154 34 9,383
3 Animal-rider or occupant of animal-drawn vehicle injured in
transport accident (V80) 1,794 30 6,063
4 Pedestrian injured in collision with car, pick-up truck or van (V03) 1,602 35 4,621
5 Motorcycle rider injured in non-collision transport accident (V28) 1,271 21 6,009
All transport injuries for 5–9 years 20,717 31 66,864
28 Trends in hospitalised childhood injury in Australia 1999–07
10–14 year olds
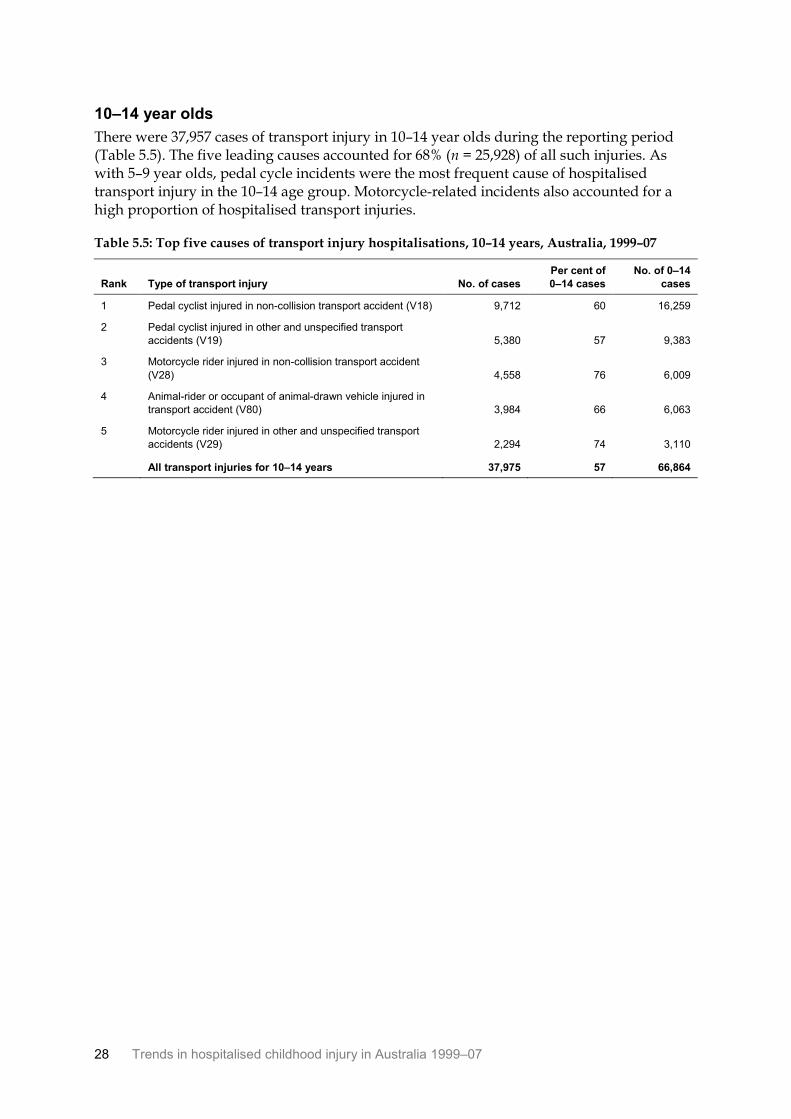
There were 37,957 cases of transport injury in 10–14 year olds during the reporting period (Table 5.5). The five leading causes accounted for 68% (n = 25,928) of all such injuries. As with 5–9 year olds, pedal cycle incidents were the most frequent cause of hospitalised transport injury in the 10–14 age group. Motorcycle-related incidents also accounted for a high proportion of hospitalised transport injuries.
Table 5.5: Top five causes of transport injury hospitalisations, 10–14 years, Australia, 1999–07
Rank Type of transport injury No. of cases
Per cent of
0–14 cases
No. of 0–14
cases
1 Pedal cyclist injured in non-collision transport accident (V18) 9,712 60 16,259
2 Pedal cyclist injured in other and unspecified transport
accidents (V19) 5,380 57 9,383
3 Motorcycle rider injured in non-collision transport accident
(V28) 4,558 76 6,009
4 Animal-rider or occupant of animal-drawn vehicle injured in
transport accident (V80) 3,984 66 6,063
5 Motorcycle rider injured in other and unspecified transport
accidents (V29) 2,294 74 3,110
All transport injuries for 10–14 years 37,975 57 66,864
Trends in hospitalised childhood injury in Australia 1999–07 29
6 Poisoning by pharmaceuticals
This chapter describes injury admissions where the first reported external cause code refers to accidental poisoning by a drug or medicament (X40–X44). It includes drugs given or taken in error or inadvertently and accidental overdosage. The substances included in this category are listed in Appendix A.
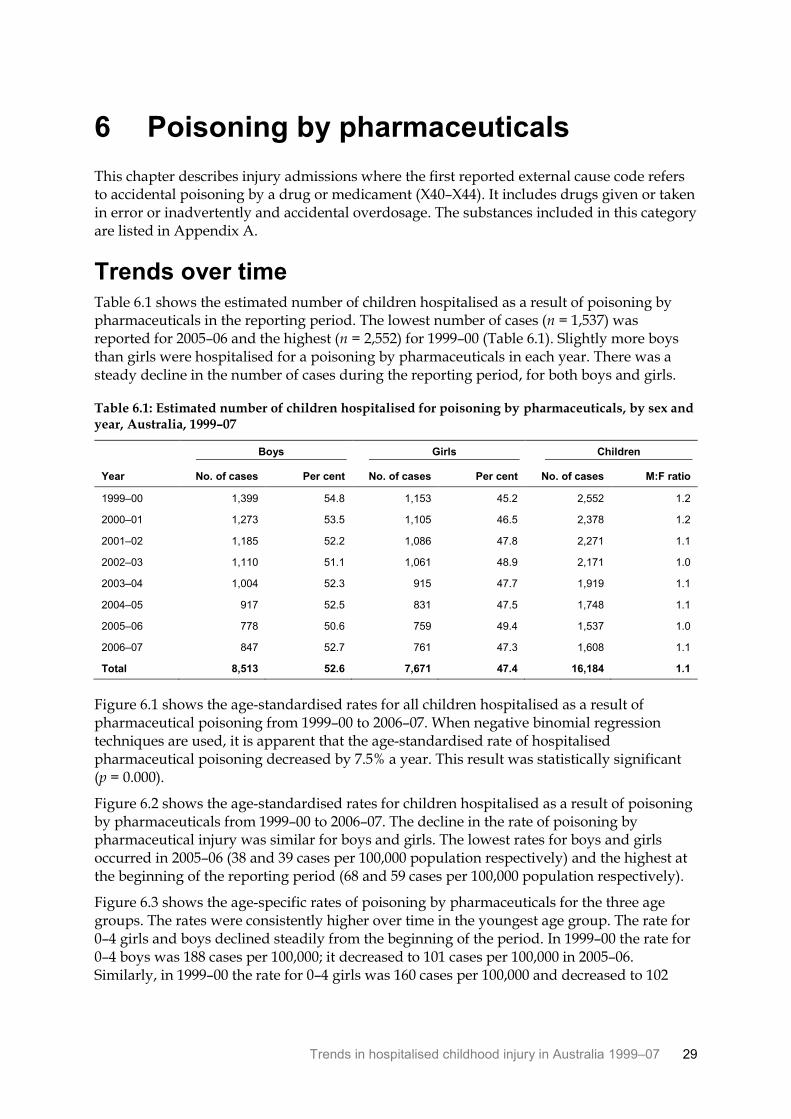
Trends over time Table 6.1 shows the estimated number of children hospitalised as a result of poisoning by pharmaceuticals in the reporting period. The lowest number of cases (n = 1,537) was reported for 2005–06 and the highest (n = 2,552) for 1999–00 (Table 6.1). Slightly more boys than girls were hospitalised for a poisoning by pharmaceuticals in each year. There was a steady decline in the number of cases during the reporting period, for both boys and girls.
Table 6.1: Estimated number of children hospitalised for poisoning by pharmaceuticals, by sex and year, Australia, 1999–07
Boys Girls Children
Year No. of cases Per cent No. of cases Per cent No. of cases M:F ratio
1999–00 1,399 54.8 1,153 45.2 2,552 1.2
2000–01 1,273 53.5 1,105 46.5 2,378 1.2
2001–02 1,185 52.2 1,086 47.8 2,271 1.1
2002–03 1,110 51.1 1,061 48.9 2,171 1.0
2003–04 1,004 52.3 915 47.7 1,919 1.1
2004–05 917 52.5 831 47.5 1,748 1.1
2005–06 778 50.6 759 49.4 1,537 1.0
2006–07 847 52.7 761 47.3 1,608 1.1
Total 8,513 52.6 7,671 47.4 16,184 1.1
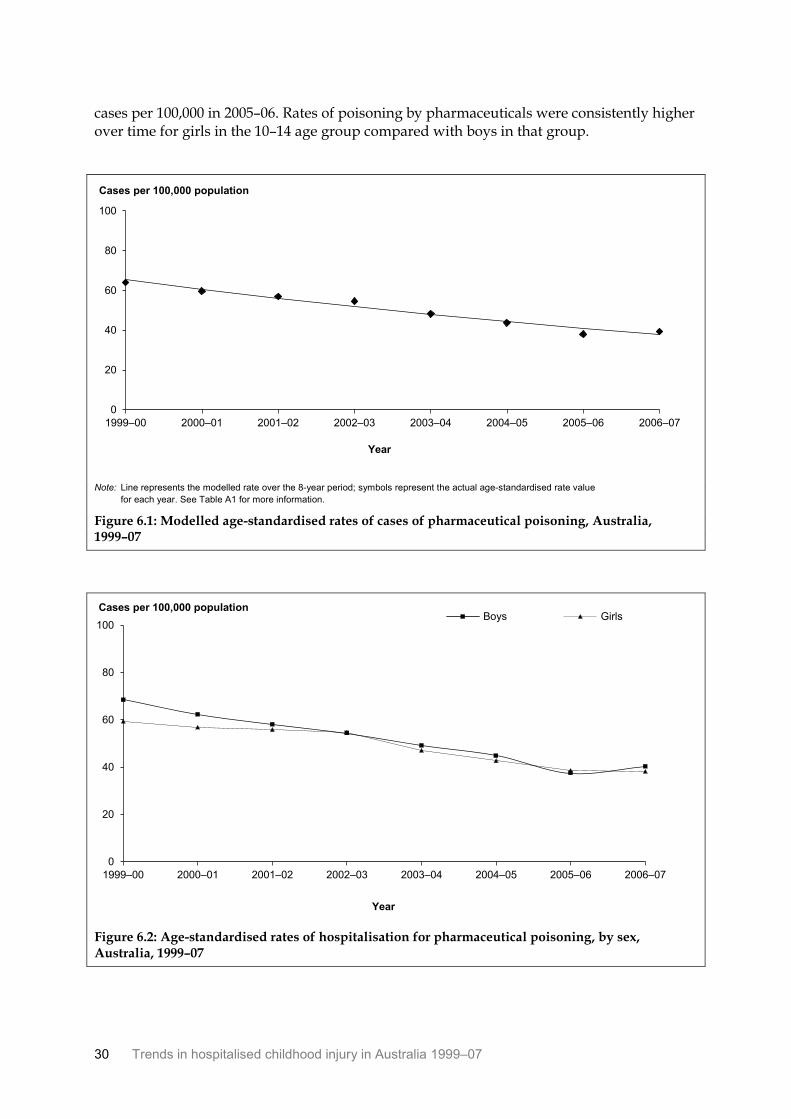
Figure 6.1 shows the age-standardised rates for all children hospitalised as a result of pharmaceutical poisoning from 1999–00 to 2006–07. When negative binomial regression techniques are used, it is apparent that the age-standardised rate of hospitalised pharmaceutical poisoning decreased by 7.5% a year. This result was statistically significant (p = 0.000).
Figure 6.2 shows the age-standardised rates for children hospitalised as a result of poisoning by pharmaceuticals from 1999–00 to 2006–07. The decline in the rate of poisoning by pharmaceutical injury was similar for boys and girls. The lowest rates for boys and girls occurred in 2005–06 (38 and 39 cases per 100,000 population respectively) and the highest at the beginning of the reporting period (68 and 59 cases per 100,000 population respectively).
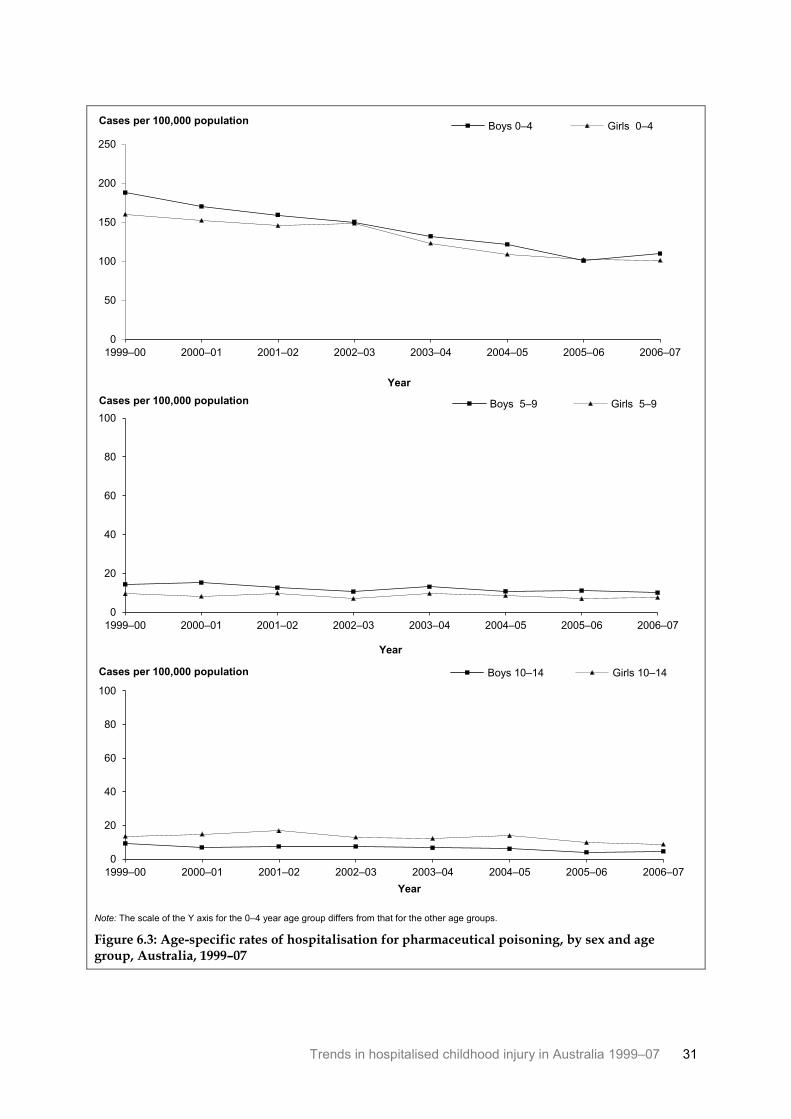
Figure 6.3 shows the age-specific rates of poisoning by pharmaceuticals for the three age groups. The rates were consistently higher over time in the youngest age group. The rate for 0–4 girls and boys declined steadily from the beginning of the period. In 1999–00 the rate for 0–4 boys was 188 cases per 100,000; it decreased to 101 cases per 100,000 in 2005–06. Similarly, in 1999–00 the rate for 0–4 girls was 160 cases per 100,000 and decreased to 102
30 Trends in hospitalised childhood injury in Australia 1999–07
cases per 100,000 in 2005–06. Rates of poisoning by pharmaceuticals were consistently higher over time for girls in the 10–14 age group compared with boys in that group.
Note: Line represents the modelled rate over the 8-year period; symbols represent the actual age-standardised rate value
for each year. See Table A1 for more information.
Figure 6.1: Modelled age-standardised rates of cases of pharmaceutical poisoning, Australia, 1999–07
Figure 6.2: Age-standardised rates of hospitalisation for pharmaceutical poisoning, by sex, Australia, 1999–07
0
20
40
60
80
100
1999–00 2000–01 2001–02 2002–03 2003–04 2004–05 2005–06 2006–07
Year
Cases per 100,000 population
0
20
40
60
80
100
1999–00 2000–01 2001–02 2002–03 2003–04 2004–05 2005–06 2006–07
Year
Cases per 100,000 population Boys Girls
Trends in hospitalised childhood injury in Australia 1999–07 31
Note: The scale of the Y axis for the 0–4 year age group differs from that for the other age groups.
Figure 6.3: Age-specific rates of hospitalisation for pharmaceutical poisoning, by sex and age group, Australia, 1999–07
0
50
100
150
200
250
1999–00 2000–01 2001–02 2002–03 2003–04 2004–05 2005–06 2006–07
Year
Cases per 100,000 population Boys 0–4 Girls 0–4
0
20
40
60
80
100
1999–00 2000–01 2001–02 2002–03 2003–04 2004–05 2005–06 2006–07
Year
Cases per 100,000 population Boys 5–9 Girls 5–9
0
20
40
60
80
100
1999–00 2000–01 2001–02 2002–03 2003–04 2004–05 2005–06 2006–07
Year
Cases per 100,000 population Boys 10–14 Girls 10–14
32 Trends in hospitalised childhood injury in Australia 1999–07
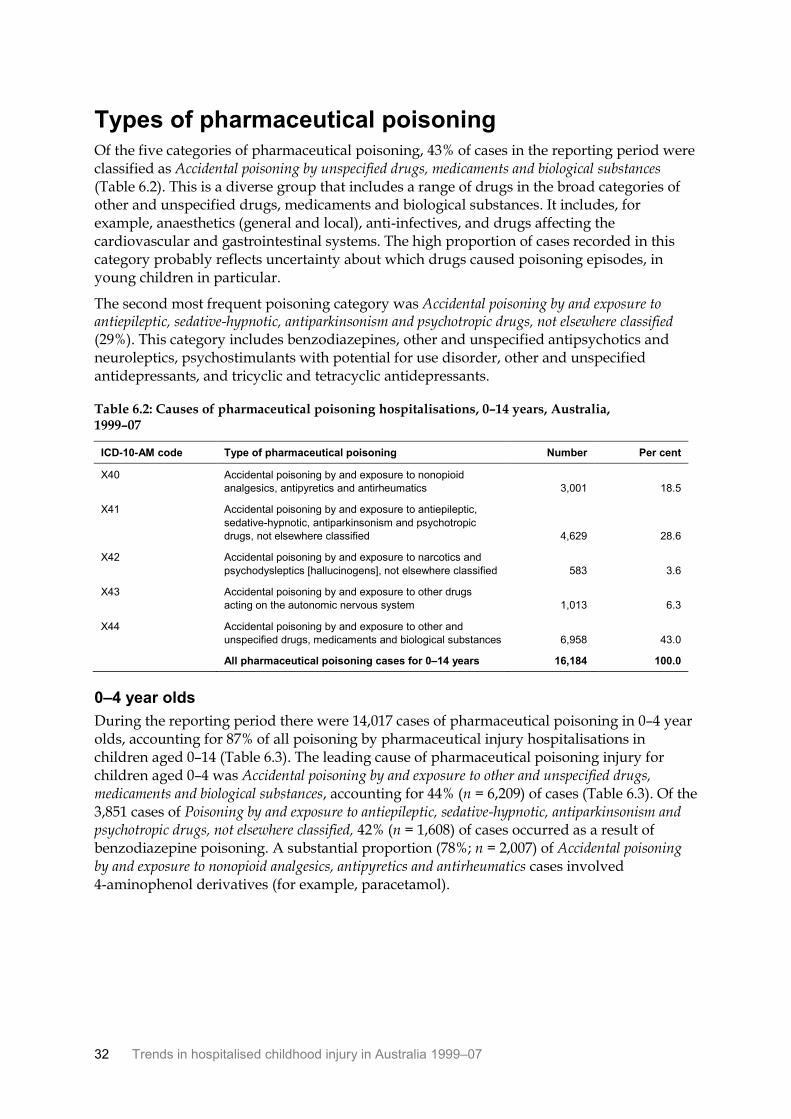
Types of pharmaceutical poisoning Of the five categories of pharmaceutical poisoning, 43% of cases in the reporting period were classified as Accidental poisoning by unspecified drugs, medicaments and biological substances (Table 6.2). This is a diverse group that includes a range of drugs in the broad categories of other and unspecified drugs, medicaments and biological substances. It includes, for example, anaesthetics (general and local), anti-infectives, and drugs affecting the cardiovascular and gastrointestinal systems. The high proportion of cases recorded in this category probably reflects uncertainty about which drugs caused poisoning episodes, in young children in particular.
The second most frequent poisoning category was Accidental poisoning by and exposure to antiepileptic, sedative-hypnotic, antiparkinsonism and psychotropic drugs, not elsewhere classified (29%). This category includes benzodiazepines, other and unspecified antipsychotics and neuroleptics, psychostimulants with potential for use disorder, other and unspecified antidepressants, and tricyclic and tetracyclic antidepressants.
Table 6.2: Causes of pharmaceutical poisoning hospitalisations, 0–14 years, Australia, 1999–07
ICD-10-AM code Type of pharmaceutical poisoning Number Per cent
X40 Accidental poisoning by and exposure to nonopioid
analgesics, antipyretics and antirheumatics 3,001 18.5
X41 Accidental poisoning by and exposure to antiepileptic,
sedative-hypnotic, antiparkinsonism and psychotropic
drugs, not elsewhere classified 4,629 28.6
X42 Accidental poisoning by and exposure to narcotics and
psychodysleptics [hallucinogens], not elsewhere classified 583 3.6
X43 Accidental poisoning by and exposure to other drugs
acting on the autonomic nervous system 1,013 6.3
X44 Accidental poisoning by and exposure to other and
unspecified drugs, medicaments and biological substances 6,958 43.0
All pharmaceutical poisoning cases for 0–14 years 16,184 100.0
0–4 year olds
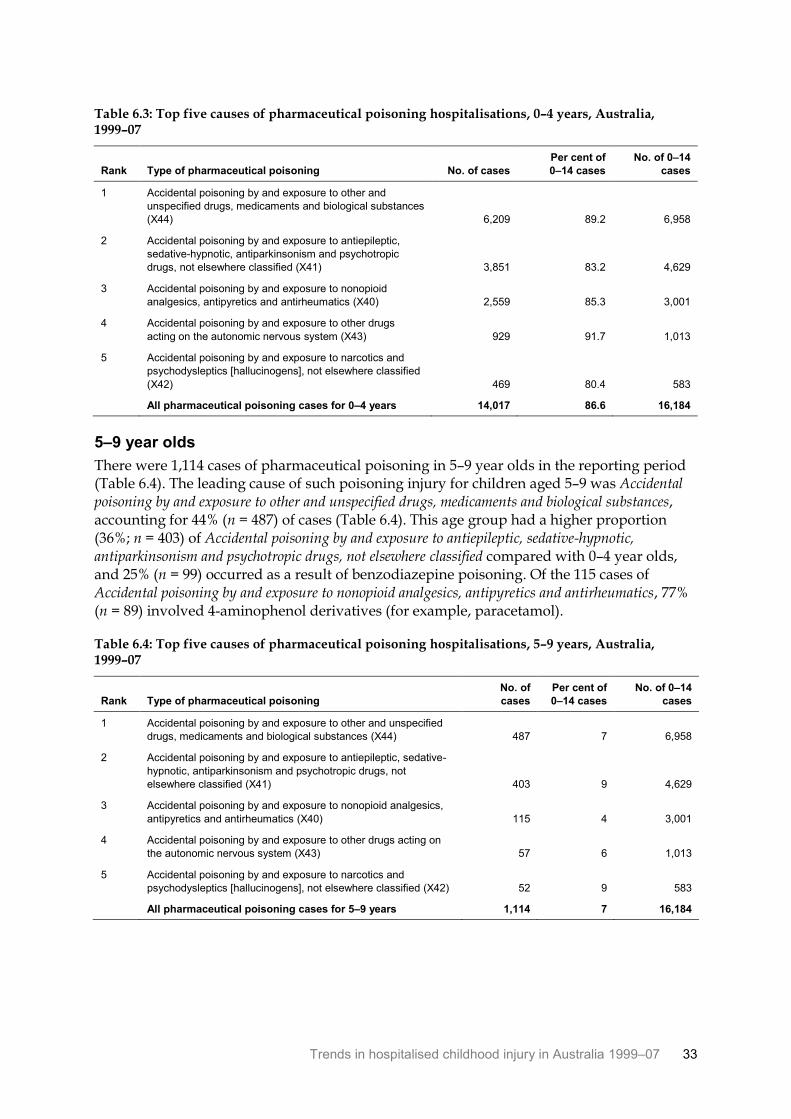
During the reporting period there were 14,017 cases of pharmaceutical poisoning in 0–4 year olds, accounting for 87% of all poisoning by pharmaceutical injury hospitalisations in children aged 0–14 (Table 6.3). The leading cause of pharmaceutical poisoning injury for children aged 0–4 was Accidental poisoning by and exposure to other and unspecified drugs, medicaments and biological substances, accounting for 44% (n = 6,209) of cases (Table 6.3). Of the 3,851 cases of Poisoning by and exposure to antiepileptic, sedative-hypnotic, antiparkinsonism and psychotropic drugs, not elsewhere classified, 42% (n = 1,608) of cases occurred as a result of benzodiazepine poisoning. A substantial proportion (78%; n = 2,007) of Accidental poisoning by and exposure to nonopioid analgesics, antipyretics and antirheumatics cases involved 4-aminophenol derivatives (for example, paracetamol).
Trends in hospitalised childhood injury in Australia 1999–07 33
Table 6.3: Top five causes of pharmaceutical poisoning hospitalisations, 0–4 years, Australia, 1999–07
Rank Type of pharmaceutical poisoning No. of cases
Per cent of
0–14 cases
No. of 0–14
cases
1 Accidental poisoning by and exposure to other and
unspecified drugs, medicaments and biological substances
(X44) 6,209 89.2 6,958
2 Accidental poisoning by and exposure to antiepileptic,
sedative-hypnotic, antiparkinsonism and psychotropic
drugs, not elsewhere classified (X41) 3,851 83.2 4,629
3 Accidental poisoning by and exposure to nonopioid
analgesics, antipyretics and antirheumatics (X40) 2,559 85.3 3,001
4 Accidental poisoning by and exposure to other drugs
acting on the autonomic nervous system (X43) 929 91.7 1,013
5 Accidental poisoning by and exposure to narcotics and
psychodysleptics [hallucinogens], not elsewhere classified
(X42) 469 80.4 583
All pharmaceutical poisoning cases for 0–4 years 14,017 86.6 16,184
5–9 year olds
There were 1,114 cases of pharmaceutical poisoning in 5–9 year olds in the reporting period (Table 6.4). The leading cause of such poisoning injury for children aged 5–9 was Accidental poisoning by and exposure to other and unspecified drugs, medicaments and biological substances, accounting for 44% (n = 487) of cases (Table 6.4). This age group had a higher proportion (36%; n = 403) of Accidental poisoning by and exposure to antiepileptic, sedative-hypnotic, antiparkinsonism and psychotropic drugs, not elsewhere classified compared with 0–4 year olds, and 25% (n = 99) occurred as a result of benzodiazepine poisoning. Of the 115 cases of Accidental poisoning by and exposure to nonopioid analgesics, antipyretics and antirheumatics, 77% (n = 89) involved 4-aminophenol derivatives (for example, paracetamol).
Table 6.4: Top five causes of pharmaceutical poisoning hospitalisations, 5–9 years, Australia, 1999–07
Rank Type of pharmaceutical poisoning
No. of
cases
Per cent of
0–14 cases
No. of 0–14
cases
1 Accidental poisoning by and exposure to other and unspecified
drugs, medicaments and biological substances (X44) 487 7 6,958
2 Accidental poisoning by and exposure to antiepileptic, sedative-
hypnotic, antiparkinsonism and psychotropic drugs, not
elsewhere classified (X41) 403 9 4,629
3 Accidental poisoning by and exposure to nonopioid analgesics,
antipyretics and antirheumatics (X40) 115 4 3,001
4 Accidental poisoning by and exposure to other drugs acting on
the autonomic nervous system (X43) 57 6 1,013
5 Accidental poisoning by and exposure to narcotics and
psychodysleptics [hallucinogens], not elsewhere classified (X42) 52 9 583
All pharmaceutical poisoning cases for 5–9 years 1,114 7 16,184
34 Trends in hospitalised childhood injury in Australia 1999–07
10–14 year olds
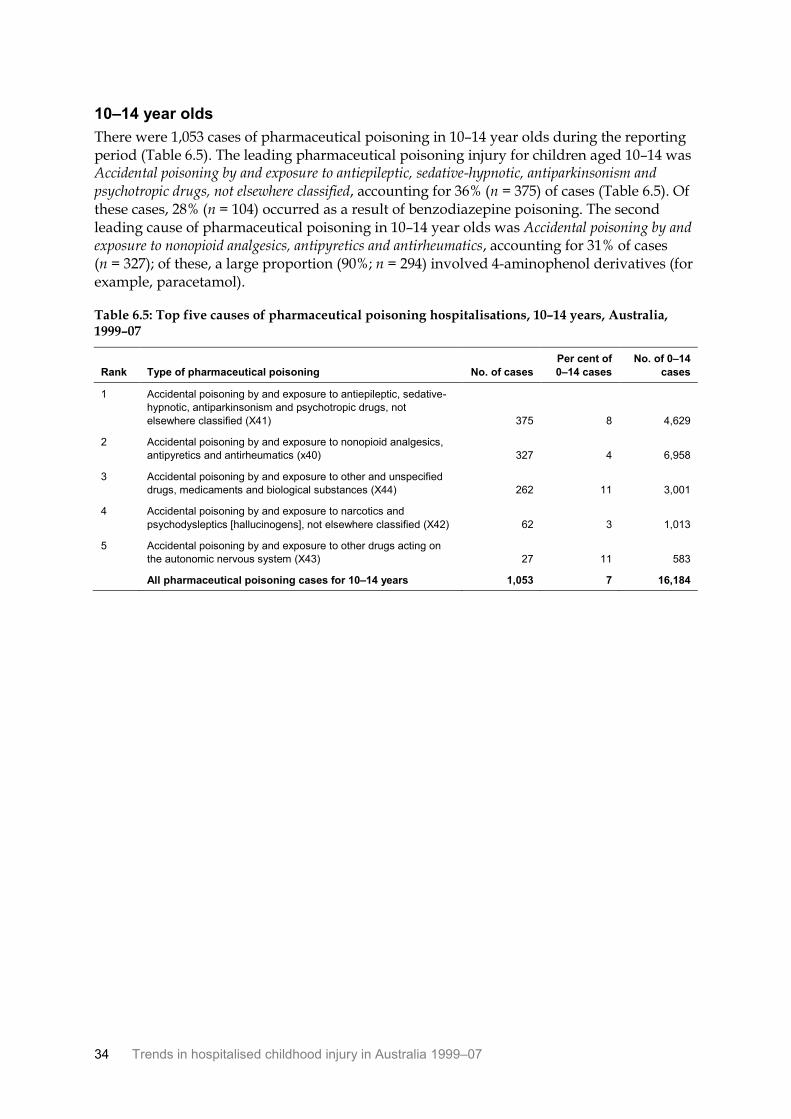
There were 1,053 cases of pharmaceutical poisoning in 10–14 year olds during the reporting period (Table 6.5). The leading pharmaceutical poisoning injury for children aged 10–14 was Accidental poisoning by and exposure to antiepileptic, sedative-hypnotic, antiparkinsonism and psychotropic drugs, not elsewhere classified, accounting for 36% (n = 375) of cases (Table 6.5). Of these cases, 28% (n = 104) occurred as a result of benzodiazepine poisoning. The second leading cause of pharmaceutical poisoning in 10–14 year olds was Accidental poisoning by and exposure to nonopioid analgesics, antipyretics and antirheumatics, accounting for 31% of cases (n = 327); of these, a large proportion (90%; n = 294) involved 4-aminophenol derivatives (for example, paracetamol).
Table 6.5: Top five causes of pharmaceutical poisoning hospitalisations, 10–14 years, Australia, 1999–07
Rank Type of pharmaceutical poisoning No. of cases
Per cent of
0–14 cases
No. of 0–14
cases
1 Accidental poisoning by and exposure to antiepileptic, sedative-
hypnotic, antiparkinsonism and psychotropic drugs, not
elsewhere classified (X41) 375 8 4,629
2 Accidental poisoning by and exposure to nonopioid analgesics,
antipyretics and antirheumatics (x40) 327 4 6,958
3 Accidental poisoning by and exposure to other and unspecified
drugs, medicaments and biological substances (X44) 262 11 3,001
4 Accidental poisoning by and exposure to narcotics and
psychodysleptics [hallucinogens], not elsewhere classified (X42) 62 3 1,013
5 Accidental poisoning by and exposure to other drugs acting on
the autonomic nervous system (X43) 27 11 583
All pharmaceutical poisoning cases for 10–14 years 1,053 7 16,184
Trends in hospitalised childhood injury in Australia 1999–07 35
7 Smoke, fire, heat and hot substances
This chapter deals with injury cases in which the first reported external cause was unintentional Exposure to smoke, fire and flames (X00–X09) or Contact with heat and hot substances (X10–X19).
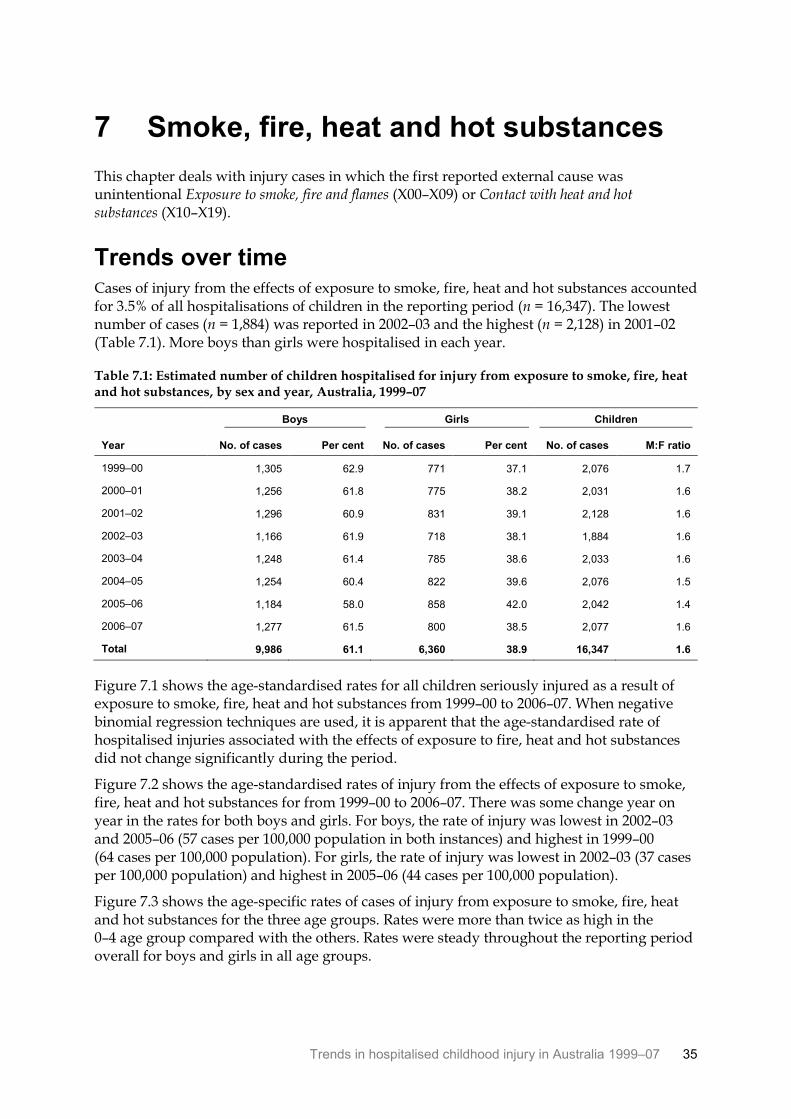
Trends over time Cases of injury from the effects of exposure to smoke, fire, heat and hot substances accounted for 3.5% of all hospitalisations of children in the reporting period (n = 16,347). The lowest number of cases (n = 1,884) was reported in 2002–03 and the highest (n = 2,128) in 2001–02 (Table 7.1). More boys than girls were hospitalised in each year.
Table 7.1: Estimated number of children hospitalised for injury from exposure to smoke, fire, heat and hot substances, by sex and year, Australia, 1999–07
Year
Boys Girls Children
No. of cases Per cent No. of cases Per cent No. of cases M:F ratio
1999–00 1,305 62.9 771 37.1 2,076 1.7
2000–01 1,256 61.8 775 38.2 2,031 1.6
2001–02 1,296 60.9 831 39.1 2,128 1.6
2002–03 1,166 61.9 718 38.1 1,884 1.6
2003–04 1,248 61.4 785 38.6 2,033 1.6
2004–05 1,254 60.4 822 39.6 2,076 1.5
2005–06 1,184 58.0 858 42.0 2,042 1.4
2006–07 1,277 61.5 800 38.5 2,077 1.6
Total 9,986 61.1 6,360 38.9 16,347 1.6
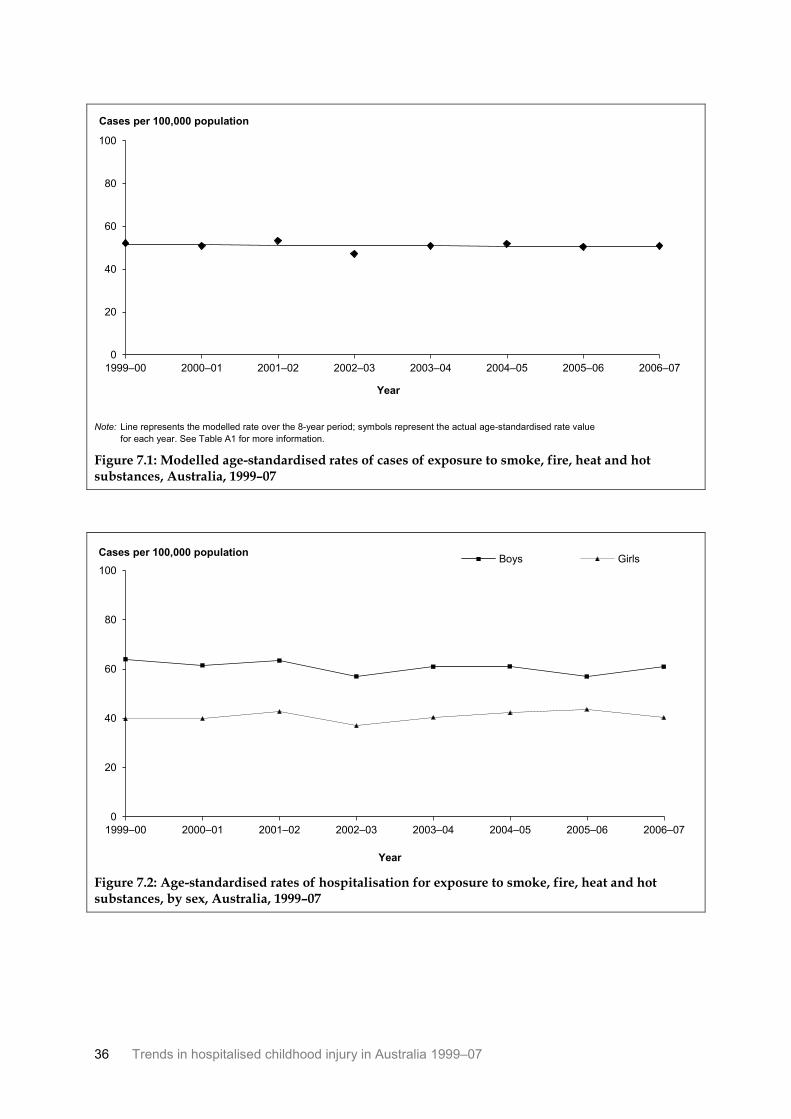
Figure 7.1 shows the age-standardised rates for all children seriously injured as a result of exposure to smoke, fire, heat and hot substances from 1999–00 to 2006–07. When negative binomial regression techniques are used, it is apparent that the age-standardised rate of hospitalised injuries associated with the effects of exposure to fire, heat and hot substances did not change significantly during the period.
Figure 7.2 shows the age-standardised rates of injury from the effects of exposure to smoke, fire, heat and hot substances for from 1999–00 to 2006–07. There was some change year on year in the rates for both boys and girls. For boys, the rate of injury was lowest in 2002–03 and 2005–06 (57 cases per 100,000 population in both instances) and highest in 1999–00 (64 cases per 100,000 population). For girls, the rate of injury was lowest in 2002–03 (37 cases per 100,000 population) and highest in 2005–06 (44 cases per 100,000 population).
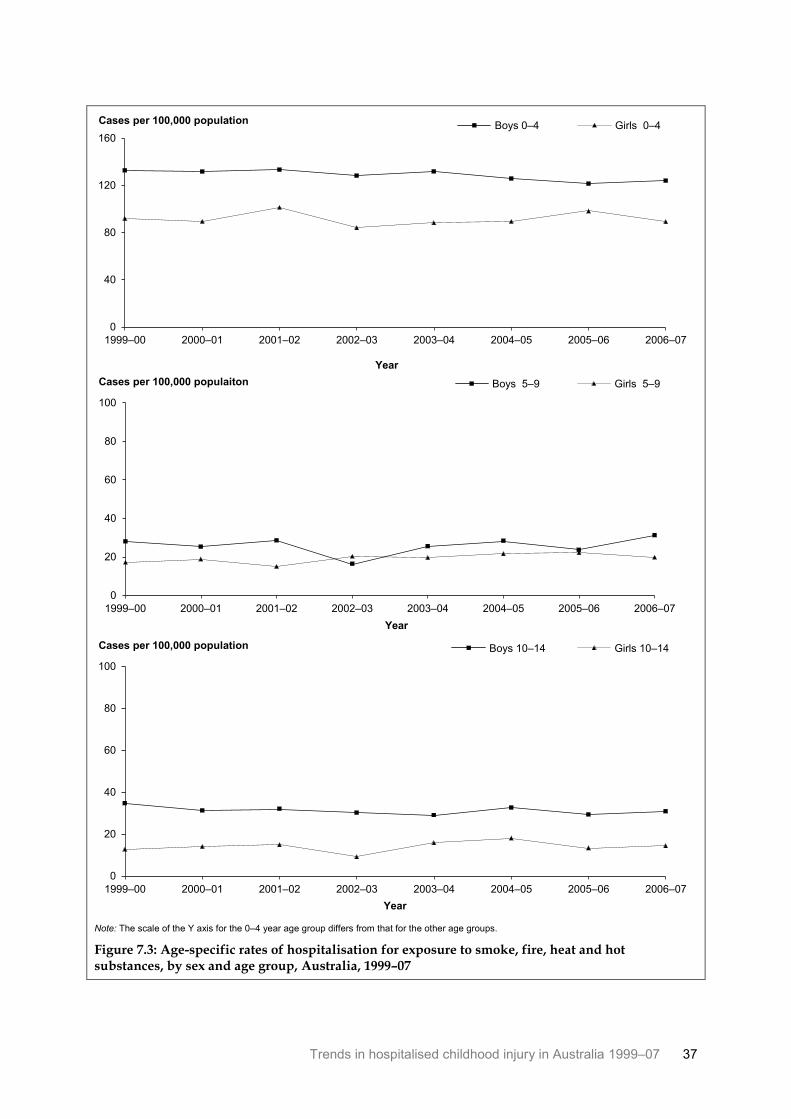
Figure 7.3 shows the age-specific rates of cases of injury from exposure to smoke, fire, heat and hot substances for the three age groups. Rates were more than twice as high in the 0–4 age group compared with the others. Rates were steady throughout the reporting period overall for boys and girls in all age groups.
36 Trends in hospitalised childhood injury in Australia 1999–07
Note: Line represents the modelled rate over the 8-year period; symbols represent the actual age-standardised rate value
for each year. See Table A1 for more information.
Figure 7.1: Modelled age-standardised rates of cases of exposure to smoke, fire, heat and hot substances, Australia, 1999–07
Figure 7.2: Age-standardised rates of hospitalisation for exposure to smoke, fire, heat and hot substances, by sex, Australia, 1999–07
0
20
40
60
80
100
1999–00 2000–01 2001–02 2002–03 2003–04 2004–05 2005–06 2006–07
Year
Cases per 100,000 population
0
20
40
60
80
100
1999–00 2000–01 2001–02 2002–03 2003–04 2004–05 2005–06 2006–07
Year
Cases per 100,000 population Boys Girls
Trends in hospitalised childhood injury in Australia 1999–07 37
Note: The scale of the Y axis for the 0–4 year age group differs from that for the other age groups.
Figure 7.3: Age-specific rates of hospitalisation for exposure to smoke, fire, heat and hot substances, by sex and age group, Australia, 1999–07
0
40
80
120
160
1999–00 2000–01 2001–02 2002–03 2003–04 2004–05 2005–06 2006–07
Year
Cases per 100,000 population Boys 0–4 Girls 0–4
0
20
40
60
80
100
1999–00 2000–01 2001–02 2002–03 2003–04 2004–05 2005–06 2006–07
Year
Cases per 100,000 populaiton Boys 5–9 Girls 5–9
0
20
40
60
80
100
1999–00 2000–01 2001–02 2002–03 2003–04 2004–05 2005–06 2006–07
Year
Cases per 100,000 population Boys 10–14 Girls 10–14
38 Trends in hospitalised childhood injury in Australia 1999–07
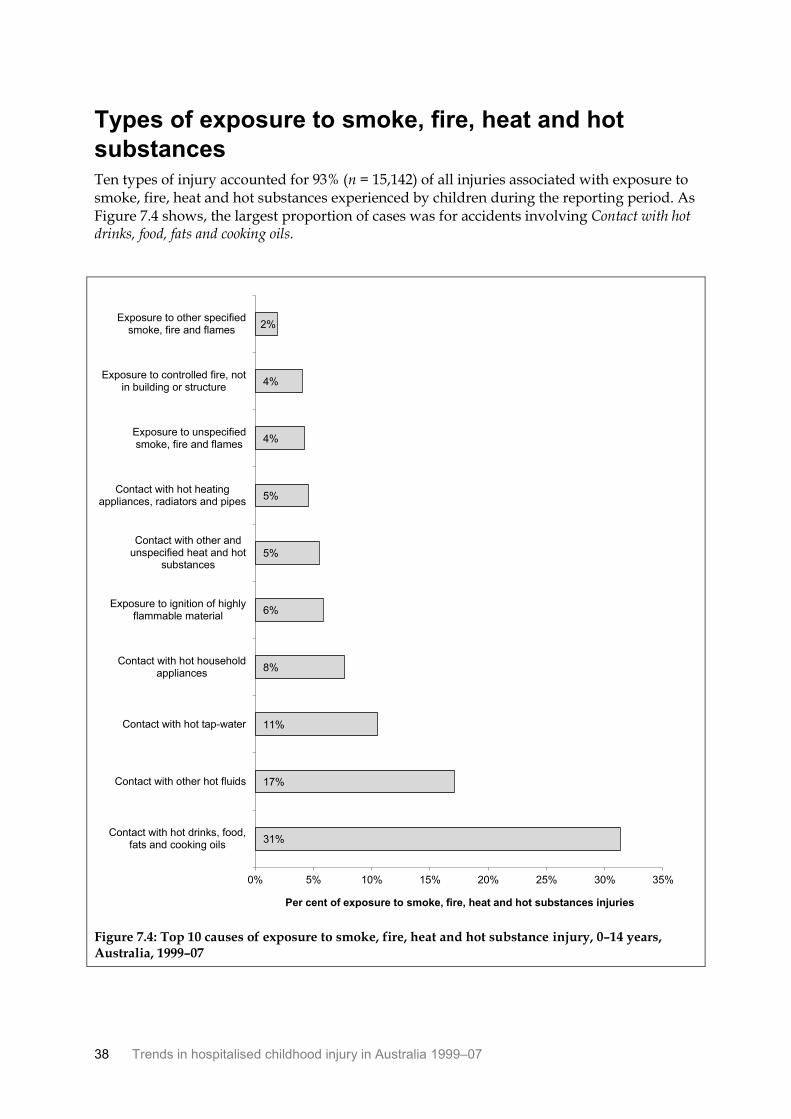
Types of exposure to smoke, fire, heat and hot
substances Ten types of injury accounted for 93% (n = 15,142) of all injuries associated with exposure to smoke, fire, heat and hot substances experienced by children during the reporting period. As Figure 7.4 shows, the largest proportion of cases was for accidents involving Contact with hot drinks, food, fats and cooking oils.
Figure 7.4: Top 10 causes of exposure to smoke, fire, heat and hot substance injury, 0–14 years, Australia, 1999–07
31%
17%
11%
8%
6%
5%
5%
4%
4%
2%
0% 5% 10% 15% 20% 25% 30% 35%
Contact with hot drinks, food,fats and cooking oils
Contact with other hot fluids
Contact with hot tap-water
Contact with hot householdappliances
Exposure to ignition of highlyflammable material
Contact with other andunspecified heat and hot
substances
Contact with hot heatingappliances, radiators and pipes
Exposure to unspecifiedsmoke, fire and flames
Exposure to controlled fire, notin building or structure
Exposure to other specifiedsmoke, fire and flames
Per cent of exposure to smoke, fire, heat and hot substances injuries
Trends in hospitalised childhood injury in Australia 1999–07 39
0–4 year olds
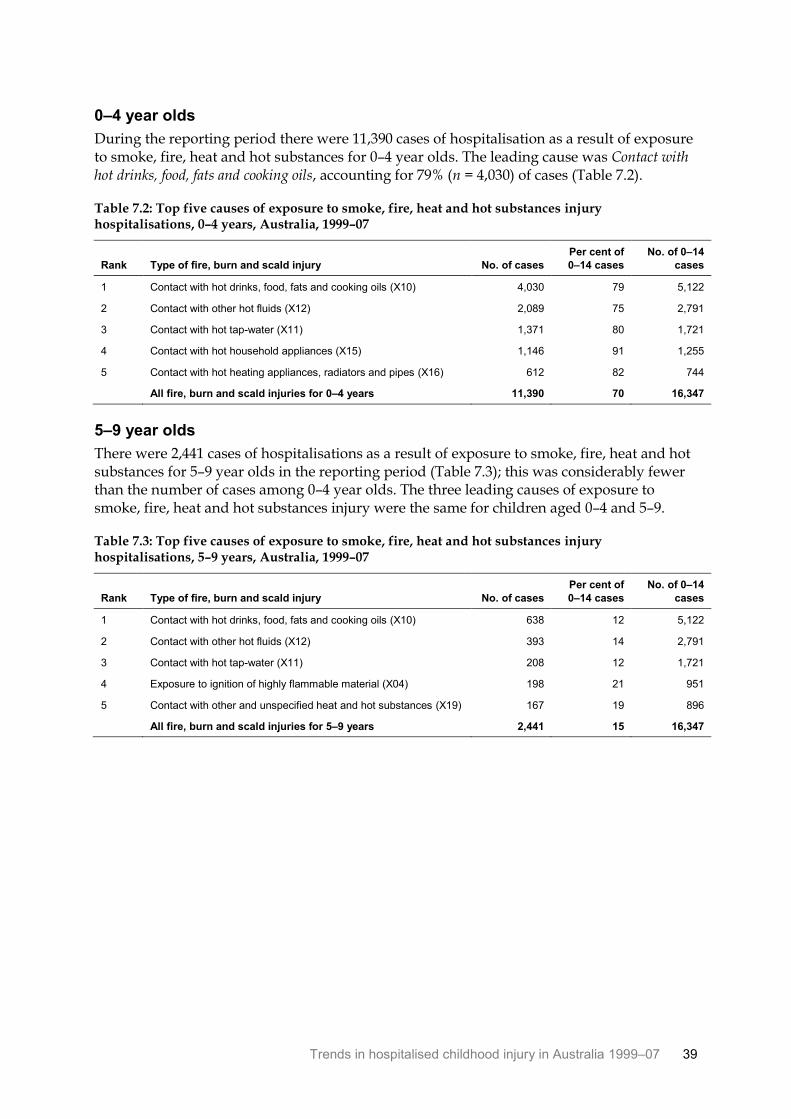
During the reporting period there were 11,390 cases of hospitalisation as a result of exposure to smoke, fire, heat and hot substances for 0–4 year olds. The leading cause was Contact with hot drinks, food, fats and cooking oils, accounting for 79% (n = 4,030) of cases (Table 7.2).
Table 7.2: Top five causes of exposure to smoke, fire, heat and hot substances injury hospitalisations, 0–4 years, Australia, 1999–07
Rank Type of fire, burn and scald injury No. of cases
Per cent of
0–14 cases
No. of 0–14
cases
1 Contact with hot drinks, food, fats and cooking oils (X10) 4,030 79 5,122
2 Contact with other hot fluids (X12) 2,089 75 2,791
3 Contact with hot tap-water (X11) 1,371 80 1,721
4 Contact with hot household appliances (X15) 1,146 91 1,255
5 Contact with hot heating appliances, radiators and pipes (X16) 612 82 744
All fire, burn and scald injuries for 0–4 years 11,390 70 16,347
5–9 year olds
There were 2,441 cases of hospitalisations as a result of exposure to smoke, fire, heat and hot substances for 5–9 year olds in the reporting period (Table 7.3); this was considerably fewer than the number of cases among 0–4 year olds. The three leading causes of exposure to smoke, fire, heat and hot substances injury were the same for children aged 0–4 and 5–9.
Table 7.3: Top five causes of exposure to smoke, fire, heat and hot substances injury hospitalisations, 5–9 years, Australia, 1999–07
Rank Type of fire, burn and scald injury No. of cases
Per cent of
0–14 cases
No. of 0–14
cases
1 Contact with hot drinks, food, fats and cooking oils (X10) 638 12 5,122
2 Contact with other hot fluids (X12) 393 14 2,791
3 Contact with hot tap-water (X11) 208 12 1,721
4 Exposure to ignition of highly flammable material (X04) 198 21 951
5 Contact with other and unspecified heat and hot substances (X19) 167 19 896
All fire, burn and scald injuries for 5–9 years 2,441 15 16,347
40 Trends in hospitalised childhood injury in Australia 1999–07
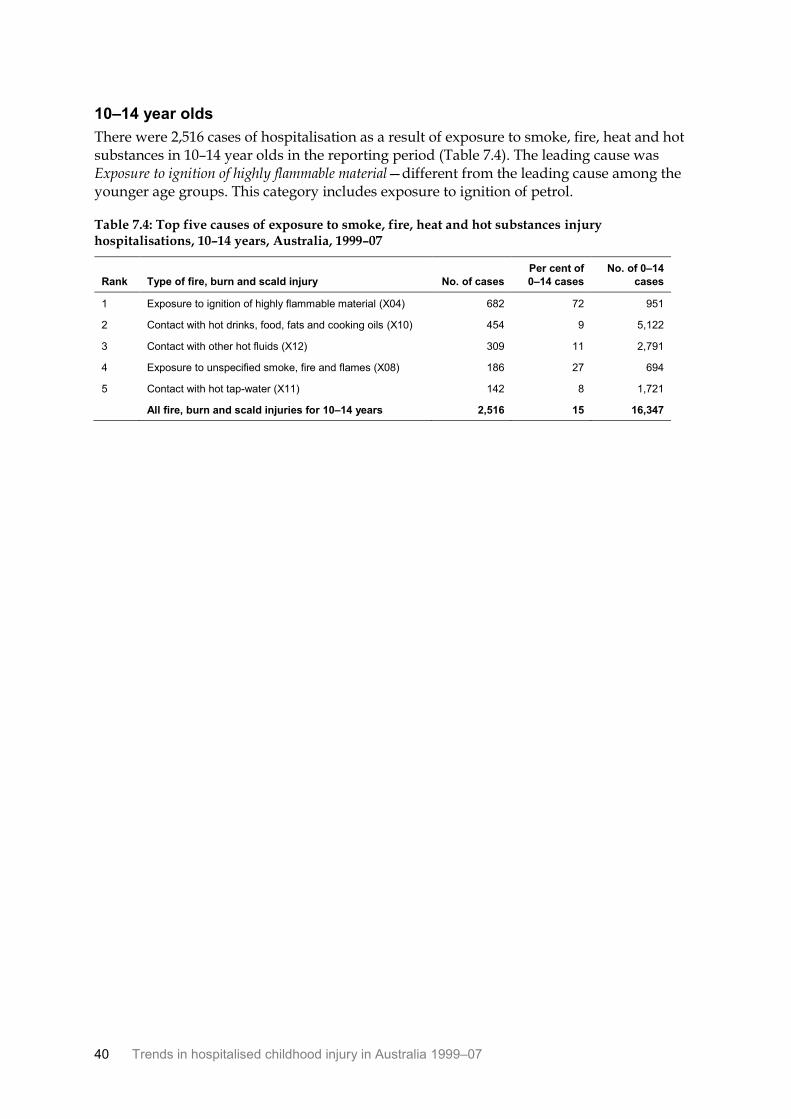
10–14 year olds
There were 2,516 cases of hospitalisation as a result of exposure to smoke, fire, heat and hot substances in 10–14 year olds in the reporting period (Table 7.4). The leading cause was Exposure to ignition of highly flammable material—different from the leading cause among the younger age groups. This category includes exposure to ignition of petrol.
Table 7.4: Top five causes of exposure to smoke, fire, heat and hot substances injury hospitalisations, 10–14 years, Australia, 1999–07
Rank Type of fire, burn and scald injury No. of cases
Per cent of
0–14 cases
No. of 0–14
cases
1 Exposure to ignition of highly flammable material (X04) 682 72 951
2 Contact with hot drinks, food, fats and cooking oils (X10) 454 9 5,122
3 Contact with other hot fluids (X12) 309 11 2,791
4 Exposure to unspecified smoke, fire and flames (X08) 186 27 694
5 Contact with hot tap-water (X11) 142 8 1,721
All fire, burn and scald injuries for 10–14 years 2,516 15 16,347
Trends in hospitalised childhood injury in Australia 1999–07 41
8 Conclusion
From July 1999 to June 2007 there were 471,416 estimated cases of hospitalised injury in children aged between 0 and 14. Boys continued to outnumber girls by a factor of 2 to 1 in injury statistics, and there has been little change in the overall rate of hospitalised injury for children since 1999. For all causes of injury combined, hospitalisation rates remained at about 1,500 cases per 100,000 population during the period.
Falls were the main reason for hospitalised injury in children throughout the period; they are followed by other unintentional injuries and transport-related injuries. Rates of hospitalised fall injury were stable during the period, at about 680 cases per 100,000 population for both boys and girls. When examined by age group, fall rates were found to be much lower for girls aged 10–14. The most frequent type of fall for children aged up to 9 was a fall involving playground equipment. At older ages, falls involving roller-skates and skateboards were more common. The number of hospitalised falls involving trampolines increased in children aged 0–4, from 371 cases in 2002–03 to 492 in 2006–07.
Other unintentional injuries were the second most frequent cause of hospitalised injury in children during the reporting period. Rates of other unintentional injury remained steady, averaging 500 cases per 100,000 population. For young children (0–4) foreign bodies in the eye or other natural orifices were the most common other unintentional injury requiring hospitalisation.
Transport-related injury hospitalisations involving pedal cycles were most commonly reported in 5–14 year olds, while being hit in a collision with a car, pick-up truck or van as a pedestrian was most common for 0–4 year olds.
The most significant declines in childhood hospitalised injury were seen in rates of poisoning by pharmaceuticals. An average decrease of 7.5% a year was seen during the reporting period. Until 9 years of age the rate of poisoning by pharmaceuticals was similar for boys and girls; in contrast, rates of poisoning by pharmaceuticals were consistently higher in girls compared with boys in the 10–14 age group. Children aged 0–4 are more vulnerable to poisoning, and this was reflected in their higher rates compared with the older age groups. Benzodiazepine poisoning was found to be relatively common among this (0–4) age group.
Fire, burn and scald hospitalised injuries remained steady during the period, with about 2,000 children hospitalised each year. Rates of hospitalised burns were higher in younger children (0–4) and for boys in each age group. For children aged 0–9 the most common cause of burn injury throughout the period was Contact with hot drinks, fats and cooking oils. For older children, the most common cause of hospitalised injury was Exposure to ignition of highly flammable material, including petrol.
42 Trends in hospitalised childhood injury in Australia 1999–07
Appendix A: Data issues
Data sources This report is based on hospital separations data reported for the financial years 1999–00 to 2006–07, as supplied by the Australian Institute of Health and Welfare from the National Hospital Morbidity Database. Population data were obtained from the Australian Bureau of Statistics.
Definitions
A ‘separation’ is defined as ‘A formal, or statistical, process by which an episode of care for an admitted patient ceases’ (AIHW 2001).
The principal diagnosis is the diagnosis established after study to be chiefly responsible for occasioning the patient‘s episode of admitted care.
An ‘external cause’ is defined as the environmental event, circumstance or condition that was the cause of the injury, poisoning or adverse event. Whenever a patient has a principal or additional diagnosis of an injury or poisoning, an external cause code should be recorded.
ICD-10-AM Data on principal diagnosis and external cause of injury were coded according to four editions (covering the period 1999 to 2007) of the Australian clinical modification of ICD-10, ICD-10-AM. Changes to the ICD-10-AM over the four revisions have not affected the inclusion of cases for analysis. Where more detailed analyses have been undertaken using specific editions of the ICD-10-AM, this is noted in the text.
Estimated cases Since some injuries result in more than one episode in hospital as a result of transfers and re-admissions, analysis of a data set consisting of hospital separations is likely to overestimate the number of new cases of injury. At the national level, Australian hospital data files lack direct means of avoiding such over-counting.
For this report a method was used to reduce over-counting of cases: records in which the mode of admission is recorded as being by transfer from another acute-care hospital were omitted on the ground that such cases were likely to result in more than one separation record that meets the operational definition of a case of hospitalised injury. It should be recognised that this method for avoiding multiple counting of cases is approximate. It should allow for cases involving transfer between or within hospitals. It cannot allow for readmissions which meet the project’s selection criteria. As such, reporting of hospitalised cases is an estimate.
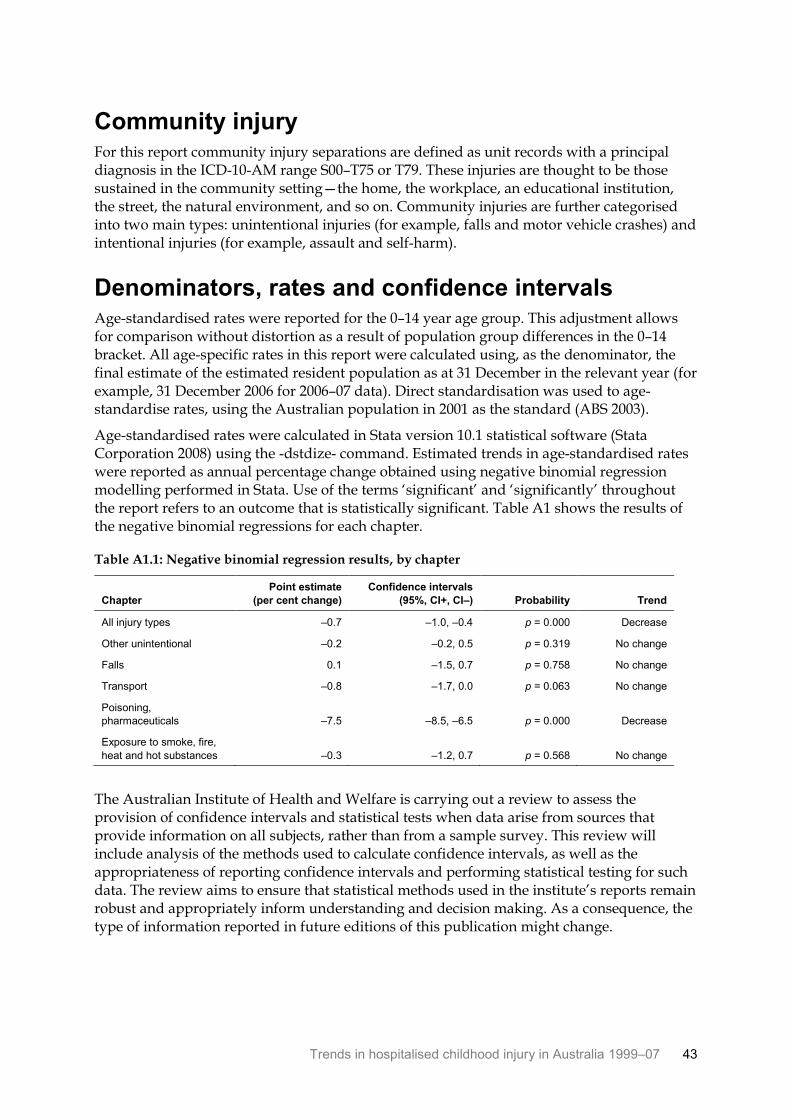
Trends in hospitalised childhood injury in Australia 1999–07 43
Community injury For this report community injury separations are defined as unit records with a principal diagnosis in the ICD-10-AM range S00–T75 or T79. These injuries are thought to be those sustained in the community setting—the home, the workplace, an educational institution, the street, the natural environment, and so on. Community injuries are further categorised into two main types: unintentional injuries (for example, falls and motor vehicle crashes) and intentional injuries (for example, assault and self-harm).
Denominators, rates and confidence intervals Age-standardised rates were reported for the 0–14 year age group. This adjustment allows for comparison without distortion as a result of population group differences in the 0–14 bracket. All age-specific rates in this report were calculated using, as the denominator, the final estimate of the estimated resident population as at 31 December in the relevant year (for example, 31 December 2006 for 2006–07 data). Direct standardisation was used to age-standardise rates, using the Australian population in 2001 as the standard (ABS 2003).
Age-standardised rates were calculated in Stata version 10.1 statistical software (Stata Corporation 2008) using the -dstdize- command. Estimated trends in age-standardised rates were reported as annual percentage change obtained using negative binomial regression modelling performed in Stata. Use of the terms ‘significant’ and ‘significantly’ throughout the report refers to an outcome that is statistically significant. Table A1 shows the results of the negative binomial regressions for each chapter.
Table A1.1: Negative binomial regression results, by chapter
Chapter
Point estimate
(per cent change)
Confidence intervals
(95%, CI+, CI–) Probability Trend
All injury types –0.7 –1.0, –0.4 p = 0.000 Decrease
Other unintentional –0.2 –0.2, 0.5 p = 0.319 No change
Falls 0.1 –1.5, 0.7 p = 0.758 No change
Transport –0.8 –1.7, 0.0 p = 0.063 No change
Poisoning,
pharmaceuticals –7.5 –8.5, –6.5 p = 0.000 Decrease
Exposure to smoke, fire,
heat and hot substances –0.3 –1.2, 0.7 p = 0.568 No change
The Australian Institute of Health and Welfare is carrying out a review to assess the provision of confidence intervals and statistical tests when data arise from sources that provide information on all subjects, rather than from a sample survey. This review will include analysis of the methods used to calculate confidence intervals, as well as the appropriateness of reporting confidence intervals and performing statistical testing for such data. The review aims to ensure that statistical methods used in the institute’s reports remain robust and appropriately inform understanding and decision making. As a consequence, the type of information reported in future editions of this publication might change.
44 Trends in hospitalised childhood injury in Australia 1999–07
Pharmaceutical agents Table A2 provides a description of the drugs included in each of the five categories of poisoning by pharmaceutical substances. For more detail, see the tables in the Alphabetic index of the ICD-10-AM fourth edition (NCCH 2004).
Table A1.2: ICD-10-AM drug code inclusions
ICD-10-AM
code Drug code inclusions (NCCH 2004)
X40 Accidental poisoning by and exposure to nonopioid analgesics, antipyretics and antirheumatics
4-aminophenol derivatives, nonsteroidal anti-inflammatory drugs [NSAID], pyrazolone derivatives, and
salicylates.
X41 Accidental poisoning by and exposure to antiepileptic, sedative-hypnotic, antiparkinsonism and
psychotropic drugs, not elsewhere classified
Antidepressants, barbiturates, hydantoin derivatives, iminostilbenes, methaqualone compounds,
neuroleptics, psychostimulants, succinimides and oxazolidinediones, and tranquillisers.
X42 Accidental poisoning by and exposure to narcotics and psychodysleptics [hallucinogens], not
elsewhere classified
Cannabis (derivatives), cocaine, codeine, heroin, lysergide [LSD], mescaline, methadone, morphine, and
opium (alkaloids).
X43 Accidental poisoning by and exposure to other drugs acting on the autonomic nervous system
Parasympatholytics [anticholinergics and antimuscarinics] and spasmolytics, parasympathomimetics
[cholinergics], sympatholytics [antiadrenergics], and sympathomimetics [adrenergics].
X44 Accidental poisoning by and exposure to other and unspecified drugs, medicaments and
biological substances
Agents primarily acting on smooth and skeletal muscles and the respiratory system, anaesthetics
(general)(local), anti-infectives, drugs affecting the cardiovascular system and gastrointestinal system,
hormones and synthetic substitutes, systemic and haematological agents, systemic antibiotics and other
anti-infectives, therapeutic gases, topical preparations, vaccines, water-balance agents and drugs
affecting mineral and uric acid metabolism.
Errors and inconsistencies This report is based on data collected from state and territory hospitals. After coding and collection from the states and territories, the data are further processed by the institute and the National Injury Surveillance Unit. The geographical spread of the data and the large number of people involved in the processing increase the risk of inconsistencies across time and place. Variations in reporting and coding continue to exist in the jurisdictions, although National Minimum Data Sets have been in place for a considerable time.
Trends in hospitalised childhood injury in Australia 1999–07 45
References
ABS (Australian Bureau of Statistics) 2003. Population by age and sex, Australian states and territories, 2001 census edition—final. ABS cat. no. 3201.0. Canberra: ABS.
AIHW (Australian Institute of Health and Welfare) 2001. National health data dictionary. Version 10. Cat. no. HWI 30. Canberra: AIHW.
AIHW 2011. Aboriginal and Torres Strait Islander child safety. Cat. no. IHW 50. Canberra: AIHW.
Berry J & Harrison J 2007. Hospital separations due to injury and poisoning, Australia, 2003–04. Injury research and statistics series no. 30. Cat. no. INJCAT 88. Canberra: AIHW.
Moller JN & Kreisfeld R 1997. Progress and current issues in child injury prevention. Australian Injury Prevention Bulletin no. 15. Cat. no. INJCAT 006. Canberra: AIHW.
NCCH (National Centre for Classification in Health) 2004. ICD-10-AM Australian coding standards, fourth edition. Sydney: NCCH.
Stata Corporation 2008. Stata statistical software [computer program] version 10.1. College station, TX: Stata Corporation.
46 Trends in hospitalised childhood injury in Australia 1999–07
List of tables
Table 2.1: Estimated number of children hospitalised for injury, by sex and age group, Australia, 1999–07 ........................................................................................................................... 2
Table 2.2: Estimated number of children hospitalised for injury, by age group, sex and year, Australia, 1999–07 ........................................................................................................................... 3
Table 2.3: Estimated number of children hospitalised for injury, by external cause and sex, Australia, 1999–07 ........................................................................................................................... 7
Table 2.4: Estimated number of children hospitalised for injury, by external cause and age group, Australia, 1999–07 .............................................................................................................. 8
Table 3.1: Estimated number of children hospitalised for fall injury, by sex and year, Australia, 1999–07 ........................................................................................................................... 9
Table 3.2: Top five causes of hospitalised fall injury, 0–4 years, Australia, 1999–07............................. 13
Table 3.3: Top five causes of hospitalised fall injury, 5–9 years, Australia, 1999–07............................. 13
Table 3.4: Top five types of hospitalised fall injury, 10–14 years, Australia, 1999–07........................... 14
Table 3.5: Estimated number of children hospitalised for trampolining injuries, by age and year, Australia, 2002–07 ............................................................................................................... 14
Table 4.1: Estimated number of children hospitalised for other unintentional injury, by sex and year, Australia, 1999–07 ....................................................................................................... 15
Table 4.2: Type of other unintentional injury hospitalisations, by age group, Australia, 1999–07 ........................................................................................................................................... 18
Table 4.3: Top five causes of other unintentional injury hospitalisations, 0–4 years, Australia, 1999–07 ........................................................................................................................................... 20
Table 4.4: Top five causes of other unintentional injury hospitalisations, 5–9 years, Australia, 1999–07 ........................................................................................................................................... 20
Table 4.5: Top five causes of other unintentional injury hospitalisations, 10–14 years, Australia, 1999–07 ......................................................................................................................... 21
Table 5.1: Estimated number of children hospitalised for transport injury, by sex and year, Australia, 1999–07 ......................................................................................................................... 22
Table 5.2: Mode of transport for injury hospitalisations, by age group, Australia, 1999–07 ............... 25
Table 5.3: Top five causes of transport injury hospitalisations, 0–4 years, Australia, 1999–07 ............ 27
Table 5.4: Top five causes of transport injury hospitalisations, 5–9 years, Australia, 1999–07 ............ 27
Table 5.5: Top five causes of transport injury hospitalisations, 10–14 years, Australia, 1999–07 ........................................................................................................................................... 28
Table 6.1: Estimated number of children hospitalised for poisoning by pharmaceuticals, by sex and year, Australia, 1999–07 ................................................................................................. 29
Table 6.2: Causes of pharmaceutical poisoning hospitalisations, 0–14 years, Australia, 1999–07 ........................................................................................................................................... 32
Table 6.3: Top five causes of pharmaceutical poisoning hospitalisations, 0–4 years, Australia, 1999–07 ........................................................................................................................................... 33
Table 6.4: Top five causes of pharmaceutical poisoning hospitalisations, 5–9 years, Australia, 1999–07 ........................................................................................................................................... 33
Trends in hospitalised childhood injury in Australia 1999–07 47
Table 6.5: Top five causes of pharmaceutical poisoning hospitalisations, 10–14 years, Australia, 1999–07 ......................................................................................................................... 34
Table 7.1: Estimated number of children hospitalised for injury from exposure to smoke, fire, heat and hot substances, by sex and year, Australia, 1999–07 ........................................ 35
Table 7.2: Top five causes of exposure to smoke, fire, heat and hot substances injury hospitalisations, 0–4 years, Australia, 1999–07 ......................................................................... 39
Table 7.3: Top five causes of exposure to smoke, fire, heat and hot substances injury hospitalisations, 5–9 years, Australia, 1999–07 ......................................................................... 39
Table 7.4: Top five causes of exposure to smoke, fire, heat and hot substances injury hospitalisations, 10–14 years, Australia, 1999–07 ..................................................................... 40
Table A1.1: Negative binomial regression results, by chapter .................................................................... 43
Table A1.2: ICD-10-AM drug code inclusions ............................................................................................... 44
48 Trends in hospitalised childhood injury in Australia 1999–07
List of figures
Figure 2.1: Modelled age-standardised rates of cases due to all causes, Australia, 1999–07 ................... 4
Figure 2.2: Age-standardised rates of hospitalisation due to injury, by sex, Australia, 1999–07 ............ 5
Figure 2.3: Age-specific rates of hospitalisation due to injury, by sex and age group, Australia, 1999–07 ............................................................................................................................................. 6
Figure 3.1: Modelled age-standardised rates of hospitalised fall injury, Australia, 1999–07 ................ 10
Figure 3.2: Age-standardised rates of hospitalised fall injury, by age group and sex, Australia, 1999–07 ........................................................................................................................................... 10
Figure 3.3: Age-specific rates of hospitalised fall injury, by sex and age group, Australia, 1999–07 ........................................................................................................................................... 11
Figure 3.4: Top 10 causes of falls leading to hospitalisation, 0–14 years, Australia, 1999–07 ................ 12
Figure 4.1: Modelled age-standardised rates of cases of other unintentional injury, Australia, 1999–07 ........................................................................................................................................... 16
Figure 4.2: Age-standardised rates of hospitalisation for other unintentional injury, by sex, Australia, 1999–07 ......................................................................................................................... 16
Figure 4.3: Age-specific rates of hospitalisation for other unintentional injury, by sex and age group, Australia, 1999–07 ............................................................................................................ 17
Figure 4.4: Top 10 causes of other unintentional injury leading to hospitalisation, 0–14 years, Australia, 1999–07 ......................................................................................................................... 19
Figure 5.1: Modelled age-standardised rates of cases of transport injuries, Australia, 1999–07 ........... 23
Figure 5.2: Age-standardised rates of hospitalisation for transport injury, by sex, Australia, 1999–07 ........................................................................................................................................... 23
Figure 5.3: Age-specific rates of hospitalisation for transport injury, by sex and age group, Australia, 1999–07 ......................................................................................................................... 24
Figure 5.4: Top 10 causes of transport injury hospitalisations, 0–14 years, Australia, 1999–07 ............ 26
Figure 6.1: Modelled age-standardised rates of cases of pharmaceutical poisoning, Australia, 1999–07 ........................................................................................................................................... 30
Figure 6.2: Age-standardised rates of hospitalisation for pharmaceutical poisoning, by sex, Australia, 1999–07 ......................................................................................................................... 30
Figure 6.3: Age-specific rates of hospitalisation for pharmaceutical poisoning, by sex and age group, Australia, 1999–07 ............................................................................................................ 31
Figure 7.1: Modelled age-standardised rates of cases of exposure to smoke, fire, heat and hot substances, Australia, 1999–07 .................................................................................................... 36
Figure 7.2: Age-standardised rates of hospitalisation for exposure to smoke, fire, heat and hot substances, by sex, Australia, 1999–07 ....................................................................................... 36
Figure 7.3: Age-specific rates of hospitalisation for exposure to smoke, fire, heat and hot substances, by sex and age group, Australia, 1999–07 ............................................................ 37
Figure 7.4: Top 10 causes of exposure to smoke, fire, heat and hot substance injury, 0–14 years, Australia, 1999–07 ......................................................................................................................... 38
This report provides summary data on trends in hospitalised childhood injury for 1 July 1999 to 30 June 2007. Information is provided for three age groups (0–4, 5–9 and 10–14 year-olds) for each year.
Falls and other unintentional injuries were the most frequent causes of hospitalised injury in each age group.
Trends in hospitalised childhood injury in Australia 1999–07AIH
W
Trends in hospitalised childhood injury in Australia
1999–07
Sophie Pointer and Yvonne Helps