trends in growth and development of transport
TRANSCRIPT

NATIONAL TRANSPORT DEVELOPMENT POLICY COMMITTEE | 201328
2. TRENDS IN GROWTH AND DEVELOPMENT OF TRANSPORT
NATIONAL TRANSPORT DEVELOPMENT POLICY COMMITTEE | 201326
NTDPC~Vol 02_Part 1~Ch 02.indd 26 15-04-2014 10.50.48 AM

27NTDPC | TRENDS IN GROWTH AND DEVELOPMENT OF TRANSPORT
NTDPC~Vol 02_Part 1~Ch 02.indd 27 15-04-2014 10.50.50 AM


NTDPC | TRENDS IN GROWTH AND DEVELOPMENT OF TRANSPORT 29
In a country of continental size like India where resources and markets are dispersed across long distances, the provision of efficient, low cost, reli-able and safe transport infrastructure and services assumes additional significance.
Historically, large-scale investments in transport have kicked off phases of accelerated development and have led to large declines in transport costs on a global basis. Falling transport costs created large home markets for producers, allowing them to exploit larger market sizes and shape the economic landscape. For instance, canal construction and the surge of the railways boosted early US develop-ment in the 19th century1. Research clearly indicates increasing returns to scale: higher levels of demand reduce cost, allowing more efficient sharing of facili-ties and services. Recent analytic work in economic geography also points out that for activities that benefit from increasing returns to scale, a fall in transport costs is accompanied by higher geograph-ic concentration of economic activities. With high transport costs, large economies of scale will remain unexploited, and production inefficient. When trans-port costs fall, spatial differences in production and economic growth will increase, both within and between countries2.
TRANSPORT DEMAND AND PROJECTIONS
The transport system in India comprises distinct modes such as rail, road transport, coastal shipping, civil aviation, inland water transport and pipelines. Rail and road dominate, carrying about 87 per cent of the total freight traffic in the country in 2007-08. Unfortunately, the rail-road mix in freight movement has developed rather sub-optimally over the years, as railways consistently lost out to roads, unable to install capacity or respond to market needs. The divide between the two modes became even more pronounced as roads expanded rapidly on the back of focused policy and investments, particularly dur-ing the last decade or so. The Total Transport Sys-tem Study (TTSS) carried out by RITES for the Plan-ning Commission in 2007-08 calculated that railways’ share in total inter-regional freight traffic has come down from 89 per cent in 1951 to 65 per cent in 1978-79, 53 per cent in 1986-87 and 30 per cent in 2007-08. This consistent and unchecked fall in the share of railways through the years was estimated by RITES to have cost the Indian economy about Rs 385 billion (16 per cent of the total transport cost) in the year 2007-083.
2. TRENDS IN GROWTH AND DEVELOPMENT OF TRANSPORTTransport plays a very vital role in the development of a country’s economy; in determining overall productivity, quality of life of citizens, access to goods and services and the pattern for distribution of economic activity.
1. The states of Illinois, Michigan and Ohio had marked increases in population, construction and manufacturing. Falling consumer prices of agricultural goods boosted the real income of the working population in rapidly growing cities. Price differences between Iowa and New York fell from 69 per cent to 19 per cent from 1870 to 1910. International trade relations in the first episode of globalisation were driven by the massive decrease in maritime transport costs following from the emergence of the steamboat (World Bank 2009).
2. World Bank (2009).3. According to Planning Commission (2010) rail and road together carried about 1,287 BTKM (~87 per cent) of freight traffic (inter + intra regional) out of the total traffic of
1,482 BTKM carried by all modes in 2007-08.
NTDPC~Vol 02_Part 1~Ch 02.indd 29 15-04-2014 10.50.51 AM

NATIONAL TRANSPORT DEVELOPMENT POLICY COMMITTEE | 201330
For passenger traffic as well, rail and road continue to be the dominant modes in India. The traffic car-ried by air and water transport is negligible, though on certain routes, the former carries considerable volumes which continue to increase. Over time, roads have emerged as the predominant mode for passenger transport. The share of road in passenger traffic (billion passenger kilometre or bpkm) in total passenger traffic carried by rail and road together has increased from 32 per cent in 1951 to about 90 per cent in 2011-124 (Figure 2.5).
FREIGHT TRAFFIC
Freight traffic carried by road and rail increased from 257 billion tonne km in 1980-81 to 2053 billion tonne km in 2011-125. While the increase in freight
movement is impressive, more striking is the chang-ing modal composition. Rail had historically domi-nated freight traffic, carrying about 60 per cent of freight in the early 1980s (Figure 2.1), but it came down to about 50 per cent by the late 1980s. Later, with economic liberalisation, with higher growth, as the demand for freight transport grew faster, market forces rapidly pushed for road transport. The share of rail further dropped to about 37 per cent at the end of 1990s. While overall freight movement almost dou-bled in the 1990s, freight traffic on roads increased over 2.5 times. Roads accounted for about 67 per cent6 of freight movement in 2011-12 (Figure 2.1).
When analysing the performance of total freight traffic as well as traffic moved by rail and road with respect to GDP, it can be observed from Figure 2.2 that
4. NTDPC research (As far as NTDPC’s analysis of freight and passenger traffic is concerned, it is confined only to the traffic carried by rail and road as these two modes together dominate the total freight and passenger traffic carried by all modes together).
5. Planning Commission (1988); NTDPC research.6. As per the McKinsey & Company (2010), roads in China and US account for 22 per cent and 27 per cent of freight movements, while rail contributes to about 47 and 48 per
cent, respectively.
Figure 2. 1 Freight Traffic: Roads Overtake Rail
Traffic Carried by Rail
Traffic Carried by Road
Billi
on To
nne
Kms
1,600
1,400
1,200
1,000
800
600
400
200
1950-51 1970-71 1980-81 1990-91 1999-2000 2004-05 2011-120
Source: Rail Year Book, Planning Commission (1988); Various Plan documents, Planning Commission and NTDPC research.
Per c
ent
1950-51 1970-71 1980-81 1990-91 1999-2000 2004-05 2011-12
100
90
80
70
60
50
40
30
20
10
0
Percentage Share by Rail
Percentage Share by Road
NTDPC~Vol 02_Part 1~Ch 02.indd 30 15-04-2014 10.50.53 AM

NTDPC | TRENDS IN GROWTH AND DEVELOPMENT OF TRANSPORT 31
in the decades before and after economic reforms, total freight traffic grew at a pace broadly compara-ble to GDP growth. Road freight traffic which grew at a slower rate than GDP prior to 1991, increased at a higher rate subsequently. The trend for rail traffic was exactly the opposite.
While freight movements have increased exponen-tially following liberalisation, the cost of transport-ing freight has remained fairly stable. For instance, freight cost between Delhi and Mumbai was Rs 1.03 per tonne km in 2001, and Rs 1.21 in 2011 (Figure 2.3). Freight prices would have been around Rs 1.8 per tonne km in 2011 had the cost followed the same tra-jectory as the Wholesale Price Index (WPI). Research on published freight rates carried out by the NTDPC shows similar trends on most road segments.
While overall road transport costs are low (relative to international experience) and have been stable, there has been a rapid increase in transport costs across relatively short distances across metropoli-tan areas and between cores and suburbs of the larg-est metropolitan areas. For instance, freight rates between Delhi and Chandigarh (a distance of 260 km) increased from Rs 1.2 per tonne km in 2001 to Rs 2.7 in 2011. The price escalation would have been to about Rs 2 per tonne km had it traced the WPI. Prices are even higher for shorter distances between cores and suburbs of metropolitan areas.
A recent survey of truckers and transport provid-ers shows that freight rates for short distances (less than 100 km) are on average as high as Rs 5.2 per tonne km between large cities and their immediate hinterland (Figure 2.4). India’s metropolitan freight
costs are twice the national average and almost three times what it costs to move products in countries such as China.
The relatively high and rising metropolitan trans-port costs are likely to pose serious economic chal-lenges as these areas provide the highest potential for trade and population movements (see market access map in Figure 2.4). The 2011 census reports that 377 million people now live in India’s 7,935 towns—an increase of 91 million people and 2,774 towns since 2001. In fact, data from the 2001 census tell us that urban demand is more likely to emerge at the fringes of existing cities with more than one million people.
Also, 43 per cent of India’s natural urban expan-sion—new towns—between 1991 and 2001 took place within 100 km of existing cities with a million or more people, and another 35 per cent between 100 and 200 km. While at this time, specific information on locations of the newly created 2,774 towns is not available, previous trends would point at metropoli-tan suburbanisation. Rising transport costs at this scale is likely to hamper economic efficiency.
PASSENGER TRANSPORT
The demand for road-based transport services has dramatically accelerated following economic liberal-ization, and by 2011-12, roads provided for as high as about 90 per cent of the total passenger traffic, leav-ing a meager 10 per cent for rail7 (Figure 2.5). This trend reflects the constraints experienced in capac-ity expansion of the railways. This sharp growth is expected to continue with increase in incomes and
7. Based on NTDPC research.
Figure 2. 2 Indices of Freight Traffic and Economic Trends [GDP]
Note: The road and rail traffic as well as GDP figures have been indexed to the year 1990-91.
1950-51 1970-711960-61 1980-81 1990-91 1999-2000 2004-05 2011-12
Rail Freight Index GDP Index
Road Freight Index Total Freight Traffic Index
0
200
400
600
NTDPC~Vol 02_Part 1~Ch 02.indd 31 15-04-2014 10.50.53 AM

NATIONAL TRANSPORT DEVELOPMENT POLICY COMMITTEE | 201332
the changing spatial footprint of suburbanising cit-ies. While robust estimates on the income and price sensitivity of road use and automobile demand are not readily available, a proxy using gasoline demand shows a high, long-run income elasticity (2.68) and a low price elasticity (-0.32) of gasoline demand. This implies that demand for gasoline will increase at twice the pace of income/GDP growth while being less sensitive to price increases8. Related research has also shown that automobile demand increases rapidly with city population and changes in incomes (follows an ‘S’ shape). Such a pattern can lead to a number of problems as India has several small but rapidly growing suburbs and towns where demand for vehicles will increase with city growth. Vehicu-lar increase dominated by personalised modes that are not energy-efficient and environmentally benign will have implications for sustainable development.
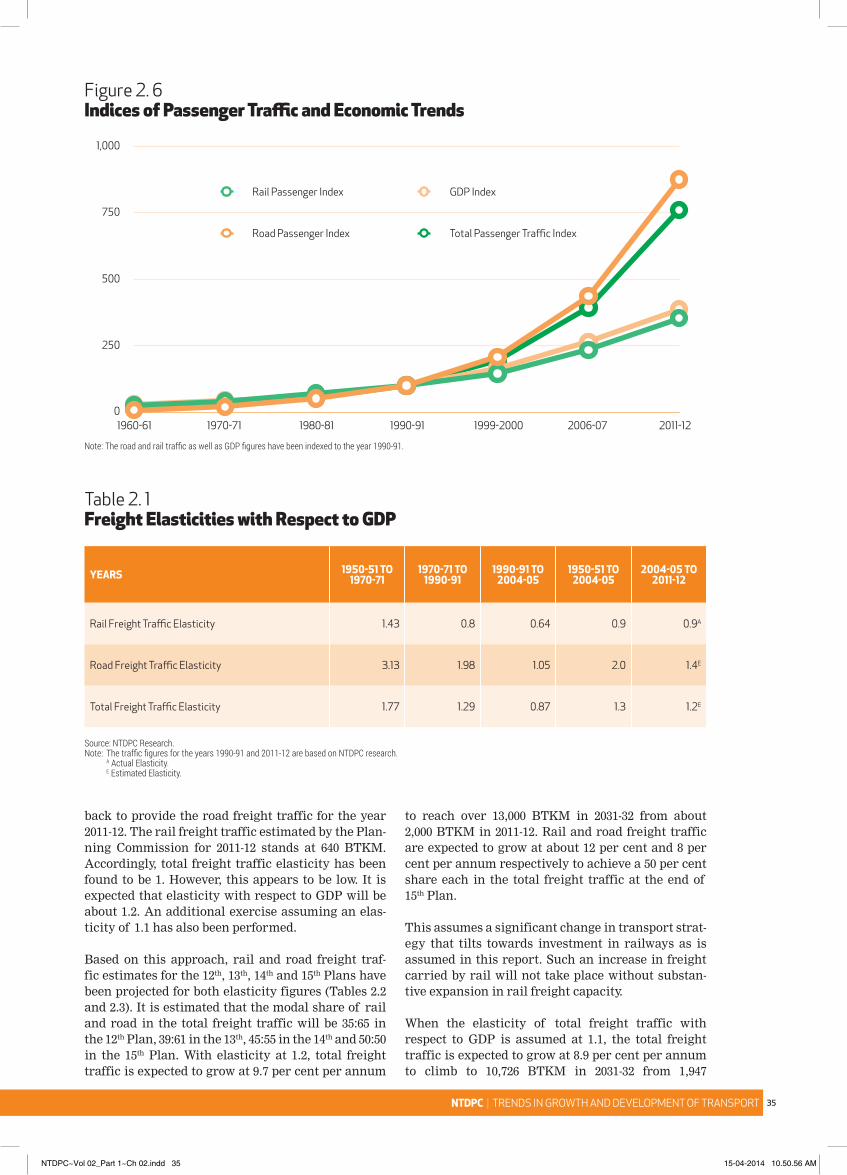
The performance of total passenger traffic as well the passenger traffic moved by rail and road with respect to GDP indicates that total passenger traf-fic grew at a slower pace than GDP before econom-ic reforms in 1991, but subsequently surpassed the GDP growth rate (Figure 2.6). Thus, the movement of passenger traffic by rail and road shows similar trends as that of freight.
TRAFFIC IN 2032
The NTDPC has estimated transport demand for the terminal years of the 12th Five Year Plan (2016-17), 13th Plan (2021-22), 14th Plan (2026-27) and 15th Plan (2031-32). Elasticity of traffic demand with respect to GDP has been taken as the underlying approach for assessment of traffic projections. Elasticities for different time periods from 1950 onwards have been
8. Ramanathan (1999).
Figure 2. 3 Cost of Transporting Freight by Road [Rs/Tonne Km]
Rs/T
onne
Km
2001 2002 2003 2004 2005 2006 2007 2008 2009 2010 2011
Freight Rates (WPI Predictions)
DELHI - CHANDIGARH (260 KMS)
Freight Rates (Nominal)
3
2
1
0
Source: Freight rate data compiled from The Economic Times, Wholesale Price Index (WPI) – Base Year – 2004-05, from Economic Survey 2011-12.
Rs/T
onne
Km
2001 2002 2003 2004 2005 2006 2007 2008 2009 2010 2011
Freight Rates (WPI Predictions)
DELHI - MUMBAI (1,408 KMS)
Freight Rates (Nominal)
1.5
2
1
0.5
0
NTDPC~Vol 02_Part 1~Ch 02.indd 32 15-04-2014 10.50.54 AM

NTDPC | TRENDS IN GROWTH AND DEVELOPMENT OF TRANSPORT 33
Figure 2. 4 High Transport Costs Between Large Cities and Suburbs
Source: Urbanisation Review, The World Bank (based on a survey of over 1,800 truckers and trucking companies).
Large CityIntra-Urban
Large CityExtra-Urban
Small CityIntra-Urban
Small CityExtra-Urban
6
4
2
0
Price Charged, Per Tonne Km, Rs
Accessibility IndexHigh
Low
NTDPC~Vol 02_Part 1~Ch 02.indd 33 15-04-2014 10.50.55 AM

NATIONAL TRANSPORT DEVELOPMENT POLICY COMMITTEE | 201334
calculated. Though transport demand depends upon a number of factors, GDP has been found to be the most dominant one for calculating elasticities for both freight and passenger traffic. On the basis of a general trend in the elasticities over different time periods, traffic projections have been made. Differ-ent GDP growth rates have been estimated for each Plan. The GDP growth rate estimates are as follows: 6.9 per cent for the 12th (2016-17)9 Plan, 8 per cent for the 13th (2021-22) Plan, 8.5 per cent during 14th (2026-27) Plan and 9 per cent in the 15th (2031-32) Plan.
FREIGHT TRAFFICElasticity of total freight with respect to GDP was calculated for different time periods from
1950-51 to 2004-05, which is considered as the base year (Table 2.1).
The total freight elasticity had been declining over time but may have increased in the recent period along with acceleration in economic growth. The overall elasticity for the period 1950-51 to 2004-05 is approximately 1.30. This appears reasonable as per The Indian Railways Report 2001: Policy Imperatives for Reinvention and Growth (Expert Group on Indian Railways, July 2001) which estimated Total Freight Traffic Elasticity at 1.25. The 12th Plan estimates road freight traffic at 1,337 billion net tonnes kilometer (BTKM) for the year 2012-13 using an elasticity of 1.2 and GDP growth rate at 8 per cent. It is discounted
Figure 2. 5 Passenger Traffic : Roads Dominate
Billi
on P
Km
s
1950-51 1970-71 1980-81 1990-91 1999-2000 2006-07 2011-12
Traffic Carried by Rail Traffic Carried by Road
10,000
8,000
6,000
4,000
2,000
0
Source: Rail Year Book, Planning Commission (1988); Planning Commission and NTDPC research.
Per c
ent
1950-51 1970-71 1980-81 1990-91 1999-2000 2006-07 2011-12
Percentage Share Rail Percentage Share Road
0
25
50
75
100
9. Planning Commission (2013).
NTDPC~Vol 02_Part 1~Ch 02.indd 34 15-04-2014 10.50.56 AM
NTDPC | TRENDS IN GROWTH AND DEVELOPMENT OF TRANSPORT 35
Figure 2. 6 Indices of Passenger Traffic and Economic Trends
Note: The road and rail traffic as well as GDP figures have been indexed to the year 1990-91.
1960-61 1970-71 1980-81 1990-91 1999-2000 2006-07 2011-12
Rail Passenger Index
Road Passenger Index
GDP Index
Total Passenger Traffic Index
1,000
750
500
250
0
back to provide the road freight traffic for the year 2011-12. The rail freight traffic estimated by the Plan-ning Commission for 2011-12 stands at 640 BTKM. Accordingly, total freight traffic elasticity has been found to be 1. However, this appears to be low. It is expected that elasticity with respect to GDP will be about 1.2. An additional exercise assuming an elas-ticity of 1.1 has also been performed.
Based on this approach, rail and road freight traf-fic estimates for the 12th, 13th, 14th and 15th Plans have been projected for both elasticity figures (Tables 2.2 and 2.3). It is estimated that the modal share of rail and road in the total freight traffic will be 35:65 in the 12th Plan, 39:61 in the 13th, 45:55 in the 14th and 50:50 in the 15th Plan. With elasticity at 1.2, total freight traffic is expected to grow at 9.7 per cent per annum
to reach over 13,000 BTKM in 2031-32 from about 2,000 BTKM in 2011-12. Rail and road freight traffic are expected to grow at about 12 per cent and 8 per cent per annum respectively to achieve a 50 per cent share each in the total freight traffic at the end of 15th Plan.
This assumes a significant change in transport strat-egy that tilts towards investment in railways as is assumed in this report. Such an increase in freight carried by rail will not take place without substan-tive expansion in rail freight capacity.
When the elasticity of total freight traffic with respect to GDP is assumed at 1.1, the total freight traffic is expected to grow at 8.9 per cent per annum to climb to 10,726 BTKM in 2031-32 from 1,947
Table 2. 1 Freight Elasticities with Respect to GDP
YEARS 1950-51 TO 1970-71
1970-71 TO 1990-91
1990-91 TO 2004-05
1950-51 TO 2004-05
2004-05 TO 2011-12
Rail Freight Traffic Elasticity 1.43 0.8 0.64 0.9 0.9A
Road Freight Traffic Elasticity 3.13 1.98 1.05 2.0 1.4E
Total Freight Traffic Elasticity 1.77 1.29 0.87 1.3 1.2E
Source: NTDPC Research.Note: The traffic figures for the years 1990-91 and 2011-12 are based on NTDPC research. A Actual Elasticity. E Estimated Elasticity.
NTDPC~Vol 02_Part 1~Ch 02.indd 35 15-04-2014 10.50.56 AM

NATIONAL TRANSPORT DEVELOPMENT POLICY COMMITTEE | 201336
RAIL ROAD TOTAL
YEARS TRAFFIC (BTKM) PER CENT SHARE TRAFFIC (BTKM) PER CENT SHARE TOTAL TRAFFIC (BTKM)
1950-51 44 88 6 12 50
1970-71 127 69 57 31 184
1990-91 247 47 283 53 530
2004-05 411 39 643 61 1,054
2011-12 668 33 1,385E 67 2,053E
2016-17 (GDP = 6.9 per cent)* 1,070 35 1,987 65 3,056
2021-22 (GDP = 8 per cent)* 1,885 39 2,949 61 4,834
2026-27 (GDP = 8.5 per cent)* 3,535 45 4,321 55 7,856
2031-32 (GDP = 9 per cent)* 6,559 50 6,559 50 13,118
Table 2. 2 Scenario 1: Freight Traffic Estimates with Elasticity 1.2, Base Year 2004-05
Source: Rail Year Book, Planning Commission (1988); NTDPC Research.Note: *NTDPC research. E Estimated (based on NTDPC research).
RAIL ROAD TOTAL
YEARS TRAFFIC (BTKM) PER CENT SHARE TRAFFIC (BTKM) PER CENT SHARE TOTAL TRAFFIC (BTKM)
1950-51 44 88 6 12 50
1970-71 127 69 57 31 184
1990-91 247 47 283 53 530
2004-05 411 39 643 61 1,054
2011-12 668 34 1,279E 66 1,947E
2016-17 (GDP = 6.9 per cent)* 982 35 1,824 65 2,807
2021-22 (GDP = 8 per cent)* 1,669 39 2,610 61 4,279
2026-27 (GDP = 8.5 per cent)* 3,011 45 3,680 55 6,691
2031-32 (GDP = 9 per cent)* 5,363 50 5,363 50 10,726
Table 2. 3 Scenario 2: Freight Traffic Estimates with Elasticity 1.1, Base Year 2004-05
Source: Rail Year Book, Planning Commission (1988); NTDPC Research.Note: *NTDPC Research. E Estimated (based on NTDPC research).
NTDPC~Vol 02_Part 1~Ch 02.indd 36 15-04-2014 10.50.57 AM

NTDPC | TRENDS IN GROWTH AND DEVELOPMENT OF TRANSPORT 37
BTKM in 2011-12. Rail and road freight traffic are expected to grow at about 11 per cent and 7 per cent per annum respectively to achieve a 50 per cent share each in the total freight traffic at the end of 15th Plan.
PASSENGER TRAFFICIn order to forecast passenger traffic for 2016-17, 2021-22, 2026-27 and 2031-32, elasticity of rail, road and total passenger traffic with respect to GDP was calculated for different time periods from 1950-51 to 2006-07, which is the base year (Table 2.4).
The long-term rail passenger elasticity for the period analysed is 0.92. However, between the 10th and 11th
Five Year Plans (2006-07 to 2011-12) this increased to 1.1. On the basis of this trend as well as 12th Plan esti-mates, an elasticity of 1.1 for rail passenger traffic appears reasonable.
Long-term elasticity of road passenger traffic with respect to GDP is approximately 2.0. The 12th Plan estimate of the same appears to be very low. Thus, on the basis of NTDPC research, an elasticity of 1.9 with respect to GDP has been utilised for forecasting (Table 2.5).
Total passenger traffic is expected to grow at about 15 per cent per annum to reach 168,875 bpkm in 2031-32 from 10,375 bpkm in 2011-12. Growth in rail pas-
Table 2. 4 Passenger Traffic Elasticities with Respect to GDP
Source: NTDPC Research.Note: A Actual (from Planning Commission [2013]). E Estimated (based on NTDPC research).
YEARS 1950-51 TO1970-71
1970-71 TO1990-91
1990-91 TO2006-07
1950-51 TO2006-07
2006-07 TO2011-12
Rail Passenger Elasticity 0.75 1.12 0.87 0.92 1.1A
Road Passenger Elasticity 2.64 2.01 1.54 2.0 1.9E
Total Passenger Elasticity 1.64 1.75 1.42 1.59 1.8E
YEARSRAIL ROAD TOTAL
TRAFFIC (BPKM) PER CENT SHARE TRAFFIC (BPKM) PER CENT SHARE TOTAL TRAFFIC (BPKM)
1950-51 67 68 31 32 98
1970-71 118 36 210 64 328
1990-91 296 22 1,671 78 1363
2006-07 695 13 4,657 87 5,352
2011-12 1,047 10 9,329 90 10,375
2016-17 (GDP = 6.9 Per cent)* 1,509 8 17,272 92 18,780
2021-22 (GDP = 8 Per cent)* 2,300 6 35,043 94 37,343
2026-27 (GDP = 8.5 Per cent)* 3,596 4 74,079 96 77,675
2031-32 (GDP = 9 Per cent)* 5,765 3 163,109 97 168,875
Table 2. 5 Passenger Traffic Estimates with Base Year 2006-07
Source: Rail Year Book, Planning Commission (1988); NTDPC Research.Note: *NTDPC Research. E Estimated (based on NTDPC research). Passenger Traffic includes only Bus Traffic.
NTDPC~Vol 02_Part 1~Ch 02.indd 37 15-04-2014 10.50.57 AM

NATIONAL TRANSPORT DEVELOPMENT POLICY COMMITTEE | 201338
10. Intra-regional traffic means traffic within a district.
YEARTOTAL INTER-
REGIONAL TRAFFIC (BTKM)
BTKM
RAILWAYS HIGHWAYS COASTAL SHIPPING AIRWAYS
TRAFFIC AVERAGE LEAD (KM) TRAFFIC AVERAGE
LEAD (KM) TRAFFIC AVERAGE LEAD (KM) TRAFFIC AVERAGE
LEAD (KM)
1978-78 189 150(79.2) 810 34
(17.8) 353 6 (3) 1,807 NA NA
1986-87 299 199 (66.5) 778 91
(30.5) 406 9 (3) 1,655 NA NA
2007-08 1,300 508 (39.1) 661 706
(54.3) 453 86(6.6) 1,450 0.29
(0.02) 1,027
Source: Planning Commission (2010).Note: Figures in parentheses indicate percentage modal share.
Table 2. 7 Comparative Overview of Inter-Regional Transport Output
YEARTOTAL
ORIGINATING INTER-REGIONAL
TRAFFIC
MODE-WISE TRAFFIC AND PERCENTAGE SHARE IN TOTAL TRAFFIC
RAILWAYS HIGHWAYS COASTAL SHIPPING AIRLINES PIPELINES INLAND WATER
TRANSPORT
1950-51 82 73 (89)
9 (11) NA NA NA NA
1978-78 283 185 (65)
96 (34)
3 (1) NA NA NA
1986-87 485 255 (53)
224 (46)
6 (1) NA NA NA
2007-08 2,555 769(30.08)
1,559(61.01)
59 (2.31)
0.3 (0.01)
114(4.44)
55 (2.15)
Source: Total Transport System Study by RITES.Note: Figures in parentheses indicate percentage modal share.
Table 2. 6 Comparative Overview of Originating Inter-Regional Freight Traffic
senger traffic is expected to be around 9 per cent per annum, and for road traffic, 15.4 per cent.
With these assumptions, it can be seen that total pas-senger traffic could increase by a factor of almost 16 over the next 20 years. The comparable increase in the last 10 years or so was by a factor of about 7 or 8. Overall, these projections provide an idea of the challenge facing overall transport investment in the country, if India is to achieve sustainable and con-tinuous growth in the next two decades.
THE RITES STUDY
RITES has carried out three studies—in 1978-79, 1986-87 and 2007-08, to forecast transport demand. In the first two studies, RITES took into account only the inter-regional freight traffic, while the study conducted in 2007-08 also assessed intra-regional traffic10. It has estimated traffic in all modes includ-ing rail, road, coastal shipping, airways, inland water transport (IWT) and pipelines.
RITES identified 52 commodity groups and derived the total traffic on the basis of originating tonnage and their average leads. Table 2.6 shows the opera-
tional performance of different modes of transport in terms of originating inter-regional (long and medium lead) traffic between 1950-51 and 2007-08.
Out of the total originating freight traffic of 2,555 million tonnes during 2007-08, the shares of railways and road transport were around 30 and 61 per cent respectively. The balance 9 per cent was handled by the remaining four modes. Since 1986-87, while overall freight traffic grew over five times, rail traffic has grown three times, road traffic about seven times and coastal shipping over 10 times.The total as well as mode-wise inter-regional traffic in terms of net tonne km, and the mode-wise average leads during the last three Total Transport System Studies conducted by RITES are shown in Table 2.7.
In terms of BTKM, the shares of rail and road are around 36 per cent and 50 per cent respectively. The other four modes make up the remaining 14 per cent. Since rail and road constitute 86 per cent of the total traffic in terms of BTKM, the estimates presented in Table 2.8 focus essentially on these two modes and include the inter-regional as well as intra-regional traffic. The share of road in the inter-regional freight
NTDPC~Vol 02_Part 1~Ch 02.indd 38 15-04-2014 10.50.58 AM

NTDPC | TRENDS IN GROWTH AND DEVELOPMENT OF TRANSPORT 39
YEAR
INTER-REGIONAL TRAFFIC INTRA-REGIONAL TRAFFIC TOTAL TRAFFIC (INTER-REGIONAL +INTRA-REGIONAL)
RAIL ROAD TOTAL RAIL ROAD TOTAL RAIL ROAD TOTAL
1978-79 150(81.6)
34(18.4) 184 - - - - - -
1986-87 199(68.6)
91(32.4) 290 - - - - - -
2007-08 508(41.8)
706(58.2 1,214
5(7.4) 67
(92.6) 73 514(40)
773(60) 1,287
Source: Planning Commission (2010).Note: Figures in parentheses indicate percentage modal share.
Table 2. 8 Inter- and Intra-Regional Traffic [BTKM]
traffic increased from 18 per cent in 1978-79 to approxi-mately 58 per cent in 2007-08 while the share of rail declined from about 82 per cent in 1978-79 to about 42 per cent in 2007-08. As for intra-regional traffic, major-ity of freight traffic is carried by road: 93 per cent was the road share in 2007-08.
AVERAGE LEADSThe average lead of freight traffic moved by rail and road are presented in Table 2.9. The average lead of freight traffic by rail has declined over time while it has increased for road. However, the average lead by rail is still higher than that of road; rail transport is preferred for long haulage.
RAIL-ROAD COMMODITY SHARERITES identified nine major commodities: coal, food grains, iron and steel, fertilisers, cement and cement structures, POL, iron ore, limestone and dolomite, and miscellaneous/other commodities—which con-stitute 63 per cent of the total volume of 52 commodi-ties carried by all four modes—rail, road, coastal shipping, airways.
The shares of rail and road transport in movement of these commodities are about 47 and 50 per cent respectively. Of the nine major commodities, coal, iron ore, limestone and dolomite, and fertilisers are predominantly carried by rail, while cement is car-ried almost equally between the two modes. Road transport reflects a comparatively higher share in movement of POL, iron and steel, and foodgrains. As analysed by RITES, the average leads for the move-ment of POL, iron and steel, and cement by road are 272 km, 525 km and 358 km respectively, while cor-responding leads by rail are much higher, at 658 km, 936 km and 557 km.
This trend indicates that over time, commodi-ties that were historically moved by rail over long distances are now being moved by road as the average lead of road has increased over time, and railways have probably been affected by capacity constraints.
Table 2.11 shows the projections of total inter- regional freight traffic made by RITES for rail and road for the years 2012-13, 2017-18, 2022-23 and 2025-26.
Table 2. 9 Average Freight Traffic Leads [Km]
YEARS RAIL ROAD
1978-78 810 353
1986-87 778 406
2007-08 661 453
Source: Planning Commission (2010).
NTDPC~Vol 02_Part 1~Ch 02.indd 39 15-04-2014 10.50.58 AM

NATIONAL TRANSPORT DEVELOPMENT POLICY COMMITTEE | 201340
Table 2. 10 Commodity-Wise Modal Performance During Base Year [2007-08] [Million Tonnes]
COMMODITY RAIL ROAD COASTAL SHIPPING AIRWAYS TOTAL
Coal 332(80)
68 (16.4)
15 (3.6)
0 (0) 415
Food Grains 38(23.8)
123 (76.9)
0 (0)
0 (0) 160
Iron and Steel 27 (20.2)
107 (79.9)
0 (0)
0 (0) 134
Iron Ore 122 (78.7)
23 (14.8)
10 (6.5)
0 (0) 155
POL Products (Liquid)
35 (18.4)
128 (67.4)
26 (13.7)
0 (0) 190
Limestone and Dolomite
14 (70)
6(30)
0 (0)
0 (0) 20
Cement 79 (50)
76 (48.1)
3 (1.9)
0 (0) 158
Fertilisers 36 (65.5)
18 (32.7)
0 (0)
0 (0) 55
Miscellaneous/ Others
22 (9.7)
202 (88.9)
3.2 (1.4)
0.3 (0.13) 227
Total of 9 Commodities
705(46.6)
751(49.6)
57(3.8)
0.3(0.02) 1,514
Total of 52 Commodities
769(32.2)
1,559(65.3)
59(2.5)
0.3(0.01) 2,387
Source: Planning Commission (2010).Note: Figures in parentheses indicate percentage modal share.
Total inter-regional freight traffic carried by rail and road for the year 2025-26 has been estimated at 5,345 BTKM. The compound annual growth rate (CAGR) during the period 2007-08 to 2025-26 is 8.58 per cent and if these projections are extrapo-lated to 2031-32, the total freight traffic is estimated at 8,756 BTKM. This is lower than the Committee’s estimates as these exclude intra-regional freight traffic. According to the NTDPC, total freight traffic (Inter + Intra Regional) with an elasticity of 1.2 is
15,289 BTKM in 2031-32, and 12,356 BTKM when the elasticity is 1.1.
PUBLIC SECTOR INVESTMENT
Public action has been and is likely to continue to be the dominant force in development of transport infrastructure and facilities. The transport sector has received special attention in India’s planning process and public investment has increased over the various Plans.
Table 2. 11 Freight Traffic Projection[BTKM]
YEARS TOTAL INTER-REGIONAL TRAFFIC FOR RAIL & ROAD (BTKM)
2007-08 (Base Year) 1,214
2012-13 1,924
2017-18 2,952
2022-23 4,316
2025-26 5,345
Source: Planning Commission (2010).
NTDPC~Vol 02_Part 1~Ch 02.indd 40 15-04-2014 10.50.59 AM

NTDPC | TRENDS IN GROWTH AND DEVELOPMENT OF TRANSPORT 41
However, with expanding investment requirements, public resources alone are not adequate. This neces-sitates private sector participation, a decision that is expected to not only augment the resources available for the transport sector but also to improve service delivery and efficiency.
It is not that private players have not been involved in transport. The private sector has always provided the bulk of trucking transportation; it now also has a majority share of passenger road transport services, international and coast-al shipping and all non-motorised transport. More recently, it has become a dominant player in providing air transport services. The private sector, during the last 10-15 years, has also made its presence felt in areas like ports, roads (nation-al highways) and airports. Its contribution in the provision of transport infrastructure, particularly rail and waterways, though, has been rather limited and needs to be encouraged.
However, despite the emerging role of the private sector, the State has to continue playing the role of both provider and facilitator through appropriate
policy interventions, regulations and supporting investment. Table 2.12 presents Plan-wise expendi-ture in various sectors of transport.
From the very beginning, the planners realised the significance of the development of the transporta-tion sector in both promoting economic development, and fulfilling the aspirations of the people. During the 1st Five Year Plan, agricultural production, irri-gation and power were the main focus areas. Despite this, about 22 per cent of the total expenditure was incurred on the transport sector. The expenditure share was the highest in the 2nd Plan at about 23.5 per cent. However, over the years, the percentage has declined. It hovered around 12.8 to 13.5 per cent from the 6th to the 8th Plans. During the 10th and 11th Plans, infrastructure, including transport, received special attention with the share of transport in total expend-iture increasing from 14.5 in the 10th Plan to 17.3 per cent in the 11th.
Railways and roads constitute the major chunk in the total transport spending. Analysis reveals that spending on railways saw a cyclical movement from the 1st to the 7th Plan, followed by a decline from
Table 2. 12 Share of Transport in Public Sector Expenditure: Five-Year Plans [Per cent]
S. No. SECTOR
1ST - 6TH PLAN(1951-85)
7TH PLAN (1985-90)
8TH PLAN(1992-97)
9TH PLAN(1997-2002)
10TH PLAN (2002-07)
11TH PLAN (2007-12)
EXPENDITURE
1 Railways 46.4 56.1 49.1 38.2 35.7 29.7
2 Roads 28.5 21.5 24.4 39.9 45.6 39.9
3 Road Transport 7.6 7.3 5.9 5.0 2.4 2.3
4 Ports 6.3 5.1 3.5 4.2 1.4 3.0
5 Shipping 4.7 2.4 5.0 2.5 1.3 1.3
7 Light House and Light Ships 0.1 - NEG NEG NEG 0.02
6 Inland Water Transport (IWT) 0.4 0.6 0.2 0.3 0.2 0.4
8 Civil Aviation 6.1 6.6 11.4 5.8 3.6 7.9
7 Pradhan Mantri Gram Sadak Yojana (PMGSY) - - - 4.1 7.5 13.4
8 Other Transport Sector - 0.2 0.4 - 2.1 2.1
9 Total Transport Sector (At Current Prices in Rs Billion)
255(100.0)
295(100.0)
656(100.0)
1,196(100.0)
2,422(100.0)
6,472(100.0)
10Total Public Sector Expenditure (At Current Prices in Rs Billion)
1,797 2,187 4,855 8,140 16,185 37,510
11 Transport Sector as Per cent 0f Total Public Sector Expenditure 14.2 13.5 13.5 14.7 14.5 17.3
Source: Planning Commission (2013).Note: The total transport sector expenditure does not include expenditure on urban transport.
Neg: Negligible.
NTDPC~Vol 02_Part 1~Ch 02.indd 41 15-04-2014 10.50.59 AM

NATIONAL TRANSPORT DEVELOPMENT POLICY COMMITTEE | 201342
the 8th Plan onwards. The railways share increased from 50 per cent in the 1st Plan to a peak of 67 per cent in the 3rd, with a drastic fall in the 4th and 5th Plan onwards, followed by a rise till the 7th. From the 8th Plan onwards, the share has constantly declined while expenditure on highways increased. The rail-ways share stood at a dismal low of about 30 per cent in the 11th Plan.
Roads saw a major impetus in spending to reach a significant 42 per cent in the 11th Plan, from a mea-gre 22 per cent in the 2nd Plan. Railways capacity in both freight and passenger traffic has not increased enough simply due to inadequate investment. Mean-while, the capacity of the national highway system has grown considerably with the initiation of the National Highway Development Project (NHDP). Further, the explosion in airline capacity is provid-ing increasing competition to the upper-class rail-way segment.
The share of modes other than railways and roads, which was around 15 per cent of total expenditure on transport in the first three Plans, escalated to 30 per cent in the 4th and 5th Plans, only to settle down at about 28 per cent in the 10th plan and 11th Plan.
THRUST ON INFRASTRUCTURE
The infrastructure sector in India is currently at an inflexion point. The Government has shown an increasing commitment to accelerate infrastructure development, as indicated by augmented spending during the 11th Plan (2007 to 2012) and now in the 12th (2012-2017).
The total investment in infrastructure sectors is estimated to be Rs 55,746 billion11 in the 12th Plan,
which is roughly 8.2 per cent of GDP, as com- pared to about 7 per cent during the 11th Plan period. Table 2.13 reveals that the contribution of the private sector in total investments towards infrastructure development has progressively increased over the Plans.
Public sector investment showed a growth of 344 per cent between the 10th and the 12th Plans. But private investment grew by 1,343 per cent. The total invest-ment increased by about 566 per cent, at current pric-es. A large part of this growth can be attributed to the increasing private participation. In sectors like roads, ports and airports, where traditionally the public sector has been almost exclusively responsi-ble for their development, the private sector is rapid-ly becoming a reliable partner. As a result of invest-ments made during the last 60 years of planned development, the transport sector has expanded manifold in terms of capacity and spread (Annex). A total expenditure of Rs 14,793 billion towards the sector is projected in the 12th Plan. Table 2.15 gives the sectoral break-up.
TRANSPORT DEVELOPMENT IN INDIA
RAILWAYS
The Indian Railways had a modest beginning in 1853 when the first train journeyed from Mumbai to Thane, covering a distance of 34 km. In the next 50 years, the railway network expanded rapidly, and by 1900, the total length of the network (route kilo-metres) increased to 39,835 km. The rate of growth declined during the next 50 years, reaching 53,596 km in 1950-51. In the next 60 years, since the begin-ning of the Plan era, the route length increased to
11. This is roughly $930 billion at current exchange rates.
Table 2. 13 Investment in Infrastructure During 10TH and 11TH Plans [Rs Billion at Current Prices]
PARTICULARS 10TH PLAN 11TH PLAN 12TH PLAN*
GDP at Market Prices 165,988 336,045 681,632
Public Investment 6,511(78.3 )
15,368(63.3 )
28,908(51.8)
Private Investment 1,860(21.7 )
8,875(36.7 )
26,838(48.2)
Total Investment 8,371 24,243 55,746
Investment as Percentage of GDP
Public Investment 3.92 4.57 4.24
Private Investment 1.12 2.64 3.94
Total Investment 5.04 7.21 8.18
Source: Planning Commission (2013). Note: Figures in parenthesis are percentage shares.
NTDPC~Vol 02_Part 1~Ch 02.indd 42 15-04-2014 10.50.59 AM

NTDPC | TRENDS IN GROWTH AND DEVELOPMENT OF TRANSPORT 43
64,600 km by 2011-12 an overall growth of about 20.53 per cent.
Today, Indian Railways (IR) occupies a unique and crucial place in the country’s transport infrastruc-ture. IR, managed directly by the Ministry of Rail-ways, is the third largest railway network in the world under a single management with 7,500 railway stations, 9,549 locomotives, 55,339 passenger coaches, 2,39,321 freight cars and 64,600 route km. IR operates 12,000 passenger trains every day and 7,000 freight trains. It transports 2.8 million tonnes of freight traf-fic and 25 million passengers every day (Figure 2.7).
GAUGEIndian railways run on three gauges, though it is pro-posed to make the entire network single gauge. The size of the network (gauge-wise) as on 31 March 2012 is shown in Table 2.16. Currently, broad gauge (BG) contributes about 91 per cent of total track km, while it forms about 86.62 per cent of total route km. The rest of the network, barring hill/heritage railways, is progressively getting converted to BG. The BG network accounts for 97.9 per cent of passenger and almost 100 per cent of the freight traffic. Almost all double/multiple track sections and electrified routes are broad gauge (Figure 2.8). Meter and narrow gauges
Table 2. 14 Infrastructure Investment Mix Between Public and the Private Sector, 10TH and 11TH Plan Periods [Rs Billion at Current Prices]
PARTICULARS 10TH PLAN 11TH PLAN 12TH PLAN*
Roads and Bridges 1,393 4,531 9,145
• Public Sector 1,274(91.4)
3,606(79.6)
6,105(66.8)
• Private Sector 119(8.6)
925(20.4)
3,040(33.2)
Ports 206 445 1,978
• Public Sector 33(16.1)
82(18.5)
262(13.5)
• Private Sector 173(83.9)
363(81.5)
1,715 (86.8)
Airports 68 363 877
• Public Sector 42(61.9)
129(35.5)
175(19.9)
• Private Sector 26(38.1)
234(64.5)
702(80.1)
Railways (including MRTS) 944 2,429 6,434
• Public Sector 938(99.3)
2,284(94.0)
4,908(76.2)
• Private Sector 6(0.7)
145(6.0)
1,526(23.8)
Total Infrastructure Investment 8,372 24,243 55,746
Public Investment 6,511(77.8)
15,368(63.3)
28,908(51.8)
Private Investment 1,860(22.2)
8,875(36.7)
26,838(48.2)
Total Transport Sector Investment (Per cent Share in Infrastructure)
2,609(31.3)
7,769(32.6)
18,434(33.8)
Public Investment 2,285(87.6)
6,101(78.5)
11,450(62.1)
Private Investment 324(12.4)
1,668(21.5)
6,984(37.9)
Source: Planning Commission (2013).Note: Figures in parentheses are percentage shares. * The 10th Plan numbers have been arrived at by dividing the 10th Plan numbers at 2006-07 prices in the following ratio—Public Sector: Divided by 1.0965 and Private
Sector: Divided by 1.0856.
NTDPC~Vol 02_Part 1~Ch 02.indd 43 15-04-2014 10.51.00 AM

NATIONAL TRANSPORT DEVELOPMENT POLICY COMMITTEE | 201344
are mostly single line and non-electrified. Between 1950-51 and 2010-11, traffic density (million gtkm per running track km) increased from 4.29 to 23.17 on BG.
INDIAN RAILWAY ZONESWhether it is a remote village or developed metropo-lis, Indian Railways serves and connects rail users in every part of the country. IR is administered through 17 zonal railways. However, almost half of the route kilometres fall under five railway zones while the rest 12 together constitute 54 per cent (Table 2.17). The newly included zone (Metro Railway, Kolkata)
comprises only 25 km, while the Northern Zone has the highest coverage of 6,990 km.
The zonal railways are further divided into smaller operating units called divisions. There are 68 operat-ing divisions at present.
TRACTIONThe Indian railways run mainly on electric and diesel traction. Steam traction was almost phased out by the late 1990s. The shift from steam to diesel for passenger transport started in early 1960s, whereas the transition for freight movement had begun in mid-1950s. Diesel traction reached its
Table 2. 15 Proposed Public Expenditure on Transport, 12TH Plan [2012-17] [Rs Billion]
S. NO. SECTOR
CENTRE STATES TOTAL OUTLAYS
GBS IEBR TOTAL
1 Roads and Road Transport* 2,713 648 3,361 6,524 9,885
2 Railways 1,942 2,250 4,192 - 4,192
3 Ports and Shipping 70 220 290 43 333
4 Civil Aviation 170 162 332 51 383
Total 4,894 3,280 8,175 6,618 14,793
Source: Planning Commission (2013).Notes: * Includes Rural Roads (Rs 1,265 billion). 1) GBS - Gross Budgetary Support.
IEBR - Internal and Extra Budgetary Resources. 2) The State Outlays for 12th Five Year Plan have been estimated on the basis of their shares in the sectoral outlays in 11th Plan. 3) The proposed expenditure on Urban Transport are not included.
Table 2. 16 Gauge-Wise Indian Railways Network [Per cent Shares]
GAUGE ROUTE KM RUNNING TRACK KM TOTAL TRACK KM
Broad Gauge (1676 mm) 86.62 89.96 90.99
Metre Gauge (1000 mm) 9.83 7.49 6.78
Narrow Gauge (762 mm and 610 mm) 3.56 2.56 2.23
Total (km) 64,600 89,801 115,062
Source: Ministry of Railways (2012).Note: ‘Route kilometre’ is a unit of distance, measuring the distance by rail between two points on the railway network whereas ‘Running track km’ is the sum of all running lines (counting each line of doubled, tripled, etc. lines separately) between two points.
NTDPC~Vol 02_Part 1~Ch 02.indd 44 15-04-2014 10.51.01 AM

NTDPC | TRENDS IN GROWTH AND DEVELOPMENT OF TRANSPORT 45
Figure 2. 8 Percentage Gauge Share in Total Track Kilometres
Source: NTDPC Research.
Metre Gauge [1676 mm]
Narrow Gauge[762 mm and 610 mm]
Broad Gauge[1676 mm]
91
27
Figure 2. 7 Indian Railways Network
Anantnag
Ambandura
Jhajjar
Dauram Madhepura
Mairabari
Nawadih
Chandan RampurhatDumka
KumradolPirargarhia
Manihari
Maheshpur
Koderma
Bakrichampi
Lohardaga
KatngiNarkher
Wansjaliya
KotturuHarihar
Velenkanni
Matnasibpur
Balgona
Dharangadhara
DaboiChhotaudepur
Samni
Dahej
Tarakeshwar
Shantipur
Talpur
PhulwariaBargania
Churaru-Takarala
Jagdishpur
Giridih
Nagapa anam
NekpurNathdwara
LonandPhaltan
Bishnupur
Kuju
Abohar
Fatahabad
Pushkar Golakganj
Namakkal
Gadwal
Pandurangaswami
Vishnupuram
Jahanpad
KadurKanvihalli
Kommarapudi
Metpalli
JhalawarRamganjmandi
GoindwalTaran Taran
Dhanwar
New Coochbehar
Source: Ministry of Railways.
BENGALURU
NTDPC~Vol 02_Part 1~Ch 02.indd 45 15-04-2014 10.51.19 AM

NATIONAL TRANSPORT DEVELOPMENT POLICY COMMITTEE | 201346
highest share (56 per cent) for passenger movement in 2000-01, while in case of freight, it comprised 62 per cent in 1980-81.
Gradually, electric traction was introduced, partic-ularly on high density routes. The share of electric traction, which was 2 per cent for passengers (loco) and 5 per cent for passenger (EMU), and 1 per cent for freight in 1950-51, increased to 38.2 per cent, 13.3 per cent and 63.5 per cent respectively in 2011-12 (Figures 2.9 and 2.10).
ROLLING STOCKOver the years, there has been improvement in design and capacity of locomotives, wagons and coaches through introduction of new technology. While the number of wagons has come down, total capacity has gone up. Similarly, seating capacity per coach has risen (Figure 2.11).
Passenger traffic increased by about 1,460 per cent, from 67 billion in 1950-51 to 1,047 bpkm in 2011-12. Freight traffic grew by about 1,400 per cent, from 44 to 668 BTKM during the same period12. During the 11th Plan period, CAGR for freight traffic was about 6.8 per cent as against the long-term CAGR of 4.6 per cent. However, the achievement of the rail-ways in freight movement would have been more impressive had it not faced capacity constraints. In the 12th Plan, the rate of growth is anticipated to be about 11.5 per cent.13.
The bulk of freight traffic is accounted for by 11 com-modities. These include coal, foodgrains, iron and
steel, iron ore, cement, POL, fertilisers, limestone and dolomite, stone (including gypsum) other than marble, salt and sugar. These commodities together accounted for 91.1 per cent of total freight traffic in 2011-12.
RECENT INITIATIVES FOR CAPACITY AUGMENTATIONTwo important developments that have taken place in recent years need special mention. These are: • Special Railways Safety Fund (SRSF) in the 9th
Plan to be utilised to rehabilitate the railway network and other assets.
• Dedicated Freight Corridors (DFCs), which have been envisaged to augment rail freight transportation capacity, particularly on the Eastern and Western Corridors. The existing trunk routes of Howrah-Delhi on the Eastern Corridor and Mumbai-Delhi on the Western Corridor are currently saturated with line capacity utilisation varying between 115 per cent and 150 per cent 14.
While the former initiative helped the railways meet increased traffic demand in the short and medium terms, a DFC is expected to ensure that long run traf-fic demand is met adequately and efficiently. Rail-ways need several such DFCs.
ROADS AND ROAD TRANSPORT
Along with railways, road transport caters to the bulk of domestic transport demand. In some areas, this is the only means of transport. Public invest-ment over six decades has produced a massive road network. The total road length increased from about
12. Ministry of Railways (2012); Planning Commission (2013).13. NTDPC Research.14. Dedicated Freight Corridor Corporation of India Ltd (DFCCIL).
Table 2. 17 Distribution of Route Kilometres by Railway Zone
ZONES ROUTE KILOMETRES
Northern, New Delhi 6,990
North Western, Jaipur 5,502
Southern, Chennai 4,994
South Central,Secunderabad 5,810
Western, Mumbai 6,440
Balance (12 zones) 34,864
Total Route Km 64,600
Source: Ministry of Railways (2012).
NTDPC~Vol 02_Part 1~Ch 02.indd 46 15-04-2014 10.51.23 AM

NTDPC | TRENDS IN GROWTH AND DEVELOPMENT OF TRANSPORT 47
400,000 km to 4.7 million km between 1951 and 2011. Surfaced roads increased from 157,000 km to around 2.5 million km. Road density in India is now nearly 1.42 km per sq km, which compares favourably with many countries. The share of the surfaced road length in the total road length also reflects healthy improvement. Surfaced road length accounted for 54 per cent of total road length in 2011, compared with 39 per cent in 1951 (Figure 2.12).
The Indian road network can be divided into three main categories: • National Highways, with an aggregate length
of 70,934 km in 2010-11 and which constitute about 1.5 per cent of network, carrying about 40 per cent of road-based traffic;
• State Highways and other Public Works Department (PWD) roads which constitute the secondary system of road transporta-tion, with an aggregate length of about 1.2 million km, about 25 per cent of the total road network;
• The rural road network, almost 60 per cent of the total network.
The development of roads got a big boost with the launching of the NHDP and the Pradhan Mantri Gram Sadak Yojana (PMGSY). While NHDP aimed at primarily strengthening and widening high-density corridors of National Highways, PMGSY was designed to improve the accessibility of habita-tions in rural areas. The development of National
Figure 2. 9 Percentage of Passenger Movement Kilometres by Traction Mode
Source: Ministry of Railways (2012).Note: @ Includes DHMU & DEMU.
100
75
50
25
0
Steam Diesel@
Electric Loco Electric Emu
1950-51 1960-61 1970-71 1980-81 1990-91 2000-01 2011-12
Per c
ent o
f Tra
in k
ms
Diesel
Figure 2. 10 Percentage of Freight Movement Kilometres by Traction Mode
Source: Ministry of Railways (2012).
Steam
Electric Loco
Per c
ent o
f Tra
in k
ms
100
80
60
40
20
01950-51 1960-61 1970-71 1980-81 1990-91 2000-01 2011-12
NTDPC~Vol 02_Part 1~Ch 02.indd 47 15-04-2014 10.51.24 AM

NATIONAL TRANSPORT DEVELOPMENT POLICY COMMITTEE | 201348
Figure 2. 11 Carrying Capacity Per Wagon on Broad Gauge
Source: Ministry of Railways (2012).Note: $: Excludes departmental service wagons and brake vans.
Number $(000) Average Capacity (Tonnes)
1950-51 1960-61 1970-71 1980-81 1990-91 2000-01 2011-12
400
300
200
100
0
Highways and rural roads received special atten-tion of the planners. However, similar attention was not assigned to State Highways and Major District Roads.
Table 2.18 presents the growth of the road network, category-wise.
The length of National Highways (NH) reported a CAGR of 2.2 per cent between 1951 and 2011. NHDP has contributed largely towards improving the capacity and road quality of NHs. The length of NHs with two lanes increased from 25,395 km in 1996 to 41,518 km in 2012, and those with four lanes and above from 1,170 km to 17,774 km. During the same period, the combined network of State Highways and other PWD roads posted a sevenfold expansion in length with a CAGR of 3.2 per cent.
The highest CAGR of 4.4 per cent from 1951 to 2011 was registered by rural roads comprising Panchay-ati roads, and roads constructed under the Jawahar Rozgar Yojana (JRY) and PMGSY. Till the advent of PMGSY, rural roads were being constructed under various programmes. These included Mini-mum Needs Programmes, state sector programmes, National Rural Employment Programme (NREP), Rural Landless Employment Guarantee Programme (RLEGP) and JRY. After assessing the requirement of connectivity to habitations, the PMGSY was launched in December 2000 with the objective of pro-viding connectivity in phases, depending upon the population of a habitation. In the first phase, habita-tions with a minimum population of 1,000 in plain areas and 500 in tribal, hilly and desert areas were taken up. The second phase envisages providing all-
weather road connectivity to habitations with popu-lations of 500 in plain areas and 250 in tribal and hilly areas. As a result of PMGSY and other non-PMGSY programmes, the accessibility to habitations has improved considerably (Table 2.19).
Despite the steady growth rate, the development of the rural road network has not been balanced. While certain states provide 100 per cent connectivity, some others still have a large number of habitations with poor accessibility.
Both freight and passenger traffic continue to increase. While in 1950-51, freight and passenger traffic was 6 BTKM and 31 bpkm respectively, freight traffic increased to 1,385 BTKM while passenger traf-fic reached 9,329 bpkm in 2011-1215. Percentage share of road freight has increased from 12 per cent in 1950-51 to 67 per cent in 2011-12 and passenger traffic from 32 per cent to 90 per cent.
CIVIL AVIATION
Civil aviation arrived in India in 1911 when an air-craft flew from Allahabad to Naini, covering a short distance of 10 km. The two World Wars provided a stimulus to the sector. A number of airlines were established after World War II. However, significant development started only in 1953 when Indian Air-lines and Air India were set up.
The annual growth in domestic passenger traffic from 1960-61 to 1985-86 was around 10 per cent per annum. The 7th Plan (1985-90) observed that ‘domes-tic traffic has registered an average increase of 10 per cent and by all indications this trend is likely to
15. NTDPC Research.
NTDPC~Vol 02_Part 1~Ch 02.indd 48 15-04-2014 10.51.24 AM

NTDPC | TRENDS IN GROWTH AND DEVELOPMENT OF TRANSPORT 49
Table 2. 18 Growth of Road Network
ROAD NETWORK BY CATEGORIES (IN KM): 1951 TO 2011
ROAD CATEGORY 1951 1961 1971 1981 1991 2001 2011
National Highways 19,811 23,798 23,838 31,671 33,650 57,737 70,934*
Per cent Share 5.0 4.5 2.6 2.1 1.4 1.7 1.5
State Highways and Other PWD Roads 173,273 257,125 333,598 516,254 636,746 868,101 1,169,225
Per cent Share 43.4 49.0 36.5 34.8 27.4 25.7 24.9
Rural Roads 206,408 197,194 354,530 628,865 1,260,430 1,972,016 2,749,805
Per cent Share 51.7 37.6 38.7 42.3 54.2 58.5 58.6
Urban Roads -- 46,361 72,120 123,120 186,799 252,001 411,840
Per cent Share 0.0 8.8 7.9 8.3 8.0 7.5 8.8
Project Roads -- -- 130,893 185,511 209,737 223,665 288,539
Per cent Share 0.0 0.0 14.3 12.5 9.0 6.6 6.2
Total 399,492 524,478 914,979 1,485,421 2,327,362 3,373,520 4,690,343
Source: Ministry of Road Transport and Highways (2012a).Note: *76,818 kilometres as on 31 March 2012.
Source: Ministry of Road Transport and Highways (2012a).
Figure 2. 12 Total Road Length vis-à-vis Surfaced Road Length [Million Km]
1950-51 1970-71 2000-2001 2010-11
5
7
4
3
2
1
0
Total Length of Surfaced Roads
Total Length of Roads
0.40.9
0.4
3.6
1.6
4.7
2.5
0.2
NTDPC~Vol 02_Part 1~Ch 02.indd 49 15-04-2014 10.51.25 AM

NATIONAL TRANSPORT DEVELOPMENT POLICY COMMITTEE | 201350
continue, unless otherwise restrained’. Efforts were made to peg the growth rate, since the sector is heavy on fuel consumption and foreign exchange. In fact, the last decade of the 20th century witnessed stag-nant growth.
The Air Corporations Act, 1953, was repealed in 1994, paving the way for entry of private airlines. A large number entered the market, and some perished. The overall seat capacity increased dra-matically, which led to a fall in fares, which further stimulated the growth of air traffic. The private sec-tor also contributed towards provision of airport infrastructure facilities. In the last five years, the private sector has invested about Rs 300 billion (at 2011-12 prices) in airport modernisation, mainly in development of greenfield airports at Hyderabad and Bengaluru, and modernisation of Delhi and Mumbai airports.
In the last decade, the sector has grown at a phe-nomenal pace, and India has emerged as the world’s ninth largest civil aviation market. There has been enhanced national and international connectiv-ity with 74 foreign airlines operating to/from vari-ous destinations. The number of scheduled aircraft departures per day for domestic and international segments has increased from 503 and 79 respectively in 2001-02 to 1,538 and 236 in 201216. In 2001-02, there were only five Indian airlines in operation with 132 aircraft. By 2010-11, the number of scheduled opera-tors had increased to 13 with a total fleet size of 340. India has also witnessed significant growth in the number of non-scheduled airline operators, from 36 in 2000 to 146 in 2012. The number of aircraft with non-scheduled operators increased from 106 in 2000 to 409 in 2010. Similar expansion has been witnessed in airport infrastructure; the number of operational airports increased from 50 in 2000 to 84 in 2012.
Figure 2. 13 Passenger Throughput at Indian Airports [Millions]
Source: Ministry of Civil Aviation (2012).
1995-96 2000-01 2004-05 2011-120
50
100
150
Domestic International
26 28
40
122
41
191411
Table 2. 19 Village Connectivity to All-Weather Roads
PARTICULARS 1950-51 1960-61 1970-71 1980-81 1990-91 2000-01 2010-11
Per cent Villages with 1000+ Population Connected with All- Weather Roads 32 36 40 46 73 90 95
Overall Per cent Village Connectivity 20 22 25 28 44 54 68
Source: NTDPC Research; Planning Commission (2011).
16. Air Transport Statistics, 2001-02 and ICAO ATR form as furnished by all airlines.
NTDPC~Vol 02_Part 1~Ch 02.indd 50 15-04-2014 10.51.25 AM

NTDPC | TRENDS IN GROWTH AND DEVELOPMENT OF TRANSPORT 51
Passenger throughput at Indian airports dur-ing 2011-2012 was 162.3 million (Figure 2.13), of which 121.51 million or about 75 per cent were domestic passengers and the rest international. The percentage of domestic passengers to the total pas-senger throughput has gone up from about 67 per cent in 2000-01 to about 75 per cent in 2011-12, imply-ing faster growth of domestic compared to interna-tional passenger throughput. In the last 11 years, the domestic segment has grown at a Compound Annual Growth Rate (CAGR) of about 14.3 per cent vis-à-vis 10.2 per cent for the international segment.
Cargo throughput at Indian airports during 2011-12 was 2.28 million metric tonnes. The Indian govern-ment adopted an ‘Open Skies’ policy for air cargo traffic in the early 1990s, under which Indian and for-eign carriers were allowed to operate scheduled and non-scheduled cargo services to/from any airport in India. As a result, international air cargo traf-fic increased from about 0.9 million metric tonnes (MMT) in 2000-01 to 2.28 MMT in 2011-12. Total freight traffic handled by Indian airports has increased at a CAGR of about 9.2 per cent in the last 11 years to reach 2.28 MMT by 2012. Domestic cargo, buoyed by increasing domestic trade, has grown at a pace of 8.4 per cent, while international cargo grew at nearly 9.In spite of this high growth, India continues to be a small player in the international arena. The air traffic density (1,000 passengers per million urban population17) in India is very low at 72. China (282) is four times higher, Brazil (231) three times, Malay-sia (1,225) 17 times, US (2,896) 40 times and Sri Lanka (530) more than seven times higher. China’s domestic
traffic is five times that of India’s. Moreover, India has an aircraft for every 2.89 million people in com-parison to 1.14 million in China. In terms of freight carriers, out of 15,750 freight carriers globally, India has just 13 scheduled and 149 non-scheduled opera-tors.
These data—as also the traffic densities of countries such as China and Indonesia—indi-cate the kind of growth that can be expected as Indian incomes rise in the next couple of decades and beyond.
PORTS, SHIPPING AND IWT
Global economic integration relies heavily upon efficient maritime transport due to its unparalleled physical capacity and ability to carry freight over long distances and at low costs. Seaborne trade rep-resents more than 80 per cent of international trade. As high as about 95 per cent of India’s trade volume (around 70 per cent in terms of value) is moved by sea. India’s maritime sector comprises ports, ship-ping, shipbuilding and ship repair, as well as inland water transport systems.
The Indian peninsula is also strategically located between the Atlantic Ocean in the west and the Pacif-ic Ocean in the east, with a 7,517 km-long coastline. But in spite of its significance and low cost of opera-tion, the share of water transport in domestic freight traffic is just about 6 per cent18 compared to that of other large economies such as China (47 per cent), USA (12.4 per cent) and Japan (34 per cent)19.
Figure 2. 14 Cargo Throughput at Indian Airports [‘000 Metric Tonnes]
Source: Ministry of Civil Aviation (2012).
1995-96 2000-01 2004-05 2011-120
500
1,000
1,500
Domestic International
17. FICCI (2011).18. NTDPC Research.19. European Commission (2012).
458
570
831
1,468
812
490
333222
NTDPC~Vol 02_Part 1~Ch 02.indd 51 15-04-2014 10.51.26 AM

NATIONAL TRANSPORT DEVELOPMENT POLICY COMMITTEE | 201352
PORTSToday, India has 12 Major Ports and 200 notified Non-Major Ports along the coastline and islands. Major Ports are administered by the Union Govern-ment under the Major Port Trusts Act of 1963, with one exception, Ennore Port, which is administered under the provisions of the Companies Act, 1956. Non-Major Ports are administered by nine mari-time states and three union territories within their respective coastlines.
In keeping with the general policy of economic lib-eralisation, the port sector was opened to private sector participation in 1997 through an amendment in the Major Port Trusts Act. Accordingly, a regula-tory body known as Tariff Authority for Major Ports (TAMP) was introduced for regulating both vessel-related and cargo-related tariffs. TAMP was also made responsible for regulating rates for lease of
properties in respect of Major Port Trusts and pri-vate operators.
TRAFFIC In 1950-51, there were six Major Ports in India: Kolkata, Mumbai, Chennai, Cochin, Mormu-gao (Goa) and Vishakhapatnam. Subsequently, Kand-la, New Mangalore, Paradip, Haldia and Tuticorin were declared Major Ports. In 1989, another major port, Jawaharlal Nehru Port Trust (JNPT), Mumbai came into existence, followed by Ennore in 2001.
During 2011-12, total cargo handled by Major and Non-Major ports was 914 million tonnes with the 13 Major Ports handling nearly 61 per cent of it—560 million tonnes.
Between 1960-61 and 1990-91, total traffic grew at a CAGR of 4.9 per cent, with traffic at Major and Non-Major Ports growing at 5.2 per cent and 2.4 per cent
Table 2. 20 Composition of Traffic at Major Ports[Per cent]
YEAR POL IRON ORE CONTAINER
1960-61 28 16 --
1990-91 42 21 13
2011-12 31 11 21
Source: Ministry of Shipping (2012).
Figure 2. 15 Comparison of Air Traffic Density Across Select Countries [1,000 Passengers Per Million Urban Population]
Source: Ministry of Civil Aviation (2012).Note: Traffic data pertains to 2010 for India and 2008-09 for other economies.
US UK Malaysia South Korea Sri Lanka Indonesia China Mexico Russia Brazil India Bangladesh
4272231243268282283
840
1,225
1,587
2,8963,000
2,250
1,500
750
0
530
NTDPC~Vol 02_Part 1~Ch 02.indd 52 15-04-2014 10.51.26 AM

NTDPC | TRENDS IN GROWTH AND DEVELOPMENT OF TRANSPORT 53
respectively. The period from 1990-91 to 2011-12 wit-nessed an overall traffic CAGR of 8.6 per cent with traffic at the Major Ports and Non-Major Ports grow-ing at 6.4 per cent and at about 18 per cent respectively. The increased throughput of Non-Major Ports has been the effect, to a large extent, of capacity satura-tion at the Major Ports. Encouraging initiatives by many maritime states for the development of Non-Major Ports through the participation of the private sector also contributed to this shift.
The increase in quantity of cargo handled at Non-Major Ports from 2000-01 to 2011-12 was mainly driven by traffic growth in Gujarat, Andhra Pradesh, Goa and Maharashtra. In 2000-01, Gujarat accounted for more than 80 per cent of the total traffic handled at the Non-Major Ports and continued to hold more than 73 per cent share in 2011-12, followed by Andhra Pradesh (13 per cent), Maharashtra (5.6 per cent), Goa (4.1 per cent), Odisha (1.4 per cent) and Tamil Nadu (0.3 per cent). The remaining 2.4 per cent was handled by all the other maritime states/union territories (UTs).
COMPOSITION OF TRAFFIC The composition of cargo traffic at Major Ports has changed significantly over the years (Table 2.20). The cargo composition at Non-Major ports did not show any pronounced shift with POL and its products being the single largest commodity with about 55 per cent and about 44 per cent in 2001-02 and 2011-12 respectively.
CAPACITY Over the years, cargo handling capacity of Major Ports has steadily increased. However, traffic demand clearly outpaced capacity additions, result-ing in port congestion. In 1984-85, total capacity utili-sation was 81 per cent which increased to 95 per cent in 1990-91, indicating high stress on the available port infrastructure. Capacity utilisation remained very
high during the 1990s. Due to recent capacity addi-tions, utilisation at Major Ports came down to about 80 per cent in 2011-12. Similarly, Non-Major Ports, which had a capacity utilisation of 81 per cent in 2006-07, saw a decline to about 64.5 per cent in 2011-12.
Despite this, capacity utilisation at both Major and Non-Major Ports have been way above the identified optimum capacity utilisation of 70 per cent, implying that the cargo evacuation facilities are under great strain.
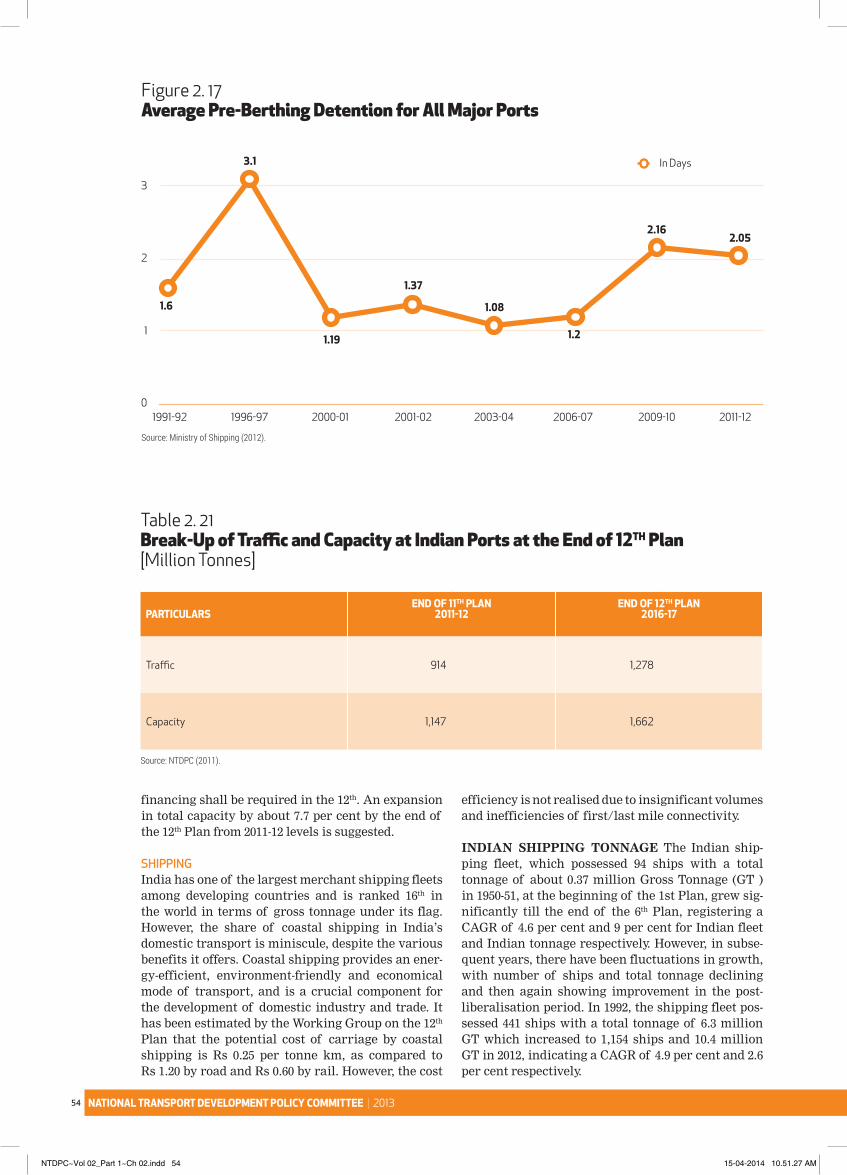
EFFICIENCY PARAMETERS The performance of Indian ports has generally deteriorated over the years except for a brief period from the late 1990s to the mid 2000s. • Average pre-berthing detention (PBD) of ves-
sels rose from 1.6 days in 1991-92 to 3.1 days in 1996-97, then saw a decline till 2004-05, reaching an encouraging level of around one day. Howev-er, port efficiency subsequently saw a dip as the detention time again started increasing and then gradually declined to 2.05 days in 2011-12.
• Average turn round time (TRT) increased from 6.7 days in 1991-92 to 7.8 days in 1996-97, after which it declined till 2003-04 when it was 3.3 days. It then increased gradually to 4.63 days in 2009-10. However, in 2011-12, average TRT dropped to 4.56 days.
The gap between the growth in traffic and growth of port capacity is apparently widening. Port traffic is expected to grow by about 40 per cent, from 914 mil-lion tonnes at the end of 11th Plan to 1,278 million tonnes by the end of the 12th Plan. Rapid upscaling of port capacities, particularly in terms of deeper drafts for bigger vessels, modern cargo handling facilities, swift cargo evacuation, and commensurate
Source: Ministry of Shipping (2012).
Figure 2. 16 Growth in Capacity and Traffic at Major Ports [Million Tonnes]
1984-85 2001-02 2004-05 2006-07 2011-120
200
400
600
800
Traffic Capacity
690
560
NTDPC~Vol 02_Part 1~Ch 02.indd 53 15-04-2014 10.51.26 AM
NATIONAL TRANSPORT DEVELOPMENT POLICY COMMITTEE | 201354
Table 2. 21 Break-Up of Traffic and Capacity at Indian Ports at the End of 12TH Plan [Million Tonnes]
PARTICULARSEND OF 11TH PLAN
2011-12END OF 12TH PLAN
2016-17
Traffic 914 1,278
Capacity 1,147 1,662
Source: NTDPC (2011).
financing shall be required in the 12th. An expansion in total capacity by about 7.7 per cent by the end of the 12th Plan from 2011-12 levels is suggested.
SHIPPINGIndia has one of the largest merchant shipping fleets among developing countries and is ranked 16th in the world in terms of gross tonnage under its flag. However, the share of coastal shipping in India’s domestic transport is miniscule, despite the various benefits it offers. Coastal shipping provides an ener-gy-efficient, environment-friendly and economical mode of transport, and is a crucial component for the development of domestic industry and trade. It has been estimated by the Working Group on the 12th Plan that the potential cost of carriage by coastal shipping is Rs 0.25 per tonne km, as compared to Rs 1.20 by road and Rs 0.60 by rail. However, the cost
efficiency is not realised due to insignificant volumes and inefficiencies of first/last mile connectivity.
INDIAN SHIPPING TONNAGE The Indian ship-ping fleet, which possessed 94 ships with a total tonnage of about 0.37 million Gross Tonnage (GT )in 1950-51, at the beginning of the 1st Plan, grew sig-nificantly till the end of the 6th Plan, registering a CAGR of 4.6 per cent and 9 per cent for Indian fleet and Indian tonnage respectively. However, in subse-quent years, there have been fluctuations in growth, with number of ships and total tonnage declining and then again showing improvement in the post-liberalisation period. In 1992, the shipping fleet pos-sessed 441 ships with a total tonnage of 6.3 million GT which increased to 1,154 ships and 10.4 million GT in 2012, indicating a CAGR of 4.9 per cent and 2.6 per cent respectively.
Source: Ministry of Shipping (2012).
Figure 2. 17 Average Pre-Berthing Detention for All Major Ports
1991-92 1996-97 2000-01 2001-02 2003-04 2006-07 2009-10 2011-120
1
2
3
In Days
1.6
3.1
1.19
1.37
1.08
1.2
2.162.05
NTDPC~Vol 02_Part 1~Ch 02.indd 54 15-04-2014 10.51.27 AM

NTDPC | TRENDS IN GROWTH AND DEVELOPMENT OF TRANSPORT 55
In 1950, the share of coastal shipping tonnage in the total tonnage was as high as 57 per cent, but it showed a steep decline to reach a mere 8.7 per cent in 1990. In 2012, the share of coastal shipping tonnage increased marginally over the previous year to 10.4 per cent, while overseas tonnage constituted 89.6 per cent.
The average tonnage per vessel for coastal shipping in 1950 was 2,900 GT. This increased slightly to 3,220 GT by 1990, but it declined considerably to just 1,390 GT by 2012. In the case of overseas shipping, the average tonnage per vessel, which was 7,260 GT in 1950, increased significantly to 21,500 GT in 1990, and further to 26.700 GT in 2012.
However, the share of the Indian fleet in the carriage of the country’s overseas trade has declined steep-ly in the last seven years. In 1990, the Indian fleet’s share was as high as 35.5 per cent of the overseas trade, and the balance was carried by foreign ves-sels. But by 2011-12, the Indian flag share was only 10.9 per cent.
AGE STRUCTURE OF INDIAN TONNAGE In 1993, the age of around 12 per cent of the Indian fleet was below five years, 49 per cent between six and 15 years, and only 15 per cent above 20 years. But by 2012, about 39 per cent of the fleet was above 20 years of age, and only 25.6 per cent below five years. In 2011, 50 per cent of the world tonnage was less than nine years of age.
INLAND WATER TRANSPORT (IWT)Inland waterways in India are underdeveloped as a mode of transportation, despite their inherent advantages of fuel efficiency, environment friendli-
ness, hinterland connectivity to less-developed rural regions, and its capacity to shift large volumes of cargo from congested roads. Development of IWT can substantially reduce accidents as well as address the growing carbon footprint. India has 14,500 km of navigable waterways, including rivers, backwaters and canals. A significant proportion of this, stretch-ing over 5,200 km of rivers and 485 km of canals, are suitable for mechanised transportation.
IWT did not receive adequate focus till the 6th Plan when the National Transport Policy Committee (1980) recommended setting up of the Inland Water-ways Authority of India (IWAI). The Authority, set up in 1986, was charged with the responsibility of the development of National Waterways and provid-ed the much required boost to IWT.
At present, there are five National Waterways, NW1—River Ganga (1,620 km), NW2—River Brah-maputra (891 km), NW3—West Coast Canal (205 km), NW4—Kakinada to Puducherry Canal System along with Rover Godavari and River Krishna (1,095 km), and NW5—the Brahmani and Mahanadi delta along with the East Coast Canal (623 km). River Barak is likely to be declared as the sixth NW. Besides Nation-al Waterways, several other waterways are exten-sively used for IWT; this includes Goa Waterways for transportation of iron ore for export, and Mumbai Waterways for coal, steel, etc.
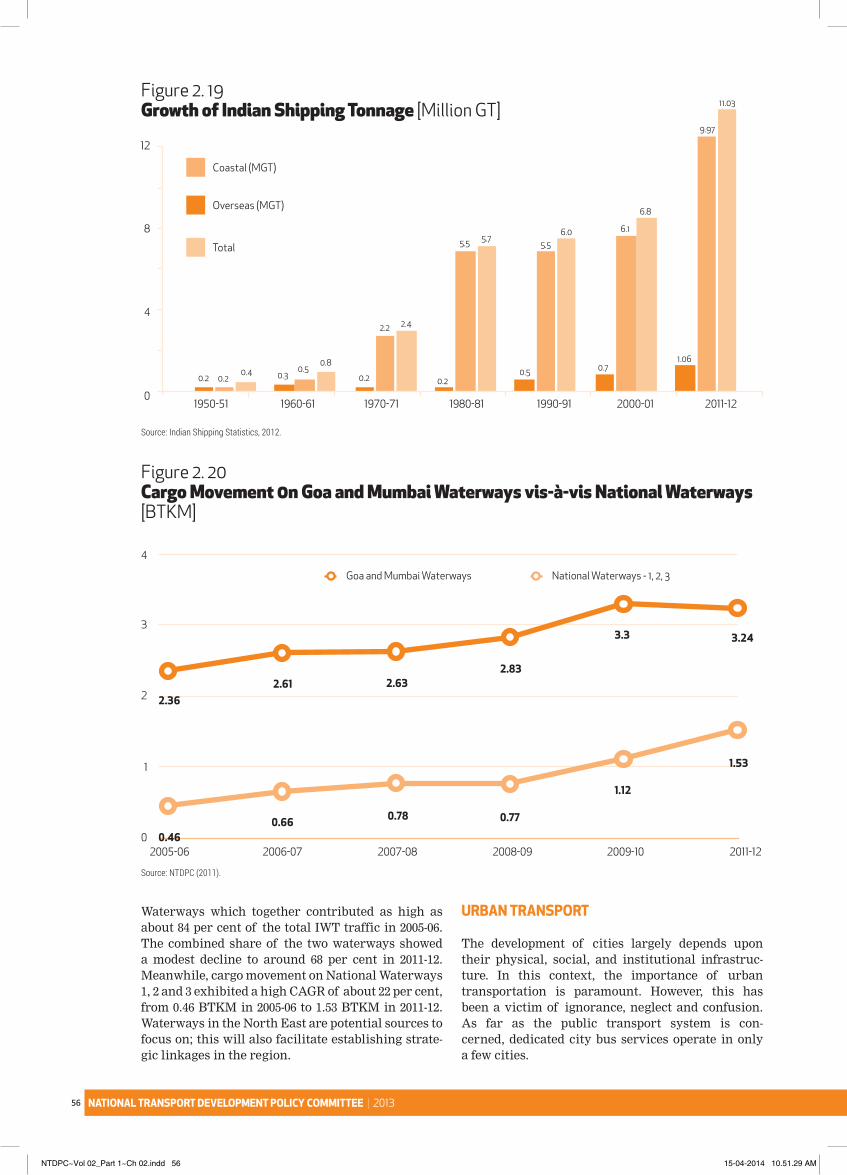
CARGO MOVEMENT The total cargo traffic han-dled by IWT rose from 1.5 BTKM in 1999-2000 to 2.82 BTKM in 2005-06, a CAGR of 11.1 per cent. Traf-fic further increased to 4.77 BTKM in 2011-12. Bulk of this traffic is moved through Goa and Mumbai
Source: Ministry of Shipping (2012).
Figure 2. 18 Average Turnaround Time for Major Ports
1991-92 1996-97 2000-01 2003-04 2006-07 2009-10 2011-120
2
4
6
8
In Days
6.7
7.8
4.24
3.33
3.85
4.564.63
NTDPC~Vol 02_Part 1~Ch 02.indd 55 15-04-2014 10.51.27 AM
NATIONAL TRANSPORT DEVELOPMENT POLICY COMMITTEE | 201356
Waterways which together contributed as high as about 84 per cent of the total IWT traffic in 2005-06. The combined share of the two waterways showed a modest decline to around 68 per cent in 2011-12. Meanwhile, cargo movement on National Waterways 1, 2 and 3 exhibited a high CAGR of about 22 per cent, from 0.46 BTKM in 2005-06 to 1.53 BTKM in 2011-12. Waterways in the North East are potential sources to focus on; this will also facilitate establishing strate-gic linkages in the region.
URBAN TRANSPORT
The development of cities largely depends upon their physical, social, and institutional infrastruc-ture. In this context, the importance of urban transportation is paramount. However, this has been a victim of ignorance, neglect and confusion. As far as the public transport system is con-cerned, dedicated city bus services operate in only a few cities.
Source: Indian Shipping Statistics, 2012.
Figure 2. 19 Growth of Indian Shipping Tonnage [Million GT]
2000-01 2011-121950-51 1960-61 1970-71 1980-81 1990-910
4
8
12
Coastal (MGT)
Total
0.2 0.3 0.2 0.2
0.70.5
5.56.0
1.06
9.97
11.03
6.1
6.8
5.5 5.7
2.2 2.4
0.50.8
0.20.4
Overseas (MGT)
Source: NTDPC (2011).
Figure 2. 20 Cargo Movement 0n Goa and Mumbai Waterways vis-à-vis National Waterways [BTKM]
2005-06 2006-07 2007-08 2008-09 2009-10 2011-120
1
2
3
4
National Waterways - 1, 2, 3Goa and Mumbai Waterways
0.46
2.362.61 2.63
2.83
3.3 3.24
0.66 0.78 0.77
1.12
1.53
NTDPC~Vol 02_Part 1~Ch 02.indd 56 15-04-2014 10.51.29 AM

NTDPC | TRENDS IN GROWTH AND DEVELOPMENT OF TRANSPORT 57
India has been slow to urbanise. As of 2011, 32 per cent of India’s population is conservatively clas-sified as ‘urban’. This is much lower than in other major developing countries for example, 45 per cent in China, 54 per cent in Indonesia, 78 per cent in Mexico, and 87 per cent in Brazil. However, all these countries have much higher per capita incomes.
Still, India’s urban population concentration in larg-er Class 1 (100,000+) and million-plus cities has been steadily increasing, leading to greater challenges in urban transport. As presented in Table 2.22, the percentage of the urban population living in Class I towns has steadily increased from 26 per cent in 1901 to 69 per cent in 2001.
According to the 2011 census, a total of 468 Class I urban agglomerations/cities are believed to consti-
tute more than 70 per cent of the urban population. Given that the issues of urban transport and private vehicle use are essentially concentrated in larger cities, this is an important base trend for projecting urban transport requirements.
Cities have witnessed increasing usage of private vehicles because they are yet to develop adequate public transport systems to meet increased travel requirements. Since 1991, the total number of regis-tered motor vehicles has gone up from 21.4 million to 141.8 million, a more than sixfold increase. Two-wheeler private transport has gone up from 14.2 mil-lion to 101.8 million, a rise of more than 13 times (Figure 2.22). Among the 53 million-plus cities as on March 31, 2011, Delhi had the largest number of registered
Source: IIHS (2011).
Figure 2. 21 Geographical Dispersion of Urban Growth Areas and Projections for 2031
Population Size [Millions]
< 0.10.1 – 0.5
0.5 – 11 – 5
> 5
Source: Census of India, 1971- 2001. UN, 2007. IIHS analysis, 2009-10.
Source: Census of India, 1971- 2001. UN, 2007. IIHS analysis, 2009-10. Source: Census of India, 1971- 2001. UN, 2007. IIHS analysis, 2009-10.
Source: Census of India, 1971- 2001. UN, 2007. IIHS analysis, 2009-10.
W. PAKISTAN
E. PAKISTAN
TIBET
NEPAL
1951
2011 2031
1991
INDIA
DELHI[8.2]
MUMBAI[12.3]
KOLKATA[10.9]
CHENNAI[5.3]
AHMADABAD[8.6]
AHMADABAD[6.7]
MUMBAI[20]
MUMBAI[28.6]
PUNE[5.0]
PUNE[704]
BENGALURU[7.2]
BENGALURU[10.6]
HYDERABAD[6.7]
SURAT[6.3]
HYDERABAD[9.9]
KOLKATA[15.5]
KOLKATA[22.3]
KANPUR[5.1]
CHENNAI[15.5]
CHENNAI[11.1]
DELHI[16.9]
DELHI[24.4]
NTDPC~Vol 02_Part 1~Ch 02.indd 57 15-04-2014 10.51.33 AM

NATIONAL TRANSPORT DEVELOPMENT POLICY COMMITTEE | 201358
motor vehicles (7.2 million), followed by Bengalu-ru (3.8 million), Chennai (3.5 million), Hyderabad (3 million) and Pune (2.1 million). The five largest cit-ies accounted for 49.3 per cent of the total registered motor vehicles of these 53 cities. Delhi’s registered motor vehicle population exceeded the combined vehicle population in Chennai, Kolkata, Lucknow and Mumbai. Over the last decade or so, the vehicle ownership rate (number of vehicles per 1,000 people) in metropoli-tan cities has seen a significant rise. Five cities have rates in excess of 500 as per the Road Transport Year-book 2009-10 and 2010-11. Nearly 28 per cent (39.7 mil-lion) of the total vehicles in the country (141.8 mil-lion), are in million-plus cities alone. In 2011, with nearly 17 million vehicles, four big cities—Delhi, Bengaluru, Chennai and Hyderabad—alone consti-tuted 12.3 per cent. Delhi, which has around 1.4 per cent of the Indian population, accounts for nearly 5 per cent of all motor vehicles. According to the sta-
tistics provided by the Ministry of Road Transport and Highways, the annual growth rate of motor vehi-cle population in India has been around 10 per cent during the last decade.
Analysis of data on vehicles registered in India reveals that the share of buses has declined to 1.1 per cent of all registered vehicles in 2011 from 11.1 per cent in 1951. The decline has been particularly rapid in the last decade from 2000 to 2011, when the growth in two wheelers and cars was significantly higher across metropolitan cities. As a case in point, the number of cars in Delhi increased at an annual rate of 9 per cent whereas number of buses grew at only 1 per cent during 2000-09.
RECENT INITIATIVES Urban transport essentially is a state and local gov-ernment responsibility. Except for the national capi-tal, and a few metro rail projects—Kolkata, Delhi, Bengaluru, Jaipur, etc.—most urban transport sys-
Table 2. 22 Trends in Urban Population Concentration
CENSUS YEARS
NO. OF TOWNS BY SIZE CLASS PERCENTAGE OF URBAN POPULATION BY SIZE CLASS
I II III IV V VI I II III IV V VI VI
1901 24 43 130 391 744 479 26.0 11.2 15.6 20.8 20.1 6.1 6.1
1911 23 40 135 364 707 485 27.4 10.5 16.4 19.7 19.3 6.5 6.5
1921 29 45 145 370 734 571 29.7 10.3 15.9 18.2 18.6 7.0 7.0
1931 35 56 183 434 800 509 31.2 11.6 16.8 18.0 17.1 5.2 5.2
1941 49 74 242 498 920 407 38.2 11.4 16.3 15.7 15.0 3.1 3.1
1951 76 91 327 608 1124 569 44.6 9.9 15.7 13.6 12.9 3.1 3.1
1961 102 129 437 719 711 172 51.4 11.2 16.9 12.7 6.8 0.7 0.7
1971 148 173 558 827 623 147 57.2 10.9 16.0 10.9 4.4 0.4 0.4
1981 218 270 743 1,059 758 253 60.3 11.6 14.3 9.5 3.5 0.5 0.5
1991 200 345 947 1,167 740 197 65.2 10.9 13.1 7.7 2.6 0.3 0.3
2001 293 401 1,151 1,344 888 191 68.6 9.67 12.2 6.8 2.3 0.2 0.2
2011* 495 NA NA NA NA NA 58.9 NA NA NA NA NA NA
Class I: Greater than 1,00,000 populationClass III: 20,000 – 50,000 populationClass V: 5,000 – 10,000 population
Class II: 50,000 – 100,000 populationClass IV: 10,000 – 20,000 populationClass VI: less than 5000 population
Source: Various Census Reports.Note: * Provisional.
NTDPC~Vol 02_Part 1~Ch 02.indd 58 15-04-2014 10.51.34 AM

NTDPC | TRENDS IN GROWTH AND DEVELOPMENT OF TRANSPORT 59
tems and interventions are funded and owned by state governments. National intervention in the sec-tor has been quite recent with a particular fillip pro-vided through the JnNURM programme launched in 2005 and the National Urban Transport Policy announced in 2006.
The JnNURM programme attempted to improve the public transport system in larger cities through funding of public transport buses, development of comprehensive city mobility plans and supporting city transport infrastructure projects. As of Decem-ber 2012, 15,388 buses at a cost of more than Rs 47 billion in 64 cities had been funded under the pro-gramme. This has led cities to develop new bus ser-vices. Bus rapid transit projects have been initiated in 10 large cities. Some cities have also used central funding to improve traffic management. However, in the medium and long term, public transport in cities will have to remain a local body responsibility and new ways to develop self-financing and sustainable public transport systems have to be developed.
KEY ISSUES
The NTDPC has been charged with identifying a set of policy strategies for developing transport infrastructure over the next 20 years. The aim is to ensure that adoption of these strategies results in infrastructure that supports the desired pace of India’s economic transition, social and economic
development, and other goals as articulated in greater detail in subsequent chapters. Consequently, it is useful to conclude this chapter on the histori-cal trends in Indian transport by drawing together the lessons apparent from the manner in which infrastructure has developed in the past. Though grounded in history, most of these lessons will con-tinue to hold major import for the future of trans-port in India.
Rather than address modal-specific issues that are dealt in greater detail in relevant chapters later, the focus here is on overall planning, institutional arrangements, governance and execution issues that are universally applicable across sectors, and are critical contributors to a well-functioning transport system. The record of issues and lessons drawn below is essentially an upshot of a broader and deeper analysis of what went wrong rather than right. However, with every issue stemming from multiple causes, and with complex dynamics between the issues, there is some natural and una-voidable overlap.
INTERCONNECTED, HIERARCHICAL TRANSPORT NETWORK
The existing Indian transport network is a natural consequence of the somewhat disjointed executive decision making process that has been character-istic of our transport planning approach over the years. The result is a far-from-optimal modal mix.
Figure 2. 22 Growth of Registered Vehicles In India [Millions]
Source: Ministry of Road Transport and Highways (2012b, 2012c).
1951 1961 1971 1981 1991 2001 2011
0
40
80
120
160
Two Wheelers Cars, Jeeps and Taxis
Buses All Vehicles
0.3 0.7 1.95.4
21.4
55.0
141.9
NTDPC~Vol 02_Part 1~Ch 02.indd 59 15-04-2014 10.51.34 AM

NATIONAL TRANSPORT DEVELOPMENT POLICY COMMITTEE | 201360
What is desirable is an integrated network that facilitates seamless transport of passengers and freight alike, across modes, while also allowing natural mapping of freight/commodity types with appropriate modes of transport. What is needed is an efficient network with interchange points that receive short-haul smaller cargo volume from roads from the hinterland for aggregation and then pro-vide longer-haul rail transport of vehicle loads for-ward to ports, industries and the like and vice versa from ports into urban centres through disaggrega-tion. Similarly, movement of medium- and long-haul coal should necessarily be through more suitable rail rather than road. This puts things in perspective when the need to match cargo category with right transport mode is emphasised.
Clear and stable network standards reduce opera-tional uncertainty and transaction costs, and raise the productive efficiencies of transport services deployed on the network. Similarly, networks that span various geographies—local, regional, national and international—should also be mutually coher-ent. It is of little use having efficient cars built for smooth roads and stringent fuel standards in a city, when they must also contend with vicious pavement and poor fuel outside city limits.
Having noted the broad existing deficiency of the Indian transport network and certain desirable traits, a greater inquiry into what has gone wrong in the evolution of India’s transport system is use-ful. Network enhancements have been all too fre-quently driven by political rather than business or even social welfare considerations, resulting in hap-hazard and inefficient route expansion. Underused and uneconomic railway spurs in favoured political constituencies have diverted much needed resources from capacity augmentation projects on key trunk rail routes. These have often been misleadingly moti-vated on ‘equity’ rather than socio-economic basis. These are honourable and essential considerations for inclusive growth. However, a much more effi-cient overall transport network could have resulted if holistic planning led to universal connectivity via roads that link villages to bigger towns that are in turn are situated on economically viable railway lines.
So far, little emphasis seems to have been paid to the idea that throughput of a network is only as strong as its weaker links. Capacity augmentation has
sometimes only resulted in pushing bottlenecks to elsewhere in the network. New road and rail links have been attached to existing highways and rail routes without increasing capacity on the existing trunk infrastructure. In cities, flyovers and road widening programmes result in urban highways that carry vast flows of traffic capably, but also cre-ate choked intersections where highways meet other urban roads. Moreover, encouraging fast intra-city traffic also results in safety hazards.
Perhaps the biggest example of the lack of holistic planning is seen in the volume of goods and passen-gers that have been wrested away from the railways by road-based alternatives. Given the better economic and environmental value proposition of the rail-ways, this decline in market share has not been the result of direct policy action. If anything, respon-sibility may be assigned to policy inaction over the years, as rail capacity has not been installed fast enough to keep pace with the growing economy and its structural changes. Whereas the unprecedented policy focus towards expansion of the national high-way system during the last decade was on the right track, a more holistic network approach that would consider road and rail networks concurrently would have been more helpful.
In general, the importance of intermodal connectiv-ity has not influenced the development of India’s transport network to the degree it should have. Imports languish at ports for want of adequate trucking and rail capacities to assist in their remov-al to the hinterland. The oft-quoted ‘last mile con-nectivity’ issue is one manifestation of this problem. And the usability of mass rapid transit systems is reduced when the walk along vehicle-friendly streets from home, office, school or shopping centre to met-ro station or bus stop is inconvenient, arduous or dangerous.
Conscious choices will need to be made on the pri-orities to be placed on investments across transport modes. This calls for some judgment on the normative modal shares desired. Any transport network strategy will have to be necessarily embedded in the planning process at all levels, so that naturally sensible plans result for prioritising allocation and spending of lim-ited resources. The fundamental idea is synchronisa-tion and not modal competition, as the desired end state would be an integrated system where transport modes efficiently complement one another, resulting in reduced overall cost of transport.
Fortunately for India, a significant part of the logis-tics network is still to be built. So the country can make up for past inadequacies and use the opportu-nity to shape its future transport infrastructure net-work to an increasingly desirable state.
BOTTOM LINE India must adopt a holistic approach in designing integrated transport networks. Hierar-
In general, the importance of intermodal connectivity has not influenced the development of India’s transport network enough. Examples are imports lying in ports due to inadequate trucking and rail capacities, and the serious lack of ‘last mile connectivity’.
NTDPC~Vol 02_Part 1~Ch 02.indd 60 15-04-2014 10.51.34 AM

NTDPC | TRENDS IN GROWTH AND DEVELOPMENT OF TRANSPORT 61
chical connectivity, intermodal access and fit-for-pur-pose network standards should be emphasised. Net-work expansions and capacity enhancements must be assessed for their impact on the existing network, and within and across networks. With substantial logis-tics infrastructure yet to be built, India can still make amends to reach a more desirable and efficient state for its transport system.
CAUSALITY AND TIMELINESS
It is frequently noted that the demand for transport services is ‘derived’ from the demand for other goods and services. The demand for food in cities creates need for trucking services to haul in grain from the hinterland. However, the derived nature of the demand for transport does not mean that the causal relationship is one-way. Causality flows the other way too: the creation of transport infrastructure and services opens up new vistas and opportunities, and creates and strengthens markets for other goods and services.
As noted at the beginning of this chapter, American railway and canal investments gave rise to entire cities and revitalised life in others. The Interstate highway network that criss-crosses America was an infrastructure idea conceived for other purposes and well before its time had come. These roads are now the pulsing arteries that knit together a vast country and effortlessly support the logistics of the world’s largest economy. Closer home, the Western DFC and the piggybacking Delhi-Mumbai industrial corridor will give rise to new industrial areas, inland ports, logistics parks, and rewire the economic landscape—from agricultural to industrial—of a catchment area that is expected to extend 100 km on either side of the corridor. Similarly, the construction or improve-ment of a rural road can significantly change the educational, healthcare and economic opportuni-ties available to the village’s inhabitants. The ambi-tious PMGSY launched in 2000 to provide all-weather access to unconnected habitations in rural areas has achieved considerable success.
However, we have largely tended to see only one side of the coin, creating transport infrastructure to service existing markets, perhaps allowing for a measure of growth. As a general rule, infrastructure investment has been reactionary rather than antici-patory. Roads have been widened when existing lanes are stretched to capacity. New ports have been built when ships wait at sea for days to berth at existing ones. Mass rapid transit arrived after population and economic growth had slowed intra-city move-ment to a crawl. Roads receive maintenance after they are already flooded or potholed. The point here is that India’s approach to transport infrastructure has been narrowly focused on fixing problems at the margin rather than on defining and executing a grand comprehensive vision for the future where
transport clears and paves new routes to opportunity and prosperity.
Causality’s cousin is timeliness. It is true that India has devoted less effort than it should have to main-tenance relative to new construction. Rehabilitation requires far more substantial financial resources than preventive measures do. Importantly, preven-tive maintenance also imposes lower indirect and opportunity costs since the citizenry and govern-ment are less likely to have to contend with cata-strophic failure, or with the decommissioning of important links in the network for lengthy periods of time.
It is not just maintenance that benefits from timely action. Anticipatory construction can often be easier, cheaper and faster to accomplish than the reactive kind. If it is known with reasonable certitude that an Indian city will grow rapidly over the next gen-eration, action to plan appropriate urban transport options should be taken well in advance. By forming a cornerstone element of a city’s master development plan, attempts can be made to match pro-active plans for transport infrastructure consistent with planned land use. In contrast, the reactive Indian method forces new transport infrastructure to conform to sub-optimal alignments, demands the deployment of expensive tools to avoid inconveniencing or displac-ing people, and requires costly programmes to re-engineer existing ill-planned land use.
Of course, it is essential to acknowledge the dangers of excessive stargazing. In the absence of market sig-nals, governments are notoriously bad at ultra-long-range planning exercises. There are no guarantees that pre-emptive construction of transport infra-structure will actually lead to a subsequent boom in economic activity, or that the anticipated motivating factors will actually materialise. There are several examples of infrastructure white elephants around the world that attest to this. Building it and hoping that they will come is also a recipe for unproductive and wasteful over-investment, as has been the Chi-nese experience in certain areas. Fixed infrastruc-ture, once created, is essentially irreversible and can lock cities and countries into unsuitable or unde-sired growth straitjackets. Finally, it is almost cer-tain that today’s technologies will be superseded by better options and that hindsight will prove today’s choices to be less than optimal.
However, these caveats should not serve to circum-scribe or abandon the advance planning process. Instead, when set against the advantages noted above, they highlight the inherent difficulties of
India has been creating transport infrastructure to service existing markets. As a general rule, investments have been reactionary rather than anticipatory.
NTDPC~Vol 02_Part 1~Ch 02.indd 61 15-04-2014 10.51.34 AM

NATIONAL TRANSPORT DEVELOPMENT POLICY COMMITTEE | 201362
long-range planning, and underscore the importance of building human capital and institutions that can appropriately account for these pitfalls when devis-ing long-term anticipatory transport infrastruc-ture plans. It is essential to build into the planning process choices that need to be made as conditions change in the future.
BOTTOM LINE Both sides of the causality between demands for transport and for other goods and ser-vices should be considered in making the case for new infrastructure spending. Infrastructure should be pro-grammed in anticipation of future demand. It is fre-quently easier, cheaper and faster to do this than post hoc construction that increases capacity at the margin. Once created, maintenance should be regular, timely and pre-emptive, rather than rehabilitative and this should become an integral part of the asset manage-ment system of each mode of transport. Allowance should also be made for allowing dynamic responses to changing situations.
REBALANCING AND CAPACITY
As mentioned before, certain issues which might otherwise need separate enunciation could still pre-sent some natural overlap with others. Rebalancing of the modal share of Indian Railways is one such conundrum that needs to be discussed along with the need for intermodal access and holistic planning. The share of railways in freight transport which forms the backbone of railway revenues (tonne km) is estimated to be about 33 per cent as against 67 per cent share of road transport. The railways’ share of freight traffic is close to 50 per cent in large econo-mies like US and China. Trunk rail routes which form just about 16 per cent of the network are dan-gerously oversaturated, with the bulk running at 80 per cent, and several in excess of 120 per cent of their design capacity. Other operating challenges for the railways are today typically characterised by deficient availability of rolling stock and the power to haul, mismatch between capable speeds of loco-motive and the wagons, heavy terminal detention of rolling stock, and empty haulage of rakes due to scarce maintenance.
Indian Railways still has a huge throw forward of projects. The various initiatives envisaged such as for capacity augmentation, throughput enhance-
ment, port connectivity works and upgradation of permanent way, are plagued by procedural delays; a majority of them are running behind schedule. A recent measure that allowed intensive asset utilisa-tion through enhanced axle loading has only helped overstretch the current infrastructure, bringing into focus its long-term sustainability. Apart from difficulties arising from the current organisational structure of the railways, and political exigencies, the railways establishment has been less than agile in responding to the challenges arising from higher economic growth.
Attempts to harness private investment through Public-Private Partnership arrangements have not materialised as envisaged. Setting up of locomotive manufacturing facilities, and initiatives to recapture the road traffic such as development of multimodal parks and roll-on-roll-off facility to provide door-to-door multimodal service are in preliminary stages and yet to manifest any measurable advantage.
There is a pressing need for a strategic long-term decision in favour of investment in railways over the next 20 years for desired capacity augmentation and modernisation of the rolling stock while achieving a certain balance between the two dominant modes. Importantly, any effort for railways to reclaim their lost business share should be viewed as an attempt to enhance the productivity of the transport net-work itself and not as a competitive onslaught. The rebalancing should be based on closely coordinated investment decision making which should aim for a more efficient modal mix that provides for a sustain-able, economical and regionally-balanced transpor-tation system.
Infrastructure, and within it transport as a sub-cat-egory, has witnessed a high-funding priority in the last few years. Despite this, commensurate increas-es in the capacity of physical transport infrastruc-ture have not yet fructified. Infrastructure is also often built for reasons other than to enhance capac-ity, such as to improve connectivity, for national security, nation-building, and so on. While this is important, another relevant dimension of infra-structure investment is that new transport infra-structure or capacity additions needed to meet grow-ing demand, are often indivisible, entailing lumpy investment.
In such situations, capacity cannot be gradually increased pari passu with demand, but only in large amounts at considerable intervals. Because they are typically lumpy, these decisions to invest or other-wise can have a significant impact on the economy as opportunity loss in the short run, and in deter-mining how the competitive environment evolves in the long run. Concurrently, mistakes in the form of overly aggressive or poorly sequenced capacity addi-tions can result in excess capacity resulting in irre-
Infrastructure should be programmed in anticipation of future demand. It is frequently easier, cheaper and faster to do so than post hoc construction that increases capacity in the margins. Maintenance should be pre-emptive, not rehabilitative, and the system capable of dynamic responses to changing situations.
NTDPC~Vol 02_Part 1~Ch 02.indd 62 15-04-2014 10.51.35 AM

NTDPC | TRENDS IN GROWTH AND DEVELOPMENT OF TRANSPORT 63
versible sunk investment as well as opportunity cost to the public exchequer.At the present time, significant capacity constraints exist across sectors. The processing of cargo at India’s ports is amongst the slowest in the world. The grim situation in the railways has already been discussed. Notwithstanding the NHDP-sponsored improvements in highway infrastructure, a truck travelling the 1,400 km between Delhi and Mumbai spends four days on the road, at an average opera-tional speed of under 30 kmph. However, private par-ticipation in several major metro airports has dra-matically improved aviation capacity.
The situation is less clear-cut with respect to urban transport. Capacity limitations vary from city to city, and from one transport mode to another. The absence of good data is also a problem. Ris-ing car ownership and declining rates of walking and cycling have placed severe pressure on urban roads. Municipal bus services are often in short supply or entirely missing from urban areas where they are much needed. Private shared taxis, vans and other para-transit modes often effectively substi-tute for a more organised public transport system. This is interesting in that the capacity considerations have more to do with operational and service deliv-ery issues rather than with the underlying physical infrastructure. For example, expensive investment in mass rapid transit projects in the larger cities is often made without adequate examination of much cheaper alternatives.
The immediate consequence of constrained capac-ity is delay. This translates into strangled economic activity, attended by pointless congestion and envi-ronmental pollution. Capacity shortages can also be self-reinforcing, and costly in themselves. Over-used fixed infrastructure is more prone to wear and tear, requires more diligent maintenance, and more fre-quent rehabilitation. These activities can intermit-tently remove some pieces of infrastructure from service, exacerbating the capacity problem.
Despite the recent government focus on transport investment, there is a disconnect between the fund-ing applied and capacity improvements achieved. Easy answers may lie in the observation that execu-tion has been wanting, with funding leakages, tar-dy construction, quality compromises and missed maintenance. There is undoubtedly some truth to each of these, but they explain only a part of the disconnect. The bigger and more direct answer lies with the fact that capacity augmentation, par-ticularly where it was needed, has not received the needed investment. Whatever additions to infra-structure took place essentially helped increase the transport footprint, not necessarily resulting in capacity improvement.
The capacity of a transport network is the product of three factors: the installed physical infrastruc-
ture itself; the intensity of use of the infrastructure; and the topology or ‘shape’ of the network in the context of the demographic, economic and physical geography of the nation. The first item on the list is uncomplicated: more is better. However, the kind of ‘more’ that is installed is important. Track-kilo-metres can boost rail network capacity more than route-kilometres, as can lane additions when com-pared with new roads.
Intensity of use increases with operating, commis-sioning or permitting a higher frequency or speed of transport service on the fixed infrastructure, and from improvements in technology or operational management. For example, there has been only around 20 per cent growth in rail route kilometres over the past 60 years, to which we can add a signifi-cant amount of track doubling. With gauge stand-ardisation, more trains, longer and heavier ones, and better signalling and scheduling, passenger and freight traffic has increased 1,400 and 1,300 per cent respectively over the same period. (But even this increase has not been enough to stem the slide of traffic mode share to road-based alternatives.) Simi-larly, the port sector has been able to achieve higher cargo throughputs both by building new infra-structure, and by achiev-ing higher throughputs per berth-hour. On both fronts, however, there is substantial room for improvement.
Institutional factors also influence the intensity of use of physical infra-structure. Slow customs clearances can dramati-cally decrease capacity at ports. Internal borders can be just as unforgiving as international ones. By some estimates, the languid four-day sojourn of the Delhi-Mumbai truck is because considerable time is spent at inter-state borders having cargo inspected, permits verified, papers stamped and taxes collected.
Finally, the capacity of a network is contingent on the capacities of all the individual links and nodes within the network to process passengers and freight. For example, the capacity of an air link depends on the throughput of airports at both ends of the link. The capacity of a highway system is derived both from the trunk routes on the network, as well as the efficiency of junctions and bridges, and the capacity of feeder roads. And from the inter-modal network perspective, the capacity of shipping infrastructure also depends on rail and road links.
This is not to say that the capacities of all links and nodes within a network are equally important. Clear-
Cargo processing at India’s ports is among the slowest in the world. The situation in the railways is grim. A truck travelling 1,400 km between Delhi and Mumbai, spends four days on the road, at an average operational speed of 30 kmph.
NTDPC~Vol 02_Part 1~Ch 02.indd 63 15-04-2014 10.51.36 AM

NATIONAL TRANSPORT DEVELOPMENT POLICY COMMITTEE | 201364
ly, capacities on trunk routes are more meaningful for overall network capacity. Second, the gross capac-ity of a network is not concomitant with its size. The major lesson from this reasoning is that not enough funding and effort has been devoted to those criti-cal pieces of infrastructure—such as trunk routes, junctions and intermodal nodes—that have maximal impact on capacity.
BOTTOM LINE India’s transport networks are severely constrained for capacity. Railways in particu-lar, despite being a more reliable and energy-efficient mode, have been losing out to roads for long want of capacity augmentation at various fronts. Increased funding has not translated into commensurate increases in the capacity of physical transport infra-structure, essentially due to greater investment focus on new and sometimes unhelpful infrastructure crea-tion rather than on capacity augmentation.
FUNDING
Transport conforms to the classic characteristics of a public good to a large degree. Subject to capac-ity, it is non-rivalrous. On the flip side, positive con-sumption externalities mean that, conditional on a (usually subsidised) price, it is Pareto-inefficient to exclude any would-be consumers even if it is pos-sible to do so. It naturally follows that government spending has historically accounted for the bulk of investment in transport.
ROADSAt the simplest level, roads provide basic acces-sibility to the rest of the world. No other piece of transport infrastructure can replace the street out-side one’s home. Consequently, it is sensible that sources for road funding are principally commit-ments from gross budgetary outlays, though these may stem from earmarked revenue streams, taxes and cesses, dedicated road funds, or special develop-ment programmes such as the PMGSY. The desir-ability of universal accessibility on developmental and nation-building grounds motivates budgetary funding for roads as a redistributive tool. However, to a significant degree, the benefits from road use accrue to private agents, be it from the transport of goods to market or the movement of people for work or leisure. As such, after accounting for all positive consumption externalities, this offers good economic support for more direct funding of road infrastructure from fuel taxes, vehicle registration fees, and the like.
AVIATIONSmall numbers of people and quantities of valuable freight can be whisked across the world rapidly via air. Aviation has long featured a user-pays model. Passenger, fuel, service and luxury taxes are used to pay for the lion’s share of fixed infrastructure and ancillary services like air navigation. In an increasingly globalised economy, however, spillo-ver benefits from better air links with the rest of the world, and the importance of aviation in con-necting remote locations both constitute excellent rationale for greater funding from the public purse.
PORTSFinance for port infrastructure for Major Ports is essentially from their internal resources and user charges, though some budgetary support from the government helps in creating essential common infrastructure. In recent years, in the case of minor ports that are directly under the state governments, the infrastructure has been largely funded by the private sector. Though India has a long coastline, it has relatively few suitable natural harbours. The scarcity of options and the critical importance of ports in an increasingly globalised world indicate that future investment in ports requires a strategic approach that better accounts for the correspond-ing investment required for efficient hinterland connectivity. A progressive shift to the landlord model of port governance would help induce great-er private capital, but significant investments, par-ticularly in common infrastructure such as drafts and hinterland connectivity, will have to continue to be funded through public resources.
URBAN TRANSPORTUrban transport suffers from having too many and too few parents. Barring central funding under a few dedicated schemes such as JnNURM, urban trans-port is largely a state prerogative, and is funded from state budgets and farebox collections that are not always earmarked. Some states have devolved responsibilities to local authorities; others gener-ate master plans for all urban areas in state capitals. The lack of clear funding lines, and matched spend-ing and revenue authorities, leaves some aspects of urban transport entirely neglected and others sub-ject to unnecessary duplication.
RAILWAYSThe overwhelming historical dominance of the rail-ways in fiscal affairs led to the unique distinction of the railways’ financial statements being presented separately from those of the general government. This is an idea of the past. Railway plans have, since the late 1950s, been essentially financed by a mix of internal and gross budgetary resources, with GBS consistently growing from 34 per cent during the 1st Plan (1957-62) to 75 per cent by the 5th Plan, as share of internal resources declined proportionately. Beyond the 5th Plan, the financing pattern reversed, with greater allocation through internal resources, reach-
Railways, though a more reliable and energy-efficient mode, have been losing out to roads for long want of capacity augmentation. Investment focus has largely been on new and sometimes unhelpful infrastructure creation.
NTDPC~Vol 02_Part 1~Ch 02.indd 64 15-04-2014 10.51.36 AM

NTDPC | TRENDS IN GROWTH AND DEVELOPMENT OF TRANSPORT 65
ing close to 60 per cent by the 8th Plan, while market borrowings additionally contributed about 18 per cent. Since the 9th Plan, the GBS in railway Plan fund-ing has again grown to dominate, as internal resourc-es struggle to meet mounting operating expenses, a trend which needs to be reversed. The generation of internal resources is today seriously affected by the limitation of railways to rationalise fares and freights due to political constraints.
Modern rail budgets further cloud matters. Impor-tant strategies for modernising the railways, such as statements of action on expanding capacity and skill-ing staff are lost amidst the detail of the announce-ments on new trains, stations and routes. The sepa-rate budget presents a curious situation. On the one hand, it is subject to extreme visibility and scrutiny. On the other, little or no progress has been achieved towards modernising the accounts to present a true picture of the multitude of subsidies that riddle the system, and the operational investment criteria. It has become difficult to compare spending on the rail-ways with other government priorities, much less with funding for other transport modes.
The popular romantic view of the railways in India is that rail is somehow ‘different’. The vast network is accessible physically and financially by nearly everyone and constitutes democracy itself. From this lens, Indian Railways is a nation-building social ser-vice that should not be held accountable to business criteria. This is fallacious. As things stand, the rail-ways’ funding model of cross-subsiding passenger fares from freight revenue is not sustainable. It has led to the steady erosion of freight traffic share to the roads, at substantial environmental cost. Shaky finances have left little for sustained programmes of capacity or safety enhancements, or improvements in service delivery, at substantial social cost.
THE LESSONSWhile transport infrastructure should remain a pri-ority for public finances, there is as much a need for boosting private investment to fill the gap. There has always been tension between the private and public funding of infrastructure projects. Indeed, new transport networks that initially accompanied the industrialisation process around the world were often a product of private enterprise. Private compa-nies built much of the first railway, canal and urban transport networks around the world, including in India. However, many private infrastructure projects often had to be later bailed out by governments later.
For most of the 20th century, much of the transport infrastructure around the world was built in the pub-lic sector. However, beginning in the 1980s and 1990s, there was a new trend towards private investment in infrastructure. In the economic liberalisation of the past two decades, India has followed this trend and allowed private participation in air and maritime
ports, and roads that are made ‘private’ through price excludability. Attempts are even being made to invite full private funding for mass rapid transit pro-jects. However, there are areas such as the tendering process, land acquisition, project monitoring and service delivery pricing, that need further strength-ening.Further, for most of the period in question in India, the government has been involved in service deliv-ery. Strong economic arguments exist for the govern-ment to provide the underlying infrastructure net-work, but less for the public sector to be involved in the operation of transport services.
Free from competitive forces or the discipline of mar-ket pricing, public sector-supplied transport servic-es have often been inefficient and wasteful. Natural price discovery through healthy market competition is typically known to result in greater operational efficiencies and improved service delivery, and this needs to be encouraged. At absolute levels, perhaps the most that can be said is that the private sector’s resources must be harnessed even more than they have.
The big lesson to draw from the snapshots of funding models presented for each mode is that the sourcing of public funds can be improved substantially to pro-vide a better match between incidence of costs and benefits. Conditional on externalities and redistrib-utive goals, matching cost and benefit is a sound eco-nomic principle in ensuring that the price, quantity, and quality of infrastructure are optimised.
BOTTOM LINE Differential characteristics of the various transport modes warrant different funding models. Opportunities for improving the source of public funding exist for all modes, to better match costs and benefits for economic efficiency. Problems are especially rife in how the railways are funded. While retaining the role for the government in infra-structure funding, there is a logical need for stepping up private investment to both fill the investment gap and also allow increased flow of public investment in perhaps commercially unviable but economically and socially important investment decisions.
PRICING
The market for transport services is characterised by externalities, natural monopolies, bi-directional causality with the wider economy, and a neces-
India has allowed private participation in transport, sometimes even inviting full private funding. However, areas like the tendering process, land acquisition, project monitoring and service pricing need strengthening.
NTDPC~Vol 02_Part 1~Ch 02.indd 65 15-04-2014 10.51.37 AM

NATIONAL TRANSPORT DEVELOPMENT POLICY COMMITTEE | 201366
sary role for government as investor and regulator. ‘Correct’ pricing in the context of these market fail-ures is difficult. Yet, given transport’s large, unique, and both direct and indirect roles in the economy, set-ting good pricing policy is of the utmost importance. Good pricing is simple, clear, prevents market distor-tions, guides consumption and investment decisions appropriately, and is sustainable over the long run.
A complex web of subsi-dies, tariffs and taxation policies applies to trans-port in India. Adjusting the pricing of transporta-tion is a standard tool for redistribution policy. Fuel is subsidised, ostensibly for agricultural relief, but has many unintended beneficiaries. More vehi-cle-kilometres are driven than would be if fuel was priced according to mar-ket forces. Demand has skyrocketed for diesel vehicles, with severe envi-ronmental implications, given the generally high-
sulphur diesel fuel available in India.
Worse, the method and practice of setting the sub-sidy has become so beset by politics, that required adjustments are delayed until the fiscal implications become untenable, at which point they are made in large jumps, causing more pain at the pump as con-sumers struggle to adjust to hugely increased fuel outlays. Meanwhile, vehicle registration and park-ing fees are disconnected from the economic value of public resources that are used up. Freight tariffs cross-subsidise rail passenger fares, distorting both markets. Fare subsidies are available to a bewilder-ing variety of passengers. Besides the child, senior citizen and military concessions found elsewhere, discounted rail travel is available to poor people, exam-takers, doctors and mountaineers.
Economic theory proposes that optimal economic efficiency occurs when costs and benefits are aligned and consequently considers cross-subsidisation to be a symptom of economic inefficiency that should be avoided. Such rate setting is accepted out of the belief that the social benefits created by such sub-sidisation outweigh the resulting economic inef-ficiency. Therefore, one cannot logically claim that cross-subsidies are uniformly good or bad. They are introduced to achieve certain economic, social and political ends. The argument against the application of a particular cross-subsidy is not an opposition to cross-subsidy per se, but rather on the judgment about the worthiness of those socio-political goals.
Taxes on aviation fuel and services are only loosely tied to economic fundamentals or any market char-acteristics that they are intended to correct. Indeed, aviation is taxed so highly that taxes and government charges comprise the major share of an airfare.It is apparent that despite the important allocative role that prices play in transport markets, they are highly managed by government and are not informa-tive for making market decisions. Better attempts must be made at establishing the true nature and extent of transport externalities, the relative inci-dence of cost and benefit, and how these fit in with the government’s wider agenda. This understanding will result in sound economic reasoning for setting prices at particular levels. Importantly, pricing must be depoliticised and set by independent regulatory authorities. They should also be responsive to chang-ing economic fundamentals in a timely fashion to minimise adjustment costs.
Beyond these basic changes, there is much room for pricing reform. Just as with airfares, dynamic pric-ing based on the time and date of travel and other market conditions could be suitable for the railways. Similar logic applies to higher pricing for car parking during busier times of the day. International experi-ence suggests that the take-up of public transport is greatly enhanced when different transport modes within a city subscribe to a shared pricing structure and fare collection method. Further, consideration should be given to innovative pricing regimes such as congestion charges, even if these are not deemed immediately suitable for India.
BOTTOM LINE A complex web of subsidies, tariffs and taxation policies applies to transport in India. This results in distorted pricing that does not serve as an efficient allocative signal, and creates oppor-tunities for wasteful leakages and rent-seeking. More sophisticated and less distortionary pricing can result in a powerful tool in the government’s armoury to shape transport markets.
URBAN TRANSPORT
Urban transport in India presents a significant chal-lenge as India’s urban population will continue to grow in the foreseeable future, as will the number of large cities. Since independence, a slow, steady urbanisation of India’s population has taken place. Hundreds of villages have become market towns and centres of agricultural commerce for their hin-terlands. Several small towns of the 1950s and 1960s have become large enough to qualify as prosperous cities in their own right. Meanwhile, the great met-ropolitan cities of yesteryear have become greater yet: vast urban conurbations, usually spanning mul-tiple municipal or state jurisdictions.
At 62 million people, India’s urban population was around 17 per cent of the total in 1951. Growing at
Better attempts must be made at establishing the true nature and extent of transport externalities, and the relative incidence of cost and benefit. Importantly, pricing of services must be depoliticised and set by independent regulatory authorities.
NTDPC~Vol 02_Part 1~Ch 02.indd 66 15-04-2014 10.51.37 AM

NTDPC | TRENDS IN GROWTH AND DEVELOPMENT OF TRANSPORT 67
about 2.7 per cent each year—a full percentage point faster than the rural population—the share of urban population is now just over 30 per cent, at 380 million. In 1951, there were 76 cities with a population exceed-ing 100,000 and only five large enough to be home to more than one million people. By 2011, 53 cities had a population larger than a million. Urban travel requirements have escalated significantly, leading to rapid rise in private vehicle ownership, given the inadequate development of public transport. Over the last decade, the vehicle ownership rate in metro-politan cities has grown by over 100 per cent.
While gauging the magnitude of the growing urban populace that needs to be served for its specific urban transport requirement is important, it is more wor-thy from a policy standpoint to build an overarch-ing philosophy that guides a practical and sensible direction of urban transport development that is sustainable, rather than purely advocating arbitrary capacity creation or widespread pursuit of popular, yet not always effective urban transport projects. In this context, a policy framework that suggests better utilisation and maintenance of the existing urban infrastructure, building on current strengths, and regulation enforcement is needed.
Walking as a natural and effective commuting habit needs to be encouraged through safer and convenient walkways, particularly around congested hotspots. Most modern cities of the world are great walking cities. A clear framework of supply-side policy meas-ures—such as one-way traffic system, infrastructure improvement, repair of footpaths and roads, reli-able public transport and passenger information system—on one hand, and equally importantly, a demand-side gradualist approach of progressively introducing restraints on private modes and inef-ficient road use through organised feeder services, congestion pricing, parking fee, fuel tax and so on, on the other hand, are desirable.
Most cities have not adequately catered to or fully absorbed the consequences of the surge in their size and population. In briefly recounting the litany of issues that blight our cities, and the resultant impact on transport, it is useful to begin at the top of the pyr-amid with the absence of planned growth. Indian cit-ies have lacked modern planning systems that make vital choices about where people of all incomes live, work and spend their leisure time. Planning is neces-sary to help link land use with urban flows.
A point that perhaps demands greater emphasis is the need to make better informed decisions while fostering specific public transport options so as to enable judicious use of limited resources. Provision of metros and other rail-based transit systems typi-cally cost much higher as compared to other modes such as city bus/bus rapid transit system, and the current emphasis on it appears rather excessive. As
a comparison, a total expenditure of about Rs 43 bil-lion was budgeted for procurement of buses under the JnNURM in the 11th Plan, while a single Delhi airport metro line cost about Rs 57 billion. A careful analysis is needed for efficient resource allocation.
BOTTOM LINE A clear framework of supply side measures and equally important demand side grad-ual approach of progressively introducing restraints on personalised modes of transport, while strengthen-ing public transport, is needed to meet the demands of the burgeoning urban population. It is however essen-tial to make rational and customised decisions when choice for investment in one form of public transport system vis-à-vis another is considered, as opposed to ‘one size fits all’ kind of widespread replication of a particular model.
GOVERNANCE AND INSTITUTIONS
We should examine how existing governance struc-tures have failed to yield the desired ‘network of net-works’: one that is extensive, robust, economically viable in the first instance, and offers seamless inter-modal and hierarchical connectivity.
India’s transport networks are governed by a mul-titude of institutions at all levels. There is a prefer-ence for the now internationally rare model of mode-based governance. At the central level, separate government ministries hold decision authority over separate transport modes. Within the purview of these ministries, there is a non-standardised deline-ation of responsibilities over various functional areas, such as investment, regulation, operations, maintenance and so on. Independent decision mak-ing at these mode-based ministries and then across the various functional areas results in uncoordinat-ed policy, replication, inefficiencies and waste. The blurring of administrative lines under the multitude of authorities makes accountability exceptionally difficult.
State-level institutional authority primarily extends to roads that are not national highways, minor ports and urban transport. Given the close links essential between urban transport, land use regulations, and city planning and development, it is in this sphere that the absence of strong and clear institutional authority is most keenly felt. For example, there is duplication of municipal bus services in many cities where several agencies have operational mandates
In urban transport, we need a clear framework of supply-side measures and an equally important demand-side gradual approach of progressively introducing restraints on personalised modes of transport, while strengthening public transport.
NTDPC~Vol 02_Part 1~Ch 02.indd 67 15-04-2014 10.51.37 AM

NATIONAL TRANSPORT DEVELOPMENT POLICY COMMITTEE | 201368
from various authorities. Urban and rural roads and other infrastructure are often constructed and maintained under any number of authorities to varying standards, some-times within the same municipal or local area. Wide variations in institu-tional arrangements, and subsequently in policies, from state to state, impose large and unnecessary transaction costs. Incom-plete execution of central policy at the state level creates uncertainty and
has similar effects.
At all levels, institutions that make investments in transport infrastructure, or monitor and regulate transport services, are vulnerable to the politici-sation of their budgets and agendas. Conflicts of interest result when an institution is both regulator and service operator in a competitive environment. This further contributes to lower levels of private investment. In other instances, multiple overlap-ping regulatory authorities create both compliance uncertainty and opportunities for gaming the regu-latory system.
BOTTOM LINE India’s unique and dated system of institutional governance has resulted in a transport system that favours silo decisions, with the result that there is little intermodal coordination, and a system that is beset by unclear responsibilities, politicisation of investment, and weak accountability. The overall outcomes are characterised by inefficiency and waste.
SKILLS AND HUMAN RESOURCES
To develop a transport network commensurate with India’s economic aspirations, three enabling factors must be in place: funding, institutions, and professionals with the necessary skills to staff these institutions. Indeed, the depth and variety of human resources is perhaps the single biggest lim-iting factor in delivering a transport system that is well-designed, efficient, safe, environmentally-friendly, harmonised with land use, economically sensible and financially viable. India urgently requires people adept at the following with respect to infrastructure development: planning, project iden-tification and development, efficient and transpar-
ent contract procurement, administration, and oper-ation and management.
There is an enormous shortage of skilled trans-port professionals at all levels, and across all dis-ciplines and all institutions, including academia, government and construction. Shortages at the academic level are self-reinforcing. There are few courses, degrees and higher education institutes with a dedicated focus on transport planning, and on various aspects of related infrastructure delivery. As a result, there are few graduates who have the necessary skills to become research professionals and academics.
In government, most jobs relating to transport are staffed by a mix of rotating civil service officials, rather than by transport professionals who can have the opportunities to acquire the deep experience nec-essary to make decisions and implement plans over the long term. More jobs in government with defined career advancement will dramatically increase the popularity of transport-related higher education. Finally, construction skills are sorely lacking and many private contractors must rely on unskilled labour, the net result being with slow, inefficient and unsafe construction. Amongst the major recommendations of this com-mittee is that the severe shortage of skilled transport professionals must be addressed forthwith. Moreo-ver, it will be essential for these professionals to acquire the expertise necessary to plan and engineer increasingly complex infrastructure. A common pit-fall of expertise is, however, an inability to engage constructively with specialists in other fields. This is the case today when there is little inter-agency coop-eration, knowledge sharing, data dissemination, and joint planning that is so essential in developing a complete transport system. Consequently, the cadre of experts must also be capable of taking a holistic view on transport infrastructure, and new institu-tional decision frameworks must be developed to aid inter-agency cooperation and actionWith this background, the implications for an inte-grated transport policy is to address critical ques-tions on capacity augmentation and the types and magnitudes of transport investments required to sup-port rapid economic growth. The policy also needs to focus on suggesting growth directions and building the institutional and informational foundations that will help in meeting specific challenges as they emerge over time. This is particularly important as transport investments typically have long lives of 25 to 100 years.
India’s unique and dated system of institutional governance has resulted in a transport sector that favours silo decisions with litle intermodal coordination, beset by unclear responsibilities, politicisation of investment and weak accountability.
NTDPC~Vol 02_Part 1~Ch 02.indd 68 15-04-2014 10.51.37 AM

NTDPC | TRENDS IN GROWTH AND DEVELOPMENT OF TRANSPORT 69
ANNEX
PROFILE OF TRANSPORT SECTOR
ITEMS UNIT 1950-51 1960-61 1970-71 1980-81 1990-91 2000-01 2010-11
RAILWAYS
Route Length Km 53,596 56,247 59,790 61,240 62,367 63,028 64,460
Electrified Route Length Km 388 748 3,706 5,345 9,968 14,856 19,607
Throughput
Freight Traffic (Total) M. Tonnes 93 156 197 220 341 504 926
Net Tonne (Kms) BT Km 44 88 127 159 243 316 627
Passengers Originating Million 1,284 1,594 2,431 3,613 3,858 4,833 7,651
Passenger Kms Million 66,517 77,665 118,120 208,558 296,544 457,022 978,508
Average Lead: Passenger Lead Km 52 49 49 58 77 95 128
Average Lead: All Goods Traffic Km 470 561 648 720 711 626 676
ROADS
Total 000 Km 400 525 915 1,485 2,350 3,373 4,690
Of Which National Highways 000 Km 22 24 24 32 34 58 71
Percentage of Village with 1000+ Population Connected with All Weather Roads
Percent 32 36 40 46 73 90 95
Overall Village Connectivity Percent 20 22 25 28 44 54 68
Surface Length 000 Km 156 234 398 684 1,113 1,573 2,524
ROAD TRANSPORT
No. of Goods Vehicles In ’000 82 168 343 554 1,356 2,948
No. of Passenger Buses In ’000 34 57 94 162 331 634
MAJOR PORTS
Traffic Handled M. Tonnes NA NA 7 7 11 87 315
CIVIL AVIATION
Total Fleet Strength
NACIL 106
Private Airlines NA NA NA NA NA 37 234
Number of Passengers Carried
Million
Air India NA 0.1 0.5 1.4 2.2 3.3 0
Indian Airlines NA 0.8 2.1 5.4 7.9 6.0 0
NACIL 12.8
NTDPC~Vol 02_Part 1~Ch 02.indd 69 15-04-2014 10.51.38 AM

NATIONAL TRANSPORT DEVELOPMENT POLICY COMMITTEE | 201370
Passengers Handled at
Million
AAI Airports NA NA NA 10.7 17.7 59.6
Joint Venture International Airports NA 83.8
Total at Indian Airports 143.4
Cargo handled at
AAI Airports
’000 Tonnes
NA NA NA 179 377 727
Joint Venture International Airports 1,622
Total at Indian Airports 2,348
Revenue Tonne Kms Million
Air India NA NA 275 980 1,381 1,501 0
Indian Airlines NA 83 161 420 669 775 0
NACIL 3,677
No. of Airports and Civil Enclaves Numbers NA NA NA 84 117 126
INLAND WATER TRANSPORT
Length of Navigable Waterways Km 14,544 14,544 14,544 14,544 14,544 14,544 14,544
Source: NTDPC Research.
NTDPC~Vol 02_Part 1~Ch 02.indd 70 15-04-2014 10.51.38 AM

NTDPC | TRENDS IN GROWTH AND DEVELOPMENT OF TRANSPORT 71
REFERENCES
Indian Institute of Human Settlements (IIHS) (2011) Urban India 2011: Evidence, India Urban Conference, 22 November.
International Civil Aviation Organization (ICAO) (2002) Air Transport Statistics, 2001-02, Quebec.
European Commission (2012) EU Transport in Fig-ures: Statistical Pocket Book 2012. Luxembourg: Pub-lications Office of the European Union.
Federation of Indian Chambers of Commerce and Industry (FICCI) (2011) Achieving the Trillion Dol-lar Dream: Background Paper, India Infrastructure Summit 2011, New Delhi.
McKinsey & Company (2010) Building India: Trans-forming the Nation’s Logistics Infrastructure.
Ministry of Civil Aviation (2012) Report of Working Group on Civil Aviation Sector. New Delhi: Ministry of Civil Aviation, Government of India, National Transport Development Policy Committee and Air-ports Authority of India.
Ministry of Railways (2012) Indian Railways Year Book 2011-12. New Delhi: Directorate of Statistics and Economics, Railway Board, Government of India.
Ministry of Road Transport and Highways (2012a) Basic Road Statistics of India 2008-09, 2009-10 & 2010-11. New Delhi: Transport Research Wing, Ministry of Road Transport and Highways, Government of India.Ministry of Road Transport and Highways (2012b) Road Transport Yearbook 2009-10. New Delhi: Trans-port Research Wing, Government of India.
Ministry of Road Transport and Highways (2012c) Road Transport Yearbook 2010-11. New Delhi: Trans-port Research Wing, Government of India.
Ministry of Road Transport and Highways (2013) Indian Shipping Statistics 2012. New Delhi: Trans-port Research Wing, Government of India.
Ministry of Shipping (2012) Basic Ports Statistics of India, 2011-12. New Delhi: Transport Research Wing, Government of India.
National Transport Development Policy Committee (NTDPC) (2011) Working Group on Ports and Ship-ping for the National Transport Development Policy Committee. New Delhi: Transport Research Wing, Ministry of Road Transport & Highways, Govern-ment of India.
National Transport Development Policy Committee (NTDPC) (2012a) Report of the Working Group on Civil Aviation. New Delhi: Government of India.
National Transport Development Policy Commit-tee (NTDPC) (2012b) Report of the Working Group on Ports and Shipping. New Delhi: Government of India.
Planning Commission (1988) Perspective Planning for Transport Development: Report of Steering Com-mittee. New Delhi: Planning Commission, Govern-ment of India.
Planning Commission (2010) Total Transport System Study on Traffic Flows & Modal Costs (Highways, Railways, Airways & Coastal Shipping), RITES Ltd.
Planning Commission (2011) Working Group on Rural Roads in the 12th Five Year Plan. New Delhi: Ministry of Rural Development, Government of India.
Planning Commission (2013) Twelfth Five Year Plan (2012–2017): Faster, More Inclusive and Sustainable Growth. New Delhi: Sage Publications.
Ramanathan, R. (1999) Short- and Long-Run Elas-ticities of Gasoline Demand in India: An Empirical Analysis using Co-Integration Techniques, Energy Economics, 21, pp. 321-330.
World Bank (2009) World Development Report 2009: Reshaping Economic Geography. Washington DC: World Bank.
NTDPC~Vol 02_Part 1~Ch 02.indd 71 15-04-2014 10.51.39 AM