trends in educational inequalities in smoking in northern, mid and southern italy, 1980–2000
TRANSCRIPT

www.elsevier.com/locate/ypmed
Preventive Medicine 39 (2004) 919–926
Trends in educational inequalities in smoking in northern, mid and
southern Italy, 1980–2000
B. Federico, M.Sc.,a,* A.E. Kunst, MA., Ph.D.,a F. Vannoni, Ph.D.,b
G. Damiani, M.D.,c and G. Costa, M.D.b
aDepartment of Public Health, Erasmus Medical Center Rotterdam, NetherlandsbDepartment of Public Health and Microbiology, University of Turin, Italy
cDepartment of Hygiene and Public Health, Catholic University of Rome, Italy
Available online 10 May 2004
Abstract
Background. We aimed to determine the direction and magnitude of socioeconomic inequality in smoking in Italy over the last two
decades, focusing on both national and macro-regional patterns.
Methods. We used data from six National Health Interview Surveys from 1980 to 2000, whose sample size ranged between 60,000 and
140,000. We calculated age-adjusted prevalence rates of current smoking and estimated odds ratios (OR) and relative indexes of inequality
(with 95% confidence intervals) using logistic regression analysis.
Results. In men aged 25–49, the OR of current smoking of low compared to high educated was 1.26 (95% CI: 1.16, 1.37) in 1980 and
1.71 (95% CI: 1.62, 1.80) in 2000. A reversal of the association between education and tobacco use from positive (OR = 0.43) to negative
(OR = 1.12) was found for women of the same age group. Changes in educational inequalities in smoking were similar between different
macro-regions for men, whereas among women, smaller differentials over all the study period were found in southern regions compared to
central and northern regions, despite similar direction in trends.
Conclusions. The gap between high- and low-educated groups has widened, especially in the youngest generations. Southern regions lag
behind central and northern Italy in the progression of the smoking epidemic.
D 2004 The Institute For Cancer Prevention and Elsevier Inc. All rights reserved.
Keywords: Smoking; Socioeconomic inequalities; Italy
Introduction tion subgroups and to identify which interventions are more
Socioeconomic differences in smoking largely contribute
to inequalities in health in several industrialized countries
because of the strong impact smoking has on health [1].
Since the social gradient in smoking is not fixed but rapidly
changes over time [2], the study of time trends in smoking
among different socioeconomic groups can be of interest for
several reasons. Firstly, it provides policy-makers with up-
to-date information so that adequate countermeasures can be
taken; secondly, it permits prediction of future trends; and
thirdly, it enables researchers and policy-makers to assess
the impact of tobacco-related policies on different popula-
0091-7435/$ - see front matter D 2004 The Institute For Cancer Prevention and
doi:10.1016/j.ypmed.2004.03.029
* Corresponding author. Department of Hygiene and Public Health,
Catholic University, Largo F. Vito 1, 00168 Rome, Italy. Fax: +39-06-
35019535.
E-mail address: [email protected] (B. Federico).
effective in reducing social inequalities [3–5].
In Italy, socioeconomic inequalities in smoking increased
over the period between 1980–1994 but the gender pattern
was clearly distinct [6]. Lower-educated men smoked more
than those in higher social categories and the gap tended to
increase; on the other hand, women of a higher educational
level smoked more than those of a lower level and the gap
tended to decrease. At the beginning of the 1990s, a positive
association between smoking and educational level was
reported among women aged 45–74, whereas the associa-
tion was reverse among younger women [7].
According to the model described by Lopez et al. [8],
smoking diffuses within societies like an epidemic with four
distinct stages. At first, smoking is a relatively extraordinary
behavior, and it is more frequent among higher socioeco-
nomic groups. During the successive three to four decades,
this habit becomes more and more widespread among both
Elsevier Inc. All rights reserved.

B. Federico et al. / Preventive Medicine 39 (2004) 919–926920
high and low socioeconomic groups. After prevalence rates
have peaked at about 50–80% among males, they start to
decline, especially among the high educated. Similar pat-
terns are present among females, with a delay of 10–20
years compared to men, as well as a lower peak rate. As the
most recent data for Italy were derived from a Health
Interview Survey carried out in 1994, it is unknown whether
trends in Italy continued to follow the predictions of the
model. Furthermore, published studies have predominantly
assessed socioeconomic differences in tobacco use at a
national level only, all ages together, thus neglecting possi-
ble heterogeneity in the social gradient in smoking by age
and among northern, mid and southern Italy. Differences in
prevalence rates [9–11], as well as in the social and
economic contexts between different Italian regions [12],
may have interacted with the progression of the epidemic,
thus modifying the relationship between social class and
smoking. A closer look at the variation within a country in
which the economic and social dualism between North and
South has deep historical roots [12] may provide support for
the epidemic model, or alternatively challenge its predic-
tions. In this study, we tested the hypothesis that the
inequality in smoking varied in size within Italy, being
larger in the richer and more economically developed North,
and smaller in the less developed Southern regions.
Using large-scale surveys covering a long period, we
aimed at measuring whether inequalities in smoking have
increased or decreased in Italy, focusing on both national
and macro-regional levels of analysis. More specifically, our
first objective was to assess changes between 1980 and
2000 in the prevalence of tobacco use at national level in
different educational groups, with reference to gender and
distinct age categories; secondly, we aimed to measure
whether (changes in) the social gradient in smoking varied
between regions of northern, central and southern Italy.
Table 1
Distribution of the population by educational level and age category (Italy,
1980–2000)
Age category and Percentage (%) and total number of respondents
educational levelMen Women
1980 1999–2000 1980 1999–2000
25–49 years
Elementary 47.9 8.7 59.4 11.6
Lower secondary 27.5 40.7 21.7 35.2
Upper secondary 18.6 40.9 14.9 42.4
Post-secondary 5.9 9.7 3.9 10.8
Total 12,265 25,284 12,518 25,816
50–79 years
Elementary 77.8 57.0 85.7 70.3
Lower secondary 11.2 20.2 8.4 14.7
Upper secondary 7.0 17.0 4.9 11.5
Post-secondary 3.9 5.8 1.1 3.5
Total 10,124 21,937 11,363 24,682
Data and methods
We used data from six National Health Interview Surveys
carried out by the Italian National Statistical Institute
(ISTAT) in 1980, 1983, 1986–1987, 1990–1991, 1994 and
1999–2000. The design of these surveys has already been
described [6,13]. In brief, these are interview-based ques-
tionnaires whose sample sizes were defined to obtain repre-
sentative estimates of the non-institutionalized population at
a regional level. The number of respondents for each
interview ranged from about 60,000 (1994) to nearly
140,000 (1999–2000). Non-response rate was lower than
15% in all surveys [6, 14]. We used three of the five macro-
regions according to the ISTAT classification (northwestern,
northeastern and central Italy) [15], and grouped islands and
southern regions (south). The study was restricted to partic-
ipants 25–79 years of age.
Educational level was used as an indicator of socioeco-
nomic status and measured as the highest level success-
fully completed. We used four different educational
classes: less than elementary and elementary, lower sec-
ondary, upper secondary and post-secondary. Among older
surveys, the educational distribution was highly skewed,
with a very small proportion of respondents having a
higher education (Table 1). Over the study period, the
average education levels of Italian men and women in-
creased. This occurred especially in the younger genera-
tions (people aged 25–49 years) and was particularly
marked among women.
Our main outcome measure was the proportion of current
smokers. We considered both regular and occasional use of
tobacco, since this distinction was not made in all surveys.
Age-adjusted prevalence rates of current smoking were
calculated using direct standardization by 5-year age group,
with the Italian population estimates on 1/1/2001 as the
standard [15]. To obtain summary measures of inequalities,
we compared the lower- and higher-educated groups using
two measures of relative effect: the odds ratio (OR) and the
relative index of inequality (RII) [16].
The ORs were estimated using a logistic regression
model, with the odds of being a current smoker as the
dependent variable. Educational level and age were the
covariates. In the regression model, educational achieve-
ment was categorized in two levels, low (elementary and
lower secondary education) and high (upper secondary and
post secondary education). Age was used as a nominal
variable with 5-year age groups.
A main issue with trend analyses and comparisons
between age groups is that educational distributions change
over time. To take this into account, we also applied a
measure complementary to the OR, the RII. In this measure,
the prevalence of smoking is related in a regression analysis
to the relative position of persons on the educational
hierarchy. Thus, RII takes into account the (changing)
distribution of the population in each educational level.
Further details on this measure are provided in another
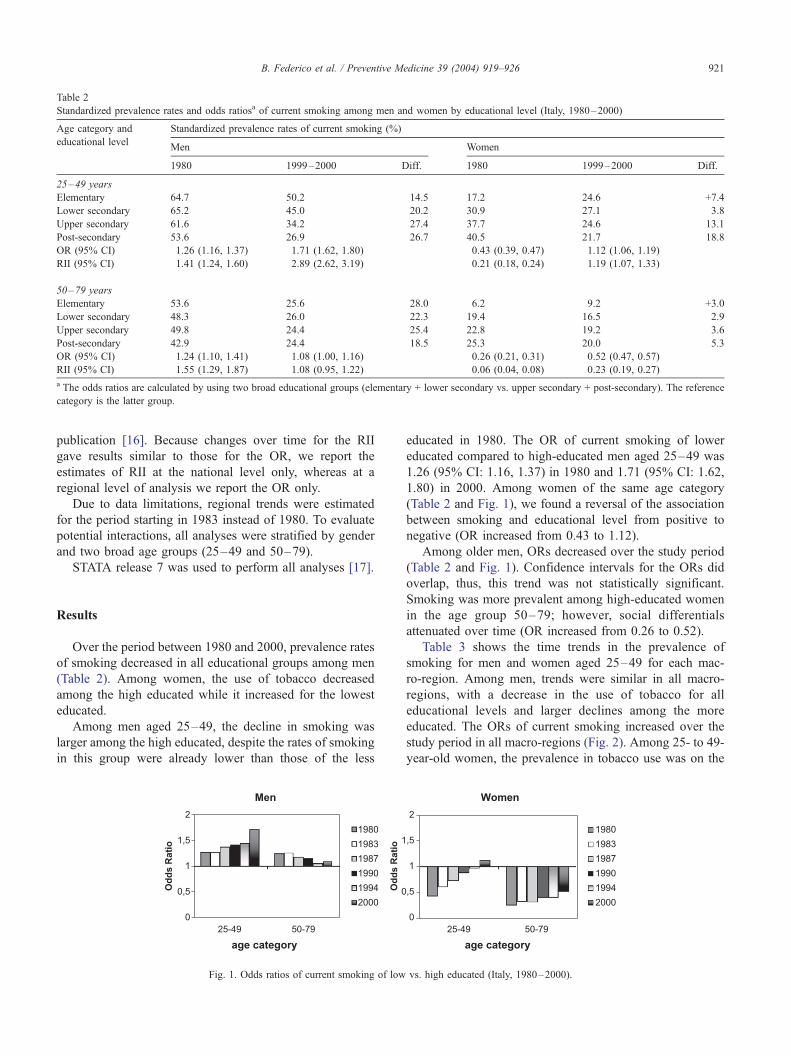
Table 2
Standardized prevalence rates and odds ratiosa of current smoking among men and women by educational level (Italy, 1980–2000)
Age category and Standardized prevalence rates of current smoking (%)
educational levelMen Women
1980 1999–2000 Diff. 1980 1999–2000 Diff.
25–49 years
Elementary 64.7 50.2 �14.5 17.2 24.6 +7.4
Lower secondary 65.2 45.0 �20.2 30.9 27.1 �3.8
Upper secondary 61.6 34.2 �27.4 37.7 24.6 �13.1
Post-secondary 53.6 26.9 �26.7 40.5 21.7 �18.8
OR (95% CI) 1.26 (1.16, 1.37) 1.71 (1.62, 1.80) 0.43 (0.39, 0.47) 1.12 (1.06, 1.19)
RII (95% CI) 1.41 (1.24, 1.60) 2.89 (2.62, 3.19) 0.21 (0.18, 0.24) 1.19 (1.07, 1.33)
50–79 years
Elementary 53.6 25.6 �28.0 6.2 9.2 +3.0
Lower secondary 48.3 26.0 �22.3 19.4 16.5 �2.9
Upper secondary 49.8 24.4 �25.4 22.8 19.2 �3.6
Post-secondary 42.9 24.4 �18.5 25.3 20.0 �5.3
OR (95% CI) 1.24 (1.10, 1.41) 1.08 (1.00, 1.16) 0.26 (0.21, 0.31) 0.52 (0.47, 0.57)
RII (95% CI) 1.55 (1.29, 1.87) 1.08 (0.95, 1.22) 0.06 (0.04, 0.08) 0.23 (0.19, 0.27)
a The odds ratios are calculated by using two broad educational groups (elementary + lower secondary vs. upper secondary + post-secondary). The reference
category is the latter group.
B. Federico et al. / Preventive Medicine 39 (2004) 919–926 921
publication [16]. Because changes over time for the RII
gave results similar to those for the OR, we report the
estimates of RII at the national level only, whereas at a
regional level of analysis we report the OR only.
Due to data limitations, regional trends were estimated
for the period starting in 1983 instead of 1980. To evaluate
potential interactions, all analyses were stratified by gender
and two broad age groups (25–49 and 50–79).
STATA release 7 was used to perform all analyses [17].
Results
Over the period between 1980 and 2000, prevalence rates
of smoking decreased in all educational groups among men
(Table 2). Among women, the use of tobacco decreased
among the high educated while it increased for the lowest
educated.
Among men aged 25–49, the decline in smoking was
larger among the high educated, despite the rates of smoking
in this group were already lower than those of the less
Fig. 1. Odds ratios of current smoking of low
educated in 1980. The OR of current smoking of lower
educated compared to high-educated men aged 25–49 was
1.26 (95% CI: 1.16, 1.37) in 1980 and 1.71 (95% CI: 1.62,
1.80) in 2000. Among women of the same age category
(Table 2 and Fig. 1), we found a reversal of the association
between smoking and educational level from positive to
negative (OR increased from 0.43 to 1.12).
Among older men, ORs decreased over the study period
(Table 2 and Fig. 1). Confidence intervals for the ORs did
overlap, thus, this trend was not statistically significant.
Smoking was more prevalent among high-educated women
in the age group 50–79; however, social differentials
attenuated over time (OR increased from 0.26 to 0.52).
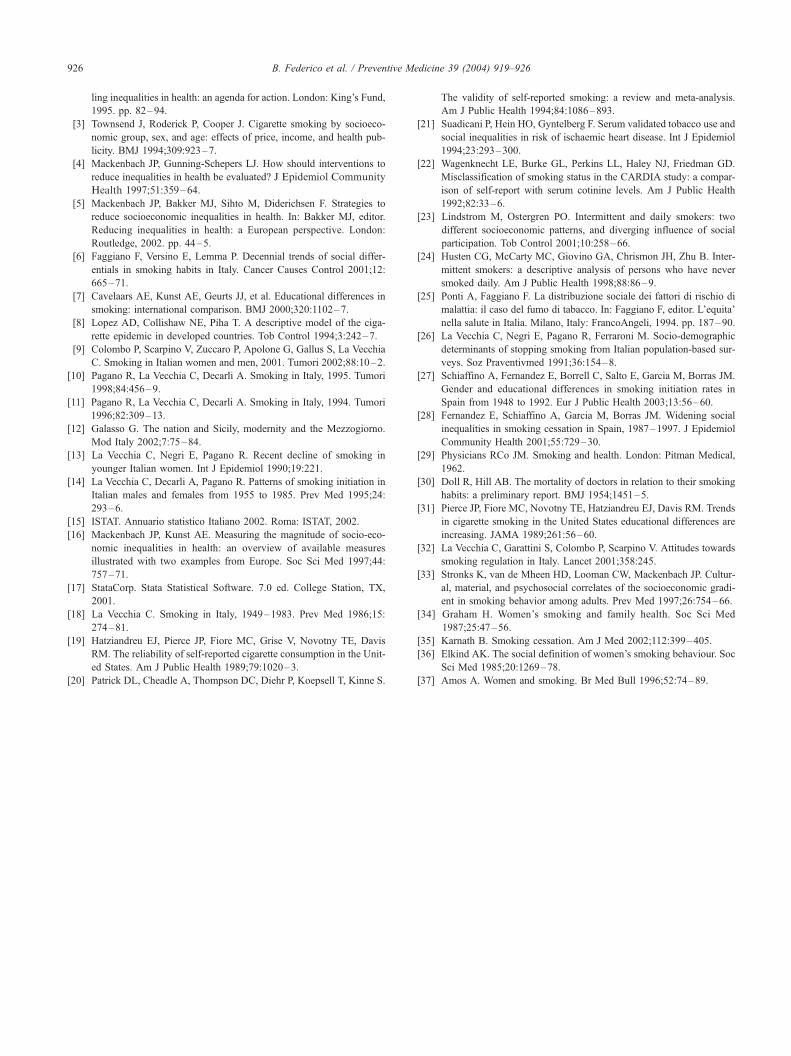
Table 3 shows the time trends in the prevalence of
smoking for men and women aged 25–49 for each mac-
ro-region. Among men, trends were similar in all macro-
regions, with a decrease in the use of tobacco for all
educational levels and larger declines among the more
educated. The ORs of current smoking increased over the
study period in all macro-regions (Fig. 2). Among 25- to 49-
year-old women, the prevalence in tobacco use was on the
vs. high educated (Italy, 1980–2000).

Table 3
Standardized prevalence rates and odds ratios of current smoking among men and women aged 25–49 by educational level (Italian macro-regions,
1983–2000)
Macro-region and Standardized prevalence rates of current smoking (%)
educational levelMen Women
1983 1999–2000 Diff. 1983 1999–2000 Diff.
Northwest
Elementary 60.4 56.0 � 4.4 25.3 28.9 + 3.6
Lower secondary 52.3 45.3 � 7.0 31.2 32.2 + 1.0
Upper secondary 48.6 31.9 � 16.7 30.9 23.5 � 7.4
Post-secondary 42.2 23.9 � 18.3 26.8 19.7 � 7.1
OR (95% CI) 1.45 (1.22, 1.71) 1.99 (1.77, 2.24) 0.91 (0.74, 1.11) 1.56 (1.38, 1.78)
Northeast
Elementary 47.4 39.7 � 7.7 27.4 33.2 + 5.8
Lower secondary 49.6 38.0 � 11.6 30.4 28.6 � 1.9
Upper secondary 48.5 31.7 � 16.8 35.7 23.9 � 11.8
Post-secondary 38.0 23.1 � 14.9 30.4 18.7 � 11.7
OR (95% CI) 1.11 (0.96, 1.29) 1.43 (1.27, 1.60) 0.72 (0.61, 0.86) 1.32 (1.16, 1.50)
Central
Elementary 58.5 47.9 � 10.6 23.4 26.0 + 2.6
Lower secondary 58.5 46.2 � 12.3 32.9 34.2 + 1.3
Upper secondary 54.8 35.2 � 19.6 40.0 27.7 � 12.3
Post-secondary 44.9 27.7 � 17.2 35.8 27.3 � 8.5
OR (95% CI) 1.33 (1.17, 1.52) 1.65 (1.46, 1.86) 0.58 (0.50, 0.67) 1.26 (1.11, 1.44)
South
Elementary 62.5 51.2 � 11.3 12.0 21.6 + 9.6
Lower secondary 61.0 47.4 � 13.6 22.6 22.0 � 0.6
Upper secondary 58.5 36.5 � 22.0 29.9 24.0 � 5.9
Post-secondary 53.7 29.3 � 24.4 30.2 20.9 � 9.3
OR (95% CI) 1.25 (1.08, 1.44) 1.72 (1.59, 1.86) 0.43 (0.36, 0.51) 0.89 (0.81, 0.97)
B. Federico et al. / Preventive Medicine 39 (2004) 919–926922
rise for the low educated, while it decreased for the high
educated. Estimates of ORs differed between macro-regions
between 1983 and 2000 (Table 3 and Fig. 2). Fig. 2 shows
that the ORs were higher in northern regions than in central
and southern Italy for all surveys, suggesting a delay in the
trends towards wider differentials. A higher prevalence of
smoking in the low educated was already present in 1986 in
the northwest, while it emerged in 1994 in northeast and in
2000 in central Italy. In the south, the prevalence rates of
low and high educated converged over time, but still in
2000, tobacco use was more common in high-educated
women.
Table 4 and Fig. 2 describe trends in smoking prevalence
for respondents aged 50–79 for the different macro-
regions. Among men, use of tobacco decreased in all
educational levels in each macro-region, with larger
decreases among the lower educated in almost all of the
macro-regions. The ORs decreased in all macro-regions but
the decrease did not reach statistical significance. For
women of the same age group, social differentials in the
prevalence of smoking attenuated over time across all
macro-regions, with ORs constantly lower than 1 over the
study period. Similar to the pattern observed for younger
women, ORs were constantly larger in northern regions and
smaller in the south.
Discussion
Summary of the results
In Italy, prevalence rates of smoking decreased in all
educational groups in men between 1980 and 2000: among
those aged 25–49, the decreases were largest among the
high educated; however, among older men, larger declines
were observed among the lower educated. Among women,
use of tobacco diminished for the high educated and
increased for the lowest educated. A reversal of the initially
positive association between education and tobacco use was
found for women aged 25–49 while in older women the
prevalence of smoking was larger among the high educated,
with a decreasing gap over time. There was no clear
geographical variation in changes in the social gradient in
smoking among men. Among women, the ORs of current
smoking between 1983 and 2000 were constantly higher in
northern regions than in central and southern Italy, suggest-
ing a delay in the trends towards wider differentials.
Evaluation of data problems
We used data from six consecutive Health Interview
Surveys, whose large sample sizes enabled us to obtain

Fig. 2. Odds ratios of current smoking of low vs. high educated (Italian macro-regions, 1980–2000); nw, northwest; ne, northeast; c, central; s, south.
B. Federico et al. / Preventive Medicine 39 (2004) 919–926 923
precise estimates of the OR of current smoking with narrow
confidence intervals.
Apart from random error, several systematic errors may
have biased our estimates. First, the accuracy of self-
reporting of smoking has been questioned [18–20]. How-
ever, our estimate of the educational inequality in tobacco
use would have been biased only if under-reporting of
smoking was differential among educational levels. To this
regard, there is no consistent evidence in the literature. A
study that used information about self-reported smoking and
serum cotinine level found no significant differences in the
misclassification of smokers between social classes [21].
Another study leads to the opposite conclusion [22]. The
observed time-trends may have been an artifact if misclas-
sification of smoking changed differently over time among
different educational groups, a possibility that is not very
likely.
Our study used information about current smoking only,
since not all surveys reported the distinction between regular
and occasional tobacco use. It is not clear whether intermit-
tent smoking is equally common among high and low
educated, since contrasting results are present in the litera-
ture [23,24]. If this was the case, the inclusion of both
occasional and daily smokers would not have affected
absolute socioeconomic differences, while leading to
smaller relative differences.
Increased mortality among smokers could also have
affected our estimates, especially in the case of elderly
respondents. If smokers had died earlier than nonsmokers,
especially in the case of the low educated, it is possible that at
each point in time (i.e. for each survey) we would have
observed a lower proportion of smokers among the low
educated, thus underestimating the inequality. On the other
hand, given the general mortality decline in Italy over the last
two decades, the effect of mortality selection might have
decreased over time, thus leading to ever less underestima-
tion. This would have resulted in an artificial widening of
inequalities in smoking. However, among older men, we
observed the reverse trends of decreasing inequalities in
smoking.
In conclusion, all these potential biases are not likely to
have substantially affected our estimates of trends in smok-
ing inequalities. Other factors need to be considered to
explain our findings.
Comparison with other studies
Our results are consistent with those of another study
carried out in Italy [6]. Faggiano et al. found that the social
gap in the prevalence of current smoking in men widened
over the period between 1980 and 1994, with prevalence
ratios (PR) of current smoking for the lowest compared to
the highest educated increasing from 1.21 to 1.47. A
decrease in the ‘‘protective’’ effect which favored less
educated women was also reported (PRs from 0.36 to
0.73), a decrease that we found to persist until the year
2000. However, this study did not consider distinct age
groups with regard to current smoking. We showed that the
socioeconomic inequality in smoking did not increase but
reduced among men aged 50–79.
Furthermore, we highlighted the presence of heterogene-
ity between regions in the magnitude of the social inequality
for women. This finding mirrors the results of an interna-
tional comparative study [7], which reported the presence of

Table 4
Standardized prevalence rates and odds ratios of current smoking among men and women aged 50–79 by educational level (Italian macro-regions,
1983–2000)
Macro-region and Standardized prevalence rates of current smoking (%)
educational levelMen Women
1983 1999–2000 Diff. 1983 1999–2000 Diff.
Northwest
Elementary 43.3 25.1 � 18.2 9.3 11.2 + 1.9
Lower secondary 41.0 27.0 � 14.0 23.2 17.9 � 5.3
Upper secondary 39.7 24.7 � 15.0 24.4 19.9 � 4.5
Post-secondary 37.5 22.3 � 15.2 14.2 18.7 + 4.5
OR (95% CI) 1.17 (0.91, 1.49) 1.10 (0.94, 1.29) 0.47 (0.33, 0.67) 0.63 (0.52, 0.77)
Northeast
Elementary 39.3 21.2 � 18.1 10.5 11.9 + 1.4
Lower secondary 41.5 23.1 � 18.4 16.8 19.3 + 2.5
Upper secondary 31.6 22.9 � 8.7 21.7 19.0 � 2.7
Post-secondary 32.3 23.7 � 8.6 29.3 18.6 � 10.7
OR (95% CI) 1.42 (1.12, 1.80) 0.95 (0.81, 1.12) 0.44 (0.32, 0.61) 0.71 (0.59, 0.87)
Central
Elementary 43.3 25.9 � 17.4 7.6 12.7 + 5.1
Lower secondary 42.4 27.8 � 14.6 18.0 19.3 + 1.3
Upper secondary 44.2 23.2 � 21.0 24.0 23.0 � 1.0
Post-secondary 34.4 29.4 � 5.0 28.9 24.0 � 4.9
OR (95% CI) 1.21 (1.00, 1.45) 1.05 (0.88, 1.24) 0.29 (0.22, 0.37) 0.56 (0.45, 0.69)
South
Elementary 44.3 27.8 � 16.5 2.1 5.4 + 3.3
Lower secondary 38.5 26.2 � 12.3 15.0 11.8 � 3.2
Upper secondary 37.5 25.7 � 11.8 15.3 16.5 + 1.2
Post-secondary 34.2 23.2 � 11.0 31.3 19.7 � 11.6
OR (95% CI) 1.31 (1.04, 1.64) 1.14 (1.02, 1.29) 0.14 (0.10, 0.21) 0.34 (0.29, 0.41)
B. Federico et al. / Preventive Medicine 39 (2004) 919–926924
a North–South gradient in the magnitude of the inequality.
Northern countries like Great Britain, Norway and Sweden
had larger social differences in smoking than southern
countries like Spain, Portugal and Italy. This international
pattern was most marked among women of different ages.
Our study shows that a similar north–south pattern held in
Italy among women over the last two decades.
Comparison with the smoking epidemic model
According to the model described by Lopez et al. [8],
as the smoking epidemic proceeds, use of tobacco becomes
increasingly more concentrated in the lower socioeconomic
groups. Thus, one would expect educational differences to
be larger at later stages of the epidemic and among
younger generations. Since males take up smoking first,
and only later this habit becomes more common among
females, larger inequalities would also exist among men
during the earlier stages of the epidemic. Most of our
findings, namely, the increase in inequality for young men
and women over time, as well as the larger inequalities in
men and among younger respondents, are consistent with
the predictions of the smoking epidemic model. On the
basis of this model, Italy is now approaching the end of
stage III of the epidemic, in which prevalence rates of
smoking decrease among men and start to decline among
women. Northern and central regions are in a more
advanced phase of the epidemic compared to southern
Italy.
One finding, that is the slightly declining educational
gradient in smoking for men aged 50–79, is in contrast with
the expectations based on the model. A possible explanation
will be described in the following paragraph.
Explanation of the key results
Our study examined period figures, namely, the prev-
alence of smoking among high and low educated at
different points in time. These figures are the results of
a complex interplay of inequalities in smoking initiation
and cessation rates among different cohorts. Unfortunately,
the literature on inequalities in smoking initiation and
cessation for different birth cohorts is scarce in Italy. A
study carried out in 1986 in Turin found that the likeli-
hood of taking up smoking before the age of 14 was about
two times higher among families with a low level of
education compared to those with the highest level [25].
With regard to cessation rates, La Vecchia et al. [26]
found that quit ratios (i.e. proportion of smokers who quit)
were directly related with education in both genders

B. Federico et al. / Preventive Medicine 39 (2004) 919–926 925
among participants of the 1983 and 1986 National Health
Interview Surveys.
The findings of several studies carried out in Spain, a
country with similar sociodemographic correlates of smok-
ing, may shed further light on the trends that we observed in
younger age groups in Italy. Widening socioeconomic
inequalities in initiation rates were found among men and
women from 1950 to 1990 in Spain [27]. Furthermore,
differences in cessation rates between high and low educat-
ed enlarged from 1987 to 1997 among men and women
aged 16–44 [28]. Thus, if similar changes applied in Italy,
widening inequalities in initiation rates and, to a lower
extent, increasing differences in cessation rates can explain
the increase in the inequality in smoking for Italian men and
women aged 25–49.
The slight reduction of inequality in smoking for men
aged 50–79, which contrasts with model predictions, might
be mainly due to a decrease in inequalities in cessation rates
between low and high educated. Although the probability of
quitting smoking was found to be constantly higher among
the highest educated during the 1980s, quit ratios increased
over time for all educational groups, thus narrowing the
absolute difference between high and low educated [25].
Also in Spain, quit ratios substantially increased between
1987 and 1997 for men and women from all socioeconomic
groups [28].
A more general social phenomenon, that is the changing
social attitudes towards smoking, underlies the changes in
the social distribution of smoking over time. After several
reports clarifying the effects of smoking on health were
published [29,30], smoking, as a social behavior, has
become less acceptable and increasingly stigmatized and
regulated. Social norms with respect to smoking and
smoking rates first changed in the United States, followed
by northern European countries [7]. Higher-educated peo-
ple were the first to quit smoking [31]. The changes in Italy
in the prevalence of smoking during the last two decades
may be related to similar factors, namely, a progressively
more widespread knowledge of the hazards of smoking
and, as a result, an increasing social disapproval of this
habit [32].
Other factors may explain why the rates of lower-
educated groups did not decrease as those of the higher
educated, and these include unfavorable material living
conditions and structural barriers to behavioral change
[33]. Smoking may act as a mean to cope with stressful
living circumstances [34]. The absence of freely available
nicotine-replacement therapies in Italy may have also hin-
dered lower social groups from decreasing their smoking
rates [35]. It is possible that the differential impact of these
factors is larger among younger men, since at older ages the
decision to quit smoking may be more determined by the
incidence of health problems.
On the other hand, several explanations can account for
the North–South gradient in the inequality in smoking
observed among women and these mainly relate to both
cultural and material factors. In fact, increasing acceptability
of smoking for women has occurred over the last decades
[36], with the use of tobacco symbolizing emancipation,
independence and freedom [37]. Low-educated women in
the south may have been more resistant to adopt a behavior
initially acceptable only for men, while women of both
upper and lower layers of northern regions may have
encountered looser social constraints to their behavior.
Low rates of women’s participation to the workforce, which
exemplify the presence of limitations to their conduct, have
first changed in northern regions among higher-educated
women [15]. A further explanation to the North–South
gradient relates to material circumstances and, particularly,
to poverty in the southern regions [12], which may have
prevented individuals of lower socioeconomic groups from
buying tobacco products in the past.
Conclusion
Our findings suggest that the smoking epidemic is still
progressing in Italy, implying widening socioeconomic
inequalities in smoking, particularly among younger gen-
erations. This progression is occurring with a substantial
time lag for central and especially southern regions com-
pared to northern Italy. It is difficult to establish to what
extent these trends are susceptible to policy measures, since
there was no comprehensive policy against smoking in Italy
till recent years [9]. The main challenge to policy-makers
remains to reduce smoking rates in the lower socioeconomic
groups, and especially to stop a further increase in tobacco
use among low-educated women in all regions.
Acknowledgments
We wish to express our gratitude to M. Avendano, K.
Giskes, M. Huisman and J.P. Mackenbach, Department of
Public Health, Erasmus Medical Center, Rotterdam (The
Netherlands); and to G. Ricciardi and L. Pinnarelli,
Department of Hygiene and Public Health, Catholic
University of Rome (Italy) for their valuable comments on
earlier drafts of this paper. We are also grateful to C.
Marinacci and A. Migliardi, Department of Public Health
and Microbiology, University of Turin (Italy), for providing
computerized data sets of the Italian National Health
Interview Surveys.
This study was partially supported by a grant of the
Italian Ministry of University and Education (cod.
2002065349_003).
References
[1] Jha P, Chaloupka FJ. Curbing the epidemic: governments and the
economics of tobacco control. Washington (DC): World Bank, 1999.
[2] Townsend J. The burden of smoking. In: Whitehead M, editor. Tack-
B. Federico et al. / Preventive Medicine 39 (2004) 919–926926
ling inequalities in health: an agenda for action. London: King’s Fund,
1995. pp. 82–94.
[3] Townsend J, Roderick P, Cooper J. Cigarette smoking by socioeco-
nomic group, sex, and age: effects of price, income, and health pub-
licity. BMJ 1994;309:923–7.
[4] Mackenbach JP, Gunning-Schepers LJ. How should interventions to
reduce inequalities in health be evaluated? J Epidemiol Community
Health 1997;51:359–64.
[5] Mackenbach JP, Bakker MJ, Sihto M, Diderichsen F. Strategies to
reduce socioeconomic inequalities in health. In: Bakker MJ, editor.
Reducing inequalities in health: a European perspective. London:
Routledge, 2002. pp. 44–5.
[6] Faggiano F, Versino E, Lemma P. Decennial trends of social differ-
entials in smoking habits in Italy. Cancer Causes Control 2001;12:
665–71.
[7] Cavelaars AE, Kunst AE, Geurts JJ, et al. Educational differences in
smoking: international comparison. BMJ 2000;320:1102–7.
[8] Lopez AD, Collishaw NE, Piha T. A descriptive model of the ciga-
rette epidemic in developed countries. Tob Control 1994;3:242–7.
[9] Colombo P, Scarpino V, Zuccaro P, Apolone G, Gallus S, La Vecchia
C. Smoking in Italian women and men, 2001. Tumori 2002;88:10–2.
[10] Pagano R, La Vecchia C, Decarli A. Smoking in Italy, 1995. Tumori
1998;84:456–9.
[11] Pagano R, La Vecchia C, Decarli A. Smoking in Italy, 1994. Tumori
1996;82:309–13.
[12] Galasso G. The nation and Sicily, modernity and the Mezzogiorno.
Mod Italy 2002;7:75–84.
[13] La Vecchia C, Negri E, Pagano R. Recent decline of smoking in
younger Italian women. Int J Epidemiol 1990;19:221.
[14] La Vecchia C, Decarli A, Pagano R. Patterns of smoking initiation in
Italian males and females from 1955 to 1985. Prev Med 1995;24:
293–6.
[15] ISTAT. Annuario statistico Italiano 2002. Roma: ISTAT, 2002.
[16] Mackenbach JP, Kunst AE. Measuring the magnitude of socio-eco-
nomic inequalities in health: an overview of available measures
illustrated with two examples from Europe. Soc Sci Med 1997;44:
757–71.
[17] StataCorp. Stata Statistical Software. 7.0 ed. College Station, TX,
2001.
[18] La Vecchia C. Smoking in Italy, 1949–1983. Prev Med 1986;15:
274–81.
[19] Hatziandreu EJ, Pierce JP, Fiore MC, Grise V, Novotny TE, Davis
RM. The reliability of self-reported cigarette consumption in the Unit-
ed States. Am J Public Health 1989;79:1020–3.
[20] Patrick DL, Cheadle A, Thompson DC, Diehr P, Koepsell T, Kinne S.
The validity of self-reported smoking: a review and meta-analysis.
Am J Public Health 1994;84:1086–893.
[21] Suadicani P, Hein HO, Gyntelberg F. Serum validated tobacco use and
social inequalities in risk of ischaemic heart disease. Int J Epidemiol
1994;23:293–300.
[22] Wagenknecht LE, Burke GL, Perkins LL, Haley NJ, Friedman GD.
Misclassification of smoking status in the CARDIA study: a compar-
ison of self-report with serum cotinine levels. Am J Public Health
1992;82:33–6.
[23] Lindstrom M, Ostergren PO. Intermittent and daily smokers: two
different socioeconomic patterns, and diverging influence of social
participation. Tob Control 2001;10:258–66.
[24] Husten CG, McCarty MC, Giovino GA, Chrismon JH, Zhu B. Inter-
mittent smokers: a descriptive analysis of persons who have never
smoked daily. Am J Public Health 1998;88:86–9.
[25] Ponti A, Faggiano F. La distribuzione sociale dei fattori di rischio di
malattia: il caso del fumo di tabacco. In: Faggiano F, editor. L’equita’
nella salute in Italia. Milano, Italy: FrancoAngeli, 1994. pp. 187–90.
[26] La Vecchia C, Negri E, Pagano R, Ferraroni M. Socio-demographic
determinants of stopping smoking from Italian population-based sur-
veys. Soz Praventivmed 1991;36:154–8.
[27] Schiaffino A, Fernandez E, Borrell C, Salto E, Garcia M, Borras JM.
Gender and educational differences in smoking initiation rates in
Spain from 1948 to 1992. Eur J Public Health 2003;13:56–60.
[28] Fernandez E, Schiaffino A, Garcia M, Borras JM. Widening social
inequalities in smoking cessation in Spain, 1987–1997. J Epidemiol
Community Health 2001;55:729–30.
[29] Physicians RCo JM. Smoking and health. London: Pitman Medical,
1962.
[30] Doll R, Hill AB. The mortality of doctors in relation to their smoking
habits: a preliminary report. BMJ 1954;1451–5.
[31] Pierce JP, Fiore MC, Novotny TE, Hatziandreu EJ, Davis RM. Trends
in cigarette smoking in the United States educational differences are
increasing. JAMA 1989;261:56–60.
[32] La Vecchia C, Garattini S, Colombo P, Scarpino V. Attitudes towards
smoking regulation in Italy. Lancet 2001;358:245.
[33] Stronks K, van de Mheen HD, Looman CW, Mackenbach JP. Cultur-
al, material, and psychosocial correlates of the socioeconomic gradi-
ent in smoking behavior among adults. Prev Med 1997;26:754–66.
[34] Graham H. Women’s smoking and family health. Soc Sci Med
1987;25:47–56.
[35] Karnath B. Smoking cessation. Am J Med 2002;112:399–405.
[36] Elkind AK. The social definition of women’s smoking behaviour. Soc
Sci Med 1985;20:1269–78.
[37] Amos A. Women and smoking. Br Med Bull 1996;52:74–89.