trends in educational equity of girls & women
TRANSCRIPT

Trends inEducational Equityof Girls & Women:2004
U.S. Department of EducationInstitute of Education SciencesNCES 2005–016
Catherine E. FreemanNational Center forEducation Statistics
Trends inEducational Equityof Girls & Women:2004
November 2004
U.S. Department of EducationU.S. Department of EducationU.S. Department of EducationU.S. Department of EducationU.S. Department of EducationInstitute of Education SciencesNCES 2005–016
U.S. Department of EducationRod PaigeSecretary
Institute of Education SciencesGrover J. WhitehurstDirector
National Center for Education StatisticsRobert LernerCommissioner
The National Center for Education Statistics (NCES) is the primary federal entity for collecting,analyzing, and reporting data related to education in the United States and other nations. It fulfills acongressional mandate to collect, collate, analyze, and report full and complete statistics on thecondition of education in the United States; conduct and publish reports and specialized analyses ofthe meaning and significance of such statistics; assist state and local education agencies inimproving their statistical systems; and review and report on education activities in foreign countries.
NCES activities are designed to address high priority education data needs; provide consistent, reliable,complete, and accurate indicators of education status and trends; and report timely, useful, and highquality data to the U.S. Department of Education, the Congress, the states, other education policymakers,practitioners, data users, and the general public.
We strive to make our products available in a variety of formats and in language that is appropriate toa variety of audiences. You, as our customer, are the best judge of our success in communicatinginformation effectively. If you have any comments or suggestions about this or any other NCES productor report, we would like to hear from you. Please direct your comments to:
National Center for Education StatisticsInstitute of Education SciencesU.S. Department of Education1990 K Street NWWashington, DC 20006–5651
November 2004
The NCES World Wide Web Home Page address is http://nces.ed.govThe NCES World Wide Web Electronic Catalog is http://nces.ed.gov/pubsearch
Suggested Citation
Freeman, C.E. (2004). Trends in Educational Equity of Girls & Women: 2004 (NCES 2005–016). U.S. Departmentof Education, National Center for Education Statistics. Washington, DC: U.S. Government Printing Office.
For ordering information on this report, write:U.S. Department of EducationED PubsP.O. Box 1398Jessup, MD 20794–1398
Call toll free 1–877–4ED–Pubs; or order online at www.edpubs.org
Content Contact:Catherine E. Freeman(202) 502–[email protected]
iiiTrends in Educational Equity of Girls & Women: 2004
ACKNOWLEDGMENTS
Many people have contributed in one way oranother to Trends in Educational Equity of Girls &Women: 2004. Catherine Freeman was respon-sible for the development of this report, whichwas prepared under the general direction of Tho-mas Snyder and Valena Plisko of the NationalCenter for Education Statistics (NCES).
Christina Stearns (formerly) of the American In-stitutes for Research (AIR) contributed to theexecutive summary and wrote some of the indi-cators. Indicators were also prepared by BrookeConnolly and Linda Hamilton of the EducationStatistics Services Institute (ESSI).
A number of individuals expended large amountsof time and effort on Trends in Educational Equityof Girls & Women: 2004. William Sonnenberg(NCES) provided statistical computing assistancefor many indicators. Heather Block, ElinaHartwell, and Hallie Shell (ESSI) designed thelayout and cover of the publication, and managed
the typesetting. Ruth Atchison (ESSI) copyeditedthe manuscript. Susan Lapham and Mary Ann Fox(ESSI) provided general support.
Trends in Educational Equity of Girls & Women:2004 received extensive reviews by individualswithin the U.S. Department of Education. Wewish to thank them for their time and expert ad-vice. Robert Lerner (NCES), Thomas Corwin(Office of Innovation and Improvement), MichaelPetrilli (Office of Innovation and Improvement),Nancy Rhett (Office of the Under Secretary), AnneRicciuti (Institute of Education Sciences), LynnOkagaki (Institute of Education Sciences),Laurence Ogle (NCES), Jerry West (NCES), andCarol Chelemer (NCES), and Wilma Greene(NCES) reviewed the document. William Hussar(NCES) conducted a technical review of the re-port. Marilyn Seastrom (Chief Statistician, NCES)reviewed the entire document.

vTrends in Educational Equity of Girls & Women: 2004
TABLE OF CONTENTS
ACKNOWLEDGMENTS .............................................................................. iii
EXECUTIVE SUMMARY .............................................................................. 1
PREPRIMARY AND EARLY ELEMENTARY EDUCATION1. Preprimary and Kindergarten Enrollment ............................................ 18
2. Reading at Home .................................................................................... 20
3. Early Reading and General Knowledge Achievement ...................... 22
4. Early Mathematics Achievement ......................................................... 24
ELEMENTARY AND SECONDARY EDUCATION5. Reading and Writing Achievement ...................................................... 28
6. Mathematics and Science Achievement ........................................... 30
7. Geography and U.S. History Achievement .......................................... 32
8. International Reading Performance of Fourth-Graders ...................... 34
9. International Reading and Mathematics Performance of15-Year-Olds ............................................................................................. 36
10. Computer Use ......................................................................................... 38
11. Grade Retention ..................................................................................... 40
12. Children With Disabilities ....................................................................... 42
13. Student Attitudes Toward School .......................................................... 44
14. Obesity and Physical Education Participation .................................... 46
15. Afterschool Activities .............................................................................. 48
16. Victimization at School .......................................................................... 50
17. Student Behavior and School Violence ............................................... 52
18. Alcohol and Other Drug Use ................................................................. 54
19. Dropouts .................................................................................................. 56
Trends in Educational Equity of Girls & Women: 2004vi
20. Educational Attainment of Childbearing Teens .................................. 58
21. High School Coursetaking Patterns ..................................................... 60
22. Advanced Placement Examinations.................................................... 62
POSTSECONDARY EDUCATION23. College Plans .......................................................................................... 66
24. Transition to College .............................................................................. 68
25. College Enrollment ................................................................................. 70
26. College Athletics .................................................................................... 72
27. Working While Enrolled in College ........................................................ 74
28. Persistence Toward and Completion of a Bachelor’s Degree .......... 76
29. Undergraduate Degrees ........................................................................ 78
30. Undergraduate Degrees for Minority Females .................................... 80
31. Graduate Degrees .................................................................................. 82
32. Adult Education ...................................................................................... 84
33. Educational Attainment ......................................................................... 86
34. International Educational Attainment .................................................. 88
OUTCOMES35. Employment of Young Adults ................................................................. 92
36. Median Earnings of Young Females ..................................................... 94
37. International Labor Force Participation ............................................... 96
38. Education and Earnings ......................................................................... 98
APPENDIX A: Supplemental Tables ..................................................... 101
BIBLIOGRAPHY ..................................................................................... 107
1Trends in Educational Equity of Girls & Women: 2004
EXECUTIVE SUMMARY
indicator shows the status of females relative tomales. Some indicators include further break-downs, such as those by race/ethnicity; however,the general focus of this report is on overallcomparisons between males and females and noton the experiences of various subgroups, whichmay show different patterns. The data for theindicators are drawn primarily from surveys con-ducted by the National Center for EducationStatistics (NCES), although several other sourcesof national and international data are used aswell. Although these indicators provide valu-able information on many aspects of educationalequity, some important topics cannot be ad-dressed with available, nationally representativedata. Examples of such topics include the ex-tent to which sexual harassment undermines theability of schools to provide a safe and comfort-able learning environment and whether girls andyoung women are encouraged to challenge them-selves in their educational pursuits, especiallyin mathematics and science.
The data presented in this publication demon-strate that in elementary and secondary schooland in college, females are now doing as well asor better than males on many indicators ofachievement and educational attainment, andthat large gaps that once existed between malesand females have been eliminated in most casesand have significantly decreased in other cases.Women are still underrepresented in some fieldsof study, as well as more generally in doctoral andfirst-professional degree programs, although they
This report draws upon a wide range of publishedand unpublished statistical materials to present anoverview of the educational status of girls andwomen in the United States. Trends in EducationalEquity of Girls & Women contains a selection ofindicators that illustrate the educational gains madeby females in recent years as well as areas wheregaps continue to exist. This statistical report as-sembles a series of indicators that examine theextent to which males and females have access tothe same educational opportunities, avail them-selves equally of these opportunities, perform atsimilar levels throughout schooling, succeed at simi-lar rates, and reap the same benefits from theireducational experiences.
This report serves as an update of an earlier pub-lication, Trends in Educational Equity of Girls &Women (NCES 2000-030). General topics cov-ered by this report are similar to those addressedin the 2000 report. Many indicators that wereincluded in the 2000 report have been updatedwith the most recent data available. In addition,a number of new indicators have been added,designed to reflect the most current research ontopics relevant to educational equity.
The report begins with an overview that sum-marizes the report’s major findings. A series of38 indicators follow, which examine various fac-ets of educational equity. The indicators beginwith preprimary and early elementary educa-tion, move through elementary and secondaryeducation and postsecondary education, and fi-nally, consider educational outcomes. Each

Trends in Educational Equity of Girls & Women: 20042
have made substantial gains in the past 30 years.These differences may have labor market conse-quences.
Preprimary and Early ElementaryEducationCertain kinds of preschool experiences, such asparticipating in high-quality preprimary programsand engaging in early literacy activities with par-ents, are widely believed to help prepare youngchildren for the more structured learning thattakes place in elementary school. Therefore,whether males and females have the same accessto these kinds of opportunities is of interest froman educational equity standpoint.
In terms of many learning opportunities,males and females start school on asimilar footing. In certain other areas,females appear to start school ahead.
Between 1990 and 2001, the percentage of 3- to5-year-olds enrolled in preprimary programs andkindergarten increased. In 2001, similar percent-ages of males (63 percent) and females (64 percent)were enrolled in preprimary and kindergarten edu-cation (indicator 1). However, in terms of earlylearning experiences in the home, a higher per-centage of females (86 percent) than males (82percent) had been read to three or more times inthe past week (indicator 2). For both males andfemales, participation in literacy activities gener-ally increased between 1991 and 2001.
General knowledge assessments indicate thatmales and females are similar in terms of theirgeneral knowledge in kindergarten and first grade.Males and females also generally performed simi-larly on the overall reading assessment; however,higher percentages of females (80 percent) thanmales (73 percent) could recognize words by sightin the spring of first grade. Males and females hadsimilar levels of sight word recognition in thirdgrade (indicator 3).
Kindergartners who entered in the fall of 1998increased their overall mathematics performancescores by 10 points by the spring of their kin-dergarten year compared to their initialassessment. By the end of third grade, these stu-dents more than tripled their performance. Withthe exception of the third-grade assessment,males and females performed similarly on overall
mathematics performance. In third grade, malesscored higher than females, 87 to 83 (indicator4). No differences were detected between malesand females on any of the assessments of additionand subtraction skills.
Elementary and SecondaryEducationBecause school attendance is generally compul-sory between ages 6 and 16, equal access toschooling at the elementary and secondary levelis not at issue. However, many topics beyondaccess to schooling remain of critical importancefrom an equity standpoint, such as the extent towhich males and females have access to the sametypes of educational opportunities, take similaradvantage of these opportunities, and achieve atthe same level while in school. Data on variousaspects of the elementary and secondary schoolexperiences of males and females—such as theirprogress through school, academic performance,access to computers, and participation in extra-curricular activities—provide some indication ofthe extent to which gender equity in educationhas been achieved.
Progress Through School
Females are less likely than males torepeat a grade and to drop out.
The percentage of 5- to 12-year-old males whohad repeated at least one grade declined between1996 and 1999. In 1999, females ages 5 to 12years old were less likely than males of the sameage to have repeated a grade: approximately 8percent of males compared to 5 percent of fe-males had repeated a grade since starting school(indicator 11). In recent years, females have alsobecome less likely than males to drop out of highschool; for example, in 2001, the status dropoutrate for 16- to 24-year-olds (i.e., the percentagewho had not completed high school and werenot enrolled in school) was 12 percent for males,compared to 9 percent for females (indicator 19).This marks a change from the general pattern inthe 1970s, when dropout rates were similar formales and females.
The status dropout rate decreased for both malesand females between 1972 and 2001. When ex-amined by sex and race/ethnicity, the dropoutrate of White males and females, Black males
EXECUTIVE SUMMARY
3Trends in Educational Equity of Girls & Women: 2004
and females, and Hispanic females decreased dur-ing this period, while no decrease was detectedfor Hispanic males.
Males and females who have a child in high schoolare more likely to drop out of high school andless likely to receive a bachelor’s degree (indicator20). Among females who were eighth-graders in1988, 71 percent who had a child in high schoolhad completed high school as of 2000, comparedto 95 percent who had no child as of 2000. Fur-thermore, only 2 percent of females who had achild in high school had received a bachelor’sdegree by 2000, compared to 44 percent of thosewith no child. Becoming a parent while still inhigh school was related to the educational at-tainment of males as well. Males who becamefathers in high school were significantly less likelythan those who were not fathers, as of 2000, tohave completed high school (65 percent vs. 94percent) and to have received a bachelor’s degree(4 percent vs. 36 percent).
On a variety of measures, males seemto be more likely than females toexperience serious problems at schooland to engage in risky behaviors.
Evidence suggests that females are less likely thanmales to have certain problems, such as beingdiagnosed with a learning disability and beingvictimized at school, which may negatively affecttheir progress through school (The Condition ofEducation 1997, NCES 97-388). In 1999, malesin grades 1–5 were more likely than females tohave been identified as having a disability (21percent vs. 14 percent, respectively; indicator 12).In particular, males were more likely than fe-males to have been identified with a learningdisability, emotional disturbance, and speechimpediment.
In 2001, among 12- to 18-year-old students, thepercentage of males who reported that they hadexperienced criminal victimization at school dur-ing the previous 6 months was higher than thepercentage of females reporting the same experi-ence (6 vs. 5 percent). Similarly, a higherpercentage of males than females reported beingbullied at school (9 vs. 7 percent, indicator 16).
In addition, female students appear to be lesslikely than male students to engage in certainbehaviors, such as drug use and violence that
may put themselves and others at risk. In 2001,females in grades 9-12 were less likely than malesto report using alcohol at least once in the previ-ous 30 days on school property (4 vs. 6 percent)as well as in general (45 vs. 49 percent). Like-wise, high school females were also less likelythan their male counterparts to report using mari-juana at least once in the previous 30 days onschool property (3 vs. 8 percent) as well as ingeneral (20 vs. 28 percent, indicator 18). Thepercentage of students who reported being of-fered or given an illegal drug on school propertyin the previous 12 months was also lower forfemales (23 percent) than males (35 percent).Overall, the percentages of students who reportedusing cigarettes, marijuana, and who were of-fered, sold, or given an illegal drug on schoolproperty decreased between 1997 and 2001.However, there was no decrease detected duringthis period in the percentage of students whoreported using alcohol on school property. Malesin these grades were also much more likely thanfemales to engage in certain violent activities onschool property; higher percentages of males thanfemales reported being in a physical fight in theprevious 12 months (18 percent vs. 7 percent),and carrying a weapon to school in the previous30 days (10 percent vs. 3 percent; indicator 17).
High school seniors’ attitudes towardschool have become increasinglynegative, particularly among females.
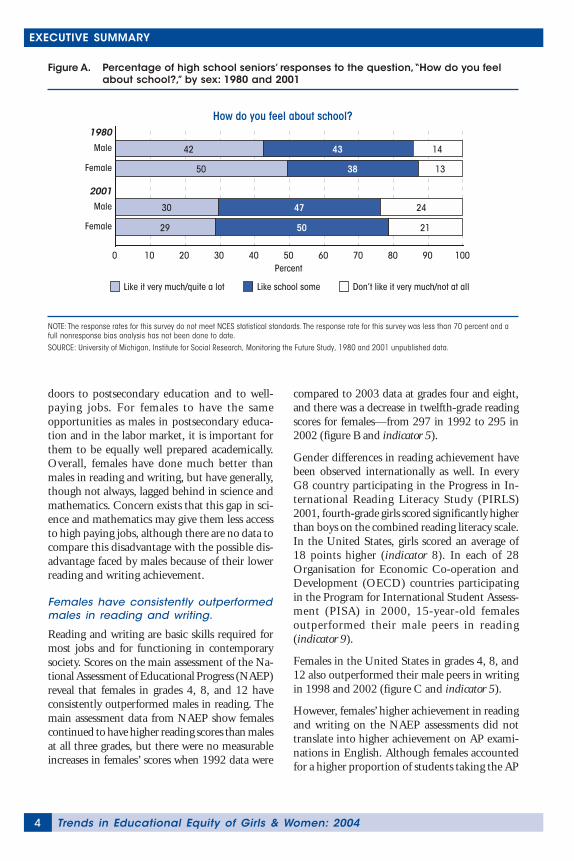
Despite apparent differences in the extent towhich females and males experience certain prob-lems as they progress through school, the generalattitudes of male and female high school seniorstoward school were similar in 2001; 29 percentof females and 30 percent of males reported lik-ing school very much (figure A and indicator 13).This marked a change from 1980, when femaleswere more likely than males to report likingschool. It also marked a decline, among bothmales and females, in these positive attitudes to-ward school from 1980, when 50 percent offemales and 42 percent of males reported likingschool very much. This decline occurred at a fasterrate for females than for males.
Academic PerformanceAcademic performance is a key measure of schoolsuccess because high performance in school opens
EXECUTIVE SUMMARY
Trends in Educational Equity of Girls & Women: 20044
doors to postsecondary education and to well-paying jobs. For females to have the sameopportunities as males in postsecondary educa-tion and in the labor market, it is important forthem to be equally well prepared academically.Overall, females have done much better thanmales in reading and writing, but have generally,though not always, lagged behind in science andmathematics. Concern exists that this gap in sci-ence and mathematics may give them less accessto high paying jobs, although there are no data tocompare this disadvantage with the possible dis-advantage faced by males because of their lowerreading and writing achievement.
Females have consistently outperformedmales in reading and writing.
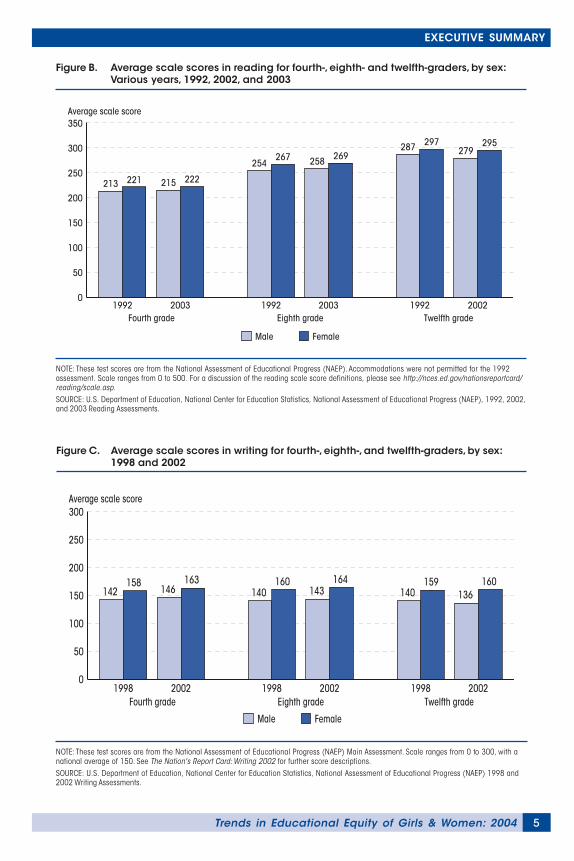
Reading and writing are basic skills required formost jobs and for functioning in contemporarysociety. Scores on the main assessment of the Na-tional Assessment of Educational Progress (NAEP)reveal that females in grades 4, 8, and 12 haveconsistently outperformed males in reading. Themain assessment data from NAEP show femalescontinued to have higher reading scores than malesat all three grades, but there were no measurableincreases in females’ scores when 1992 data were
compared to 2003 data at grades four and eight,and there was a decrease in twelfth-grade readingscores for females—from 297 in 1992 to 295 in2002 (figure B and indicator 5).
Gender differences in reading achievement havebeen observed internationally as well. In everyG8 country participating in the Progress in In-ternational Reading Literacy Study (PIRLS)2001, fourth-grade girls scored significantly higherthan boys on the combined reading literacy scale.In the United States, girls scored an average of18 points higher (indicator 8). In each of 28Organisation for Economic Co-operation andDevelopment (OECD) countries participatingin the Program for International Student Assess-ment (PISA) in 2000, 15-year-old femalesoutperformed their male peers in reading(indicator 9).
Females in the United States in grades 4, 8, and12 also outperformed their male peers in writingin 1998 and 2002 (figure C and indicator 5).
However, females’ higher achievement in readingand writing on the NAEP assessments did nottranslate into higher achievement on AP exami-nations in English. Although females accountedfor a higher proportion of students taking the AP
Figure A. Percentage of high school seniors’ responses to the question, “How do you feelabout school?,” by sex: 1980 and 2001
NOTE: The response rates for this survey do not meet NCES statistical standards. The response rate for this survey was less than 70 percent and afull nonresponse bias analysis has not been done to date.SOURCE: University of Michigan, Institute for Social Research, Monitoring the Future Study, 1980 and 2001 unpublished data.
How do you feel about school?
0 40Percent
60 802010 50 70 9030 100
Like it very much/quite a lot Like school some Don’t like it very much/not at all
Female
Male
2001
Female
Male
1980
42 43 14
50 38 13
30 47 24
29 50 21
EXECUTIVE SUMMARY
5Trends in Educational Equity of Girls & Women: 2004
Figure B. Average scale scores in reading for fourth-, eighth- and twelfth-graders, by sex:Various years, 1992, 2002, and 2003
NOTE: These test scores are from the National Assessment of Educational Progress (NAEP). Accommodations were not permitted for the 1992assessment. Scale ranges from 0 to 500. For a discussion of the reading scale score definitions, please see http://nces.ed.gov/nationsreportcard/reading/scale.asp.SOURCE: U.S. Department of Education, National Center for Education Statistics, National Assessment of Educational Progress (NAEP), 1992, 2002,and 2003 Reading Assessments.
Figure C. Average scale scores in writing for fourth-, eighth-, and twelfth-graders, by sex:1998 and 2002
NOTE: These test scores are from the National Assessment of Educational Progress (NAEP) Main Assessment. Scale ranges from 0 to 300, with anational average of 150. See The Nation's Report Card: Writing 2002 for further score descriptions.SOURCE: U.S. Department of Education, National Center for Education Statistics, National Assessment of Educational Progress (NAEP) 1998 and2002 Writing Assessments.
Male Female
Average scale score
Fourth grade Eighth grade Twelfth grade1992 2003 1992 2003 1992 2002
0
50
100
150
200
250
300
350
213 221 215 222
254267 258 269
287 297279
295
Male Female
Average scale score
0
50
100
150
200
250
300
Fourth grade Eighth grade Twelfth grade1998
142158
2002
146163
1998
140160
2002
143164
1998
140159
2002
136160
EXECUTIVE SUMMARY
Trends in Educational Equity of Girls & Women: 20046
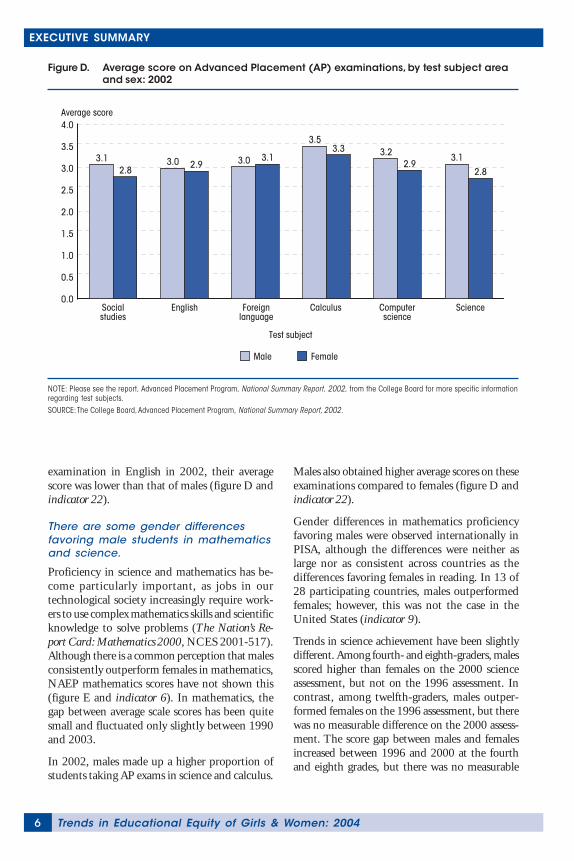
examination in English in 2002, their averagescore was lower than that of males (figure D andindicator 22).
There are some gender differencesfavoring male students in mathematicsand science.
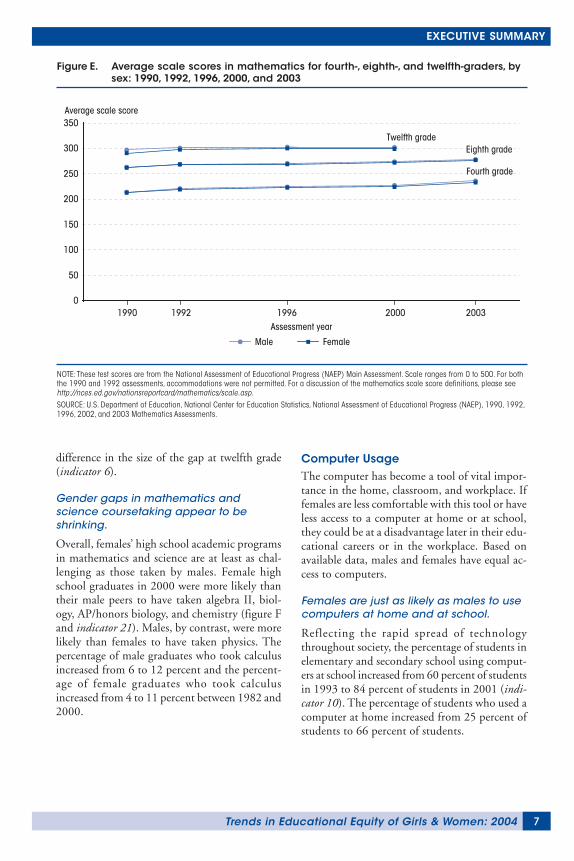
Proficiency in science and mathematics has be-come particularly important, as jobs in ourtechnological society increasingly require work-ers to use complex mathematics skills and scientificknowledge to solve problems (The Nation’s Re-port Card: Mathematics 2000, NCES 2001-517).Although there is a common perception that malesconsistently outperform females in mathematics,NAEP mathematics scores have not shown this(figure E and indicator 6). In mathematics, thegap between average scale scores has been quitesmall and fluctuated only slightly between 1990and 2003.
In 2002, males made up a higher proportion ofstudents taking AP exams in science and calculus.
Males also obtained higher average scores on theseexaminations compared to females (figure D andindicator 22).
Gender differences in mathematics proficiencyfavoring males were observed internationally inPISA, although the differences were neither aslarge nor as consistent across countries as thedifferences favoring females in reading. In 13 of28 participating countries, males outperformedfemales; however, this was not the case in theUnited States (indicator 9).
Trends in science achievement have been slightlydifferent. Among fourth- and eighth-graders, malesscored higher than females on the 2000 scienceassessment, but not on the 1996 assessment. Incontrast, among twelfth-graders, males outper-formed females on the 1996 assessment, but therewas no measurable difference on the 2000 assess-ment. The score gap between males and femalesincreased between 1996 and 2000 at the fourthand eighth grades, but there was no measurable
NOTE: Please see the report, Advanced Placement Program, National Summary Report, 2002, from the College Board for more specific informationregarding test subjects.SOURCE: The College Board, Advanced Placement Program, National Summary Report, 2002.
Figure D. Average score on Advanced Placement (AP) examinations, by test subject areaand sex: 2002
Male Female
Average score
Test subject
Socialstudies
English Foreignlanguage
Calculus Computerscience
Science0.0
1.0
2.0
3.0
0.5
1.5
2.5
3.5
4.0
3.12.8
3.0 2.9 3.0 3.1
3.53.3 3.2
2.93.1
2.8
EXECUTIVE SUMMARY
7Trends in Educational Equity of Girls & Women: 2004
difference in the size of the gap at twelfth grade(indicator 6).
Gender gaps in mathematics andscience coursetaking appear to beshrinking.
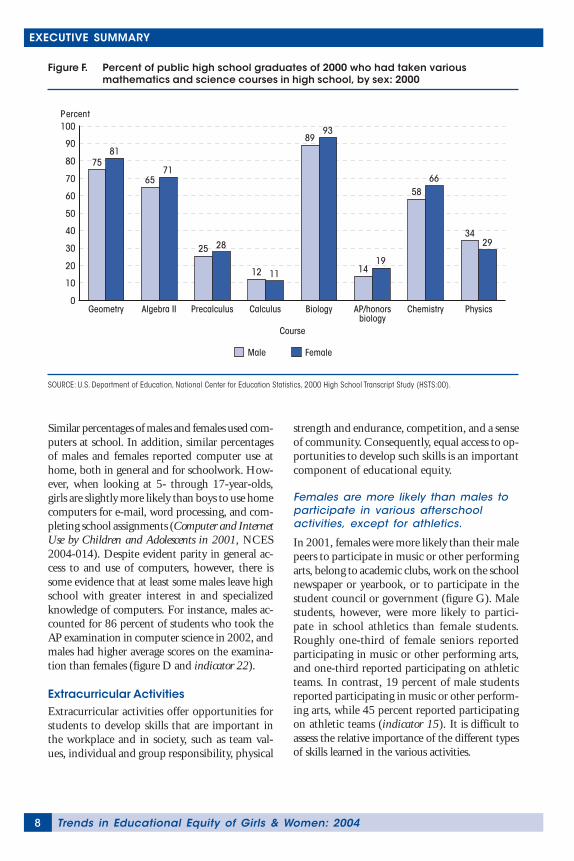
Overall, females’ high school academic programsin mathematics and science are at least as chal-lenging as those taken by males. Female highschool graduates in 2000 were more likely thantheir male peers to have taken algebra II, biol-ogy, AP/honors biology, and chemistry (figure Fand indicator 21). Males, by contrast, were morelikely than females to have taken physics. Thepercentage of male graduates who took calculusincreased from 6 to 12 percent and the percent-age of female graduates who took calculusincreased from 4 to 11 percent between 1982 and2000.
Computer UsageThe computer has become a tool of vital impor-tance in the home, classroom, and workplace. Iffemales are less comfortable with this tool or haveless access to a computer at home or at school,they could be at a disadvantage later in their edu-cational careers or in the workplace. Based onavailable data, males and females have equal ac-cess to computers.
Females are just as likely as males to usecomputers at home and at school.
Reflecting the rapid spread of technologythroughout society, the percentage of students inelementary and secondary school using comput-ers at school increased from 60 percent of studentsin 1993 to 84 percent of students in 2001 (indi-cator 10). The percentage of students who used acomputer at home increased from 25 percent ofstudents to 66 percent of students.
Figure E. Average scale scores in mathematics for fourth-, eighth-, and twelfth-graders, bysex: 1990, 1992, 1996, 2000, and 2003
NOTE: These test scores are from the National Assessment of Educational Progress (NAEP) Main Assessment. Scale ranges from 0 to 500. For boththe 1990 and 1992 assessments, accommodations were not permitted. For a discussion of the mathematics scale score definitions, please seehttp://nces.ed.gov/nationsreportcard/mathematics/scale.asp.SOURCE: U.S. Department of Education, National Center for Education Statistics, National Assessment of Educational Progress (NAEP), 1990, 1992,1996, 2002, and 2003 Mathematics Assessments.
Eighth grade Twelfth grade
Fourth grade
Average scale score
Assessment year
Male Female
1990 1992 1996 2000 20030
50
100
150
200
250
300
350
EXECUTIVE SUMMARY
Trends in Educational Equity of Girls & Women: 20048
Similar percentages of males and females used com-puters at school. In addition, similar percentagesof males and females reported computer use athome, both in general and for schoolwork. How-ever, when looking at 5- through 17-year-olds,girls are slightly more likely than boys to use homecomputers for e-mail, word processing, and com-pleting school assignments (Computer and InternetUse by Children and Adolescents in 2001, NCES2004-014). Despite evident parity in general ac-cess to and use of computers, however, there issome evidence that at least some males leave highschool with greater interest in and specializedknowledge of computers. For instance, males ac-counted for 86 percent of students who took theAP examination in computer science in 2002, andmales had higher average scores on the examina-tion than females (figure D and indicator 22).
Extracurricular ActivitiesExtracurricular activities offer opportunities forstudents to develop skills that are important inthe workplace and in society, such as team val-ues, individual and group responsibility, physical
strength and endurance, competition, and a senseof community. Consequently, equal access to op-portunities to develop such skills is an importantcomponent of educational equity.
Females are more likely than males toparticipate in various afterschoolactivities, except for athletics.
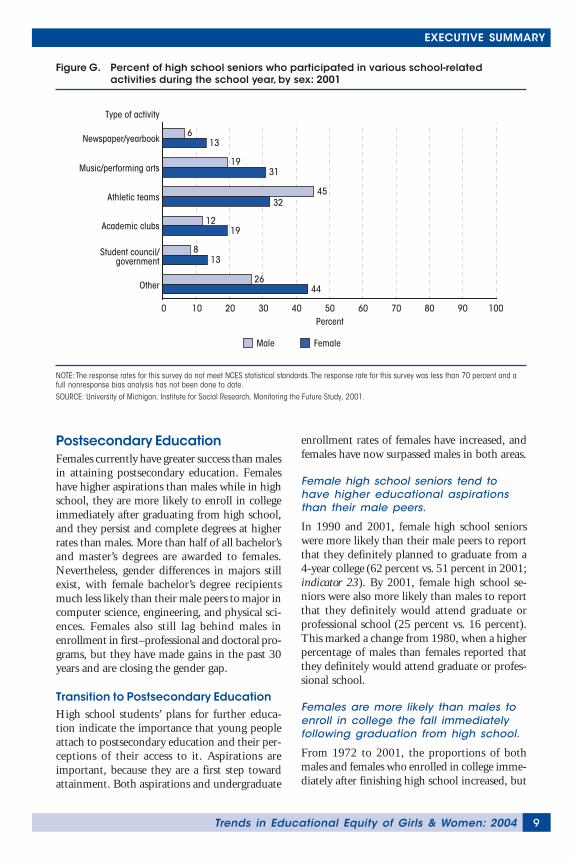
In 2001, females were more likely than their malepeers to participate in music or other performingarts, belong to academic clubs, work on the schoolnewspaper or yearbook, or to participate in thestudent council or government (figure G). Malestudents, however, were more likely to partici-pate in school athletics than female students.Roughly one-third of female seniors reportedparticipating in music or other performing arts,and one-third reported participating on athleticteams. In contrast, 19 percent of male studentsreported participating in music or other perform-ing arts, while 45 percent reported participatingon athletic teams (indicator 15). It is difficult toassess the relative importance of the different typesof skills learned in the various activities.
Figure F. Percent of public high school graduates of 2000 who had taken variousmathematics and science courses in high school, by sex: 2000
SOURCE: U.S. Department of Education, National Center for Education Statistics, 2000 High School Transcript Study (HSTS:00).
Male Female
Percent
Course
Geometry Algebra II Precalculus Calculus Biology AP/honors biology
Chemistry Physics
7581
6571
25 28
12 11
8993
1419
5866
3429
0
10
20
30
40
50
60
70
80
90
100
EXECUTIVE SUMMARY
9Trends in Educational Equity of Girls & Women: 2004
Postsecondary EducationFemales currently have greater success than malesin attaining postsecondary education. Femaleshave higher aspirations than males while in highschool, they are more likely to enroll in collegeimmediately after graduating from high school,and they persist and complete degrees at higherrates than males. More than half of all bachelor’sand master’s degrees are awarded to females.Nevertheless, gender differences in majors stillexist, with female bachelor’s degree recipientsmuch less likely than their male peers to major incomputer science, engineering, and physical sci-ences. Females also still lag behind males inenrollment in first–professional and doctoral pro-grams, but they have made gains in the past 30years and are closing the gender gap.
Transition to Postsecondary EducationHigh school students’ plans for further educa-tion indicate the importance that young peopleattach to postsecondary education and their per-ceptions of their access to it. Aspirations areimportant, because they are a first step towardattainment. Both aspirations and undergraduate
enrollment rates of females have increased, andfemales have now surpassed males in both areas.
Female high school seniors tend tohave higher educational aspirationsthan their male peers.
In 1990 and 2001, female high school seniorswere more likely than their male peers to reportthat they definitely planned to graduate from a4-year college (62 percent vs. 51 percent in 2001;indicator 23). By 2001, female high school se-niors were also more likely than males to reportthat they definitely would attend graduate orprofessional school (25 percent vs. 16 percent).This marked a change from 1980, when a higherpercentage of males than females reported thatthey definitely would attend graduate or profes-sional school.
Females are more likely than males toenroll in college the fall immediatelyfollowing graduation from high school.
From 1972 to 2001, the proportions of bothmales and females who enrolled in college imme-diately after finishing high school increased, but
Figure G. Percent of high school seniors who participated in various school-relatedactivities during the school year, by sex: 2001
NOTE: The response rates for this survey do not meet NCES statistical standards. The response rate for this survey was less than 70 percent and afull nonresponse bias analysis has not been done to date.SOURCE: University of Michigan, Institute for Social Research, Monitoring the Future Study, 2001.
Percent
Type of activity
Other
Student council/government
Academic clubs
Athletic teams
Music/performing arts
Newspaper/yearbook
Male Female
0 10 20 30 40 50 60 70 80 90 100
613
1931
4532
1219
813
2644
EXECUTIVE SUMMARY
Trends in Educational Equity of Girls & Women: 200410
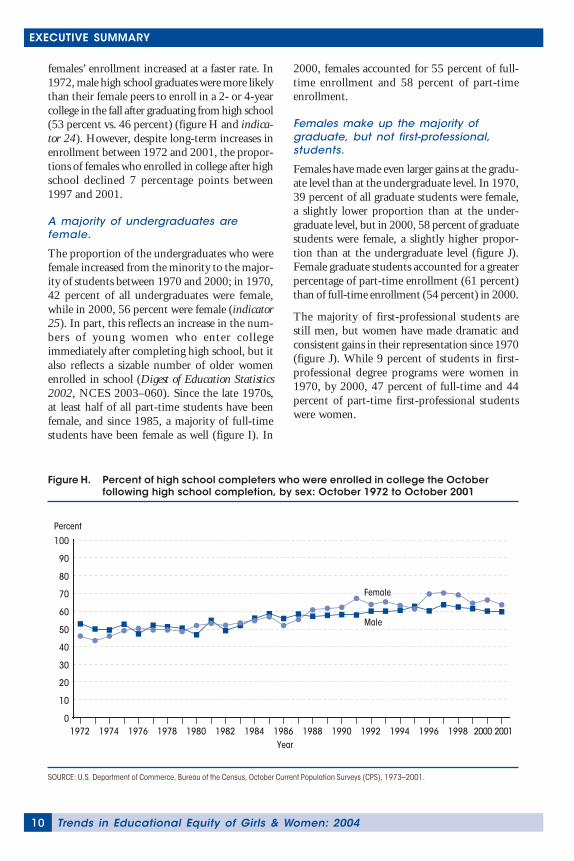
females’ enrollment increased at a faster rate. In1972, male high school graduates were more likelythan their female peers to enroll in a 2- or 4-yearcollege in the fall after graduating from high school(53 percent vs. 46 percent) (figure H and indica-tor 24). However, despite long-term increases inenrollment between 1972 and 2001, the propor-tions of females who enrolled in college after highschool declined 7 percentage points between1997 and 2001.
A majority of undergraduates arefemale.
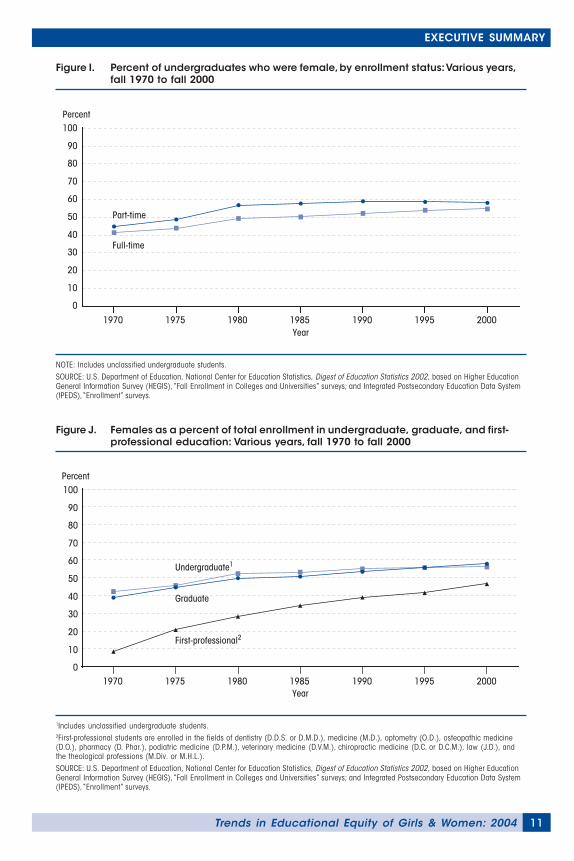
The proportion of the undergraduates who werefemale increased from the minority to the major-ity of students between 1970 and 2000; in 1970,42 percent of all undergraduates were female,while in 2000, 56 percent were female (indicator25). In part, this reflects an increase in the num-bers of young women who enter collegeimmediately after completing high school, but italso reflects a sizable number of older womenenrolled in school (Digest of Education Statistics2002, NCES 2003–060). Since the late 1970s,at least half of all part-time students have beenfemale, and since 1985, a majority of full-timestudents have been female as well (figure I). In
2000, females accounted for 55 percent of full-time enrollment and 58 percent of part-timeenrollment.
Females make up the majority ofgraduate, but not first-professional,students.
Females have made even larger gains at the gradu-ate level than at the undergraduate level. In 1970,39 percent of all graduate students were female,a slightly lower proportion than at the under-graduate level, but in 2000, 58 percent of graduatestudents were female, a slightly higher propor-tion than at the undergraduate level (figure J).Female graduate students accounted for a greaterpercentage of part-time enrollment (61 percent)than of full-time enrollment (54 percent) in 2000.
The majority of first-professional students arestill men, but women have made dramatic andconsistent gains in their representation since 1970(figure J). While 9 percent of students in first-professional degree programs were women in1970, by 2000, 47 percent of full-time and 44percent of part-time first-professional studentswere women.
Figure H. Percent of high school completers who were enrolled in college the Octoberfollowing high school completion, by sex: October 1972 to October 2001
SOURCE: U.S. Department of Commerce, Bureau of the Census, October Current Population Surveys (CPS), 1973–2001.
Percent
Male
Female
Year
0
10
20
30
40
50
60
70
80
90
100
1972 1974 1976 1978 1980 1982 1984 1986 1988 1990 1992 1994 1996 1998 2000 2001
EXECUTIVE SUMMARY
11Trends in Educational Equity of Girls & Women: 2004
Figure I. Percent of undergraduates who were female, by enrollment status: Various years,fall 1970 to fall 2000
NOTE: Includes unclassified undergraduate students.SOURCE: U.S. Department of Education, National Center for Education Statistics, Digest of Education Statistics 2002, based on Higher EducationGeneral Information Survey (HEGIS), “Fall Enrollment in Colleges and Universities” surveys; and Integrated Postsecondary Education Data System(IPEDS), “Enrollment” surveys.
Figure J. Females as a percent of total enrollment in undergraduate, graduate, and first-professional education: Various years, fall 1970 to fall 2000
1Includes unclassified undergraduate students.2First-professional students are enrolled in the fields of dentistry (D.D.S. or D.M.D.), medicine (M.D.), optometry (O.D.), osteopathic medicine(D.O.), pharmacy (D. Phar.), podiatric medicine (D.P.M.), veterinary medicine (D.V.M.), chiropractic medicine (D.C. or D.C.M.), law (J.D.), andthe theological professions (M.Div. or M.H.L.).SOURCE: U.S. Department of Education, National Center for Education Statistics, Digest of Education Statistics 2002, based on Higher EducationGeneral Information Survey (HEGIS), “Fall Enrollment in Colleges and Universities” surveys; and Integrated Postsecondary Education Data System(IPEDS), “Enrollment” surveys.
Percent
Part-time
Full-time
1970 1975 1980 1985 1990 1995 2000Year
0
10
20
30
40
50
60
70
80
90
100
Year
Percent
First-professional2
Graduate
Undergraduate1
1970 1975 1980 1985 1990 1995 20000
10
20
30
40
50
60
70
80
90
100
EXECUTIVE SUMMARY
Trends in Educational Equity of Girls & Women: 200412
Persistence and AttainmentEnrollment in postsecondary education is one in-dicator of access. However, completion ofpost-secondary programs is an even more impor-tant indicator of personal success and of aneducation climate that fosters parity in opportu-nity.
Females are more likely than males topersist and attain degrees.
Among freshmen who enrolled in a college oruniversity for the first time in 1995–96 seekinga bachelor’s degree, a greater percentage of fe-males (66 percent) than males (59 percent) hadearned a bachelor’s degree by the spring of 2001(indicator 28). A greater percentage of males thanfemales were still enrolled (16 percent vs. 13percent), indicating that some of the differencein attainment rates might eventually be reduced.A higher percentage of males (21 percent) thanfemales (16 percent) had not obtained abachelor’s degree and were no longer enrolledfor a bachelor’s degree.
Considering degree attainment more generally(not just those who started in 1995–96), fe-males earned more than half of all bachelor’sdegrees in 2001 (57 percent; indicator 29). Thisstatistic reflects the increasing proportions offemale students in postsecondary education, aspreviously noted. The proportions of Black andHispanic bachelor’s degree recipients who werefemale in 2000–01 (66 and 60 percent, respec-tively) were higher than the proportion of Whitedegree recipients who were female (57 percent;indicator 30).
The increase in participation by females inpostsecondary education over the past 30 yearshas meant that, among the general populationages 25–29 in 2002, a slightly higher percentageof females than males had attained a bachelor’sdegree or higher (32 percent vs. 27 percent; in-dicator 33).
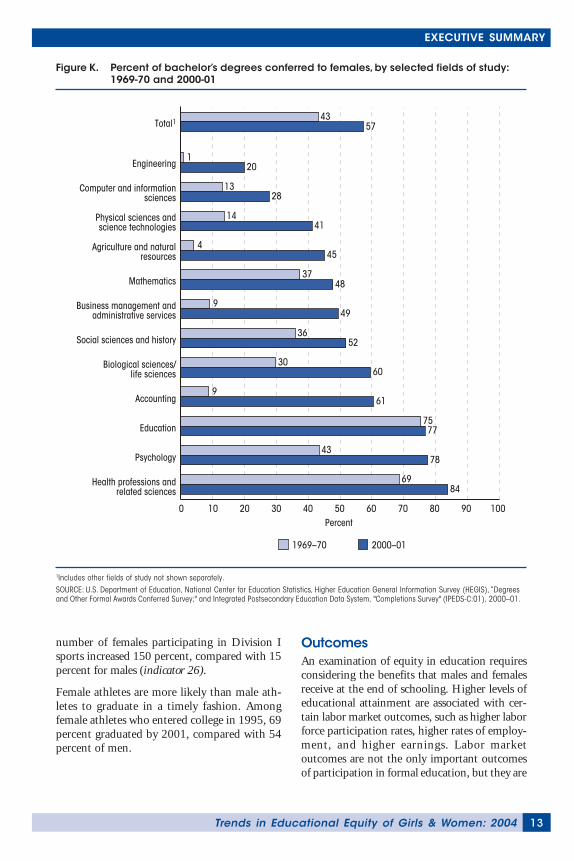
Degrees in certain fields of studycontinued to be disproportionatelyawarded to males or to females, althoughchanges have occurred in recent years.
Historically, females have tended to accountfor the majority of bachelor’s degrees in fieldsthat often lead to lower paying occupations,
such as education and health professions,while males have typically predominated inhigher paying fields, such as computer scienceand engineering. While some of these dispari-ties persist, many changes have occurred since1970. Certain fields in which men receivedthe majority of degrees in 1970, such as so-c ia l sc iences and his tory, psychology,biological sciences/life sciences, and businessmanagement and administrative services, at-ta ined re la t ive gender par i ty or weredisproportionately female by 2001 (figure Kand indicator 29). And while other fields, suchas computer and information sciences, physi-cal sciences and science technologies, andengineering, continue to have a larger propor-tion of males, the percentages of femalesmajoring in these areas have risen since 1970.
Females have made substantial progressat the graduate level overall, but still earnfewer than half of the degrees in manyfields.
Between 1970 and 2001, the percentages ofmaster’s, doctor’s, and first-professional degreesearned by females increased substantially in manyfields (indicator 31). However, advanced degreesconferred still tend to follow traditional patterns,with women accounting for the majority ofmaster’s and doctor’s degree recipients in educa-tion and health, and men accounting for themajority of recipients in computer and informa-tion sciences and engineering.
Women’s progress toward earning an equal shareof first-professional degrees has been notable. In1970, 5 percent of law degrees, 8 percent of medi-cal degrees, and 1 percent of dentistry degreeswere awarded to females; in 2001, the correspond-ing percentages were 47 percent, 43 percent, and39 percent.
Gender differences in participation ratesin collegiate sports have narrowed.
One final measure of gender equity at the collegelevel is participation in National Collegiate Ath-letic Association (NCAA)-sponsored sports.Males still outnumber females in collegiate sportsparticipation, but the gap has narrowed. Between1981–82 (when detailed statistics on females’sports first became available) and 2001–02, the
EXECUTIVE SUMMARY
13Trends in Educational Equity of Girls & Women: 2004
number of females participating in Division Isports increased 150 percent, compared with 15percent for males (indicator 26).
Female athletes are more likely than male ath-letes to graduate in a timely fashion. Amongfemale athletes who entered college in 1995, 69percent graduated by 2001, compared with 54percent of men.
OutcomesAn examination of equity in education requiresconsidering the benefits that males and femalesreceive at the end of schooling. Higher levels ofeducational attainment are associated with cer-tain labor market outcomes, such as higher laborforce participation rates, higher rates of employ-ment, and higher earnings. Labor marketoutcomes are not the only important outcomesof participation in formal education, but they are
Figure K. Percent of bachelor’s degrees conferred to females, by selected fields of study:1969-70 and 2000-01
1Includes other fields of study not shown separately.SOURCE: U.S. Department of Education, National Center for Education Statistics, Higher Education General Information Survey (HEGIS), “Degreesand Other Formal Awards Conferred Survey;" and Integrated Postsecondary Education Data System, "Completions Survey" (IPEDS-C:01), 2000–01.
Total1
Agriculture and natural resources
Accounting
Biological sciences/life sciences
Business management and administrative services
Computer and information sciences
Education
Engineering
Health professions and related sciences
Mathematics
Physical sciences and science technologies
Psychology
Social sciences and history
1969–70 2000–01
Percent0 10 20 30 40 50 60 70 80 90 100
4357
120
1328
1441
445
3748
949
3652
3060
961
7577
4378
6984
EXECUTIVE SUMMARY
Trends in Educational Equity of Girls & Women: 200414
the most readily measured with available nationaland international data.
Employment rates for females haveincreased across all levels of educationalattainment since the 1970s.
The gap between male and female employmentrates has narrowed since the 1970s. Both the de-cline in employment rates of males who did notattend college and the increase in the employ-ment rate of females across all education levelscontributed to the overall narrowing of the gap.In 2002, the gender gaps in employment rateswere smaller among people with higher levels ofeducation compared to those with a high schooldiploma or less. However, males continued tohave higher employment rates across all levels ofeducation (indicator 35).
Females with bachelor’s degrees tend toearn less than males with the same levelof educational attainment, but the gap isnarrowing.
Among young people ages 25–34, the median an-nual earnings for full-time, year-round workers arelower for females than for their male counterpartswith the same level of educational attainment.However, over the last 30 years, women have be-gun to narrow the earnings gap with men. In 1970,young women with a bachelor’s degree had a me-dian annual salary that was equivalent to 71 percentof what their male peers earned; in 2000, it was78 percent (indicator 36). The male-female differ-ence in annual earnings for full-time, year-roundworkers may be attributable at least in part to dif-ferent occupations and job tenure.
Females ages 25–64 have lower laborforce participation rates than males,regardless of education, but participationincreases with education.
In 2001, females ages 25–64 had lower labor forceparticipation rates than males at all levels of edu-cation in the United States. This difference wasalso evident in other selected large, industrializedcountries, such as Canada, France, Germany, Italy,and the United Kingdom (indicator 37). How-ever, the percentage of females participating inthe labor force increased in all six countries be-tween 1995 and 2001, while the percentage ofmales stayed the same or decreased. Female labor
force participation rates also generally increasedwith educational attainment.
Females are more likely than males toparticipate in adult education.
Women not only have made important progressin terms of their formal educational attainment,but also have been actively involved in adult edu-cation activities. In 2001, the overall participationrate of females in adult education activities washigher than that of their male peers (53 percentvs. 46 percent; indicator 32). However, when ex-amined by type of activity, the only significantgender difference was in participation in personaldevelopment activities. The percentages of malesand females who participated in basic skills andwork-related adult education were similar.
ConclusionVarious indicators have been presented here toexamine the extent to which males and femaleshave access to similar educational opportunities,take advantage of those opportunities, and havesimilar educational outcomes. By most of thesemeasures, females are doing at least as well asmales.
Males and females begin school with similar pre-school experiences, although females may havean advantage in early literacy participation expe-riences. Females outperform males on reading andwriting assessments at fourth-, eighth-, andtwelfth-grades. Throughout their elementary andsecondary education, females are less likely thanmales to repeat grades and seem to have fewerproblems that put them at risk.
While females’ performance in mathematics is of-ten perceived to be lower than that of males,NAEP results have shown few consistent genderdifferences over the years, particularly amongyounger students. Twelfth-grade NAEP assess-ments in mathematics and science show nosignificant gender differences in achievementscores. However, females were less likely to re-port liking math or science. This is true despitethe fact that young women take equally or morechallenging mathematics and science courseworkthan their male peers in high school (with theexception of physics, which females are slightlyless likely than males to take).
EXECUTIVE SUMMARY
15Trends in Educational Equity of Girls & Women: 2004
Since the early 1970s, women have made gains inpostsecondary education in terms of enrollmentand attainment. Female high school seniors tendto have higher educational aspirations than theirmale peers and are more likely to enroll in col-lege immediately after graduating from highschool. Females also account for the majority ofundergraduate enrollment and the majority ofbachelor’s degree recipients.
Gender differences in college majors persist, how-ever, with females still predominant in somewhatlower paying fields like education, and males morelikely to earn degrees in engineering, physics, andcomputer science. Females are also stillunderrepresented in first-professional programs,although they have made substantial progresstoward parity in the past 30 years.
In terms of labor market outcomes, the findingsare mixed and depend somewhat on factors be-yond the scope of the education system. Femalesages 25–34 are less likely than their male coun-terparts to be employed, but it is unknown towhat extent this is by choice. The gap betweenmales and females in employment rates has nar-rowed over time, and females with higher levelsof educational attainment are employed at ratesmore similar to those of males than are femaleswith lower levels of attainment. Females tend toearn less than males with similar educational at-tainment, but this may be partly a reflection ofdifferent patterns of labor market participationand job choice.
Technical NoteUnless otherwise noted, all statements cited in the text about differences between two or moregroups or changes over time were tested for statistical significance and substantive differenceusing equivalency tests. All statements were tested for statistical significance at the .05 level.Several test procedures were used, depending on the type of data interpreted and the nature ofthe statement tested. The most commonly used test procedures were t tests, linear trend tests,regression analyses, and equivalence tests. t tests were not adjusted to compensate for multiplecomparisons being made simultaneously. Trend tests were conducted by evaluating the signifi-cance of the slope of a simple regression of the annual data points, and a t test comparing theend points. Regression analyses to evaluate the relationship of multiple independent variablesupon one dependent variable involved procedures that addressed the impact of complex sampledesigns upon the statistical tests. Equivalence tests were used to determine whether twostatistics are substantively equivalent or substantively different. This is accomplished by usinga hypothesis test to determine whether the confidence interval of the difference betweensample estimates is significantly greater or less than a pre-set delta. The delta value is themagnitude of the difference required for the estimates to be judged substantively different. Inmost cases involving percentages, a delta, or difference, of 3.0 was used to determine substan-tive equivalence or difference. In some indicators involving only very small percentages, a lowerdelta was used. In contrast, for other indicators involving only relatively large values a largerdelta was used, such as a delta of $1,000 used in the case of annual salaries.
EXECUTIVE SUMMARY


17Trends in Educational Equity of Girls & Women: 2004
PREPRIMARY AND EARLY ELEMENTARY EDUCATION
1. Preprimary and Kindergarten Enrollment
2. Reading at Home
3. Early Reading and General KnowledgeAchievement
4. Early Mathematics Achievement
Trends in Educational Equity of Girls & Women: 200418
PREPRIMARY AND EARLY ELEMENTARY EDUCATION
Table 1. Percent of 3- to 5-year-olds enrolled in preprimary school and kindergarten, by sex:Various years, 1990 to 2001
Year Total 3-year-olds 4-year-olds 5-year-olds
Total1990 59.4 32.6 56.1 88.81995 61.8 35.9 61.6 87.52000 64.0 39.2 64.9 87.62001 63.9 38.6 66.4 86.7
Male1990 59.5 32.5 55.3 89.31995 61.9 35.8 62.8 85.92000 63.2 37.3 64.3 87.52001 63.4 38.1 65.6 86.8
Female1990 59.3 32.8 56.8 88.21995 61.8 36.0 60.3 89.32000 64.9 41.2 65.5 87.82001 64.4 39.1 67.3 86.6
NOTE: This analysis includes 3- to 5-year-olds who were not enrolled in first grade.SOURCE: U.S. Department of Commerce, Bureau of the Census, Current Population Survey (CPS), October 2001 supplement, unpublished data.
1. Preprimary and Kindergarten Enrollment
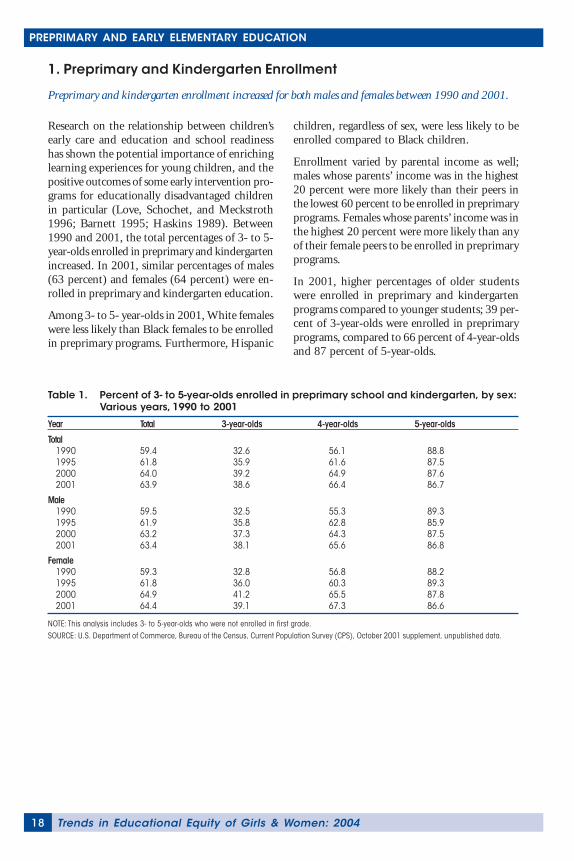
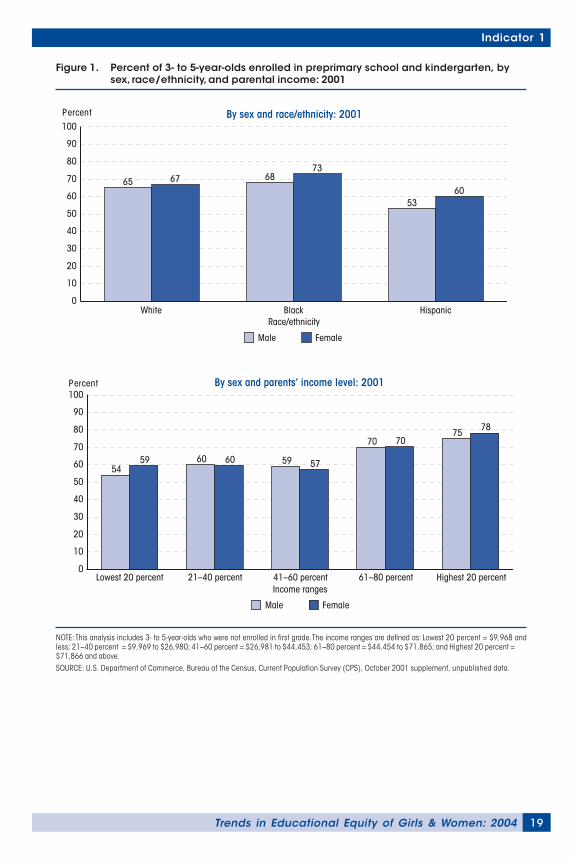
Preprimary and kindergarten enrollment increased for both males and females between 1990 and 2001.
Research on the relationship between children’searly care and education and school readinesshas shown the potential importance of enrichinglearning experiences for young children, and thepositive outcomes of some early intervention pro-grams for educationally disadvantaged childrenin particular (Love, Schochet, and Meckstroth1996; Barnett 1995; Haskins 1989). Between1990 and 2001, the total percentages of 3- to 5-year-olds enrolled in preprimary and kindergartenincreased. In 2001, similar percentages of males(63 percent) and females (64 percent) were en-rolled in preprimary and kindergarten education.
Among 3- to 5- year-olds in 2001, White femaleswere less likely than Black females to be enrolledin preprimary programs. Furthermore, Hispanic
children, regardless of sex, were less likely to beenrolled compared to Black children.
Enrollment varied by parental income as well;males whose parents’ income was in the highest20 percent were more likely than their peers inthe lowest 60 percent to be enrolled in preprimaryprograms. Females whose parents’ income was inthe highest 20 percent were more likely than anyof their female peers to be enrolled in preprimaryprograms.
In 2001, higher percentages of older studentswere enrolled in preprimary and kindergartenprograms compared to younger students; 39 per-cent of 3-year-olds were enrolled in preprimaryprograms, compared to 66 percent of 4-year-oldsand 87 percent of 5-year-olds.
19Trends in Educational Equity of Girls & Women: 2004
Indicator 1
Figure 1. Percent of 3- to 5-year-olds enrolled in preprimary school and kindergarten, bysex, race/ethnicity, and parental income: 2001
NOTE: This analysis includes 3- to 5-year-olds who were not enrolled in first grade. The income ranges are defined as: Lowest 20 percent = $9,968 andless; 21–40 percent = $9,969 to $26,980; 41–60 percent = $26,981 to $44,453; 61–80 percent = $44,454 to $71,865; and Highest 20 percent =$71,866 and above.SOURCE: U.S. Department of Commerce, Bureau of the Census, Current Population Survey (CPS), October 2001 supplement, unpublished data.
Race/ethnicity
Percent By sex and race/ethnicity: 2001
White Black Hispanic
Male Female
0
10
20
30
40
50
60
70
80
90
100
65 67 6873
5360
Percent By sex and parents’ income level: 2001
Income ranges21–40 percent 41–60 percent 61–80 percent Highest 20 percentLowest 20 percent
Male Female
0
10
20
30
40
50
60
70
80
90
100
5459 60 60 59 57
70 7075 78
Trends in Educational Equity of Girls & Women: 200420
PREPRIMARY AND EARLY ELEMENTARY EDUCATION
2. Reading at Home
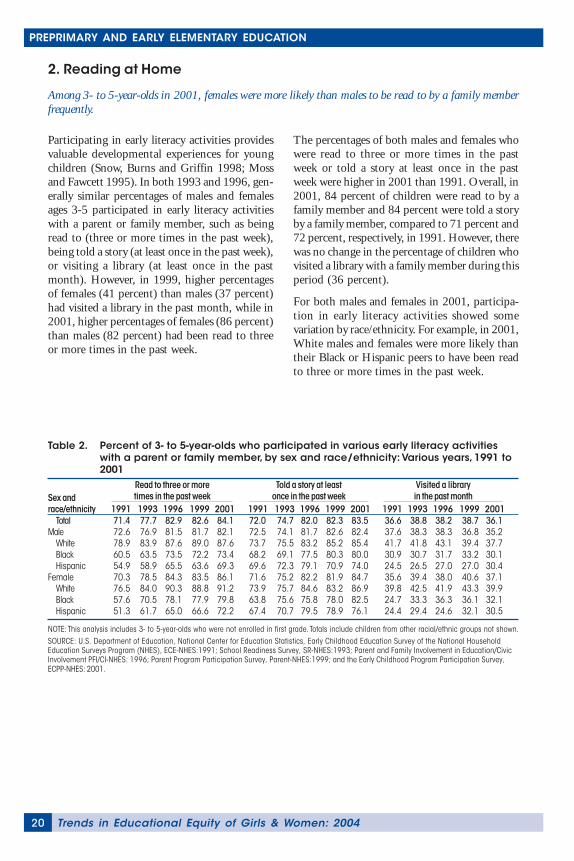
Among 3- to 5-year-olds in 2001, females were more likely than males to be read to by a family memberfrequently.
Participating in early literacy activities providesvaluable developmental experiences for youngchildren (Snow, Burns and Griffin 1998; Mossand Fawcett 1995). In both 1993 and 1996, gen-erally similar percentages of males and femalesages 3-5 participated in early literacy activitieswith a parent or family member, such as beingread to (three or more times in the past week),being told a story (at least once in the past week),or visiting a library (at least once in the pastmonth). However, in 1999, higher percentagesof females (41 percent) than males (37 percent)had visited a library in the past month, while in2001, higher percentages of females (86 percent)than males (82 percent) had been read to threeor more times in the past week.
The percentages of both males and females whowere read to three or more times in the pastweek or told a story at least once in the pastweek were higher in 2001 than 1991. Overall, in2001, 84 percent of children were read to by afamily member and 84 percent were told a storyby a family member, compared to 71 percent and72 percent, respectively, in 1991. However, therewas no change in the percentage of children whovisited a library with a family member during thisperiod (36 percent).
For both males and females in 2001, participa-tion in early literacy activities showed somevariation by race/ethnicity. For example, in 2001,White males and females were more likely thantheir Black or Hispanic peers to have been readto three or more times in the past week.
Table 2. Percent of 3- to 5-year-olds who participated in various early literacy activitieswith a parent or family member, by sex and race/ethnicity: Various years, 1991 to2001
Sex andrace/ethnicity 1991 1993 1996 1999 2001 1991 1993 1996 1999 2001 1991 1993 1996 1999 2001
Total 71.4 77.7 82.9 82.6 84.1 72.0 74.7 82.0 82.3 83.5 36.6 38.8 38.2 38.7 36.1Male 72.6 76.9 81.5 81.7 82.1 72.5 74.1 81.7 82.6 82.4 37.6 38.3 38.3 36.8 35.2
White 78.9 83.9 87.6 89.0 87.6 73.7 75.5 83.2 85.2 85.4 41.7 41.8 43.1 39.4 37.7Black 60.5 63.5 73.5 72.2 73.4 68.2 69.1 77.5 80.3 80.0 30.9 30.7 31.7 33.2 30.1Hispanic 54.9 58.9 65.5 63.6 69.3 69.6 72.3 79.1 70.9 74.0 24.5 26.5 27.0 27.0 30.4
Female 70.3 78.5 84.3 83.5 86.1 71.6 75.2 82.2 81.9 84.7 35.6 39.4 38.0 40.6 37.1White 76.5 84.0 90.3 88.8 91.2 73.9 75.7 84.6 83.2 86.9 39.8 42.5 41.9 43.3 39.9Black 57.6 70.5 78.1 77.9 79.8 63.8 75.6 75.8 78.0 82.5 24.7 33.3 36.3 36.1 32.1Hispanic 51.3 61.7 65.0 66.6 72.2 67.4 70.7 79.5 78.9 76.1 24.4 29.4 24.6 32.1 30.5
NOTE: This analysis includes 3- to 5-year-olds who were not enrolled in first grade. Totals include children from other racial/ethnic groups not shown.SOURCE: U.S. Department of Education, National Center for Education Statistics, Early Childhood Education Survey of the National HouseholdEducation Surveys Program (NHES), ECE-NHES:1991; School Readiness Survey, SR-NHES:1993; Parent and Family Involvement in Education/CivicInvolvement PFI/CI-NHES: 1996; Parent Program Participation Survey, Parent-NHES:1999; and the Early Childhood Program Participation Survey,ECPP-NHES: 2001.
Read to three or moretimes in the past week
Told a story at leastonce in the past week
Visited a libraryin the past month
21Trends in Educational Equity of Girls & Women: 2004
Indicator 2
Figure 2. Percent of 3- to 5-year-olds who participated in various early literacy activitieswith a parent or family member, by sex and race/ethnicity: 1991 and 2001
NOTE: This analysis includes 3- to 5-year-olds who were not enrolled in first grade.SOURCE: U.S. Department of Education, National Center for Education Statistics, Early Childhood Education Survey of the National HouseholdEducation Surveys Program (NHES), ECE-NHES:1991; and Early Childhood Program Participation Survey, ECPP-NHES: 2001.
Percent
Male Female
1991 2001 1991 2001 1991 2001
1991 and 2001
Read to three or more times in the past week
Told a story at least once in the past week
Visited a library in the past month
0
10
20
30
40
50
60
70
80
90
100
73 70
8286
73 72
82 85
38 36 35 37
Percent
Male Female
2001
Read to three or more times in the past week
Told a story at least once in the past week
Visited a library in the past month
White Black Hispanic White Black Hispanic White Black Hispanic0
10
20
30
40
50
60
70
80
90
10088 91
7380
69 72
85 8780 83
74 76
38 40
30 32 30 31
Trends in Educational Equity of Girls & Women: 200422
PREPRIMARY AND EARLY ELEMENTARY EDUCATION
3. Early Reading and General Knowledge Achievement
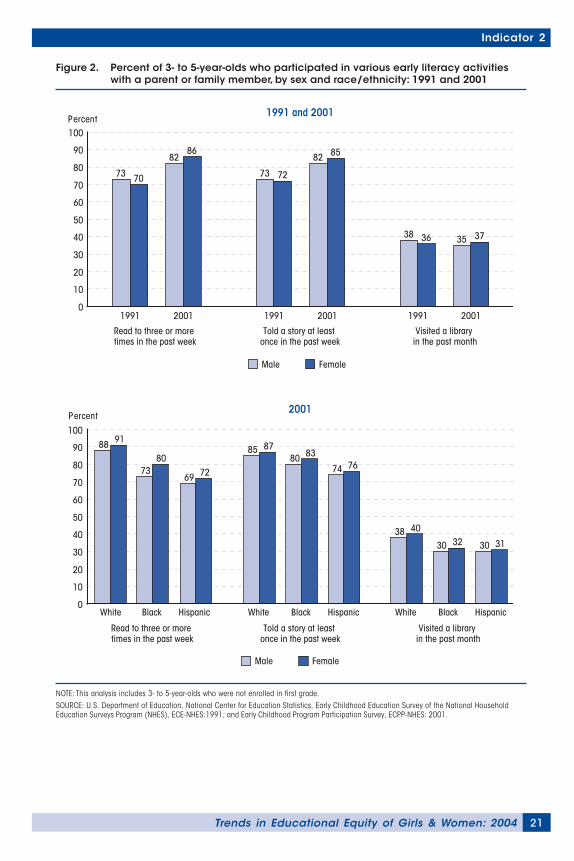
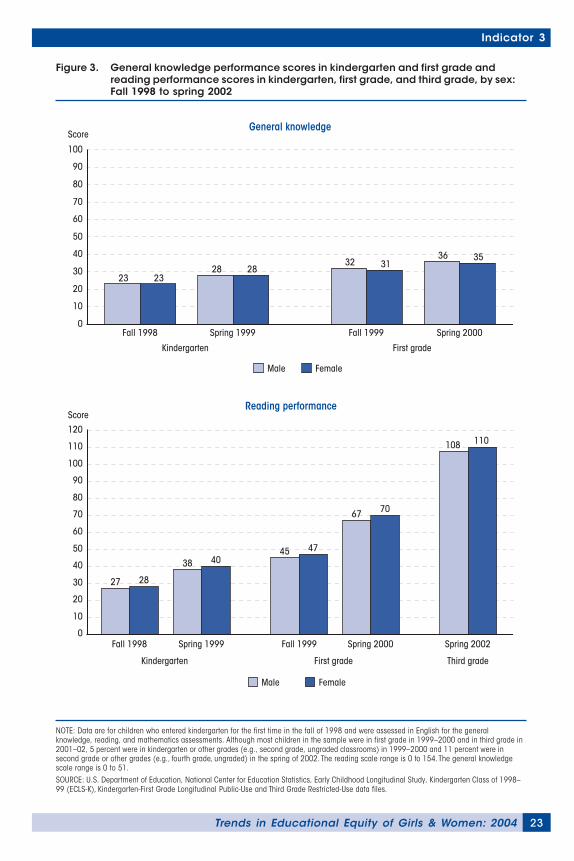
In kindergarten and first grade, males and females generally perform similarly on assessments of generalknowledge. In reading, females perform higher than males by the spring of first grade on word recognition,but males catch up by third grade.
Children who began kindergarten in 1998 dem-onstrated significant score increases onassessments of general knowledge (knowledge oftheir surrounding social and physical world) be-tween the beginning of kindergarten and springof first grade. Students also experienced signifi-cant growth within a single school year. Bothkindergartners and first-graders had higher scoreswhen assessed toward the end of the school yearcompared to their scores in the fall. Males andfemales performed similarly on the general knowl-edge assessments throughout kindergarten andfirst grade.
Overall performance in kindergarten and first-grade reading was significantly higher during thespring assessments of each year compared to per-formance in the fall. For example, between falland spring assessments, the average score on thefirst-grade reading assessment increased by 23points. Males and females generally performedsimilarly in overall reading comprehensionthroughout kindergarten and first grade. How-ever, higher percentages of females (80 percent)than males (73 percent) could recognize wordsby sight in the spring of first grade. In the springof third grade, most (99 percent) of both malesand females could recognize words by sight.
Table 3. Reading and general knowledge scores in kindergarten, first grade, and thirdgrade, by child’s sex and race/ethnicity: Fall 1998, spring 1999, fall 1999, spring2000, and spring 2002
Fall Spring Fall Spring Fall Spring Fall Spring SpringSex and race/ethnicity 1998 1999 1999 2000 1998 1999 1999 2000 2002
Total 22.9 27.9 31.1 35.7 27.6 39.0 45.5 68.3 108.9Male 23.2 28.2 31.6 36.2 27.1 38.2 44.6 66.8 107.6Female 22.5 27.5 30.6 35.2 28.0 39.9 46.5 69.8 110.2
MaleWhite 25.2 30.4 33.7 37.9 28.2 39.5 46.3 69.6 111.3Black 18.5 22.9 26.5 31.7 24.4 34.9 40.3 58.8 97.5Hispanic 20.6 26.2 29.1 34.6 25.5 36.0 41.5 63.3 104.0
FemaleWhite 24.7 29.6 32.8 37.3 29.5 41.9 48.6 73.0 114.2Black 17.8 22.7 25.8 30.4 25.4 35.8 41.9 63.4 101.2Hispanic 19.2 24.9 27.5 32.6 24.8 36.6 42.9 64.7 106.4
NOTE: Data are for children who entered kindergarten for the first time in the fall of 1998 and were assessed in English for the generalknowledge, reading, and mathematics assessments. A general knowledge assessment was not administered in the spring of 2002. Although mostchildren in the sample were in first grade in 1999–2000 and in third grade in 2001–02, 5 percent were in kindergarten or other grades (e.g.,second grade, ungraded classrooms) in 1999–2000 and 11 percent were in second grade or other grades (e.g., fourth grade, ungraded) in thespring of 2002. The reading scale range is 0 to 154. The general knowledge scale range is 0 to 51.SOURCE: U.S. Department of Education, National Center for Education Statistics, Early Childhood Longitudinal Study, Kindergarten Class of 1998–99 (ECLS-K), Kindergarten-First Grade Longitudinal Public-Use and Third Grade Restricted-Use data files.
Reading, overall performanceKindergarten First grade Kindergarten First grade Third gradeGeneral knowledge performance
23Trends in Educational Equity of Girls & Women: 2004
Indicator 3
Figure 3. General knowledge performance scores in kindergarten and first grade andreading performance scores in kindergarten, first grade, and third grade, by sex:Fall 1998 to spring 2002
Male Female
Fall 1998 Spring 1999 Fall 1999 Spring 2000
Score
Kindergarten First grade
General knowledge
0
10
20
30
40
50
60
70
80
90
100
23 2328 28
32 3136 35
NOTE: Data are for children who entered kindergarten for the first time in the fall of 1998 and were assessed in English for the generalknowledge, reading, and mathematics assessments. Although most children in the sample were in first grade in 1999–2000 and in third grade in2001–02, 5 percent were in kindergarten or other grades (e.g., second grade, ungraded classrooms) in 1999–2000 and 11 percent were insecond grade or other grades (e.g., fourth grade, ungraded) in the spring of 2002. The reading scale range is 0 to 154. The general knowledgescale range is 0 to 51.SOURCE: U.S. Department of Education, National Center for Education Statistics, Early Childhood Longitudinal Study, Kindergarten Class of 1998–99 (ECLS-K), Kindergarten-First Grade Longitudinal Public-Use and Third Grade Restricted-Use data files.
Male Female
27 28
38 4045 47
67 70
108 110
Fall 1998 Spring 1999 Fall 1999 Spring 2000 Spring 2002
Score
Kindergarten First grade Third grade
0
10
20
30
40
50
60
70
80
90
100
110
120
Reading performance
Trends in Educational Equity of Girls & Women: 200424
PREPRIMARY AND EARLY ELEMENTARY EDUCATION
4. Early Mathematics Achievement
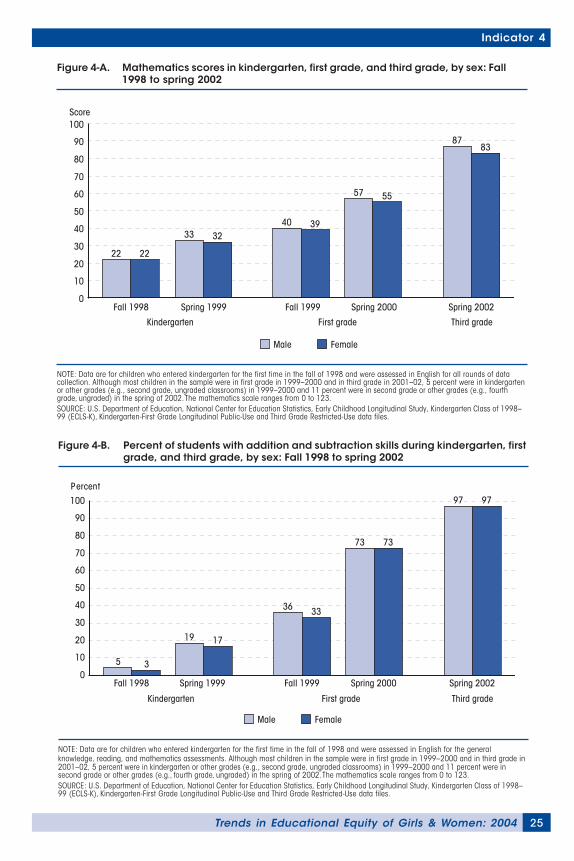
In kindergarten and first grade, males and females perform similarly on mathematics assessments.
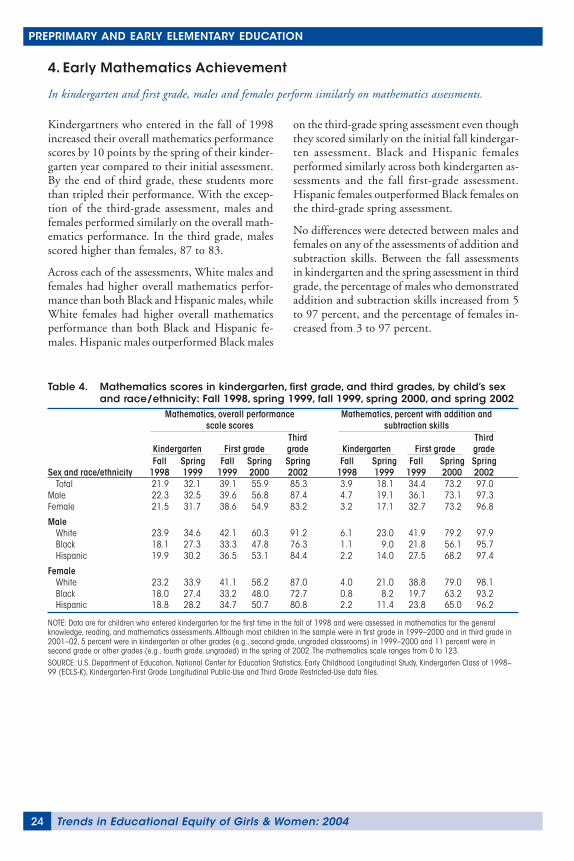
Kindergartners who entered in the fall of 1998increased their overall mathematics performancescores by 10 points by the spring of their kinder-garten year compared to their initial assessment.By the end of third grade, these students morethan tripled their performance. With the excep-tion of the third-grade assessment, males andfemales performed similarly on the overall math-ematics performance. In the third grade, malesscored higher than females, 87 to 83.
Across each of the assessments, White males andfemales had higher overall mathematics perfor-mance than both Black and Hispanic males, whileWhite females had higher overall mathematicsperformance than both Black and Hispanic fe-males. Hispanic males outperformed Black males
on the third-grade spring assessment even thoughthey scored similarly on the initial fall kindergar-ten assessment. Black and Hispanic femalesperformed similarly across both kindergarten as-sessments and the fall first-grade assessment.Hispanic females outperformed Black females onthe third-grade spring assessment.
No differences were detected between males andfemales on any of the assessments of addition andsubtraction skills. Between the fall assessmentsin kindergarten and the spring assessment in thirdgrade, the percentage of males who demonstratedaddition and subtraction skills increased from 5to 97 percent, and the percentage of females in-creased from 3 to 97 percent.
Table 4. Mathematics scores in kindergarten, first grade, and third grades, by child’s sexand race/ethnicity: Fall 1998, spring 1999, fall 1999, spring 2000, and spring 2002
Fall Spring Fall Spring Spring Fall Spring Fall Spring SpringSex and race/ethnicity 1998 1999 1999 2000 2002 1998 1999 1999 2000 2002
Total 21.9 32.1 39.1 55.9 85.3 3.9 18.1 34.4 73.2 97.0Male 22.3 32.5 39.6 56.8 87.4 4.7 19.1 36.1 73.1 97.3Female 21.5 31.7 38.6 54.9 83.2 3.2 17.1 32.7 73.2 96.8
MaleWhite 23.9 34.6 42.1 60.3 91.2 6.1 23.0 41.9 79.2 97.9Black 18.1 27.3 33.3 47.8 76.3 1.1 9.0 21.8 56.1 95.7Hispanic 19.9 30.2 36.5 53.1 84.4 2.2 14.0 27.5 68.2 97.4
FemaleWhite 23.2 33.9 41.1 58.2 87.0 4.0 21.0 38.8 79.0 98.1Black 18.0 27.4 33.2 48.0 72.7 0.8 8.2 19.7 63.2 93.2Hispanic 18.8 28.2 34.7 50.7 80.8 2.2 11.4 23.8 65.0 96.2
NOTE: Data are for children who entered kindergarten for the first time in the fall of 1998 and were assessed in mathematics for the generalknowledge, reading, and mathematics assessments. Although most children in the sample were in first grade in 1999–2000 and in third grade in2001–02, 5 percent were in kindergarten or other grades (e.g., second grade, ungraded classrooms) in 1999–2000 and 11 percent were insecond grade or other grades (e.g., fourth grade, ungraded) in the spring of 2002. The mathematics scale ranges from 0 to 123.SOURCE: U.S. Department of Education, National Center for Education Statistics, Early Childhood Longitudinal Study, Kindergarten Class of 1998–99 (ECLS-K), Kindergarten-First Grade Longitudinal Public-Use and Third Grade Restricted-Use data files.
Mathematics, overall performancescale scores
Mathematics, percent with addition andsubtraction skills
ThirdgradeKindergarten First grade
Thirdgrade Kindergarten First grade
25Trends in Educational Equity of Girls & Women: 2004
Indicator 4
Figure 4-A. Mathematics scores in kindergarten, first grade, and third grade, by sex: Fall1998 to spring 2002
NOTE: Data are for children who entered kindergarten for the first time in the fall of 1998 and were assessed in English for all rounds of datacollection. Although most children in the sample were in first grade in 1999–2000 and in third grade in 2001–02, 5 percent were in kindergartenor other grades (e.g., second grade, ungraded classrooms) in 1999–2000 and 11 percent were in second grade or other grades (e.g., fourthgrade, ungraded) in the spring of 2002. The mathematics scale ranges from 0 to 123.SOURCE: U.S. Department of Education, National Center for Education Statistics, Early Childhood Longitudinal Study, Kindergarten Class of 1998–99 (ECLS-K), Kindergarten-First Grade Longitudinal Public-Use and Third Grade Restricted-Use data files.
Male Female
Score
Fall 1998 Spring 1999 Fall 1999 Spring 2000 Spring 2002
Kindergarten First grade Third grade
0
10
20
30
40
50
60
70
80
90
100
22 22
33 3240 39
57 55
8783
Figure 4-B. Percent of students with addition and subtraction skills during kindergarten, firstgrade, and third grade, by sex: Fall 1998 to spring 2002
NOTE: Data are for children who entered kindergarten for the first time in the fall of 1998 and were assessed in English for the generalknowledge, reading, and mathematics assessments. Although most children in the sample were in first grade in 1999–2000 and in third grade in2001–02, 5 percent were in kindergarten or other grades (e.g., second grade, ungraded classrooms) in 1999–2000 and 11 percent were insecond grade or other grades (e.g., fourth grade, ungraded) in the spring of 2002. The mathematics scale ranges from 0 to 123.SOURCE: U.S. Department of Education, National Center for Education Statistics, Early Childhood Longitudinal Study, Kindergarten Class of 1998–99 (ECLS-K), Kindergarten-First Grade Longitudinal Public-Use and Third Grade Restricted-Use data files.
Male Female
Percent
First grade Third gradeKindergarten
Spring 2002Fall 1998 Spring 1999 Fall 1999 Spring 20000
10
20
30
40
50
60
70
80
90
100
5 3
19 17
36 33
73 73
97 97

27Trends in Educational Equity of Girls & Women: 2004
ELEMENTARY AND SECONDARY EDUCATION
5. Reading and Writing Achievement
6. Mathematics and Science Achievement
7. Geography and U.S.History Achievement
8. International Reading Performance of Fourth-Graders
9. International Reading and MathematicsPerformance of Fifteen-Year-Olds
10. Computer Use
11. Grade Retention
12. Children with Disabilities
13. Student Attitudes Toward School
14. Obesity and Physical Education Participation
15. Afterschool Activities
16. Victimization at School
17. Student Behavior and School Violence
18. Alcohol and Other Drug Use
19. Dropouts
20. Educational Attainment of Childbearing Teens
21. High School Coursetaking Patterns
22. Advanced Placement Examinations
Trends in Educational Equity of Girls & Women: 200428
ELEMENTARY AND SECONDARY EDUCATION
5. Reading and Writing Achievement
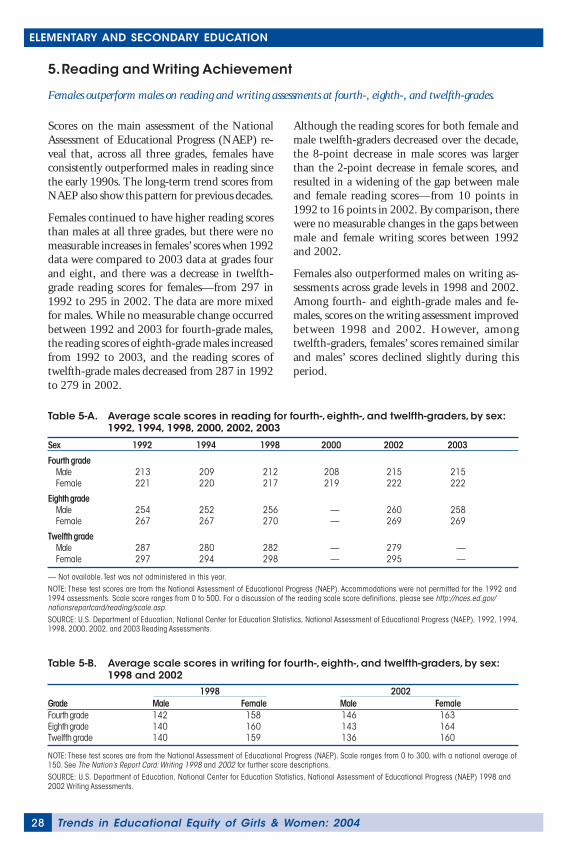
Females outperform males on reading and writing assessments at fourth-, eighth-, and twelfth-grades.
Scores on the main assessment of the NationalAssessment of Educational Progress (NAEP) re-veal that, across all three grades, females haveconsistently outperformed males in reading sincethe early 1990s. The long-term trend scores fromNAEP also show this pattern for previous decades.
Females continued to have higher reading scoresthan males at all three grades, but there were nomeasurable increases in females’ scores when 1992data were compared to 2003 data at grades fourand eight, and there was a decrease in twelfth-grade reading scores for females—from 297 in1992 to 295 in 2002. The data are more mixedfor males. While no measurable change occurredbetween 1992 and 2003 for fourth-grade males,the reading scores of eighth-grade males increasedfrom 1992 to 2003, and the reading scores oftwelfth-grade males decreased from 287 in 1992to 279 in 2002.
Although the reading scores for both female andmale twelfth-graders decreased over the decade,the 8-point decrease in male scores was largerthan the 2-point decrease in female scores, andresulted in a widening of the gap between maleand female reading scores—from 10 points in1992 to 16 points in 2002. By comparison, therewere no measurable changes in the gaps betweenmale and female writing scores between 1992and 2002.
Females also outperformed males on writing as-sessments across grade levels in 1998 and 2002.Among fourth- and eighth-grade males and fe-males, scores on the writing assessment improvedbetween 1998 and 2002. However, amongtwelfth-graders, females’ scores remained similarand males’ scores declined slightly during thisperiod.
Table 5-A. Average scale scores in reading for fourth-, eighth-, and twelfth-graders, by sex:1992, 1994, 1998, 2000, 2002, 2003
Sex 1992 1994 1998 2000 2002 2003
Fourth gradeMale 213 209 212 208 215 215Female 221 220 217 219 222 222
Eighth gradeMale 254 252 256 — 260 258Female 267 267 270 — 269 269
Twelfth gradeMale 287 280 282 — 279 —Female 297 294 298 — 295 —
— Not available. Test was not administered in this year.NOTE: These test scores are from the National Assessment of Educational Progress (NAEP). Accommodations were not permitted for the 1992 and1994 assessments. Scale score ranges from 0 to 500. For a discussion of the reading scale score definitions, please see http://nces.ed.gov/nationsreportcard/reading/scale.asp.SOURCE: U.S. Department of Education, National Center for Education Statistics, National Assessment of Educational Progress (NAEP), 1992, 1994,1998, 2000, 2002, and 2003 Reading Assessments.
Table 5-B. Average scale scores in writing for fourth-, eighth-, and twelfth-graders, by sex:1998 and 2002
Grade Male Female Male FemaleFourth grade 142 158 146 163Eighth grade 140 160 143 164Twelfth grade 140 159 136 160
NOTE: These test scores are from the National Assessment of Educational Progress (NAEP). Scale ranges from 0 to 300, with a national average of150. See The Nation’s Report Card: Writing 1998 and 2002 for further score descriptions.SOURCE: U.S. Department of Education, National Center for Education Statistics, National Assessment of Educational Progress (NAEP) 1998 and2002 Writing Assessments.
1998 2002
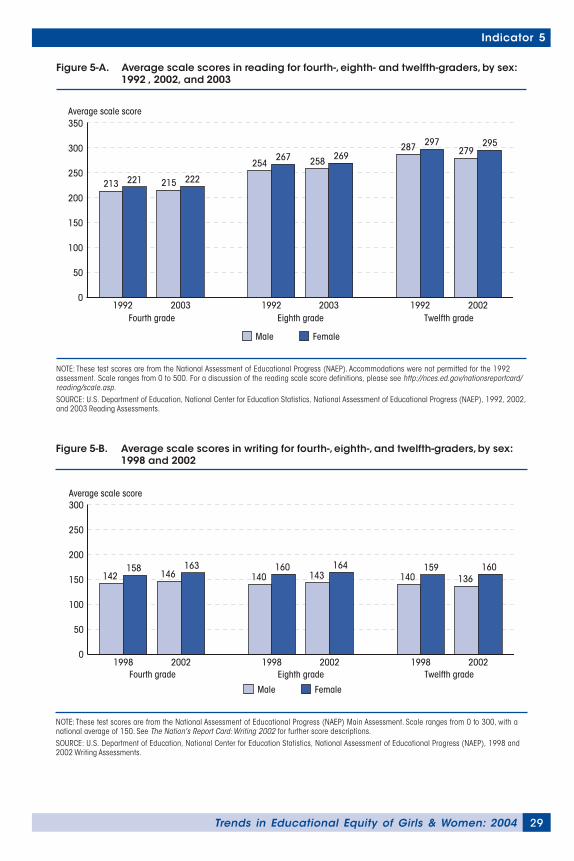
29Trends in Educational Equity of Girls & Women: 2004
Indicator 5
Figure 5-A. Average scale scores in reading for fourth-, eighth- and twelfth-graders, by sex:1992 , 2002, and 2003
NOTE: These test scores are from the National Assessment of Educational Progress (NAEP). Accommodations were not permitted for the 1992assessment. Scale ranges from 0 to 500. For a discussion of the reading scale score definitions, please see http://nces.ed.gov/nationsreportcard/reading/scale.asp.SOURCE: U.S. Department of Education, National Center for Education Statistics, National Assessment of Educational Progress (NAEP), 1992, 2002,and 2003 Reading Assessments.
Figure 5-B. Average scale scores in writing for fourth-, eighth-, and twelfth-graders, by sex:1998 and 2002
NOTE: These test scores are from the National Assessment of Educational Progress (NAEP) Main Assessment. Scale ranges from 0 to 300, with anational average of 150. See The Nation's Report Card: Writing 2002 for further score descriptions.SOURCE: U.S. Department of Education, National Center for Education Statistics, National Assessment of Educational Progress (NAEP), 1998 and2002 Writing Assessments.
Male Female
Average scale score
Fourth grade Eighth grade Twelfth grade1992 2003 1992 2003 1992 2002
0
50
100
150
200
250
300
350
213 221 215 222
254267 258 269
287 297279
295
Male Female
Average scale score
0
50
100
150
200
250
300
Fourth grade Eighth grade Twelfth grade1998
142158
2002
146163
1998
140160
2002
143164
1998
140159
2002
136160
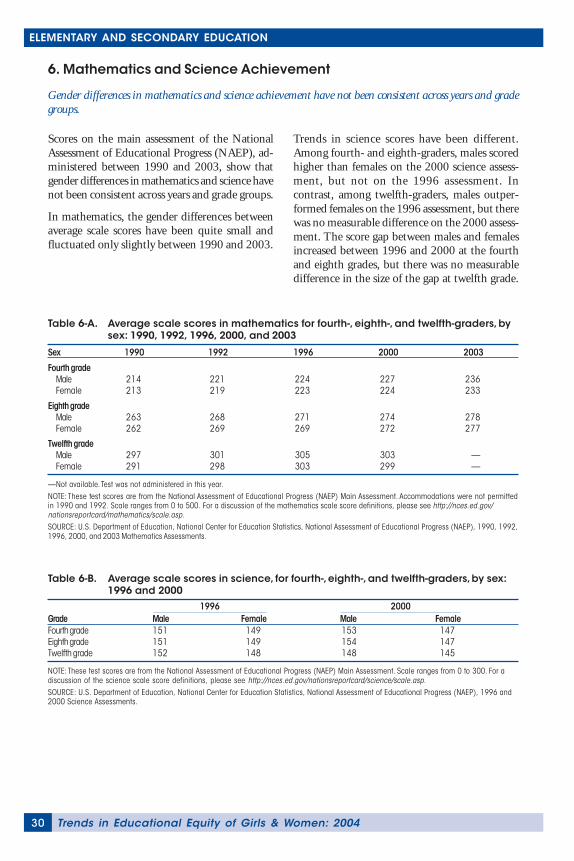
Trends in Educational Equity of Girls & Women: 200430
ELEMENTARY AND SECONDARY EDUCATION
6. Mathematics and Science Achievement
Gender differences in mathematics and science achievement have not been consistent across years and gradegroups.
Scores on the main assessment of the NationalAssessment of Educational Progress (NAEP), ad-ministered between 1990 and 2003, show thatgender differences in mathematics and science havenot been consistent across years and grade groups.
In mathematics, the gender differences betweenaverage scale scores have been quite small andfluctuated only slightly between 1990 and 2003.
Trends in science scores have been different.Among fourth- and eighth-graders, males scoredhigher than females on the 2000 science assess-ment, but not on the 1996 assessment. Incontrast, among twelfth-graders, males outper-formed females on the 1996 assessment, but therewas no measurable difference on the 2000 assess-ment. The score gap between males and femalesincreased between 1996 and 2000 at the fourthand eighth grades, but there was no measurabledifference in the size of the gap at twelfth grade.
Table 6-A. Average scale scores in mathematics for fourth-, eighth-, and twelfth-graders, bysex: 1990, 1992, 1996, 2000, and 2003
Sex 1990 1992 1996 2000 2003
Fourth gradeMale 214 221 224 227 236Female 213 219 223 224 233
Eighth gradeMale 263 268 271 274 278Female 262 269 269 272 277
Twelfth gradeMale 297 301 305 303 —Female 291 298 303 299 —
—Not available. Test was not administered in this year.NOTE: These test scores are from the National Assessment of Educational Progress (NAEP) Main Assessment. Accommodations were not permittedin 1990 and 1992. Scale ranges from 0 to 500. For a discussion of the mathematics scale score definitions, please see http://nces.ed.gov/nationsreportcard/mathematics/scale.asp.SOURCE: U.S. Department of Education, National Center for Education Statistics, National Assessment of Educational Progress (NAEP), 1990, 1992,1996, 2000, and 2003 Mathematics Assessments.
Table 6-B. Average scale scores in science, for fourth-, eighth-, and twelfth-graders, by sex:1996 and 2000
Grade Male Female Male FemaleFourth grade 151 149 153 147Eighth grade 151 149 154 147Twelfth grade 152 148 148 145
NOTE: These test scores are from the National Assessment of Educational Progress (NAEP) Main Assessment. Scale ranges from 0 to 300. For adiscussion of the science scale score definitions, please see http://nces.ed.gov/nationsreportcard/science/scale.asp.SOURCE: U.S. Department of Education, National Center for Education Statistics, National Assessment of Educational Progress (NAEP), 1996 and2000 Science Assessments.
1996 2000
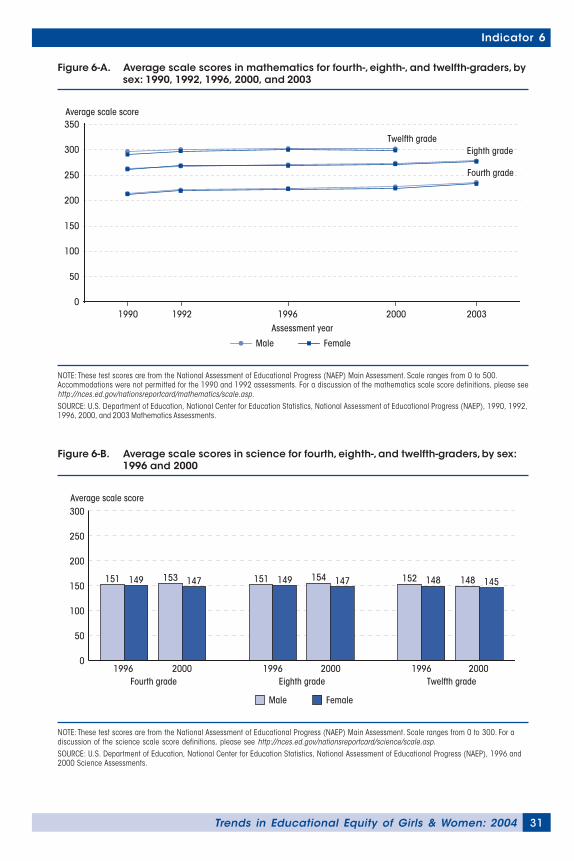
31Trends in Educational Equity of Girls & Women: 2004
Indicator 6
Figure 6-B. Average scale scores in science for fourth, eighth-, and twelfth-graders, by sex:1996 and 2000
NOTE: These test scores are from the National Assessment of Educational Progress (NAEP) Main Assessment. Scale ranges from 0 to 300. For adiscussion of the science scale score definitions, please see http://nces.ed.gov/nationsreportcard/science/scale.asp.SOURCE: U.S. Department of Education, National Center for Education Statistics, National Assessment of Educational Progress (NAEP), 1996 and2000 Science Assessments.
Fourth grade Eighth grade Twelfth grade
Average scale score
Male Female
1996 2000 1996 2000 1996 20000
50
100
150
200
250
300
151 149 153 147 151 149 154 147 152 148 148 145
Figure 6-A. Average scale scores in mathematics for fourth-, eighth-, and twelfth-graders, bysex: 1990, 1992, 1996, 2000, and 2003
NOTE: These test scores are from the National Assessment of Educational Progress (NAEP) Main Assessment. Scale ranges from 0 to 500.Accommodations were not permitted for the 1990 and 1992 assessments. For a discussion of the mathematics scale score definitions, please seehttp://nces.ed.gov/nationsreportcard/mathematics/scale.asp.SOURCE: U.S. Department of Education, National Center for Education Statistics, National Assessment of Educational Progress (NAEP), 1990, 1992,1996, 2000, and 2003 Mathematics Assessments.
Eighth grade Twelfth grade
Fourth grade
Average scale score
Assessment year
Male Female
1990 1992 1996 2000 20030
50
100
150
200
250
300
350
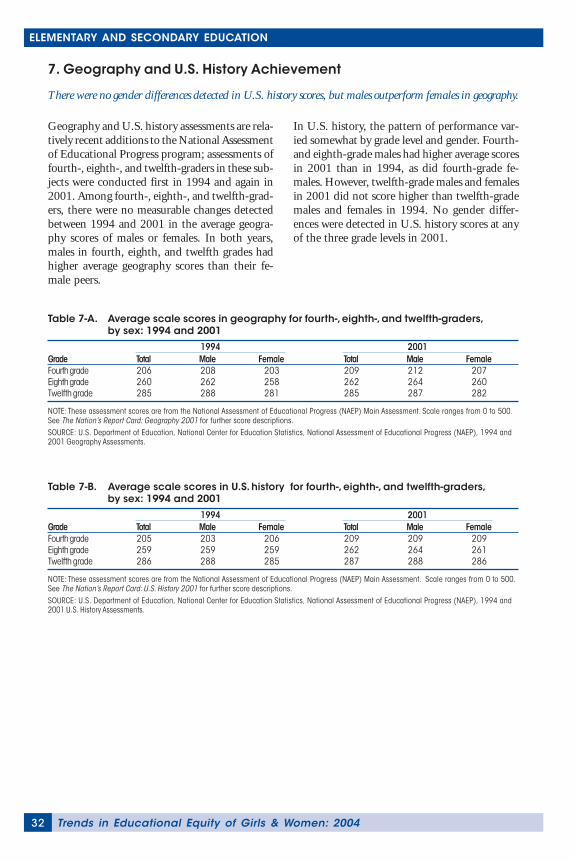
Trends in Educational Equity of Girls & Women: 200432
ELEMENTARY AND SECONDARY EDUCATION
7. Geography and U.S. History Achievement
There were no gender differences detected in U.S. history scores, but males outperform females in geography.
Geography and U.S. history assessments are rela-tively recent additions to the National Assessmentof Educational Progress program; assessments offourth-, eighth-, and twelfth-graders in these sub-jects were conducted first in 1994 and again in2001. Among fourth-, eighth-, and twelfth-grad-ers, there were no measurable changes detectedbetween 1994 and 2001 in the average geogra-phy scores of males or females. In both years,males in fourth, eighth, and twelfth grades hadhigher average geography scores than their fe-male peers.
In U.S. history, the pattern of performance var-ied somewhat by grade level and gender. Fourth-and eighth-grade males had higher average scoresin 2001 than in 1994, as did fourth-grade fe-males. However, twelfth-grade males and femalesin 2001 did not score higher than twelfth-grademales and females in 1994. No gender differ-ences were detected in U.S. history scores at anyof the three grade levels in 2001.
Table 7-A. Average scale scores in geography for fourth-, eighth-, and twelfth-graders,by sex: 1994 and 2001
Grade Total Male Female Total Male FemaleFourth grade 206 208 203 209 212 207Eighth grade 260 262 258 262 264 260Twelfth grade 285 288 281 285 287 282
NOTE: These assessment scores are from the National Assessment of Educational Progress (NAEP) Main Assessment. Scale ranges from 0 to 500.See The Nation’s Report Card: Geography 2001 for further score descriptions.SOURCE: U.S. Department of Education, National Center for Education Statistics, National Assessment of Educational Progress (NAEP), 1994 and2001 Geography Assessments.
1994 2001
Table 7-B. Average scale scores in U.S. history for fourth-, eighth-, and twelfth-graders,by sex: 1994 and 2001
Grade Total Male Female Total Male FemaleFourth grade 205 203 206 209 209 209Eighth grade 259 259 259 262 264 261Twelfth grade 286 288 285 287 288 286
NOTE: These assessment scores are from the National Assessment of Educational Progress (NAEP) Main Assessment. Scale ranges from 0 to 500.See The Nation’s Report Card: U.S. History 2001 for further score descriptions.SOURCE: U.S. Department of Education, National Center for Education Statistics, National Assessment of Educational Progress (NAEP), 1994 and2001 U.S. History Assessments.
1994 2001
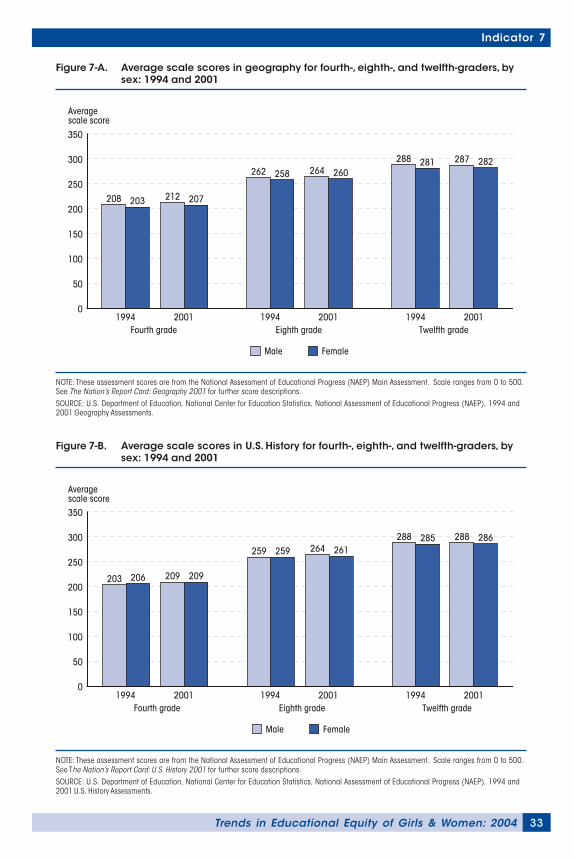
33Trends in Educational Equity of Girls & Women: 2004
Indicator 7
NOTE: These assessment scores are from the National Assessment of Educational Progress (NAEP) Main Assessment. Scale ranges from 0 to 500.See The Nation’s Report Card: Geography 2001 for further score descriptions.SOURCE: U.S. Department of Education, National Center for Education Statistics, National Assessment of Educational Progress (NAEP), 1994 and2001 Geography Assessments.
Figure 7-A. Average scale scores in geography for fourth-, eighth-, and twelfth-graders, bysex: 1994 and 2001
Average scale score
Male Female
1994 19941994 20012001 2001Fourth grade Eighth grade Twelfth grade
0
50
100
150
200
250
300
350
208 203 212 207
262 258 264 260288 281 287 282
NOTE: These assessment scores are from the National Assessment of Educational Progress (NAEP) Main Assessment. Scale ranges from 0 to 500.See The Nation’s Report Card: U.S. History 2001 for further score descriptions.SOURCE: U.S. Department of Education, National Center for Education Statistics, National Assessment of Educational Progress (NAEP), 1994 and2001 U.S. History Assessments.
Figure 7-B. Average scale scores in U.S. History for fourth-, eighth-, and twelfth-graders, bysex: 1994 and 2001
Average scale score
Male Female
Fourth grade Eighth grade Twelfth grade1994 19941994 20012001 2001
0
50
100
150
200
250
300
350
203 206 209 209
259 259 264 261288 285 288 286
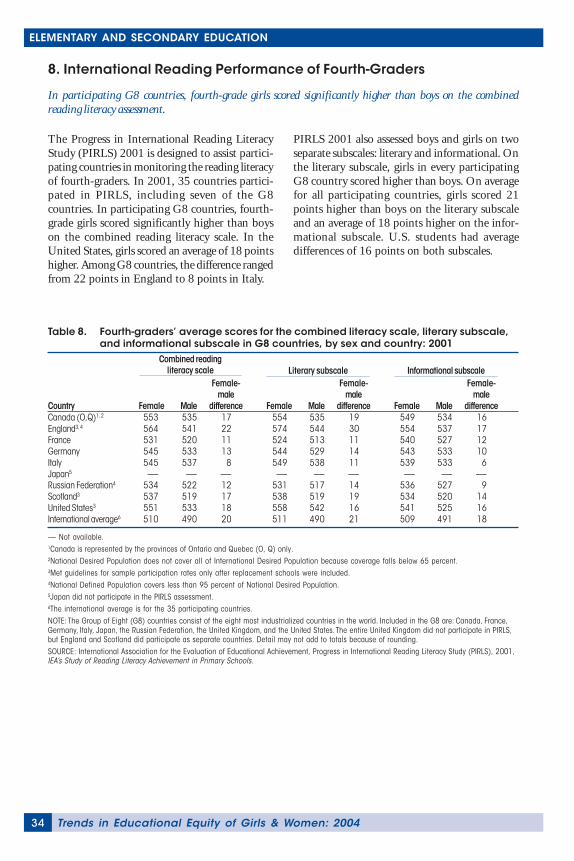
Trends in Educational Equity of Girls & Women: 200434
ELEMENTARY AND SECONDARY EDUCATION
8. International Reading Performance of Fourth-Graders
In participating G8 countries, fourth-grade girls scored significantly higher than boys on the combinedreading literacy assessment.
The Progress in International Reading LiteracyStudy (PIRLS) 2001 is designed to assist partici-pating countries in monitoring the reading literacyof fourth-graders. In 2001, 35 countries partici-pated in PIRLS, including seven of the G8countries. In participating G8 countries, fourth-grade girls scored significantly higher than boyson the combined reading literacy scale. In theUnited States, girls scored an average of 18 pointshigher. Among G8 countries, the difference rangedfrom 22 points in England to 8 points in Italy.
PIRLS 2001 also assessed boys and girls on twoseparate subscales: literary and informational. Onthe literary subscale, girls in every participatingG8 country scored higher than boys. On averagefor all participating countries, girls scored 21points higher than boys on the literary subscaleand an average of 18 points higher on the infor-mational subscale. U.S. students had averagedifferences of 16 points on both subscales.
Table 8. Fourth-graders’ average scores for the combined literacy scale, literary subscale,and informational subscale in G8 countries, by sex and country: 2001
Female- Female- Female-male male male
Country Female Male difference Female Male difference Female Male differenceCanada (O,Q)1, 2 553 535 17 554 535 19 549 534 16England3, 4 564 541 22 574 544 30 554 537 17France 531 520 11 524 513 11 540 527 12Germany 545 533 13 544 529 14 543 533 10Italy 545 537 8 549 538 11 539 533 6Japan5 —- —- —- —- —- —- —- —- —-Russian Federation4 534 522 12 531 517 14 536 527 9Scotland3 537 519 17 538 519 19 534 520 14United States3 551 533 18 558 542 16 541 525 16International average6 510 490 20 511 490 21 509 491 18
— Not available.1Canada is represented by the provinces of Ontario and Quebec (O, Q) only.2National Desired Population does not cover all of International Desired Population because coverage falls below 65 percent.3Met guidelines for sample participation rates only after replacement schools were included.4National Defined Population covers less than 95 percent of National Desired Population.5Japan did not participate in the PIRLS assessment.6The international average is for the 35 participating countries.NOTE: The Group of Eight (G8) countries consist of the eight most industrialized countries in the world. Included in the G8 are: Canada, France,Germany, Italy, Japan, the Russian Federation, the United Kingdom, and the United States. The entire United Kingdom did not participate in PIRLS,but England and Scotland did participate as separate countries. Detail may not add to totals because of rounding.SOURCE: International Association for the Evaluation of Educational Achievement, Progress in International Reading Literacy Study (PIRLS), 2001,IEA’s Study of Reading Literacy Achievement in Primary Schools.
Combined readingliteracy scale Literary subscale Informational subscale
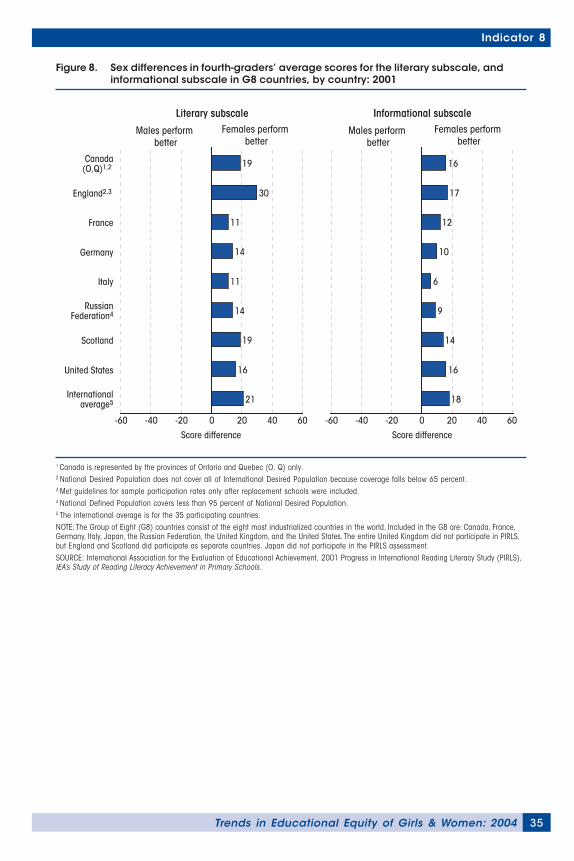
35Trends in Educational Equity of Girls & Women: 2004
Indicator 8
Figure 8. Sex differences in fourth-graders’ average scores for the literary subscale, andinformational subscale in G8 countries, by country: 2001
1 Canada is represented by the provinces of Ontario and Quebec (O, Q) only.2 National Desired Population does not cover all of International Desired Population because coverage falls below 65 percent.3 Met guidelines for sample participation rates only after replacement schools were included.4 National Defined Population covers less than 95 percent of National Desired Population.5 The international average is for the 35 participating countries.NOTE: The Group of Eight (G8) countries consist of the eight most industrialized countries in the world. Included in the G8 are: Canada, France,Germany, Italy, Japan, the Russian Federation, the United Kingdom, and the United States. The entire United Kingdom did not participate in PIRLS,but England and Scotland did participate as separate countries. Japan did not participate in the PIRLS assessment.SOURCE: International Association for the Evaluation of Educational Achievement, 2001 Progress in International Reading Literacy Study (PIRLS),IEA’s Study of Reading Literacy Achievement in Primary Schools.
Literary subscale
Males perform better
Females perform better
Males perform better
Females perform better
Informational subscale
Score difference
Internationalaverage5
United States
Scotland
RussianFederation4
Italy
Germany
France
England2,3
Canada(O,Q)1,2
Score difference
-60 -40 -20 0 20 40 60
21
16
19
14
11
14
11
30
19
-60 -40 -20 0 20 40 60
18
16
14
9
6
10
12
17
16
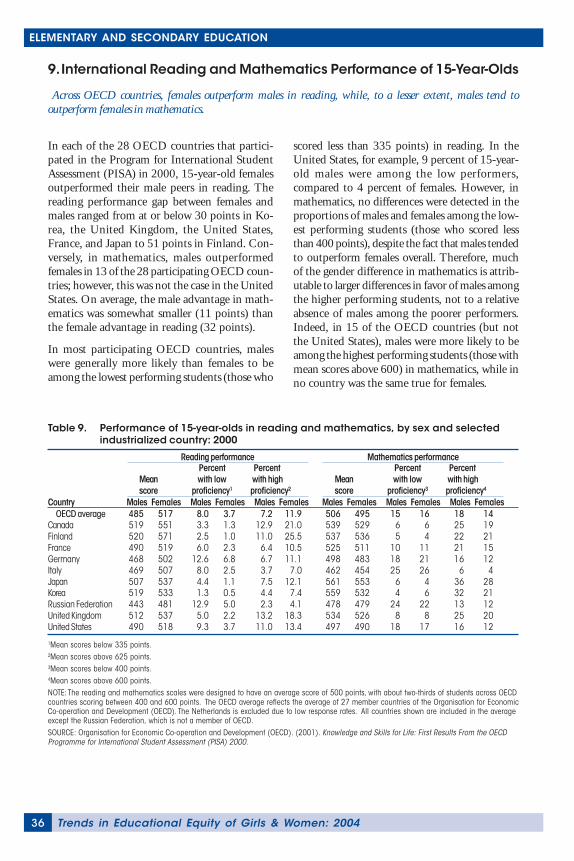
Trends in Educational Equity of Girls & Women: 200436
ELEMENTARY AND SECONDARY EDUCATION
9. International Reading and Mathematics Performance of 15-Year-Olds
Across OECD countries, females outperform males in reading, while, to a lesser extent, males tend tooutperform females in mathematics.
In each of the 28 OECD countries that partici-pated in the Program for International StudentAssessment (PISA) in 2000, 15-year-old femalesoutperformed their male peers in reading. Thereading performance gap between females andmales ranged from at or below 30 points in Ko-rea, the United Kingdom, the United States,France, and Japan to 51 points in Finland. Con-versely, in mathematics, males outperformedfemales in 13 of the 28 participating OECD coun-tries; however, this was not the case in the UnitedStates. On average, the male advantage in math-ematics was somewhat smaller (11 points) thanthe female advantage in reading (32 points).
In most participating OECD countries, maleswere generally more likely than females to beamong the lowest performing students (those who
scored less than 335 points) in reading. In theUnited States, for example, 9 percent of 15-year-old males were among the low performers,compared to 4 percent of females. However, inmathematics, no differences were detected in theproportions of males and females among the low-est performing students (those who scored lessthan 400 points), despite the fact that males tendedto outperform females overall. Therefore, muchof the gender difference in mathematics is attrib-utable to larger differences in favor of males amongthe higher performing students, not to a relativeabsence of males among the poorer performers.Indeed, in 15 of the OECD countries (but notthe United States), males were more likely to beamong the highest performing students (those withmean scores above 600) in mathematics, while inno country was the same true for females.
Table 9. Performance of 15-year-olds in reading and mathematics, by sex and selectedindustrialized country: 2000
Country Males Females Males Females Males Females Males Females Males Females Males FemalesOECD average 485 517 8.0 3.7 7.2 11.9 506 495 15 16 18 14
Canada 519 551 3.3 1.3 12.9 21.0 539 529 6 6 25 19Finland 520 571 2.5 1.0 11.0 25.5 537 536 5 4 22 21France 490 519 6.0 2.3 6.4 10.5 525 511 10 11 21 15Germany 468 502 12.6 6.8 6.7 11.1 498 483 18 21 16 12Italy 469 507 8.0 2.5 3.7 7.0 462 454 25 26 6 4Japan 507 537 4.4 1.1 7.5 12.1 561 553 6 4 36 28Korea 519 533 1.3 0.5 4.4 7.4 559 532 4 6 32 21Russian Federation 443 481 12.9 5.0 2.3 4.1 478 479 24 22 13 12United Kingdom 512 537 5.0 2.2 13.2 18.3 534 526 8 8 25 20United States 490 518 9.3 3.7 11.0 13.4 497 490 18 17 16 12
1Mean scores below 335 points.2Mean scores above 625 points.3Mean scores below 400 points.4Mean scores above 600 points.NOTE: The reading and mathematics scales were designed to have an average score of 500 points, with about two-thirds of students across OECDcountries scoring between 400 and 600 points. The OECD average reflects the average of 27 member countries of the Organisation for EconomicCo-operation and Development (OECD). The Netherlands is excluded due to low response rates. All countries shown are included in the averageexcept the Russian Federation, which is not a member of OECD.SOURCE: Organisation for Economic Co-operation and Development (OECD). (2001). Knowledge and Skills for Life: First Results From the OECDProgramme for International Student Assessment (PISA) 2000.
Mathematics performancePercent Percent
Mean with low with highscore proficiency1 proficiency2
Percent PercentMean with low with highscore proficiency3 proficiency4
Reading performance
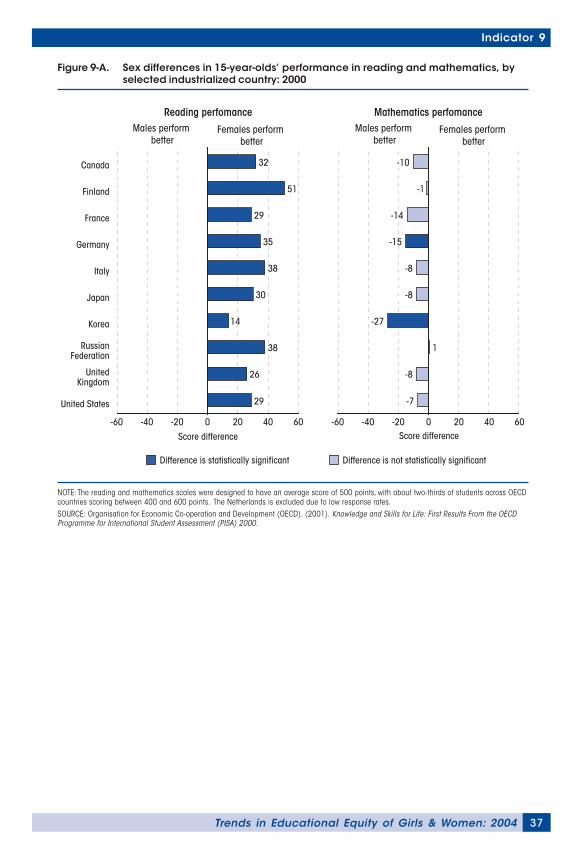
37Trends in Educational Equity of Girls & Women: 2004
Indicator 9
Figure 9-A. Sex differences in 15-year-olds’ performance in reading and mathematics, byselected industrialized country: 2000
NOTE: The reading and mathematics scales were designed to have an average score of 500 points, with about two-thirds of students across OECDcountries scoring between 400 and 600 points. The Netherlands is excluded due to low response rates.SOURCE: Organisation for Economic Co-operation and Development (OECD). (2001). Knowledge and Skills for Life: First Results From the OECDProgramme for International Student Assessment (PISA) 2000.
Reading perfomance
Females perform better
Males perform better
Females perform better
Males perform better
Mathematics perfomance
Score difference
United States
United Kingdom
Russian Federation
Korea
Japan
Italy
Germany
France
Finland
Canada
Score difference
Difference is not statistically significantDifference is statistically significant
-60 -40 -20 0 20 40 60 -60 -40 -20 0 20 40 60
29
26
38
14
30
38
35
29
51
32
-7
-8
1
-27
-8
-8
-15
-14
-1
-10
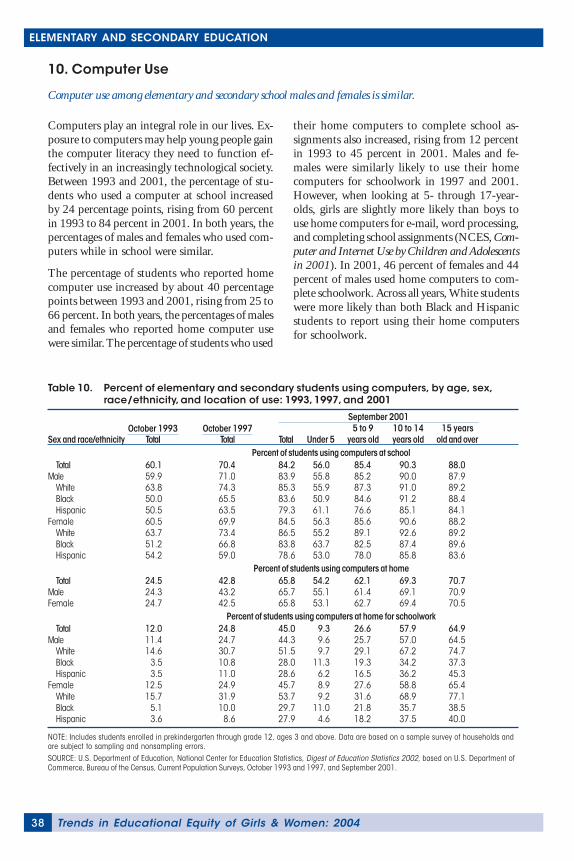
Trends in Educational Equity of Girls & Women: 200438
ELEMENTARY AND SECONDARY EDUCATION
10. Computer Use
Computer use among elementary and secondary school males and females is similar.
Computers play an integral role in our lives. Ex-posure to computers may help young people gainthe computer literacy they need to function ef-fectively in an increasingly technological society.Between 1993 and 2001, the percentage of stu-dents who used a computer at school increasedby 24 percentage points, rising from 60 percentin 1993 to 84 percent in 2001. In both years, thepercentages of males and females who used com-puters while in school were similar.
The percentage of students who reported homecomputer use increased by about 40 percentagepoints between 1993 and 2001, rising from 25 to66 percent. In both years, the percentages of malesand females who reported home computer usewere similar. The percentage of students who used
their home computers to complete school as-signments also increased, rising from 12 percentin 1993 to 45 percent in 2001. Males and fe-males were similarly likely to use their homecomputers for schoolwork in 1997 and 2001.However, when looking at 5- through 17-year-olds, girls are slightly more likely than boys touse home computers for e-mail, word processing,and completing school assignments (NCES, Com-puter and Internet Use by Children and Adolescentsin 2001). In 2001, 46 percent of females and 44percent of males used home computers to com-plete schoolwork. Across all years, White studentswere more likely than both Black and Hispanicstudents to report using their home computersfor schoolwork.
Table 10. Percent of elementary and secondary students using computers, by age, sex,race/ethnicity, and location of use: 1993, 1997, and 2001
5 to 9 10 to 14 15 yearsSex and race/ethnicity Total Total Total Under 5 years old years old old and over
Percent of students using computers at schoolTotal 60.1 70.4 84.2 56.0 85.4 90.3 88.0
Male 59.9 71.0 83.9 55.8 85.2 90.0 87.9White 63.8 74.3 85.3 55.9 87.3 91.0 89.2Black 50.0 65.5 83.6 50.9 84.6 91.2 88.4Hispanic 50.5 63.5 79.3 61.1 76.6 85.1 84.1
Female 60.5 69.9 84.5 56.3 85.6 90.6 88.2White 63.7 73.4 86.5 55.2 89.1 92.6 89.2Black 51.2 66.8 83.8 63.7 82.5 87.4 89.6Hispanic 54.2 59.0 78.6 53.0 78.0 85.8 83.6
Percent of students using computers at homeTotal 24.5 42.8 65.8 54.2 62.1 69.3 70.7
Male 24.3 43.2 65.7 55.1 61.4 69.1 70.9Female 24.7 42.5 65.8 53.1 62.7 69.4 70.5
Percent of students using computers at home for schoolworkTotal 12.0 24.8 45.0 9.3 26.6 57.9 64.9
Male 11.4 24.7 44.3 9.6 25.7 57.0 64.5White 14.6 30.7 51.5 9.7 29.1 67.2 74.7Black 3.5 10.8 28.0 11.3 19.3 34.2 37.3Hispanic 3.5 11.0 28.6 6.2 16.5 36.2 45.3
Female 12.5 24.9 45.7 8.9 27.6 58.8 65.4White 15.7 31.9 53.7 9.2 31.6 68.9 77.1Black 5.1 10.0 29.7 11.0 21.8 35.7 38.5Hispanic 3.6 8.6 27.9 4.6 18.2 37.5 40.0
NOTE: Includes students enrolled in prekindergarten through grade 12, ages 3 and above. Data are based on a sample survey of households andare subject to sampling and nonsampling errors.SOURCE: U.S. Department of Education, National Center for Education Statistics, Digest of Education Statistics 2002, based on U.S. Department ofCommerce, Bureau of the Census, Current Population Surveys, October 1993 and 1997, and September 2001.
September 2001October 1993 October 1997
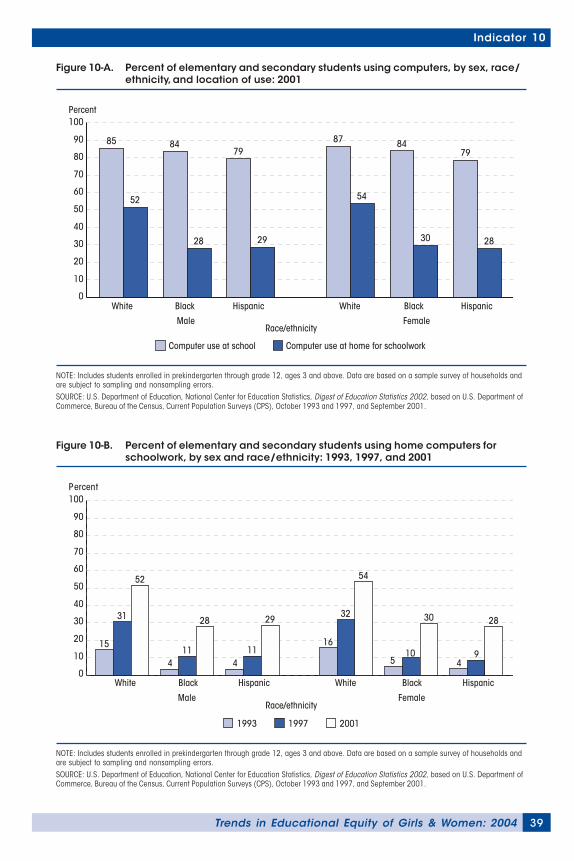
39Trends in Educational Equity of Girls & Women: 2004
Indicator 10
Figure 10-A. Percent of elementary and secondary students using computers, by sex, race/ethnicity, and location of use: 2001
NOTE: Includes students enrolled in prekindergarten through grade 12, ages 3 and above. Data are based on a sample survey of households andare subject to sampling and nonsampling errors.SOURCE: U.S. Department of Education, National Center for Education Statistics, Digest of Education Statistics 2002, based on U.S. Department ofCommerce, Bureau of the Census, Current Population Surveys (CPS), October 1993 and 1997, and September 2001.
Percent
Computer use at school Computer use at home for schoolwork
MaleRace/ethnicity
Female
White
85
52
Black
84
28
White
87
54
Black
84
30
79
29
Hispanic
79
28
Hispanic0
10
20
30
40
50
60
70
80
90
100
Figure 10-B. Percent of elementary and secondary students using home computers forschoolwork, by sex and race/ethnicity: 1993, 1997, and 2001
NOTE: Includes students enrolled in prekindergarten through grade 12, ages 3 and above. Data are based on a sample survey of households andare subject to sampling and nonsampling errors.SOURCE: U.S. Department of Education, National Center for Education Statistics, Digest of Education Statistics 2002, based on U.S. Department ofCommerce, Bureau of the Census, Current Population Surveys (CPS), October 1993 and 1997, and September 2001.
Percent
Male Female
White
15
31
52
Black
411
28
White
16
32
54
Black
510
30
0
10
20
30
40
50
60
70
80
90
100
411
29
Hispanic
49
28
Hispanic
1993 1997 2001
Race/ethnicity
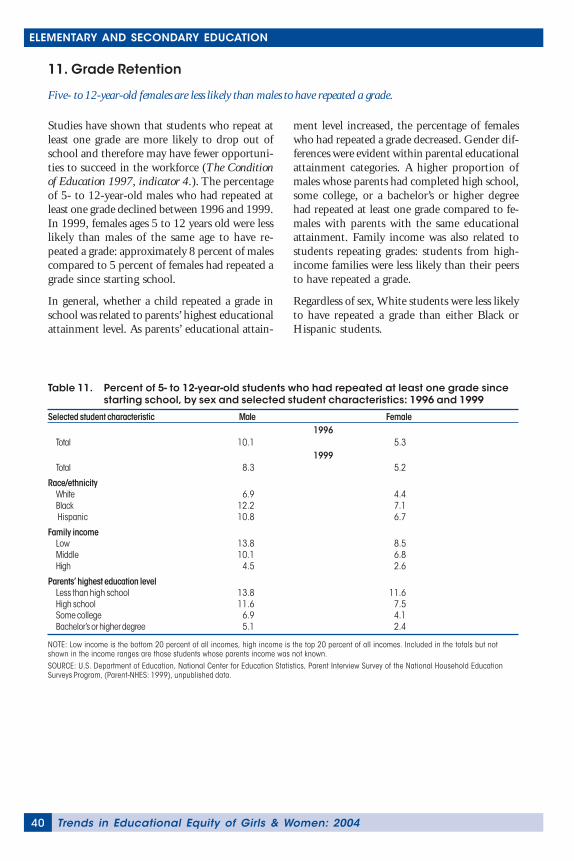
Trends in Educational Equity of Girls & Women: 200440
ELEMENTARY AND SECONDARY EDUCATION
11. Grade Retention
Five- to 12-year-old females are less likely than males to have repeated a grade.
Studies have shown that students who repeat atleast one grade are more likely to drop out ofschool and therefore may have fewer opportuni-ties to succeed in the workforce (The Conditionof Education 1997, indicator 4.). The percentageof 5- to 12-year-old males who had repeated atleast one grade declined between 1996 and 1999.In 1999, females ages 5 to 12 years old were lesslikely than males of the same age to have re-peated a grade: approximately 8 percent of malescompared to 5 percent of females had repeated agrade since starting school.
In general, whether a child repeated a grade inschool was related to parents’ highest educationalattainment level. As parents’ educational attain-
ment level increased, the percentage of femaleswho had repeated a grade decreased. Gender dif-ferences were evident within parental educationalattainment categories. A higher proportion ofmales whose parents had completed high school,some college, or a bachelor’s or higher degreehad repeated at least one grade compared to fe-males with parents with the same educationalattainment. Family income was also related tostudents repeating grades: students from high-income families were less likely than their peersto have repeated a grade.
Regardless of sex, White students were less likelyto have repeated a grade than either Black orHispanic students.
Table 11. Percent of 5- to 12-year-old students who had repeated at least one grade sincestarting school, by sex and selected student characteristics: 1996 and 1999
Selected student characteristic Male Female1996
Total 10.1 5.31999
Total 8.3 5.2
Race/ethnicityWhite 6.9 4.4Black 12.2 7.1 Hispanic 10.8 6.7
Family incomeLow 13.8 8.5Middle 10.1 6.8High 4.5 2.6
Parents’ highest education levelLess than high school 13.8 11.6High school 11.6 7.5Some college 6.9 4.1Bachelor’s or higher degree 5.1 2.4
NOTE: Low income is the bottom 20 percent of all incomes, high income is the top 20 percent of all incomes. Included in the totals but notshown in the income ranges are those students whose parents income was not known.SOURCE: U.S. Department of Education, National Center for Education Statistics, Parent Interview Survey of the National Household EducationSurveys Program, (Parent-NHES: 1999), unpublished data.
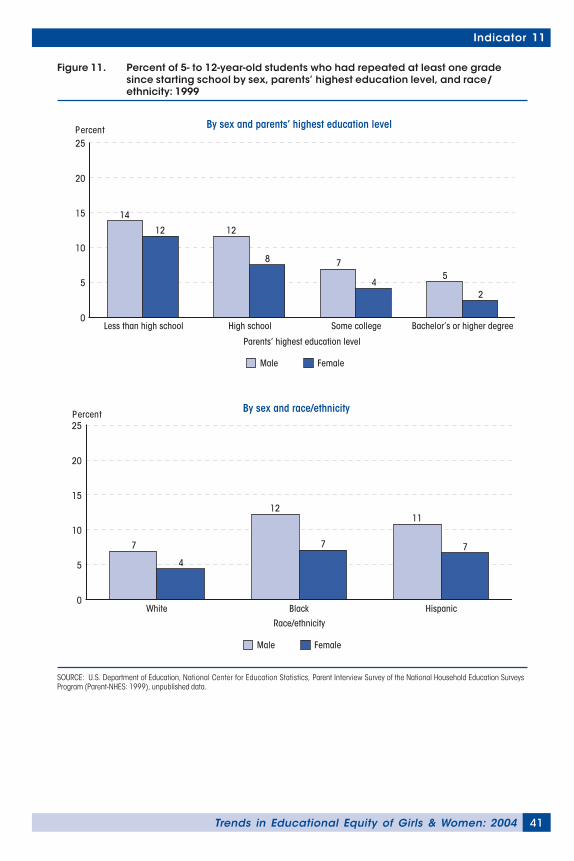
41Trends in Educational Equity of Girls & Women: 2004
Indicator 11
Figure 11. Percent of 5- to 12-year-old students who had repeated at least one gradesince starting school by sex, parents’ highest education level, and race/ethnicity: 1999
SOURCE: U.S. Department of Education, National Center for Education Statistics, Parent Interview Survey of the National Household Education SurveysProgram (Parent-NHES: 1999), unpublished data.
Male Female
Percent By sex and parents’ highest education level
Parents’ highest education level
Less than high school High school Some college Bachelor’s or higher degree0
5
10
15
20
25
14
12 12
8 7
45
2
Male Female
Percent
Race/ethnicity
By sex and race/ethnicity
White Black Hispanic0
5
10
15
20
25
7
4
12
7
11
7
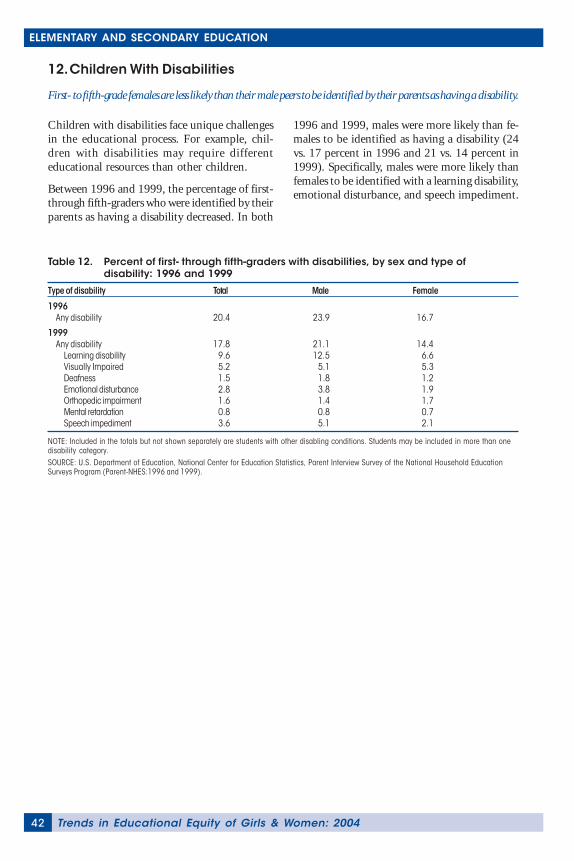
Trends in Educational Equity of Girls & Women: 200442
ELEMENTARY AND SECONDARY EDUCATION
Table 12. Percent of first- through fifth-graders with disabilities, by sex and type ofdisability: 1996 and 1999
Type of disability Total Male Female
1996Any disability 20.4 23.9 16.7
1999Any disability 17.8 21.1 14.4
Learning disability 9.6 12.5 6.6Visually Impaired 5.2 5.1 5.3Deafness 1.5 1.8 1.2Emotional disturbance 2.8 3.8 1.9Orthopedic impairment 1.6 1.4 1.7Mental retardation 0.8 0.8 0.7Speech impediment 3.6 5.1 2.1
NOTE: Included in the totals but not shown separately are students with other disabling conditions. Students may be included in more than onedisability category.SOURCE: U.S. Department of Education, National Center for Education Statistics, Parent Interview Survey of the National Household EducationSurveys Program (Parent-NHES:1996 and 1999).
12. Children With Disabilities
First- to fifth-grade females are less likely than their male peers to be identified by their parents as having a disability.
Children with disabilities face unique challengesin the educational process. For example, chil-dren with disabilities may require differenteducational resources than other children.
Between 1996 and 1999, the percentage of first-through fifth-graders who were identified by theirparents as having a disability decreased. In both
1996 and 1999, males were more likely than fe-males to be identified as having a disability (24vs. 17 percent in 1996 and 21 vs. 14 percent in1999). Specifically, males were more likely thanfemales to be identified with a learning disability,emotional disturbance, and speech impediment.
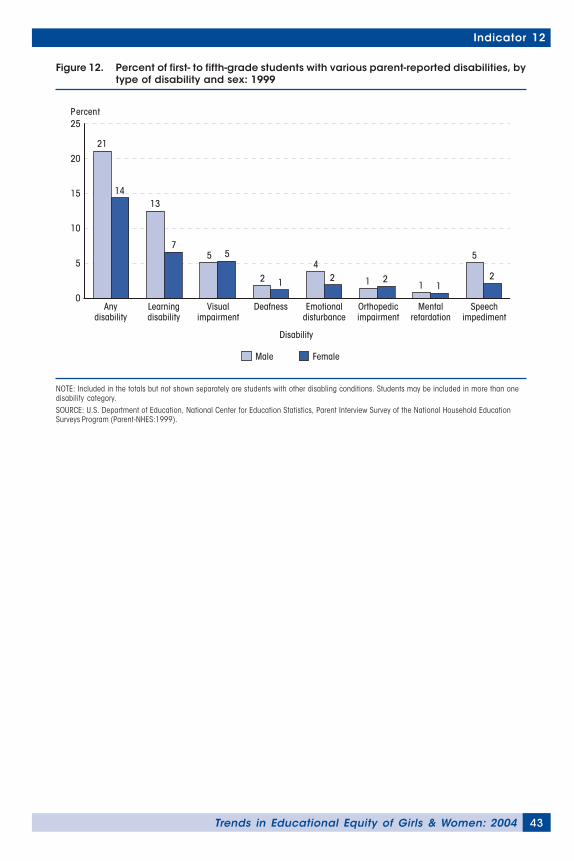
43Trends in Educational Equity of Girls & Women: 2004
Indicator 12
Figure 12. Percent of first- to fifth-grade students with various parent-reported disabilities, bytype of disability and sex: 1999
NOTE: Included in the totals but not shown separately are students with other disabling conditions. Students may be included in more than onedisability category.SOURCE: U.S. Department of Education, National Center for Education Statistics, Parent Interview Survey of the National Household EducationSurveys Program (Parent-NHES:1999).
Male Female
Percent
Disability
Anydisability
Learningdisability
Visualimpairment
Deafness Emotional disturbance
Orthopedic impairment
Mental retardation
Speech impediment
21
1413
75 5
2 1
42 1 2
1 1
5
2
0
5
10
15
20
25
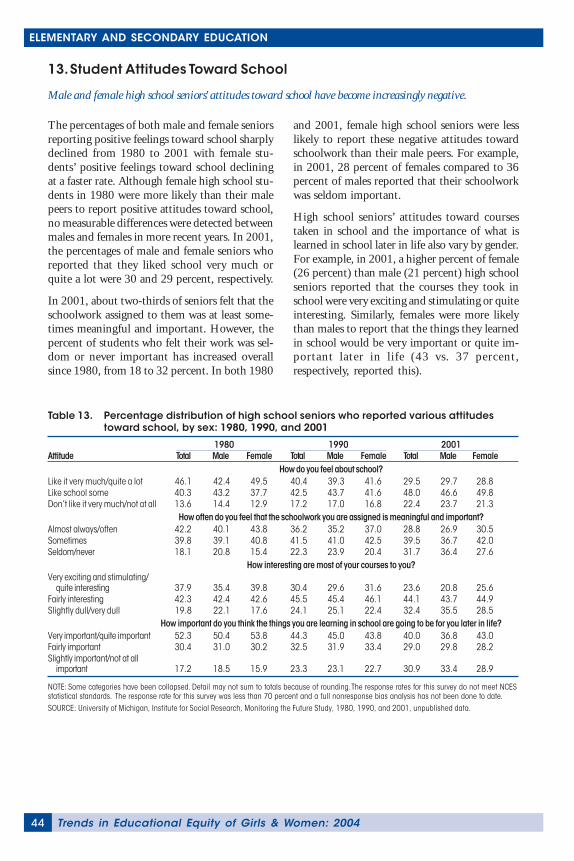
Trends in Educational Equity of Girls & Women: 200444
ELEMENTARY AND SECONDARY EDUCATION
13. Student Attitudes Toward School
Male and female high school seniors’ attitudes toward school have become increasingly negative.
The percentages of both male and female seniorsreporting positive feelings toward school sharplydeclined from 1980 to 2001 with female stu-dents’ positive feelings toward school decliningat a faster rate. Although female high school stu-dents in 1980 were more likely than their malepeers to report positive attitudes toward school,no measurable differences were detected betweenmales and females in more recent years. In 2001,the percentages of male and female seniors whoreported that they liked school very much orquite a lot were 30 and 29 percent, respectively.
In 2001, about two-thirds of seniors felt that theschoolwork assigned to them was at least some-times meaningful and important. However, thepercent of students who felt their work was sel-dom or never important has increased overallsince 1980, from 18 to 32 percent. In both 1980
and 2001, female high school seniors were lesslikely to report these negative attitudes towardschoolwork than their male peers. For example,in 2001, 28 percent of females compared to 36percent of males reported that their schoolworkwas seldom important.
High school seniors’ attitudes toward coursestaken in school and the importance of what islearned in school later in life also vary by gender.For example, in 2001, a higher percent of female(26 percent) than male (21 percent) high schoolseniors reported that the courses they took inschool were very exciting and stimulating or quiteinteresting. Similarly, females were more likelythan males to report that the things they learnedin school would be very important or quite im-portant later in life (43 vs. 37 percent,respectively, reported this).
Table 13. Percentage distribution of high school seniors who reported various attitudestoward school, by sex: 1980, 1990, and 2001
Attitude Total Male Female Total Male Female Total Male FemaleHow do you feel about school?
Like it very much/quite a lot 46.1 42.4 49.5 40.4 39.3 41.6 29.5 29.7 28.8Like school some 40.3 43.2 37.7 42.5 43.7 41.6 48.0 46.6 49.8Don’t like it very much/not at all 13.6 14.4 12.9 17.2 17.0 16.8 22.4 23.7 21.3
How often do you feel that the schoolwork you are assigned is meaningful and important?Almost always/often 42.2 40.1 43.8 36.2 35.2 37.0 28.8 26.9 30.5Sometimes 39.8 39.1 40.8 41.5 41.0 42.5 39.5 36.7 42.0Seldom/never 18.1 20.8 15.4 22.3 23.9 20.4 31.7 36.4 27.6
How interesting are most of your courses to you?Very exciting and stimulating/
quite interesting 37.9 35.4 39.8 30.4 29.6 31.6 23.6 20.8 25.6Fairly interesting 42.3 42.4 42.6 45.5 45.4 46.1 44.1 43.7 44.9Slightly dull/very dull 19.8 22.1 17.6 24.1 25.1 22.4 32.4 35.5 28.5
How important do you think the things you are learning in school are going to be for you later in life?Very important/quite important 52.3 50.4 53.8 44.3 45.0 43.8 40.0 36.8 43.0Fairly important 30.4 31.0 30.2 32.5 31.9 33.4 29.0 29.8 28.2Slightly important/not at all
important 17.2 18.5 15.9 23.3 23.1 22.7 30.9 33.4 28.9
NOTE: Some categories have been collapsed. Detail may not sum to totals because of rounding. The response rates for this survey do not meet NCESstatistical standards. The response rate for this survey was less than 70 percent and a full nonresponse bias analysis has not been done to date.SOURCE: University of Michigan, Institute for Social Research, Monitoring the Future Study, 1980, 1990, and 2001, unpublished data.
20011980 1990
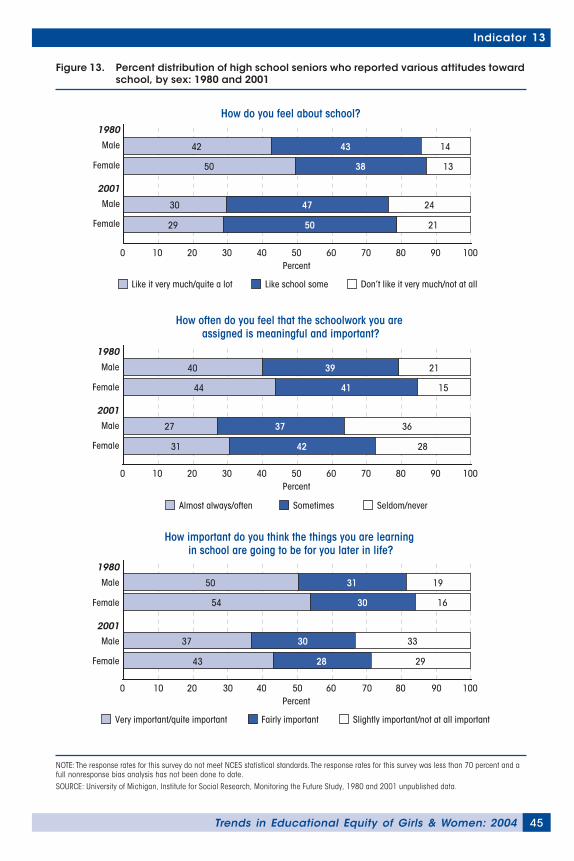
45Trends in Educational Equity of Girls & Women: 2004
Indicator 13
Figure 13. Percent distribution of high school seniors who reported various attitudes towardschool, by sex: 1980 and 2001
NOTE: The response rates for this survey do not meet NCES statistical standards. The response rates for this survey was less than 70 percent and afull nonresponse bias analysis has not been done to date.SOURCE: University of Michigan, Institute for Social Research, Monitoring the Future Study, 1980 and 2001 unpublished data.
How do you feel about school?
0 40Percent
60 802010 50 70 9030 100
Like it very much/quite a lot Like school some Don’t like it very much/not at all
Female
Male
2001
Female
Male
1980
42 43 14
50 38 13
30 47 24
29 50 21
How often do you feel that the schoolwork you are assigned is meaningful and important?
0 40Percent
60 802010 50 70 9030 100
Almost always/often Sometimes Seldom/never
Female
Male
2001
Female
Male
1980
40 39 21
44 41 15
27 37 36
31 42 28
How important do you think the things you are learning in school are going to be for you later in life?
0 40Percent
60 802010 50 70 9030 100
Very important/quite important Fairly important Slightly important/not at all important
Female
Male
2001
Female
Male
1980
50 31 19
54 30 16
37 30 33
43 28 29
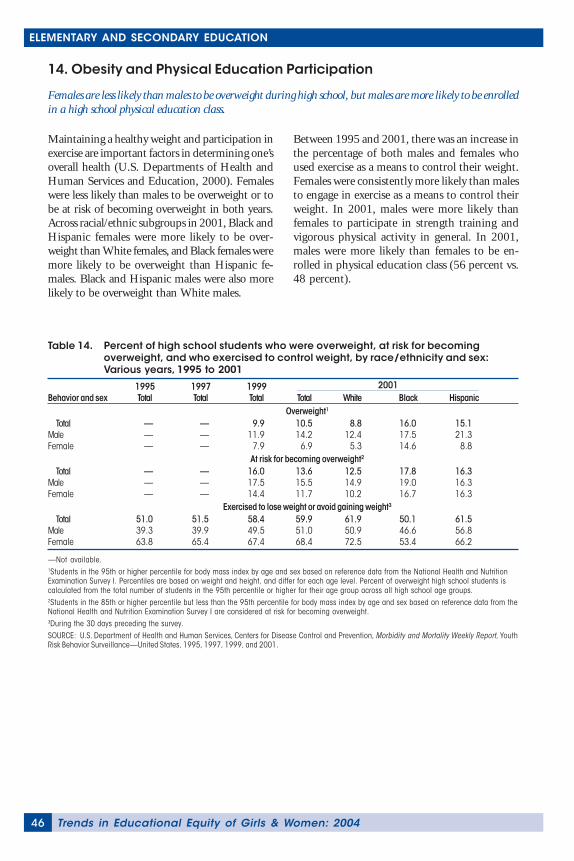
Trends in Educational Equity of Girls & Women: 200446
ELEMENTARY AND SECONDARY EDUCATION
14. Obesity and Physical Education Participation
Females are less likely than males to be overweight during high school, but males are more likely to be enrolledin a high school physical education class.
Maintaining a healthy weight and participation inexercise are important factors in determining one’soverall health (U.S. Departments of Health andHuman Services and Education, 2000). Femaleswere less likely than males to be overweight or tobe at risk of becoming overweight in both years.Across racial/ethnic subgroups in 2001, Black andHispanic females were more likely to be over-weight than White females, and Black females weremore likely to be overweight than Hispanic fe-males. Black and Hispanic males were also morelikely to be overweight than White males.
Between 1995 and 2001, there was an increase inthe percentage of both males and females whoused exercise as a means to control their weight.Females were consistently more likely than malesto engage in exercise as a means to control theirweight. In 2001, males were more likely thanfemales to participate in strength training andvigorous physical activity in general. In 2001,males were more likely than females to be en-rolled in physical education class (56 percent vs.48 percent).
Table 14. Percent of high school students who were overweight, at risk for becomingoverweight, and who exercised to control weight, by race/ethnicity and sex:Various years, 1995 to 2001
1995 1997 1999Behavior and sex Total Total Total Total White Black Hispanic
Overweight1
Total — — 9.9 10.5 8.8 16.0 15.1Male — — 11.9 14.2 12.4 17.5 21.3Female — — 7.9 6.9 5.3 14.6 8.8
At risk for becoming overweight2
Total — — 16.0 13.6 12.5 17.8 16.3Male — — 17.5 15.5 14.9 19.0 16.3Female — — 14.4 11.7 10.2 16.7 16.3
Exercised to lose weight or avoid gaining weight3
Total 51.0 51.5 58.4 59.9 61.9 50.1 61.5Male 39.3 39.9 49.5 51.0 50.9 46.6 56.8Female 63.8 65.4 67.4 68.4 72.5 53.4 66.2
—Not available.1Students in the 95th or higher percentile for body mass index by age and sex based on reference data from the National Health and NutritionExamination Survey I. Percentiles are based on weight and height, and differ for each age level. Percent of overweight high school students iscalculated from the total number of students in the 95th percentile or higher for their age group across all high school age groups.2Students in the 85th or higher percentile but less than the 95th percentile for body mass index by age and sex based on reference data from theNational Health and Nutrition Examination Survey I are considered at risk for becoming overweight.3During the 30 days preceding the survey.SOURCE: U.S. Department of Health and Human Services, Centers for Disease Control and Prevention, Morbidity and Mortality Weekly Report, YouthRisk Behavior Surveillance—United States, 1995, 1997, 1999, and 2001.
2001
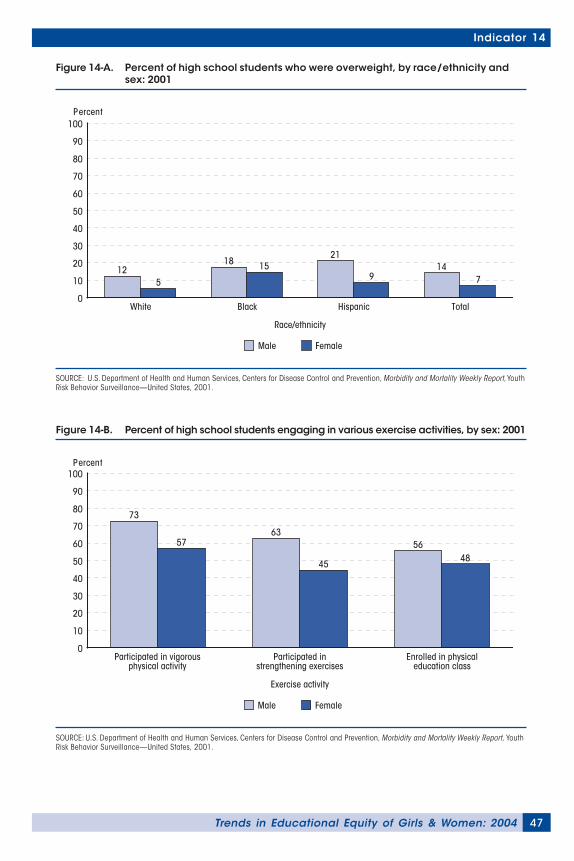
47Trends in Educational Equity of Girls & Women: 2004
Indicator 14
Figure 14-A. Percent of high school students who were overweight, by race/ethnicity andsex: 2001
SOURCE: U.S. Department of Health and Human Services, Centers for Disease Control and Prevention, Morbidity and Mortality Weekly Report, YouthRisk Behavior Surveillance—United States, 2001.
Male Female
Percent
Race/ethnicity
White Black Hispanic Total0
10
20
30
40
50
60
70
80
90
100
125
18 1521
914
7
Figure 14-B. Percent of high school students engaging in various exercise activities, by sex: 2001
SOURCE: U.S. Department of Health and Human Services, Centers for Disease Control and Prevention, Morbidity and Mortality Weekly Report, YouthRisk Behavior Surveillance—United States, 2001.
Male Female
Percent
Exercise activity
0
10
20
30
40
50
60
70
80
90
100
73
5763
45
5648
Enrolled in physical education class
Participated in strengthening exercises
Participated in vigorous physical activity
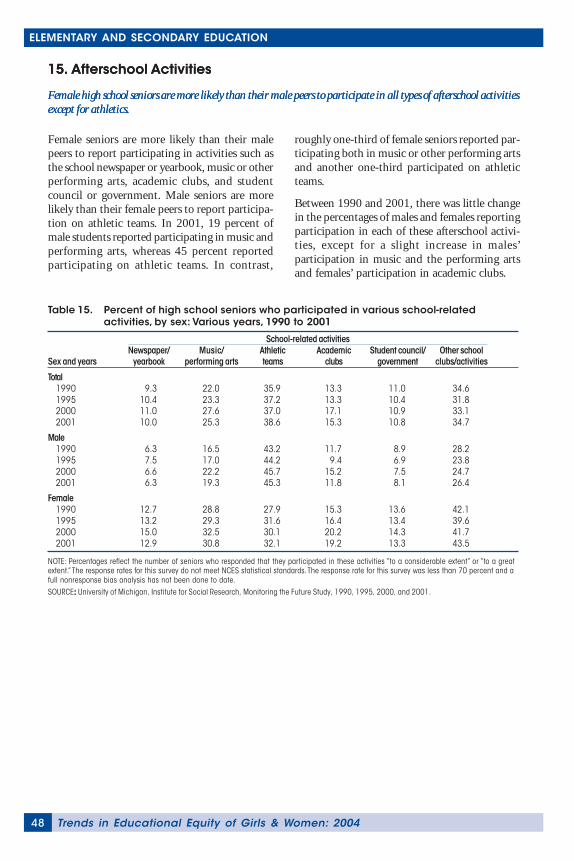
Trends in Educational Equity of Girls & Women: 200448
ELEMENTARY AND SECONDARY EDUCATION
15. Afterschool Activities
Female high school seniors are more likely than their male peers to participate in all types of afterschool activitiesexcept for athletics.
Table 15. Percent of high school seniors who participated in various school-relatedactivities, by sex: Various years, 1990 to 2001
Newspaper/ Music/ Athletic Academic Student council/ Other schoolSex and years yearbook performing arts teams clubs government clubs/activities
Total1990 9.3 22.0 35.9 13.3 11.0 34.61995 10.4 23.3 37.2 13.3 10.4 31.82000 11.0 27.6 37.0 17.1 10.9 33.12001 10.0 25.3 38.6 15.3 10.8 34.7
Male1990 6.3 16.5 43.2 11.7 8.9 28.21995 7.5 17.0 44.2 9.4 6.9 23.82000 6.6 22.2 45.7 15.2 7.5 24.72001 6.3 19.3 45.3 11.8 8.1 26.4
Female1990 12.7 28.8 27.9 15.3 13.6 42.11995 13.2 29.3 31.6 16.4 13.4 39.62000 15.0 32.5 30.1 20.2 14.3 41.72001 12.9 30.8 32.1 19.2 13.3 43.5
NOTE: Percentages reflect the number of seniors who responded that they participated in these activities “to a considerable extent” or “to a greatextent.” The response rates for this survey do not meet NCES statistical standards. The response rate for this survey was less than 70 percent and afull nonresponse bias analysis has not been done to date.SOURCE::::: University of Michigan, Institute for Social Research, Monitoring the Future Study, 1990, 1995, 2000, and 2001.
School-related activities
15. Afterschool Activities
Female high school seniors are more likely than their male peers to participate in all types of afterschool activitiesexcept for athletics.
Female seniors are more likely than their malepeers to report participating in activities such asthe school newspaper or yearbook, music or otherperforming arts, academic clubs, and studentcouncil or government. Male seniors are morelikely than their female peers to report participa-tion on athletic teams. In 2001, 19 percent ofmale students reported participating in music andperforming arts, whereas 45 percent reportedparticipating on athletic teams. In contrast,
roughly one-third of female seniors reported par-ticipating both in music or other performing artsand another one-third participated on athleticteams.
Between 1990 and 2001, there was little changein the percentages of males and females reportingparticipation in each of these afterschool activi-ties, except for a slight increase in males’participation in music and the performing artsand females’ participation in academic clubs.
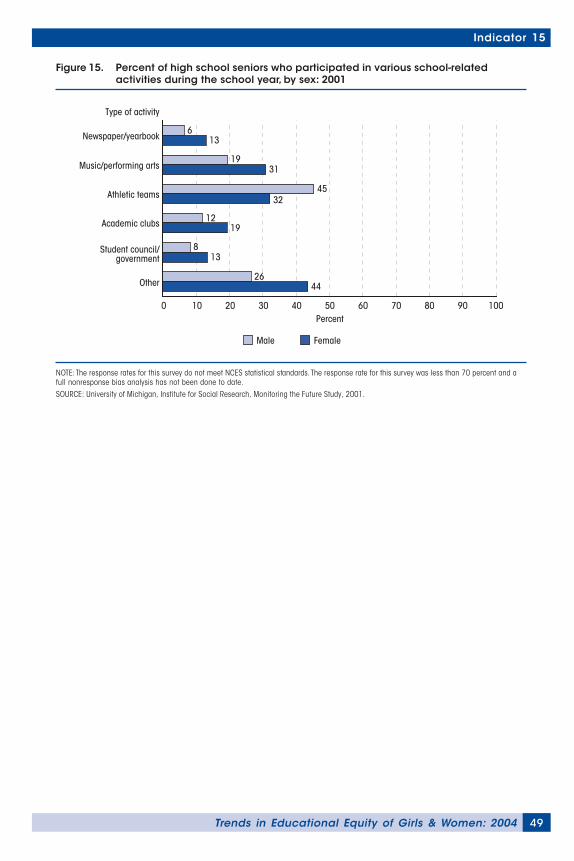
49Trends in Educational Equity of Girls & Women: 2004
Indicator 15
Figure 15. Percent of high school seniors who participated in various school-relatedactivities during the school year, by sex: 2001
NOTE: The response rates for this survey do not meet NCES statistical standards. The response rate for this survey was less than 70 percent and afull nonresponse bias analysis has not been done to date.SOURCE: University of Michigan, Institute for Social Research, Monitoring the Future Study, 2001.
Percent
Type of activity
Other
Student council/government
Academic clubs
Athletic teams
Music/performing arts
Newspaper/yearbook
Male Female
0 10 20 30 40 50 60 70 80 90 100
613
1931
4532
1219
813
2644
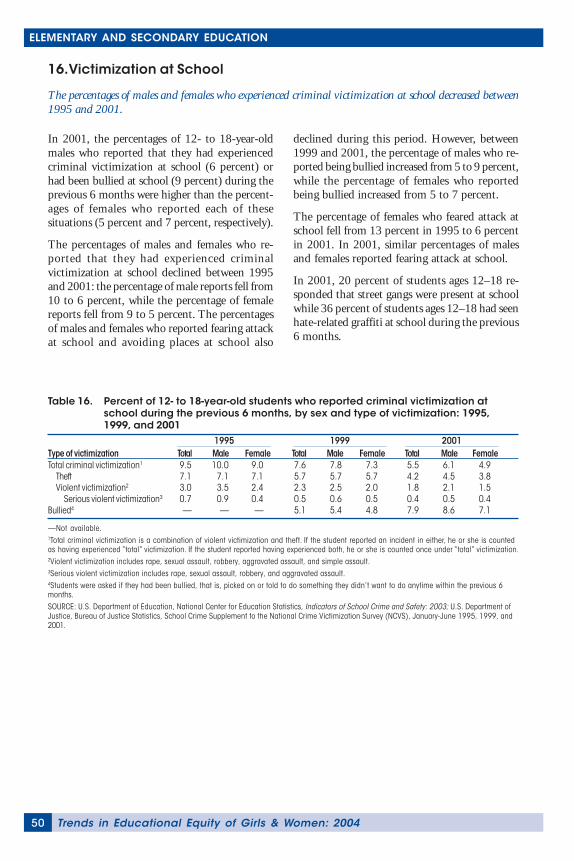
Trends in Educational Equity of Girls & Women: 200450
ELEMENTARY AND SECONDARY EDUCATION
16. Victimization at School
The percentages of males and females who experienced criminal victimization at school decreased between1995 and 2001.
In 2001, the percentages of 12- to 18-year-oldmales who reported that they had experiencedcriminal victimization at school (6 percent) orhad been bullied at school (9 percent) during theprevious 6 months were higher than the percent-ages of females who reported each of thesesituations (5 percent and 7 percent, respectively).
The percentages of males and females who re-ported that they had experienced criminalvictimization at school declined between 1995and 2001: the percentage of male reports fell from10 to 6 percent, while the percentage of femalereports fell from 9 to 5 percent. The percentagesof males and females who reported fearing attackat school and avoiding places at school also
declined during this period. However, between1999 and 2001, the percentage of males who re-ported being bullied increased from 5 to 9 percent,while the percentage of females who reportedbeing bullied increased from 5 to 7 percent.
The percentage of females who feared attack atschool fell from 13 percent in 1995 to 6 percentin 2001. In 2001, similar percentages of malesand females reported fearing attack at school.
In 2001, 20 percent of students ages 12–18 re-sponded that street gangs were present at schoolwhile 36 percent of students ages 12–18 had seenhate-related graffiti at school during the previous6 months.
Table 16. Percent of 12- to 18-year-old students who reported criminal victimization atschool during the previous 6 months, by sex and type of victimization: 1995,1999, and 2001
Type of victimization Total Male Female Total Male Female Total Male FemaleTotal criminal victimization1 9.5 10.0 9.0 7.6 7.8 7.3 5.5 6.1 4.9
Theft 7.1 7.1 7.1 5.7 5.7 5.7 4.2 4.5 3.8Violent victimization2 3.0 3.5 2.4 2.3 2.5 2.0 1.8 2.1 1.5
Serious violent victimization3 0.7 0.9 0.4 0.5 0.6 0.5 0.4 0.5 0.4Bullied4 — — — 5.1 5.4 4.8 7.9 8.6 7.1
—Not available.1Total criminal victimization is a combination of violent victimization and theft. If the student reported an incident in either, he or she is countedas having experienced “total” victimization. If the student reported having experienced both, he or she is counted once under “total” victimization.2Violent victimization includes rape, sexual assault, robbery, aggravated assault, and simple assault.3Serious violent victimization includes rape, sexual assault, robbery, and aggravated assault.4Students were asked if they had been bullied, that is, picked on or told to do something they didn’t want to do anytime within the previous 6months.SOURCE: U.S. Department of Education, National Center for Education Statistics, Indicators of School Crime and Safety: 2003; U.S. Department ofJustice, Bureau of Justice Statistics, School Crime Supplement to the National Crime Victimization Survey (NCVS), January-June 1995, 1999, and2001.
1995 1999 2001
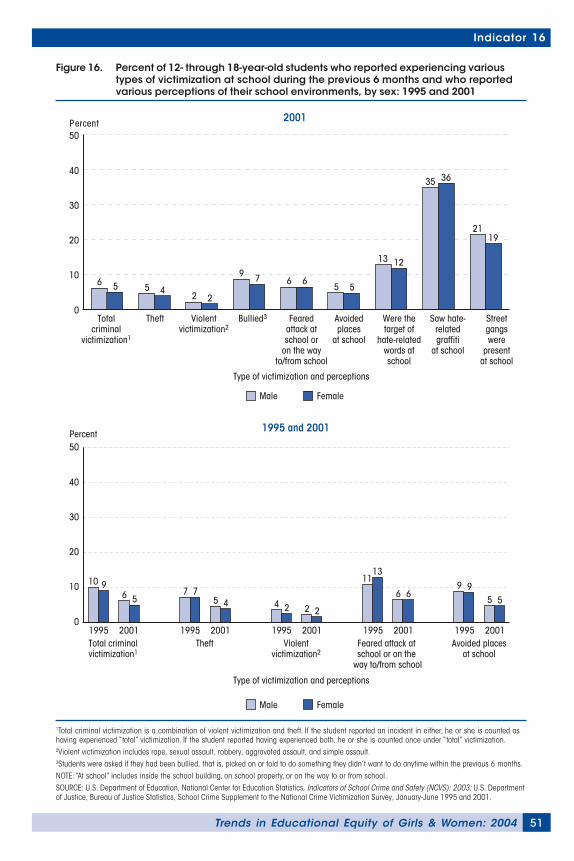
51Trends in Educational Equity of Girls & Women: 2004
Indicator 16
Figure 16. Percent of 12- through 18-year-old students who reported experiencing varioustypes of victimization at school during the previous 6 months and who reportedvarious perceptions of their school environments, by sex: 1995 and 2001
1Total criminal victimization is a combination of violent victimization and theft. If the student reported an incident in either, he or she is counted ashaving experienced “total” victimization. If the student reported having experienced both, he or she is counted once under “total” victimization.2Violent victimization includes rape, sexual assault, robbery, aggravated assault, and simple assault.3Students were asked if they had been bullied, that is, picked on or told to do something they didn’t want to do anytime within the previous 6 months.NOTE: “At school” includes inside the school building, on school property, or on the way to or from school.SOURCE: U.S. Department of Education, National Center for Education Statistics, Indicators of School Crime and Safety (NCVS): 2003; U.S. Departmentof Justice, Bureau of Justice Statistics, School Crime Supplement to the National Crime Victimization Survey, January-June 1995 and 2001.
Male Female
Percent
Type of victimization and perceptions
Type of victimization and perceptions
Male Female
Totalcriminal
victimization1
Theft Violentvictimization2
Bullied3 Feared attack at school or
on the wayto/from school
Avoided places
at school
Were the target of
hate-related words at school
Saw hate- related graffiti
at school
Streetgangswere
present at school
2001
0
10
20
30
40
50
6 5 5 4 2 2
9 7 6 65 5
13 12
35 36
2119
Total criminal victimization1
Theft Violentvictimization2
Feared attack at school or on the
way to/from school
Avoided places at school
1995 and 2001Percent
1995 2001 1995 2001 1995 2001 1995 2001 1995 20010
10
20
30
40
50
10 96 5
7 75 4 4 2 2 2
1113
6 69 9
5 5
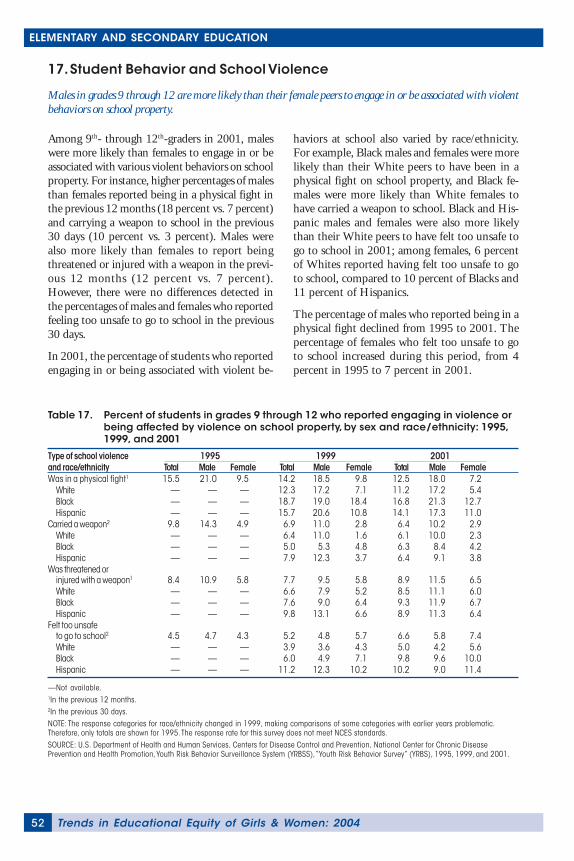
Trends in Educational Equity of Girls & Women: 200452
ELEMENTARY AND SECONDARY EDUCATION
17. Student Behavior and School Violence
Males in grades 9 through 12 are more likely than their female peers to engage in or be associated with violentbehaviors on school property.
Among 9th- through 12th-graders in 2001, maleswere more likely than females to engage in or beassociated with various violent behaviors on schoolproperty. For instance, higher percentages of malesthan females reported being in a physical fight inthe previous 12 months (18 percent vs. 7 percent)and carrying a weapon to school in the previous30 days (10 percent vs. 3 percent). Males werealso more likely than females to report beingthreatened or injured with a weapon in the previ-ous 12 months (12 percent vs. 7 percent).However, there were no differences detected inthe percentages of males and females who reportedfeeling too unsafe to go to school in the previous30 days.
In 2001, the percentage of students who reportedengaging in or being associated with violent be-
haviors at school also varied by race/ethnicity.For example, Black males and females were morelikely than their White peers to have been in aphysical fight on school property, and Black fe-males were more likely than White females tohave carried a weapon to school. Black and His-panic males and females were also more likelythan their White peers to have felt too unsafe togo to school in 2001; among females, 6 percentof Whites reported having felt too unsafe to goto school, compared to 10 percent of Blacks and11 percent of Hispanics.
The percentage of males who reported being in aphysical fight declined from 1995 to 2001. Thepercentage of females who felt too unsafe to goto school increased during this period, from 4percent in 1995 to 7 percent in 2001.
Table 17. Percent of students in grades 9 through 12 who reported engaging in violence orbeing affected by violence on school property, by sex and race/ethnicity: 1995,1999, and 2001
Type of school violenceand race/ethnicity Total Male Female Total Male Female Total Male FemaleWas in a physical fight1 15.5 21.0 9.5 14.2 18.5 9.8 12.5 18.0 7.2
White — — — 12.3 17.2 7.1 11.2 17.2 5.4Black — — — 18.7 19.0 18.4 16.8 21.3 12.7Hispanic — — — 15.7 20.6 10.8 14.1 17.3 11.0
Carried a weapon2 9.8 14.3 4.9 6.9 11.0 2.8 6.4 10.2 2.9White — — — 6.4 11.0 1.6 6.1 10.0 2.3Black — — — 5.0 5.3 4.8 6.3 8.4 4.2Hispanic — — — 7.9 12.3 3.7 6.4 9.1 3.8
Was threatened orinjured with a weapon1 8.4 10.9 5.8 7.7 9.5 5.8 8.9 11.5 6.5White — — — 6.6 7.9 5.2 8.5 11.1 6.0Black — — — 7.6 9.0 6.4 9.3 11.9 6.7Hispanic — — — 9.8 13.1 6.6 8.9 11.3 6.4
Felt too unsafeto go to school2 4.5 4.7 4.3 5.2 4.8 5.7 6.6 5.8 7.4White — — — 3.9 3.6 4.3 5.0 4.2 5.6Black — — — 6.0 4.9 7.1 9.8 9.6 10.0Hispanic — — — 11.2 12.3 10.2 10.2 9.0 11.4
—Not available.1In the previous 12 months.2In the previous 30 days.NOTE: The response categories for race/ethnicity changed in 1999, making comparisons of some categories with earlier years problematic.Therefore, only totals are shown for 1995. The response rate for this survey does not meet NCES standards.SOURCE: U.S. Department of Health and Human Services, Centers for Disease Control and Prevention, National Center for Chronic DiseasePrevention and Health Promotion, Youth Risk Behavior Surveillance System (YRBSS), “Youth Risk Behavior Survey” (YRBS), 1995, 1999, and 2001.
20011995 1999
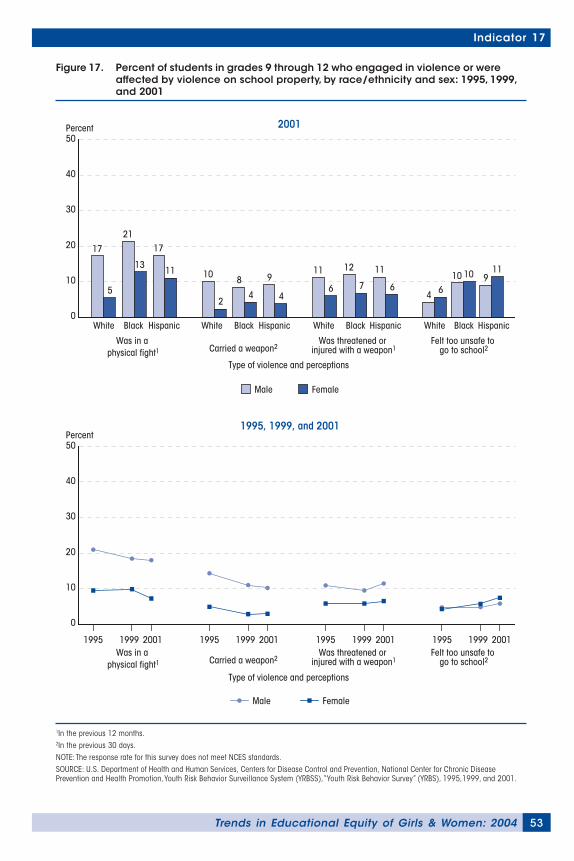
53Trends in Educational Equity of Girls & Women: 2004
Indicator 17
Figure 17. Percent of students in grades 9 through 12 who engaged in violence or wereaffected by violence on school property, by race/ethnicity and sex: 1995, 1999,and 2001
1In the previous 12 months.2In the previous 30 days.NOTE: The response rate for this survey does not meet NCES standards.SOURCE: U.S. Department of Health and Human Services, Centers for Disease Control and Prevention, National Center for Chronic DiseasePrevention and Health Promotion, Youth Risk Behavior Surveillance System (YRBSS), “Youth Risk Behavior Survey” (YRBS), 1995,1999, and 2001.
Percent
0
10
20
30
40
50
Male Female
Was in a physical fight1 Carried a weapon2
Type of violence and perceptions
Type of violence and perceptions
Was threatened or injured with a weapon1
White
17
5
Black
21
13
Hispanic
17
11
White
10
2
Black
8
4
Hispanic
9
4
White
11
6
Black
12
7
Hispanic
11
64
White
6
Black
10 10
Hispanic
911
Felt too unsafe to go to school2
Was in a physical fight1 Carried a weapon2
Was threatened or injured with a weapon1
Felt too unsafe to go to school2
2001
Percent
Male Female
1995 1999 2001 1995 1999 2001 1995 1999 2001 1995 1999 2001
1995, 1999, and 2001
0
10
20
30
40
50
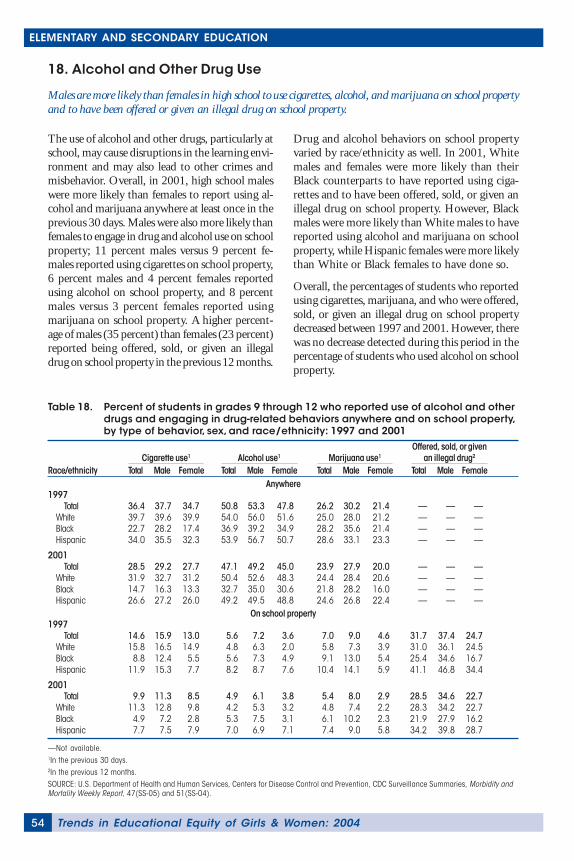
Trends in Educational Equity of Girls & Women: 200454
ELEMENTARY AND SECONDARY EDUCATION
18. Alcohol and Other Drug Use
Males are more likely than females in high school to use cigarettes, alcohol, and marijuana on school propertyand to have been offered or given an illegal drug on school property.
The use of alcohol and other drugs, particularly atschool, may cause disruptions in the learning envi-ronment and may also lead to other crimes andmisbehavior. Overall, in 2001, high school maleswere more likely than females to report using al-cohol and marijuana anywhere at least once in theprevious 30 days. Males were also more likely thanfemales to engage in drug and alcohol use on schoolproperty; 11 percent males versus 9 percent fe-males reported using cigarettes on school property,6 percent males and 4 percent females reportedusing alcohol on school property, and 8 percentmales versus 3 percent females reported usingmarijuana on school property. A higher percent-age of males (35 percent) than females (23 percent)reported being offered, sold, or given an illegaldrug on school property in the previous 12 months.
Drug and alcohol behaviors on school propertyvaried by race/ethnicity as well. In 2001, Whitemales and females were more likely than theirBlack counterparts to have reported using ciga-rettes and to have been offered, sold, or given anillegal drug on school property. However, Blackmales were more likely than White males to havereported using alcohol and marijuana on schoolproperty, while Hispanic females were more likelythan White or Black females to have done so.
Overall, the percentages of students who reportedusing cigarettes, marijuana, and who were offered,sold, or given an illegal drug on school propertydecreased between 1997 and 2001. However, therewas no decrease detected during this period in thepercentage of students who used alcohol on schoolproperty.
Table 18. Percent of students in grades 9 through 12 who reported use of alcohol and otherdrugs and engaging in drug-related behaviors anywhere and on school property,by type of behavior, sex, and race/ethnicity: 1997 and 2001
Race/ethnicity Total Male Female Total Male Female Total Male Female Total Male FemaleAnywhere
1997Total 36.4 37.7 34.7 50.8 53.3 47.8 26.2 30.2 21.4 — — —
White 39.7 39.6 39.9 54.0 56.0 51.6 25.0 28.0 21.2 — — —Black 22.7 28.2 17.4 36.9 39.2 34.9 28.2 35.6 21.4 — — —Hispanic 34.0 35.5 32.3 53.9 56.7 50.7 28.6 33.1 23.3 — — —
2001Total 28.5 29.2 27.7 47.1 49.2 45.0 23.9 27.9 20.0 — — —
White 31.9 32.7 31.2 50.4 52.6 48.3 24.4 28.4 20.6 — — —Black 14.7 16.3 13.3 32.7 35.0 30.6 21.8 28.2 16.0 — — —Hispanic 26.6 27.2 26.0 49.2 49.5 48.8 24.6 26.8 22.4 — — —
On school property1997
Total 14.6 15.9 13.0 5.6 7.2 3.6 7.0 9.0 4.6 31.7 37.4 24.7White 15.8 16.5 14.9 4.8 6.3 2.0 5.8 7.3 3.9 31.0 36.1 24.5Black 8.8 12.4 5.5 5.6 7.3 4.9 9.1 13.0 5.4 25.4 34.6 16.7Hispanic 11.9 15.3 7.7 8.2 8.7 7.6 10.4 14.1 5.9 41.1 46.8 34.4
2001Total 9.9 11.3 8.5 4.9 6.1 3.8 5.4 8.0 2.9 28.5 34.6 22.7
White 11.3 12.8 9.8 4.2 5.3 3.2 4.8 7.4 2.2 28.3 34.2 22.7Black 4.9 7.2 2.8 5.3 7.5 3.1 6.1 10.2 2.3 21.9 27.9 16.2Hispanic 7.7 7.5 7.9 7.0 6.9 7.1 7.4 9.0 5.8 34.2 39.8 28.7
—Not available.1In the previous 30 days.2In the previous 12 months.SOURCE: U.S. Department of Health and Human Services, Centers for Disease Control and Prevention, CDC Surveillance Summaries, Morbidity andMortality Weekly Report, 47(SS-05) and 51(SS-04).
Offered, sold, or givenan illegal drug2Cigarette use1 Alcohol use1 Marijuana use1
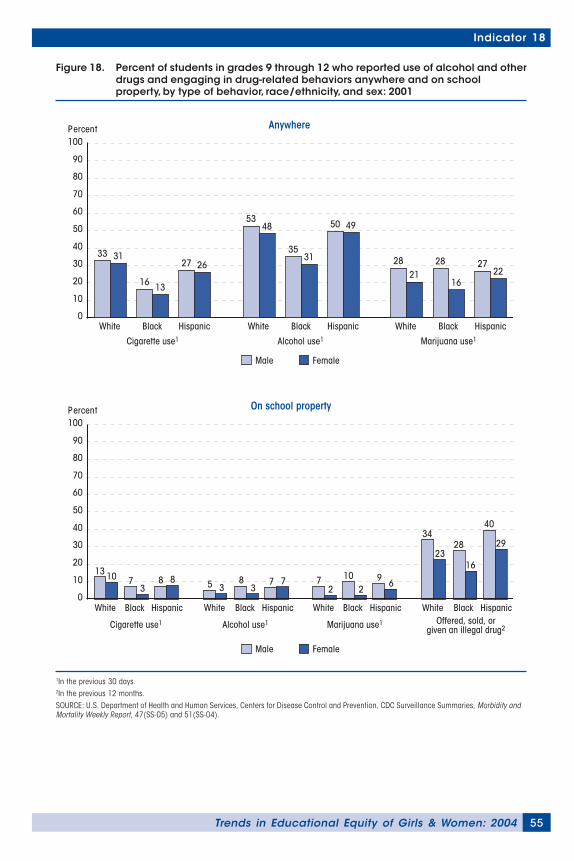
55Trends in Educational Equity of Girls & Women: 2004
Indicator 18
1In the previous 30 days.2In the previous 12 months.SOURCE: U.S. Department of Health and Human Services, Centers for Disease Control and Prevention, CDC Surveillance Summaries, Morbidity andMortality Weekly Report, 47(SS-05) and 51(SS-04).
Figure 18. Percent of students in grades 9 through 12 who reported use of alcohol and otherdrugs and engaging in drug-related behaviors anywhere and on schoolproperty, by type of behavior, race/ethnicity, and sex: 2001
Percent
Male Female
Cigarette use1 Alcohol use1 Marijuana use1
White
33 31
Black
16 13
Hispanic
27 26
White
5348
Black
3531
Hispanic
50 49
White
2821
Black
28
16
Hispanic
2722
0
10
20
30
40
50
60
70
80
90
100
Anywhere
White
13 10
Black
73
Hispanic
8 8
White
5 3
Black
83
Hispanic
7 7
White
72
Black
102
Hispanic
9 6
White
34
23
Black
28
16
Hispanic
40
29
Percent
Male Female
Cigarette use1 Alcohol use1 Marijuana use1 Offered, sold, or given an illegal drug2
0
10
20
30
40
50
60
70
80
90
100
On school property
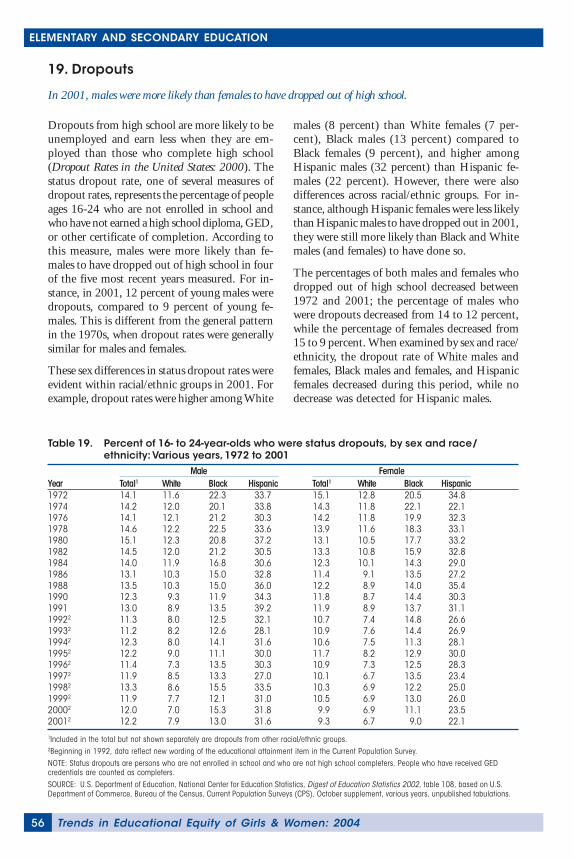
Trends in Educational Equity of Girls & Women: 200456
ELEMENTARY AND SECONDARY EDUCATION
19. Dropouts
In 2001, males were more likely than females to have dropped out of high school.
Dropouts from high school are more likely to beunemployed and earn less when they are em-ployed than those who complete high school(Dropout Rates in the United States: 2000). Thestatus dropout rate, one of several measures ofdropout rates, represents the percentage of peopleages 16-24 who are not enrolled in school andwho have not earned a high school diploma, GED,or other certificate of completion. According tothis measure, males were more likely than fe-males to have dropped out of high school in fourof the five most recent years measured. For in-stance, in 2001, 12 percent of young males weredropouts, compared to 9 percent of young fe-males. This is different from the general patternin the 1970s, when dropout rates were generallysimilar for males and females.
These sex differences in status dropout rates wereevident within racial/ethnic groups in 2001. Forexample, dropout rates were higher among White
males (8 percent) than White females (7 per-cent), Black males (13 percent) compared toBlack females (9 percent), and higher amongHispanic males (32 percent) than Hispanic fe-males (22 percent). However, there were alsodifferences across racial/ethnic groups. For in-stance, although Hispanic females were less likelythan Hispanic males to have dropped out in 2001,they were still more likely than Black and Whitemales (and females) to have done so.
The percentages of both males and females whodropped out of high school decreased between1972 and 2001; the percentage of males whowere dropouts decreased from 14 to 12 percent,while the percentage of females decreased from15 to 9 percent. When examined by sex and race/ethnicity, the dropout rate of White males andfemales, Black males and females, and Hispanicfemales decreased during this period, while nodecrease was detected for Hispanic males.
Table 19. Percent of 16- to 24-year-olds who were status dropouts, by sex and race/ethnicity: Various years, 1972 to 2001
Year Total1 White Black Hispanic Total1 White Black Hispanic1972 14.1 11.6 22.3 33.7 15.1 12.8 20.5 34.81974 14.2 12.0 20.1 33.8 14.3 11.8 22.1 22.11976 14.1 12.1 21.2 30.3 14.2 11.8 19.9 32.31978 14.6 12.2 22.5 33.6 13.9 11.6 18.3 33.11980 15.1 12.3 20.8 37.2 13.1 10.5 17.7 33.21982 14.5 12.0 21.2 30.5 13.3 10.8 15.9 32.81984 14.0 11.9 16.8 30.6 12.3 10.1 14.3 29.01986 13.1 10.3 15.0 32.8 11.4 9.1 13.5 27.21988 13.5 10.3 15.0 36.0 12.2 8.9 14.0 35.41990 12.3 9.3 11.9 34.3 11.8 8.7 14.4 30.31991 13.0 8.9 13.5 39.2 11.9 8.9 13.7 31.119922 11.3 8.0 12.5 32.1 10.7 7.4 14.8 26.619932 11.2 8.2 12.6 28.1 10.9 7.6 14.4 26.919942 12.3 8.0 14.1 31.6 10.6 7.5 11.3 28.119952 12.2 9.0 11.1 30.0 11.7 8.2 12.9 30.019962 11.4 7.3 13.5 30.3 10.9 7.3 12.5 28.319972 11.9 8.5 13.3 27.0 10.1 6.7 13.5 23.419982 13.3 8.6 15.5 33.5 10.3 6.9 12.2 25.019992 11.9 7.7 12.1 31.0 10.5 6.9 13.0 26.020002 12.0 7.0 15.3 31.8 9.9 6.9 11.1 23.520012 12.2 7.9 13.0 31.6 9.3 6.7 9.0 22.1
1Included in the total but not shown separately are dropouts from other racial/ethnic groups.2Beginning in 1992, data reflect new wording of the educational attainment item in the Current Population Survey.NOTE: Status dropouts are persons who are not enrolled in school and who are not high school completers. People who have received GEDcredentials are counted as completers.SOURCE: U.S. Department of Education, National Center for Education Statistics, Digest of Education Statistics 2002, table 108, based on U.S.Department of Commerce, Bureau of the Census, Current Population Surveys (CPS), October supplement, various years, unpublished tabulations.
Male Female
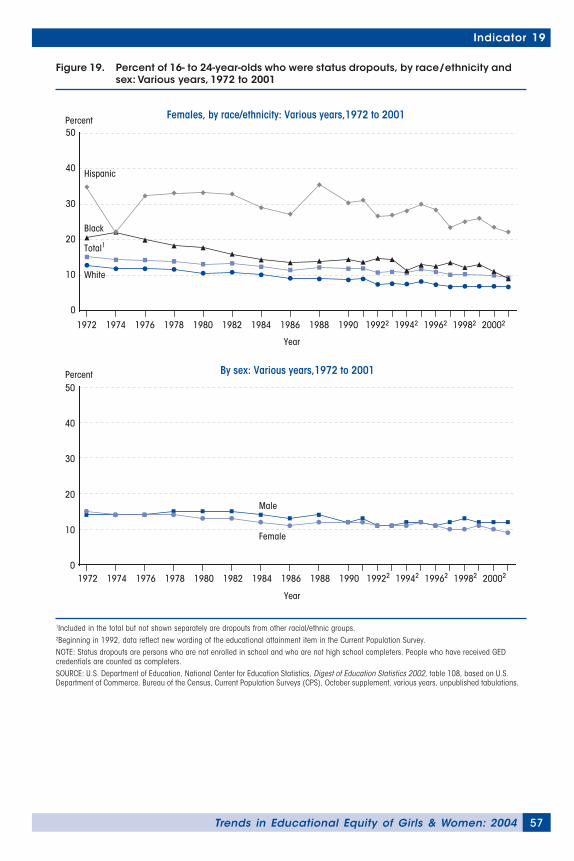
57Trends in Educational Equity of Girls & Women: 2004
Indicator 19
1Included in the total but not shown separately are dropouts from other racial/ethnic groups.2Beginning in 1992, data reflect new wording of the educational attainment item in the Current Population Survey.NOTE: Status dropouts are persons who are not enrolled in school and who are not high school completers. People who have received GEDcredentials are counted as completers.SOURCE: U.S. Department of Education, National Center for Education Statistics, Digest of Education Statistics 2002, table 108, based on U.S.Department of Commerce, Bureau of the Census, Current Population Surveys (CPS), October supplement, various years, unpublished tabulations.
Figure 19. Percent of 16- to 24-year-olds who were status dropouts, by race/ethnicity andsex: Various years, 1972 to 2001
0
10
20
30
40
50Percent By sex: Various years,1972 to 2001
Male
Female
1972 1974 1976 1978 1980 1982 1984 1986 1988 1990 19922 19942 19962 19982 20002
Year
Year
Percent Females, by race/ethnicity: Various years,1972 to 2001
Black
White
Total1
Hispanic
1972 1974 1976 1978 1980 1982 1984 1986 1988 1990 19922 19942 19962 19982 20002
0
10
20
30
40
50
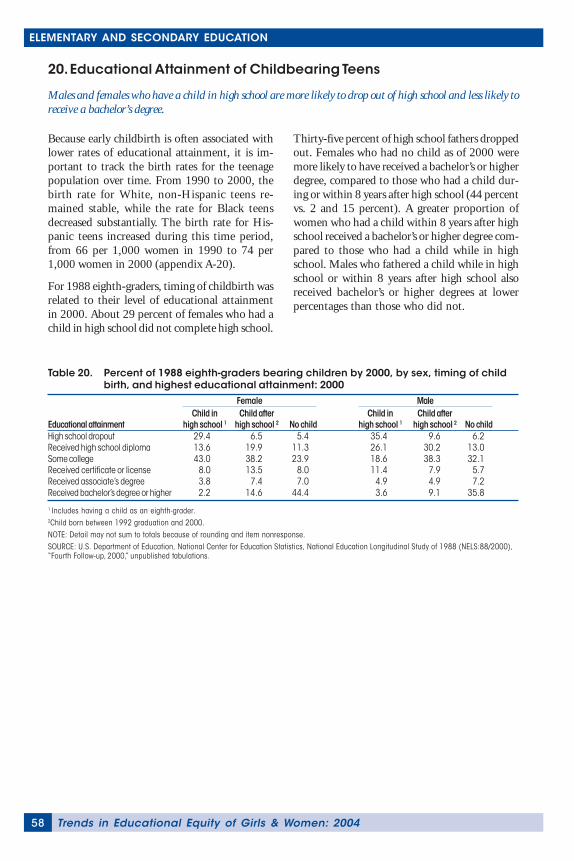
Trends in Educational Equity of Girls & Women: 200458
ELEMENTARY AND SECONDARY EDUCATION
20. Educational Attainment of Childbearing Teens
Males and females who have a child in high school are more likely to drop out of high school and less likely toreceive a bachelor’s degree.
Because early childbirth is often associated withlower rates of educational attainment, it is im-portant to track the birth rates for the teenagepopulation over time. From 1990 to 2000, thebirth rate for White, non-Hispanic teens re-mained stable, while the rate for Black teensdecreased substantially. The birth rate for His-panic teens increased during this time period,from 66 per 1,000 women in 1990 to 74 per1,000 women in 2000 (appendix A-20).
For 1988 eighth-graders, timing of childbirth wasrelated to their level of educational attainmentin 2000. About 29 percent of females who had achild in high school did not complete high school.
Thirty-five percent of high school fathers droppedout. Females who had no child as of 2000 weremore likely to have received a bachelor’s or higherdegree, compared to those who had a child dur-ing or within 8 years after high school (44 percentvs. 2 and 15 percent). A greater proportion ofwomen who had a child within 8 years after highschool received a bachelor’s or higher degree com-pared to those who had a child while in highschool. Males who fathered a child while in highschool or within 8 years after high school alsoreceived bachelor’s or higher degrees at lowerpercentages than those who did not.
Table 20. Percent of 1988 eighth-graders bearing children by 2000, by sex, timing of childbirth, and highest educational attainment: 2000
Child in Child after Child in Child afterEducational attainment high school 1 high school 2 No child high school 1 high school 2 No childHigh school dropout 29.4 6.5 5.4 35.4 9.6 6.2Received high school diploma 13.6 19.9 11.3 26.1 30.2 13.0Some college 43.0 38.2 23.9 18.6 38.3 32.1Received certificate or license 8.0 13.5 8.0 11.4 7.9 5.7Received associate’s degree 3.8 7.4 7.0 4.9 4.9 7.2Received bachelor’s degree or higher 2.2 14.6 44.4 3.6 9.1 35.8
1 Includes having a child as an eighth-grader.2Child born between 1992 graduation and 2000.NOTE: Detail may not sum to totals because of rounding and item nonresponse.SOURCE: U.S. Department of Education, National Center for Education Statistics, National Education Longitudinal Study of 1988 (NELS:88/2000),“Fourth Follow-up, 2000,” unpublished tabulations.
Female Male
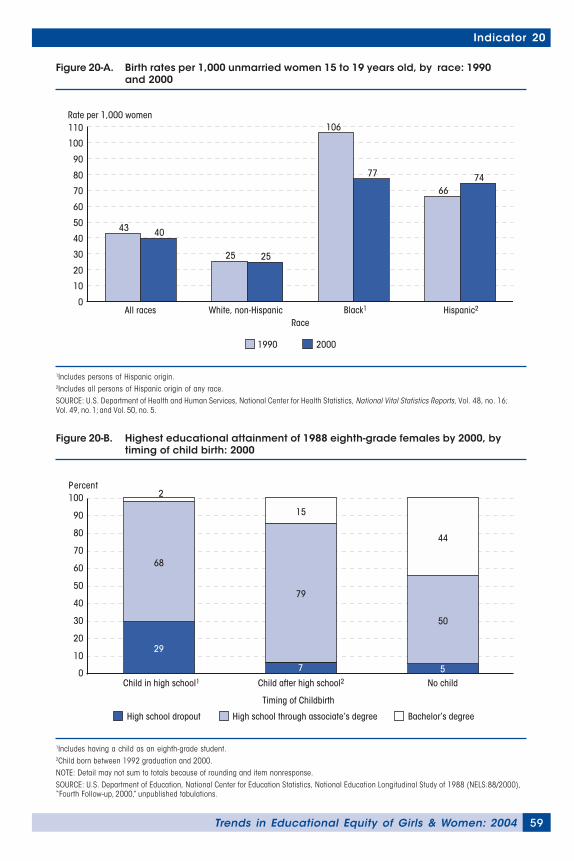
59Trends in Educational Equity of Girls & Women: 2004
Indicator 20
1Includes persons of Hispanic origin.2Includes all persons of Hispanic origin of any race.SOURCE: U.S. Department of Health and Human Services, National Center for Health Statistics, National Vital Statistics Reports, Vol. 48, no. 16;Vol. 49, no. 1; and Vol. 50, no. 5.
Figure 20-A. Birth rates per 1,000 unmarried women 15 to 19 years old, by race: 1990and 2000
Rate per 1,000 women
1990 2000
RaceAll races White, non-Hispanic Hispanic2Black1
0
10
20
30
40
50
60
70
80
90
100
110
43 40
25 25
106
77
6674
Figure 20-B. Highest educational attainment of 1988 eighth-grade females by 2000, bytiming of child birth: 2000
1Includes having a child as an eighth-grade student.2Child born between 1992 graduation and 2000.NOTE: Detail may not sum to totals because of rounding and item nonresponse.SOURCE: U.S. Department of Education, National Center for Education Statistics, National Education Longitudinal Study of 1988 (NELS:88/2000),“Fourth Follow-up, 2000,” unpublished tabulations.
Percent
Bachelor’s degreeHigh school through associate’s degreeHigh school dropout
0
10
20
30
40
50
60
70
80
90
100
Child in high school1 Child after high school2
Timing of Childbirth
No child
29
68
2
7
79
15
5
50
44
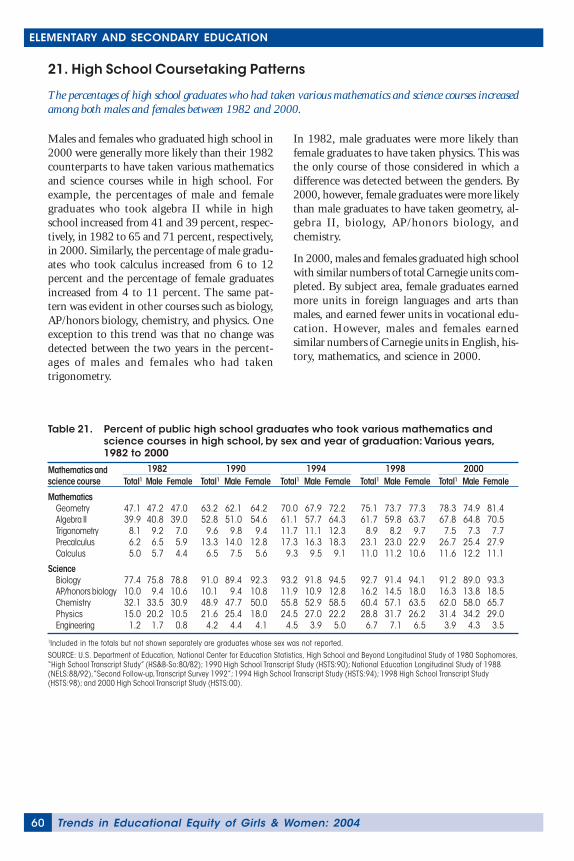
Trends in Educational Equity of Girls & Women: 200460
ELEMENTARY AND SECONDARY EDUCATION
21. High School Coursetaking Patterns
The percentages of high school graduates who had taken various mathematics and science courses increasedamong both males and females between 1982 and 2000.
Males and females who graduated high school in2000 were generally more likely than their 1982counterparts to have taken various mathematicsand science courses while in high school. Forexample, the percentages of male and femalegraduates who took algebra II while in highschool increased from 41 and 39 percent, respec-tively, in 1982 to 65 and 71 percent, respectively,in 2000. Similarly, the percentage of male gradu-ates who took calculus increased from 6 to 12percent and the percentage of female graduatesincreased from 4 to 11 percent. The same pat-tern was evident in other courses such as biology,AP/honors biology, chemistry, and physics. Oneexception to this trend was that no change wasdetected between the two years in the percent-ages of males and females who had takentrigonometry.
In 1982, male graduates were more likely thanfemale graduates to have taken physics. This wasthe only course of those considered in which adifference was detected between the genders. By2000, however, female graduates were more likelythan male graduates to have taken geometry, al-gebra II, biology, AP/honors biology, andchemistry.
In 2000, males and females graduated high schoolwith similar numbers of total Carnegie units com-pleted. By subject area, female graduates earnedmore units in foreign languages and arts thanmales, and earned fewer units in vocational edu-cation. However, males and females earnedsimilar numbers of Carnegie units in English, his-tory, mathematics, and science in 2000.
Table 21. Percent of public high school graduates who took various mathematics andscience courses in high school, by sex and year of graduation: Various years,1982 to 2000
Mathematics andscience course Total1 Male Female Total1 Male Female Total1 Male Female Total1 Male Female Total1 Male Female
MathematicsGeometry 47.1 47.2 47.0 63.2 62.1 64.2 70.0 67.9 72.2 75.1 73.7 77.3 78.3 74.9 81.4Algebra II 39.9 40.8 39.0 52.8 51.0 54.6 61.1 57.7 64.3 61.7 59.8 63.7 67.8 64.8 70.5Trigonometry 8.1 9.2 7.0 9.6 9.8 9.4 11.7 11.1 12.3 8.9 8.2 9.7 7.5 7.3 7.7Precalculus 6.2 6.5 5.9 13.3 14.0 12.8 17.3 16.3 18.3 23.1 23.0 22.9 26.7 25.4 27.9Calculus 5.0 5.7 4.4 6.5 7.5 5.6 9.3 9.5 9.1 11.0 11.2 10.6 11.6 12.2 11.1
ScienceBiology 77.4 75.8 78.8 91.0 89.4 92.3 93.2 91.8 94.5 92.7 91.4 94.1 91.2 89.0 93.3AP/honors biology 10.0 9.4 10.6 10.1 9.4 10.8 11.9 10.9 12.8 16.2 14.5 18.0 16.3 13.8 18.5Chemistry 32.1 33.5 30.9 48.9 47.7 50.0 55.8 52.9 58.5 60.4 57.1 63.5 62.0 58.0 65.7Physics 15.0 20.2 10.5 21.6 25.4 18.0 24.5 27.0 22.2 28.8 31.7 26.2 31.4 34.2 29.0Engineering 1.2 1.7 0.8 4.2 4.4 4.1 4.5 3.9 5.0 6.7 7.1 6.5 3.9 4.3 3.5
1Included in the totals but not shown separately are graduates whose sex was not reported.SOURCE: U.S. Department of Education, National Center for Education Statistics, High School and Beyond Longitudinal Study of 1980 Sophomores,“High School Transcript Study” (HS&B-So:80/82); 1990 High School Transcript Study (HSTS:90); National Education Longitudinal Study of 1988(NELS:88/92), “Second Follow-up, Transcript Survey 1992”; 1994 High School Transcript Study (HSTS:94); 1998 High School Transcript Study(HSTS:98); and 2000 High School Transcript Study (HSTS:00).
1982 1990 1994 1998 2000
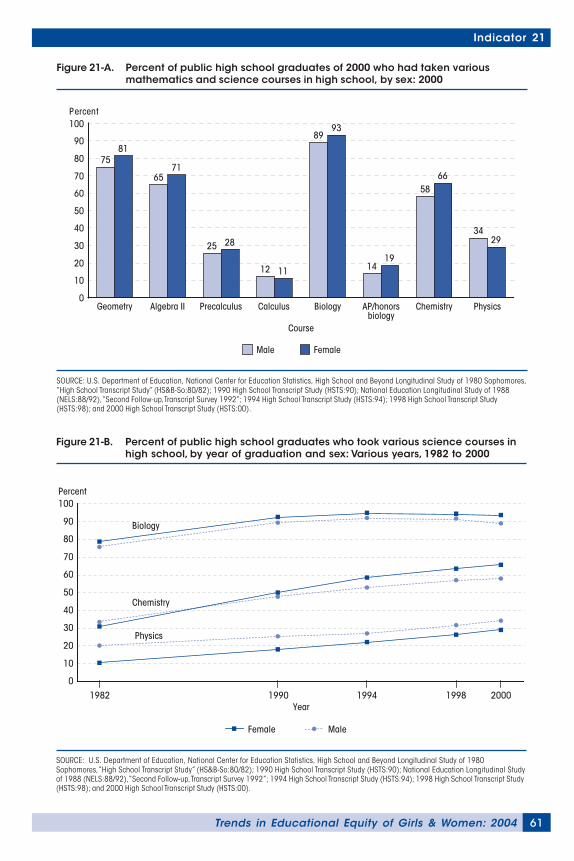
61Trends in Educational Equity of Girls & Women: 2004
Indicator 21
Figure 21-A. Percent of public high school graduates of 2000 who had taken variousmathematics and science courses in high school, by sex: 2000
SOURCE: U.S. Department of Education, National Center for Education Statistics, High School and Beyond Longitudinal Study of 1980 Sophomores,“High School Transcript Study” (HS&B-So:80/82); 1990 High School Transcript Study (HSTS:90); National Education Longitudinal Study of 1988(NELS:88/92), “Second Follow-up, Transcript Survey 1992”; 1994 High School Transcript Study (HSTS:94); 1998 High School Transcript Study(HSTS:98); and 2000 High School Transcript Study (HSTS:00).
Figure 21-B. Percent of public high school graduates who took various science courses inhigh school, by year of graduation and sex: Various years, 1982 to 2000
SOURCE: U.S. Department of Education, National Center for Education Statistics, High School and Beyond Longitudinal Study of 1980Sophomores, “High School Transcript Study” (HS&B-So:80/82); 1990 High School Transcript Study (HSTS:90); National Education Longitudinal Studyof 1988 (NELS:88/92), “Second Follow-up, Transcript Survey 1992”; 1994 High School Transcript Study (HSTS:94); 1998 High School Transcript Study(HSTS:98); and 2000 High School Transcript Study (HSTS:00).
1982 1990 1994 1998 20000
10
20
30
40
50
60
70
80
90
100
MaleFemale
Year
Physics
Chemistry
Biology
Percent
Male Female
Percent
Course
Geometry Algebra II Precalculus Calculus Biology AP/honors biology
Chemistry Physics
7581
6571
25 28
12 11
8993
1419
5866
3429
0
10
20
30
40
50
60
70
80
90
100
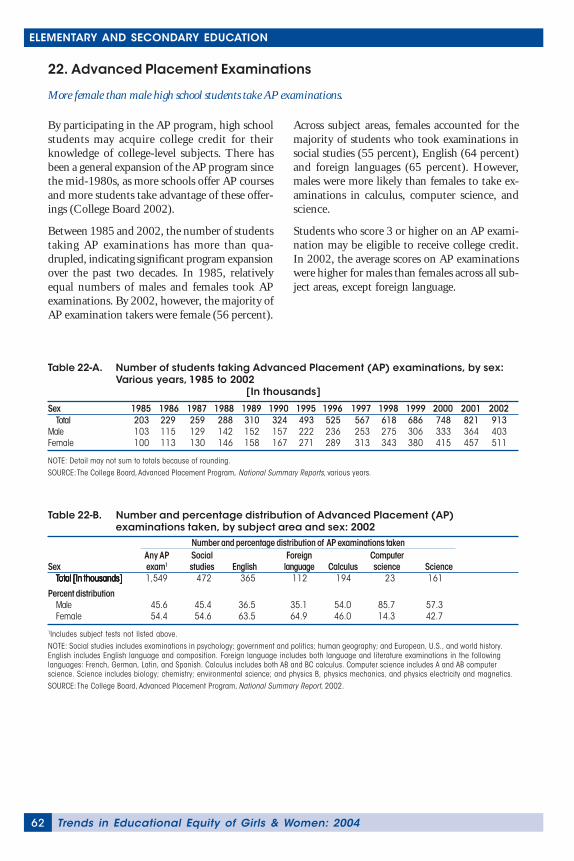
Trends in Educational Equity of Girls & Women: 200462
ELEMENTARY AND SECONDARY EDUCATION
22. Advanced Placement Examinations
More female than male high school students take AP examinations.
By participating in the AP program, high schoolstudents may acquire college credit for theirknowledge of college-level subjects. There hasbeen a general expansion of the AP program sincethe mid-1980s, as more schools offer AP coursesand more students take advantage of these offer-ings (College Board 2002).
Between 1985 and 2002, the number of studentstaking AP examinations has more than qua-drupled, indicating significant program expansionover the past two decades. In 1985, relativelyequal numbers of males and females took APexaminations. By 2002, however, the majority ofAP examination takers were female (56 percent).
Across subject areas, females accounted for themajority of students who took examinations insocial studies (55 percent), English (64 percent)and foreign languages (65 percent). However,males were more likely than females to take ex-aminations in calculus, computer science, andscience.
Students who score 3 or higher on an AP exami-nation may be eligible to receive college credit.In 2002, the average scores on AP examinationswere higher for males than females across all sub-ject areas, except foreign language.
Table 22-A. Number of students taking Advanced Placement (AP) examinations, by sex:Various years, 1985 to 2002
[In thousands]
Sex 1985 1986 1987 1988 1989 1990 1995 1996 1997 1998 1999 2000 2001 2002Total 203 229 259 288 310 324 493 525 567 618 686 748 821 913
Male 103 115 129 142 152 157 222 236 253 275 306 333 364 403Female 100 113 130 146 158 167 271 289 313 343 380 415 457 511
NOTE: Detail may not sum to totals because of rounding.SOURCE: The College Board, Advanced Placement Program, National Summary Reports, various years.
Table 22-B. Number and percentage distribution of Advanced Placement (AP)examinations taken, by subject area and sex: 2002
Any AP Social Foreign ComputerSex exam1 studies English language Calculus science Science
TTTTTotototototal [In thousands]al [In thousands]al [In thousands]al [In thousands]al [In thousands] 1,549 472 365 112 194 23 161
Percent distributionMale 45.6 45.4 36.5 35.1 54.0 85.7 57.3Female 54.4 54.6 63.5 64.9 46.0 14.3 42.7
1Includes subject tests not listed above.NOTE: Social studies includes examinations in psychology; government and politics; human geography; and European, U.S., and world history.English includes English language and composition. Foreign language includes both language and literature examinations in the followinglanguages: French, German, Latin, and Spanish. Calculus includes both AB and BC calculus. Computer science includes A and AB computerscience. Science includes biology; chemistry; environmental science; and physics B, physics mechanics, and physics electricity and magnetics.SOURCE: The College Board, Advanced Placement Program, National Summary Report, 2002.
Number and percentage distribution of AP examinations taken
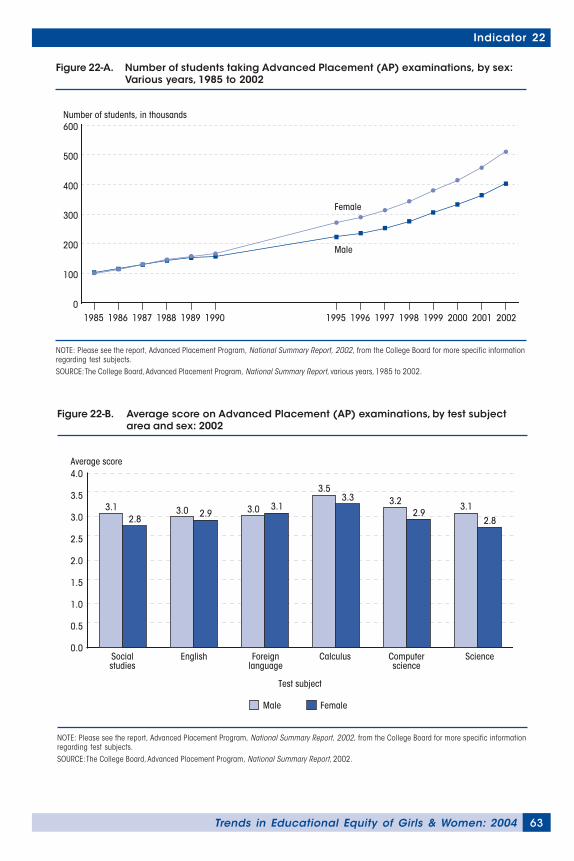
63Trends in Educational Equity of Girls & Women: 2004
Indicator 22
Figure 22-A. Number of students taking Advanced Placement (AP) examinations, by sex:Various years, 1985 to 2002
NOTE: Please see the report, Advanced Placement Program, National Summary Report, 2002, from the College Board for more specific informationregarding test subjects.SOURCE: The College Board, Advanced Placement Program, National Summary Report, various years, 1985 to 2002.
NOTE: Please see the report, Advanced Placement Program, National Summary Report, 2002, from the College Board for more specific informationregarding test subjects.SOURCE: The College Board, Advanced Placement Program, National Summary Report, 2002.
Figure 22-B. Average score on Advanced Placement (AP) examinations, by test subjectarea and sex: 2002
Number of students, in thousands
0
100
200
300
400
500
600
Male
Female
1985 1986 1987 1988 1989 1990 1995 1996 1997 1998 1999 2000 2001 2002
Male Female
Average score
Test subject
Socialstudies
English Foreignlanguage
Calculus Computerscience
Science0.0
1.0
2.0
3.0
0.5
1.5
2.5
3.5
4.0
3.12.8
3.0 2.9 3.0 3.1
3.53.3 3.2
2.93.1
2.8

65Trends in Educational Equity of Girls & Women: 2004
POSTSECONDARY EDUCATION
23. College Plans
24. Transition to College
25. College Enrollment
26. College Athletics
27. Working While Enrolled in College
28. Persistence Toward and Completion of aBachelor’s Degree
29. Undergraduate Degrees
30. Undergraduate Degrees for Minority Females
31. Graduate Degrees
32. Adult Education
33. Educational Attainment
34. International Educational Attainment
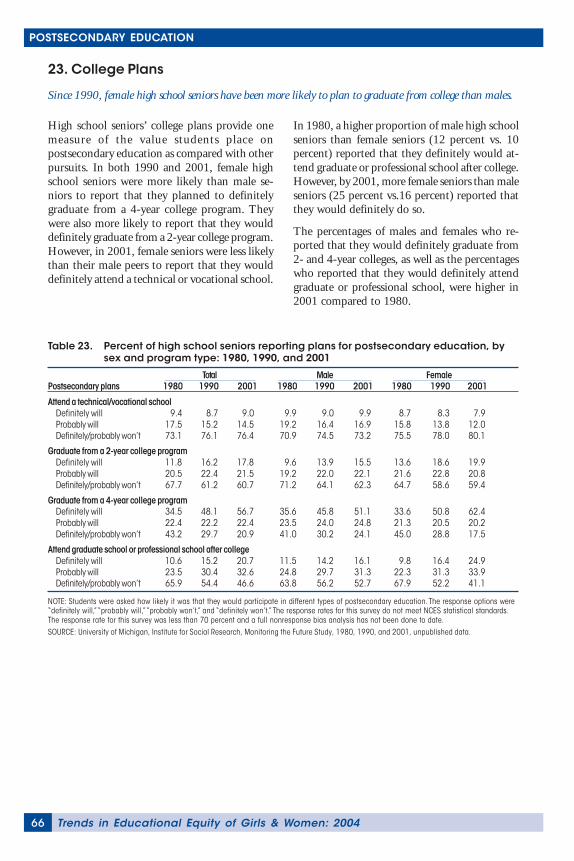
Trends in Educational Equity of Girls & Women: 200466
POSTSECONDARY EDUCATION
23. College Plans
Since 1990, female high school seniors have been more likely to plan to graduate from college than males.
High school seniors’ college plans provide onemeasure of the value students place onpostsecondary education as compared with otherpursuits. In both 1990 and 2001, female highschool seniors were more likely than male se-niors to report that they planned to definitelygraduate from a 4-year college program. Theywere also more likely to report that they woulddefinitely graduate from a 2-year college program.However, in 2001, female seniors were less likelythan their male peers to report that they woulddefinitely attend a technical or vocational school.
In 1980, a higher proportion of male high schoolseniors than female seniors (12 percent vs. 10percent) reported that they definitely would at-tend graduate or professional school after college.However, by 2001, more female seniors than maleseniors (25 percent vs.16 percent) reported thatthey would definitely do so.
The percentages of males and females who re-ported that they would definitely graduate from2- and 4-year colleges, as well as the percentageswho reported that they would definitely attendgraduate or professional school, were higher in2001 compared to 1980.
Table 23. Percent of high school seniors reporting plans for postsecondary education, bysex and program type: 1980, 1990, and 2001
Postsecondary plans 1980 1990 2001 1980 1990 2001 1980 1990 2001
Attend a technical/vocational schoolDefinitely will 9.4 8.7 9.0 9.9 9.0 9.9 8.7 8.3 7.9Probably will 17.5 15.2 14.5 19.2 16.4 16.9 15.8 13.8 12.0Definitely/probably won’t 73.1 76.1 76.4 70.9 74.5 73.2 75.5 78.0 80.1
Graduate from a 2-year college programDefinitely will 11.8 16.2 17.8 9.6 13.9 15.5 13.6 18.6 19.9Probably will 20.5 22.4 21.5 19.2 22.0 22.1 21.6 22.8 20.8Definitely/probably won’t 67.7 61.2 60.7 71.2 64.1 62.3 64.7 58.6 59.4
Graduate from a 4-year college programDefinitely will 34.5 48.1 56.7 35.6 45.8 51.1 33.6 50.8 62.4Probably will 22.4 22.2 22.4 23.5 24.0 24.8 21.3 20.5 20.2Definitely/probably won’t 43.2 29.7 20.9 41.0 30.2 24.1 45.0 28.8 17.5
Attend graduate school or professional school after collegeDefinitely will 10.6 15.2 20.7 11.5 14.2 16.1 9.8 16.4 24.9Probably will 23.5 30.4 32.6 24.8 29.7 31.3 22.3 31.3 33.9Definitely/probably won’t 65.9 54.4 46.6 63.8 56.2 52.7 67.9 52.2 41.1
NOTE: Students were asked how likely it was that they would participate in different types of postsecondary education. The response options were“definitely will,” “probably will,” “probably won’t,” and “definitely won’t.” The response rates for this survey do not meet NCES statistical standards.The response rate for this survey was less than 70 percent and a full nonresponse bias analysis has not been done to date.SOURCE: University of Michigan, Institute for Social Research, Monitoring the Future Study, 1980, 1990, and 2001, unpublished data.
FemaleTotal Male
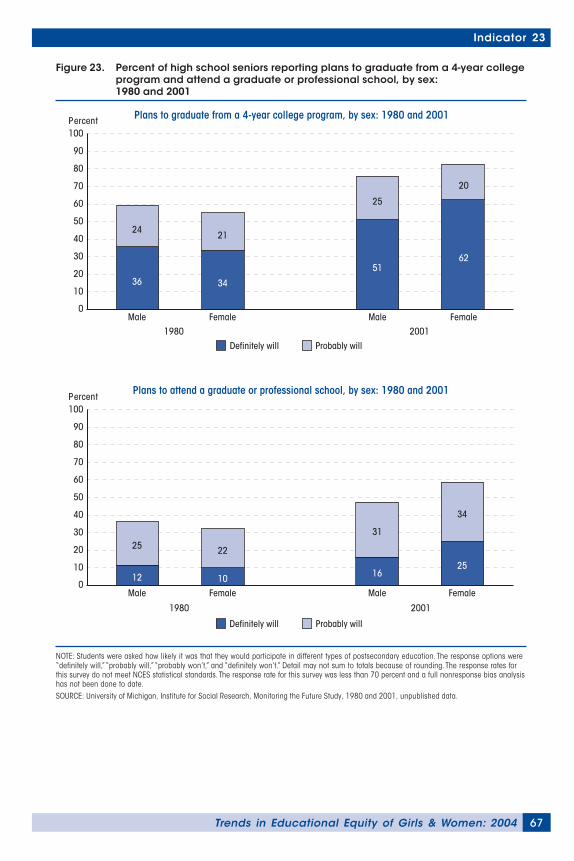
67Trends in Educational Equity of Girls & Women: 2004
Indicator 23
NOTE: Students were asked how likely it was that they would participate in different types of postsecondary education. The response options were“definitely will,” “probably will,” “probably won’t,” and “definitely won’t.” Detail may not sum to totals because of rounding. The response rates forthis survey do not meet NCES statistical standards. The response rate for this survey was less than 70 percent and a full nonresponse bias analysishas not been done to date.SOURCE: University of Michigan, Institute for Social Research, Monitoring the Future Study, 1980 and 2001, unpublished data.
Figure 23. Percent of high school seniors reporting plans to graduate from a 4-year collegeprogram and attend a graduate or professional school, by sex:1980 and 2001
Percent Plans to graduate from a 4-year college program, by sex: 1980 and 2001
Probably willDefinitely will
1980 2001Male Female Male Female
0
10
20
30
40
50
60
70
80
90
100
36
24
34
21
51
25
62
20
Percent
Probably willDefinitely will
1980 2001
Male Female Male Female0
10
20
30
40
50
60
70
80
90
100
12
25
10
22
16
31
25
34
Plans to attend a graduate or professional school, by sex: 1980 and 2001
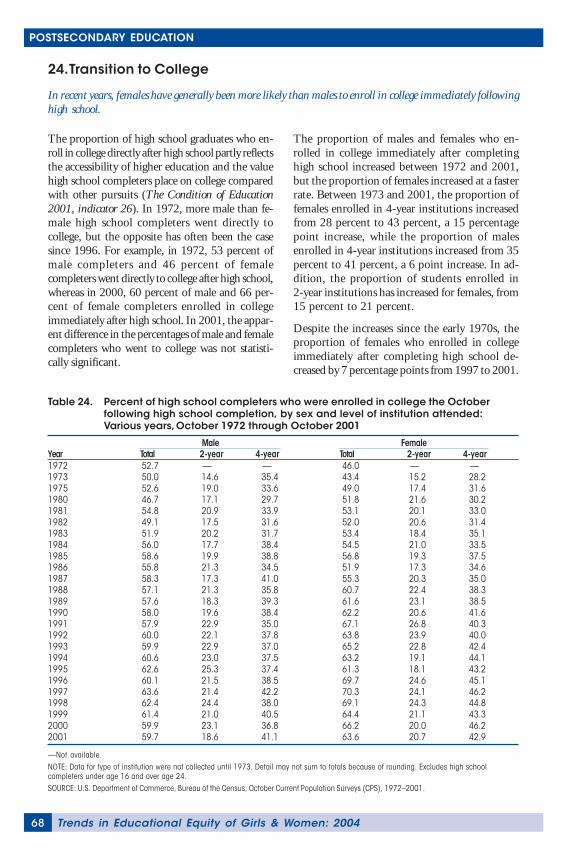
Trends in Educational Equity of Girls & Women: 200468
POSTSECONDARY EDUCATION
24. Transition to College
In recent years, females have generally been more likely than males to enroll in college immediately followinghigh school.
The proportion of high school graduates who en-roll in college directly after high school partly reflectsthe accessibility of higher education and the valuehigh school completers place on college comparedwith other pursuits (The Condition of Education2001, indicator 26). In 1972, more male than fe-male high school completers went directly tocollege, but the opposite has often been the casesince 1996. For example, in 1972, 53 percent ofmale completers and 46 percent of femalecompleters went directly to college after high school,whereas in 2000, 60 percent of male and 66 per-cent of female completers enrolled in collegeimmediately after high school. In 2001, the appar-ent difference in the percentages of male and femalecompleters who went to college was not statisti-cally significant.
The proportion of males and females who en-rolled in college immediately after completinghigh school increased between 1972 and 2001,but the proportion of females increased at a fasterrate. Between 1973 and 2001, the proportion offemales enrolled in 4-year institutions increasedfrom 28 percent to 43 percent, a 15 percentagepoint increase, while the proportion of malesenrolled in 4-year institutions increased from 35percent to 41 percent, a 6 point increase. In ad-dition, the proportion of students enrolled in2-year institutions has increased for females, from15 percent to 21 percent.
Despite the increases since the early 1970s, theproportion of females who enrolled in collegeimmediately after completing high school de-creased by 7 percentage points from 1997 to 2001.
Table 24. Percent of high school completers who were enrolled in college the Octoberfollowing high school completion, by sex and level of institution attended:Various years, October 1972 through October 2001
Year Total 2-year 4-year Total 2-year 4-year1972 52.7 — — 46.0 — —1973 50.0 14.6 35.4 43.4 15.2 28.21975 52.6 19.0 33.6 49.0 17.4 31.61980 46.7 17.1 29.7 51.8 21.6 30.21981 54.8 20.9 33.9 53.1 20.1 33.01982 49.1 17.5 31.6 52.0 20.6 31.41983 51.9 20.2 31.7 53.4 18.4 35.11984 56.0 17.7 38.4 54.5 21.0 33.51985 58.6 19.9 38.8 56.8 19.3 37.51986 55.8 21.3 34.5 51.9 17.3 34.61987 58.3 17.3 41.0 55.3 20.3 35.01988 57.1 21.3 35.8 60.7 22.4 38.31989 57.6 18.3 39.3 61.6 23.1 38.51990 58.0 19.6 38.4 62.2 20.6 41.61991 57.9 22.9 35.0 67.1 26.8 40.31992 60.0 22.1 37.8 63.8 23.9 40.01993 59.9 22.9 37.0 65.2 22.8 42.41994 60.6 23.0 37.5 63.2 19.1 44.11995 62.6 25.3 37.4 61.3 18.1 43.21996 60.1 21.5 38.5 69.7 24.6 45.11997 63.6 21.4 42.2 70.3 24.1 46.21998 62.4 24.4 38.0 69.1 24.3 44.81999 61.4 21.0 40.5 64.4 21.1 43.32000 59.9 23.1 36.8 66.2 20.0 46.22001 59.7 18.6 41.1 63.6 20.7 42.9
—Not available.NOTE: Data for type of institution were not collected until 1973. Detail may not sum to totals because of rounding. Excludes high schoolcompleters under age 16 and over age 24.SOURCE: U.S. Department of Commerce, Bureau of the Census, October Current Population Surveys (CPS), 1972–2001.
Female Male
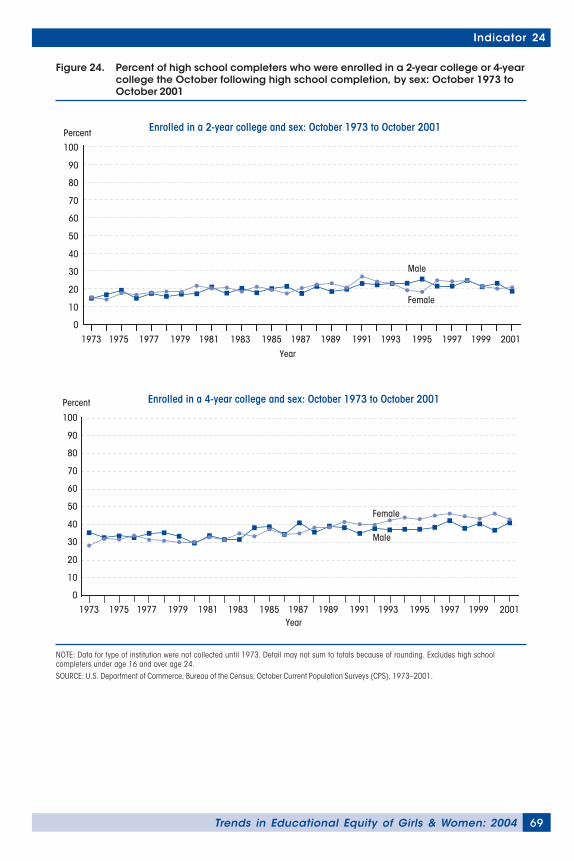
69Trends in Educational Equity of Girls & Women: 2004
Indicator 24
NOTE: Data for type of institution were not collected until 1973. Detail may not sum to totals because of rounding. Excludes high schoolcompleters under age 16 and over age 24.SOURCE: U.S. Department of Commerce, Bureau of the Census, October Current Population Surveys (CPS), 1973–2001.
Figure 24. Percent of high school completers who were enrolled in a 2-year college or 4-yearcollege the October following high school completion, by sex: October 1973 toOctober 2001
Percent
Female
Male
Year1973 1975 1977 1979 1981 1983 1985 1987 1989 1991 1993 1995 1997 1999 2001
Enrolled in a 4-year college and sex: October 1973 to October 2001
0
10
20
30
40
50
60
70
80
90
100
Percent Enrolled in a 2-year college and sex: October 1973 to October 2001
Female
Male
Year
1973 1975 1977 1979 1981 1983 1985 1987 1989 1991 1993 1995 1997 1999 2001
0
10
20
30
40
50
60
70
80
90
100
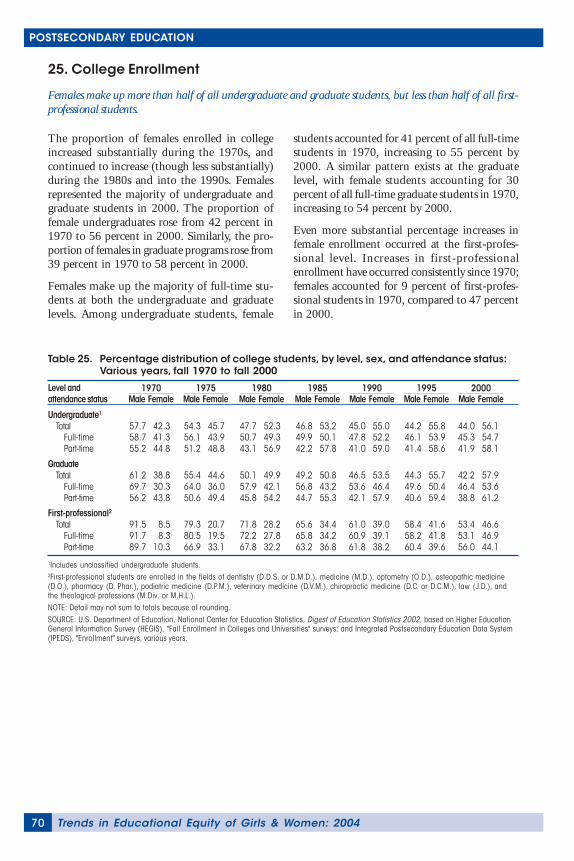
Trends in Educational Equity of Girls & Women: 200470
POSTSECONDARY EDUCATION
25. College Enrollment
Females make up more than half of all undergraduate and graduate students, but less than half of all first-professional students.
The proportion of females enrolled in collegeincreased substantially during the 1970s, andcontinued to increase (though less substantially)during the 1980s and into the 1990s. Femalesrepresented the majority of undergraduate andgraduate students in 2000. The proportion offemale undergraduates rose from 42 percent in1970 to 56 percent in 2000. Similarly, the pro-portion of females in graduate programs rose from39 percent in 1970 to 58 percent in 2000.
Females make up the majority of full-time stu-dents at both the undergraduate and graduatelevels. Among undergraduate students, female
students accounted for 41 percent of all full-timestudents in 1970, increasing to 55 percent by2000. A similar pattern exists at the graduatelevel, with female students accounting for 30percent of all full-time graduate students in 1970,increasing to 54 percent by 2000.
Even more substantial percentage increases infemale enrollment occurred at the first-profes-sional level. Increases in first-professionalenrollment have occurred consistently since 1970;females accounted for 9 percent of first-profes-sional students in 1970, compared to 47 percentin 2000.
Table 25. Percentage distribution of college students, by level, sex, and attendance status:Various years, fall 1970 to fall 2000
Level andattendance status Male Female Male Female Male Female Male Female Male Female Male Female Male Female
Undergraduate1
Total 57.7 42.3 54.3 45.7 47.7 52.3 46.8 53.2 45.0 55.0 44.2 55.8 44.0 56.1Full-time 58.7 41.3 56.1 43.9 50.7 49.3 49.9 50.1 47.8 52.2 46.1 53.9 45.3 54.7Part-time 55.2 44.8 51.2 48.8 43.1 56.9 42.2 57.8 41.0 59.0 41.4 58.6 41.9 58.1
GraduateTotal 61.2 38.8 55.4 44.6 50.1 49.9 49.2 50.8 46.5 53.5 44.3 55.7 42.2 57.9
Full-time 69.7 30.3 64.0 36.0 57.9 42.1 56.8 43.2 53.6 46.4 49.6 50.4 46.4 53.6Part-time 56.2 43.8 50.6 49.4 45.8 54.2 44.7 55.3 42.1 57.9 40.6 59.4 38.8 61.2
First-professional2Total 91.5 8.5 79.3 20.7 71.8 28.2 65.6 34.4 61.0 39.0 58.4 41.6 53.4 46.6
Full-time 91.7 8.3 80.5 19.5 72.2 27.8 65.8 34.2 60.9 39.1 58.2 41.8 53.1 46.9Part-time 89.7 10.3 66.9 33.1 67.8 32.2 63.2 36.8 61.8 38.2 60.4 39.6 56.0 44.1
1Includes unclassified undergraduate students.2First-professional students are enrolled in the fields of dentistry (D.D.S. or D.M.D.), medicine (M.D.), optometry (O.D.), osteopathic medicine(D.O.), pharmacy (D. Phar.), podiatric medicine (D.P.M.), veterinary medicine (D.V.M.), chiropractic medicine (D.C. or D.C.M.), law (J.D.), andthe theological professions (M.Div. or M.H.L.).NOTE: Detail may not sum to totals because of rounding.SOURCE: U.S. Department of Education, National Center for Education Statistics, Digest of Education Statistics 2002, based on Higher EducationGeneral Information Survey (HEGIS), "Fall Enrollment in Colleges and Universities" surveys; and Integrated Postsecondary Education Data System(IPEDS), "Enrollment" surveys, various years.
1970 1975 1980 1985 1990 1995 2000
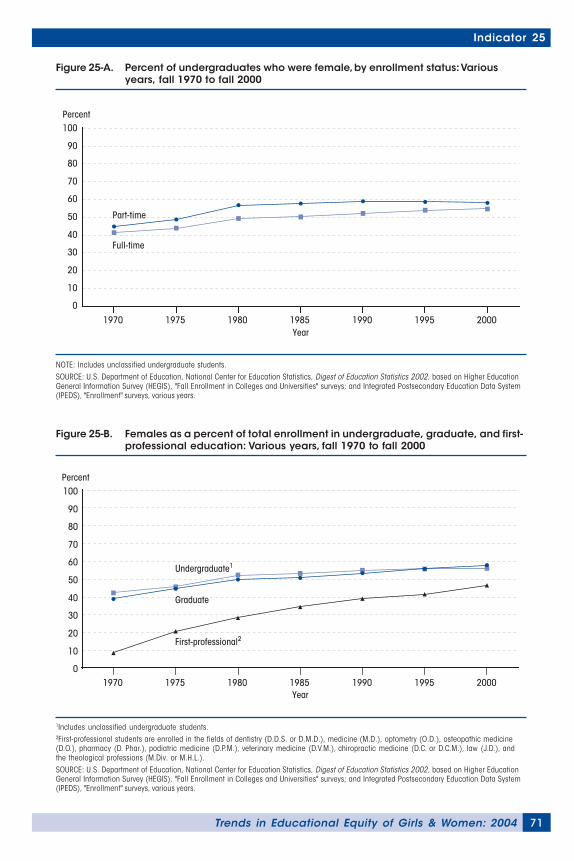
71Trends in Educational Equity of Girls & Women: 2004
Indicator 25
Figure 25-A. Percent of undergraduates who were female, by enrollment status: Variousyears, fall 1970 to fall 2000
NOTE: Includes unclassified undergraduate students.SOURCE: U.S. Department of Education, National Center for Education Statistics, Digest of Education Statistics 2002, based on Higher EducationGeneral Information Survey (HEGIS), "Fall Enrollment in Colleges and Universities" surveys; and Integrated Postsecondary Education Data System(IPEDS), "Enrollment" surveys, various years.
Percent
Part-time
Full-time
1970 1975 1980 1985 1990 1995 2000Year
0
10
20
30
40
50
60
70
80
90
100
Figure 25-B. Females as a percent of total enrollment in undergraduate, graduate, and first-professional education: Various years, fall 1970 to fall 2000
1Includes unclassified undergraduate students.2First-professional students are enrolled in the fields of dentistry (D.D.S. or D.M.D.), medicine (M.D.), optometry (O.D.), osteopathic medicine(D.O.), pharmacy (D. Phar.), podiatric medicine (D.P.M.), veterinary medicine (D.V.M.), chiropractic medicine (D.C. or D.C.M.), law (J.D.), andthe theological professions (M.Div. or M.H.L.).SOURCE: U.S. Department of Education, National Center for Education Statistics, Digest of Education Statistics 2002, based on Higher EducationGeneral Information Survey (HEGIS), "Fall Enrollment in Colleges and Universities" surveys; and Integrated Postsecondary Education Data System(IPEDS), "Enrollment" surveys, various years.
Year
Percent
First-professional2
Graduate
Undergraduate1
1970 1975 1980 1985 1990 1995 20000
10
20
30
40
50
60
70
80
90
100
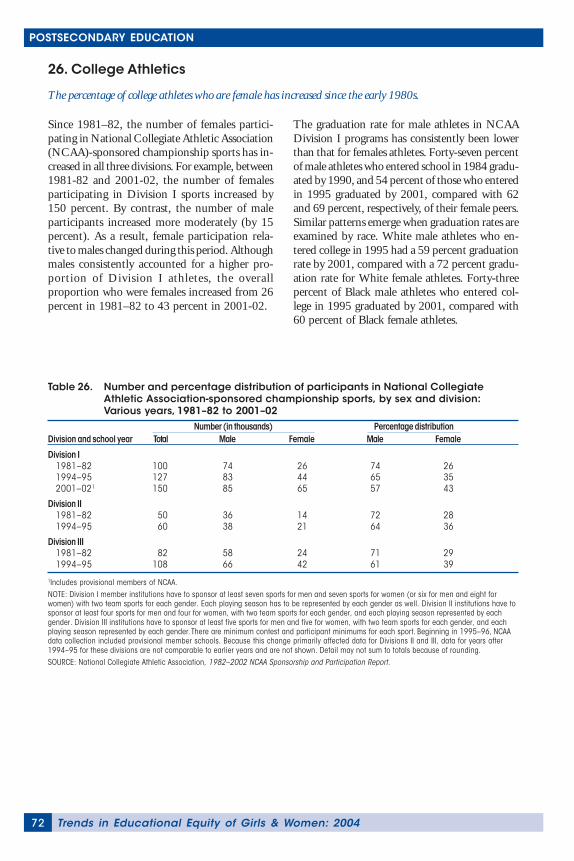
Trends in Educational Equity of Girls & Women: 200472
POSTSECONDARY EDUCATION
26. College Athletics
The percentage of college athletes who are female has increased since the early 1980s.
Since 1981–82, the number of females partici-pating in National Collegiate Athletic Association(NCAA)-sponsored championship sports has in-creased in all three divisions. For example, between1981-82 and 2001-02, the number of femalesparticipating in Division I sports increased by150 percent. By contrast, the number of maleparticipants increased more moderately (by 15percent). As a result, female participation rela-tive to males changed during this period. Althoughmales consistently accounted for a higher pro-portion of Division I athletes, the overallproportion who were females increased from 26percent in 1981–82 to 43 percent in 2001-02.
The graduation rate for male athletes in NCAADivision I programs has consistently been lowerthan that for females athletes. Forty-seven percentof male athletes who entered school in 1984 gradu-ated by 1990, and 54 percent of those who enteredin 1995 graduated by 2001, compared with 62and 69 percent, respectively, of their female peers.Similar patterns emerge when graduation rates areexamined by race. White male athletes who en-tered college in 1995 had a 59 percent graduationrate by 2001, compared with a 72 percent gradu-ation rate for White female athletes. Forty-threepercent of Black male athletes who entered col-lege in 1995 graduated by 2001, compared with60 percent of Black female athletes.
Table 26. Number and percentage distribution of participants in National CollegiateAthletic Association-sponsored championship sports, by sex and division:Various years, 1981–82 to 2001–02
Division and school year Total Male Female Male Female
Division I1981–82 100 74 26 74 261994–95 127 83 44 65 352001–021 150 85 65 57 43
Division II1981–82 50 36 14 72 281994–95 60 38 21 64 36
Division III1981–82 82 58 24 71 291994–95 108 66 42 61 39
1Includes provisional members of NCAA.NOTE: Division I member institutions have to sponsor at least seven sports for men and seven sports for women (or six for men and eight forwomen) with two team sports for each gender. Each playing season has to be represented by each gender as well. Division II institutions have tosponsor at least four sports for men and four for women, with two team sports for each gender, and each playing season represented by eachgender. Division III institutions have to sponsor at least five sports for men and five for women, with two team sports for each gender, and eachplaying season represented by each gender. There are minimum contest and participant minimums for each sport. Beginning in 1995–96, NCAAdata collection included provisional member schools. Because this change primarily affected data for Divisions II and III, data for years after1994–95 for these divisions are not comparable to earlier years and are not shown. Detail may not sum to totals because of rounding.SOURCE: National Collegiate Athletic Association, 1982–2002 NCAA Sponsorship and Participation Report.
Percentage distributionNumber (in thousands)
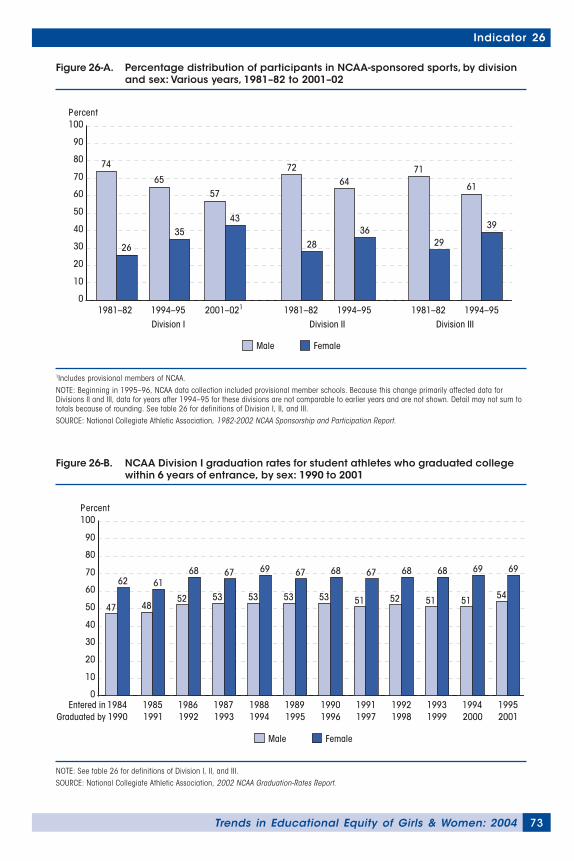
73Trends in Educational Equity of Girls & Women: 2004
Indicator 26
Figure 26-A. Percentage distribution of participants in NCAA-sponsored sports, by divisionand sex: Various years, 1981–82 to 2001–02
1Includes provisional members of NCAA.NOTE: Beginning in 1995–96, NCAA data collection included provisional member schools. Because this change primarily affected data forDivisions II and III, data for years after 1994–95 for these divisions are not comparable to earlier years and are not shown. Detail may not sum tototals because of rounding. See table 26 for definitions of Division I, II, and III.SOURCE: National Collegiate Athletic Association, 1982-2002 NCAA Sponsorship and Participation Report.
Percent
Male Female
Division I Division II Division III1981–82
74
26
1994–95
65
35
2001–021
57
43
1981–82
72
28
1994–95
64
36
1981–82
71
29
1994–95
61
39
0
10
20
30
40
50
60
70
80
90
100
Figure 26-B. NCAA Division I graduation rates for student athletes who graduated collegewithin 6 years of entrance, by sex: 1990 to 2001
NOTE: See table 26 for definitions of Division I, II, and III.SOURCE: National Collegiate Athletic Association, 2002 NCAA Graduation-Rates Report.
Percent
Male Female
0
10
20
30
40
50
60
70
80
90
100
Entered inGraduated by
1990 1991 1992 1993 1994 19951984 1985 1986 1987 1988 19891990 1991 1992 1993 1994 1995 1996 1997 1998 1999 2000 2001
47
62
48
61
52
68
53
67
53
69
53
67
53
68
51
67
52
68
51
68
51
69
54
69
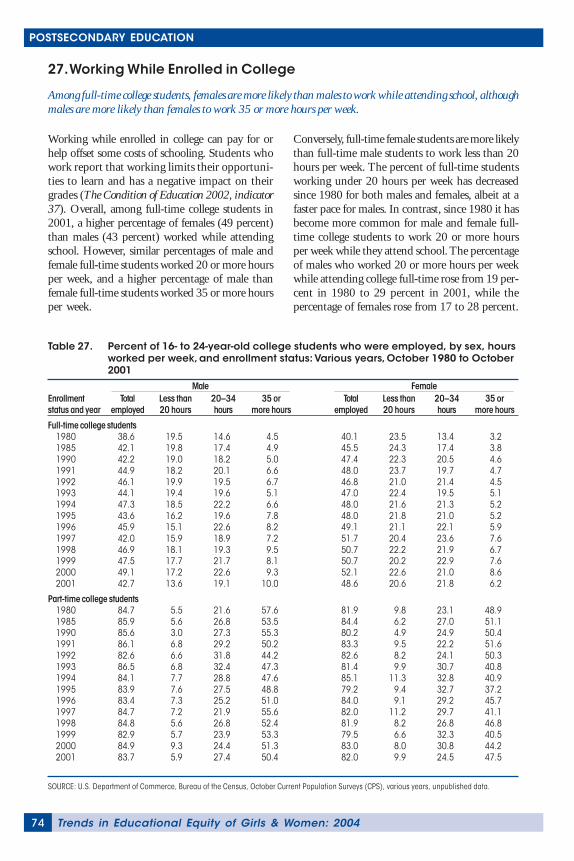
Trends in Educational Equity of Girls & Women: 200474
POSTSECONDARY EDUCATION
27. Working While Enrolled in College
Among full-time college students, females are more likely than males to work while attending school, althoughmales are more likely than females to work 35 or more hours per week.
Working while enrolled in college can pay for orhelp offset some costs of schooling. Students whowork report that working limits their opportuni-ties to learn and has a negative impact on theirgrades (The Condition of Education 2002, indicator37). Overall, among full-time college students in2001, a higher percentage of females (49 percent)than males (43 percent) worked while attendingschool. However, similar percentages of male andfemale full-time students worked 20 or more hoursper week, and a higher percentage of male thanfemale full-time students worked 35 or more hoursper week.
Conversely, full-time female students are more likelythan full-time male students to work less than 20hours per week. The percent of full-time studentsworking under 20 hours per week has decreasedsince 1980 for both males and females, albeit at afaster pace for males. In contrast, since 1980 it hasbecome more common for male and female full-time college students to work 20 or more hoursper week while they attend school. The percentageof males who worked 20 or more hours per weekwhile attending college full-time rose from 19 per-cent in 1980 to 29 percent in 2001, while thepercentage of females rose from 17 to 28 percent.
Table 27. Percent of 16- to 24-year-old college students who were employed, by sex, hoursworked per week, and enrollment status: Various years, October 1980 to October2001
Enrollment Total Less than 20–34 35 or Total Less than 20–34 35 orstatus and year employed 20 hours hours more hours employed 20 hours hours more hours
Full-time college students1980 38.6 19.5 14.6 4.5 40.1 23.5 13.4 3.21985 42.1 19.8 17.4 4.9 45.5 24.3 17.4 3.81990 42.2 19.0 18.2 5.0 47.4 22.3 20.5 4.61991 44.9 18.2 20.1 6.6 48.0 23.7 19.7 4.71992 46.1 19.9 19.5 6.7 46.8 21.0 21.4 4.51993 44.1 19.4 19.6 5.1 47.0 22.4 19.5 5.11994 47.3 18.5 22.2 6.6 48.0 21.6 21.3 5.21995 43.6 16.2 19.6 7.8 48.0 21.8 21.0 5.21996 45.9 15.1 22.6 8.2 49.1 21.1 22.1 5.91997 42.0 15.9 18.9 7.2 51.7 20.4 23.6 7.61998 46.9 18.1 19.3 9.5 50.7 22.2 21.9 6.71999 47.5 17.7 21.7 8.1 50.7 20.2 22.9 7.62000 49.1 17.2 22.6 9.3 52.1 22.6 21.0 8.62001 42.7 13.6 19.1 10.0 48.6 20.6 21.8 6.2
Part-time college students1980 84.7 5.5 21.6 57.6 81.9 9.8 23.1 48.91985 85.9 5.6 26.8 53.5 84.4 6.2 27.0 51.11990 85.6 3.0 27.3 55.3 80.2 4.9 24.9 50.41991 86.1 6.8 29.2 50.2 83.3 9.5 22.2 51.61992 82.6 6.6 31.8 44.2 82.6 8.2 24.1 50.31993 86.5 6.8 32.4 47.3 81.4 9.9 30.7 40.81994 84.1 7.7 28.8 47.6 85.1 11.3 32.8 40.91995 83.9 7.6 27.5 48.8 79.2 9.4 32.7 37.21996 83.4 7.3 25.2 51.0 84.0 9.1 29.2 45.71997 84.7 7.2 21.9 55.6 82.0 11.2 29.7 41.11998 84.8 5.6 26.8 52.4 81.9 8.2 26.8 46.81999 82.9 5.7 23.9 53.3 79.5 6.6 32.3 40.52000 84.9 9.3 24.4 51.3 83.0 8.0 30.8 44.22001 83.7 5.9 27.4 50.4 82.0 9.9 24.5 47.5
SOURCE: U.S. Department of Commerce, Bureau of the Census, October Current Population Surveys (CPS), various years, unpublished data.
Male Female
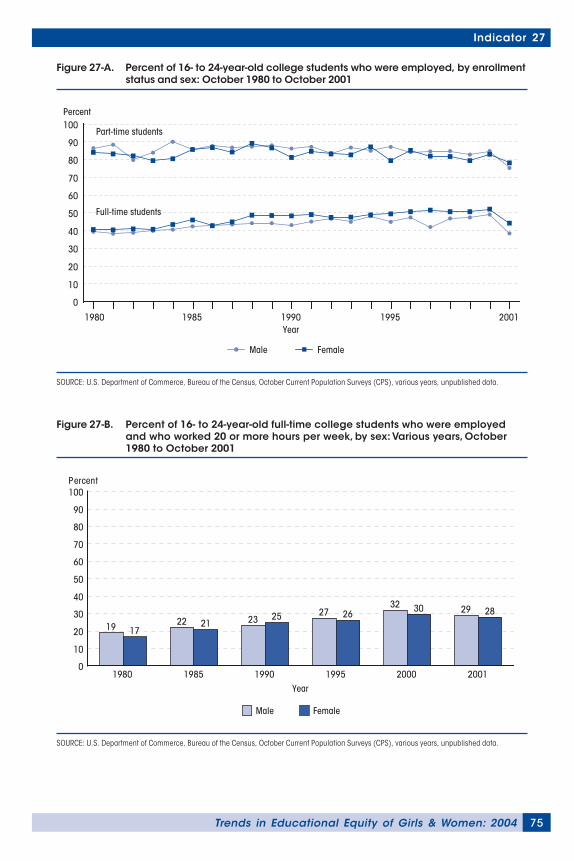
75Trends in Educational Equity of Girls & Women: 2004
Indicator 27
Figure 27-A. Percent of 16- to 24-year-old college students who were employed, by enrollmentstatus and sex: October 1980 to October 2001
SOURCE: U.S. Department of Commerce, Bureau of the Census, October Current Population Surveys (CPS), various years, unpublished data.
Percent
Male Female
Full-time students
Part-time students
1980 1985 1990Year
1995 2001
0
10
20
30
40
50
60
70
80
90
100
Figure 27-B. Percent of 16- to 24-year-old full-time college students who were employedand who worked 20 or more hours per week, by sex: Various years, October1980 to October 2001
SOURCE: U.S. Department of Commerce, Bureau of the Census, October Current Population Surveys (CPS), various years, unpublished data.
Male Female
Percent
Year1980 1985 1990 1995 2000 2001
0
10
20
30
40
50
60
70
80
90
100
19 1722 21 23 25 27 26
32 30 29 28
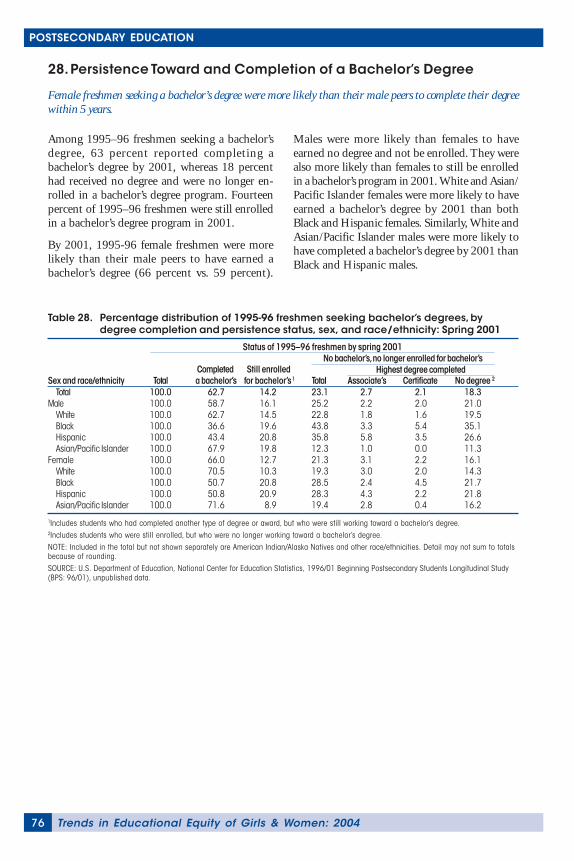
Trends in Educational Equity of Girls & Women: 200476
POSTSECONDARY EDUCATION
28. Persistence Toward and Completion of a Bachelor’s Degree
Female freshmen seeking a bachelor’s degree were more likely than their male peers to complete their degreewithin 5 years.
Among 1995–96 freshmen seeking a bachelor’sdegree, 63 percent reported completing abachelor’s degree by 2001, whereas 18 percenthad received no degree and were no longer en-rolled in a bachelor’s degree program. Fourteenpercent of 1995–96 freshmen were still enrolledin a bachelor’s degree program in 2001.
By 2001, 1995-96 female freshmen were morelikely than their male peers to have earned abachelor’s degree (66 percent vs. 59 percent).
Males were more likely than females to haveearned no degree and not be enrolled. They werealso more likely than females to still be enrolledin a bachelor’s program in 2001. White and Asian/Pacific Islander females were more likely to haveearned a bachelor’s degree by 2001 than bothBlack and Hispanic females. Similarly, White andAsian/Pacific Islander males were more likely tohave completed a bachelor’s degree by 2001 thanBlack and Hispanic males.
Table 28. Percentage distribution of 1995-96 freshmen seeking bachelor’s degrees, bydegree completion and persistence status, sex, and race/ethnicity: Spring 2001
Completed Still enrolledSex and race/ethnicity Total a bachelor’s for bachelor’s 1 Total Associate’s Certificate No degree 2
Total 100.0 62.7 14.2 23.1 2.7 2.1 18.3Male 100.0 58.7 16.1 25.2 2.2 2.0 21.0
White 100.0 62.7 14.5 22.8 1.8 1.6 19.5Black 100.0 36.6 19.6 43.8 3.3 5.4 35.1Hispanic 100.0 43.4 20.8 35.8 5.8 3.5 26.6Asian/Pacific Islander 100.0 67.9 19.8 12.3 1.0 0.0 11.3
Female 100.0 66.0 12.7 21.3 3.1 2.2 16.1White 100.0 70.5 10.3 19.3 3.0 2.0 14.3Black 100.0 50.7 20.8 28.5 2.4 4.5 21.7Hispanic 100.0 50.8 20.9 28.3 4.3 2.2 21.8Asian/Pacific Islander 100.0 71.6 8.9 19.4 2.8 0.4 16.2
1Includes students who had completed another type of degree or award, but who were still working toward a bachelor’s degree.2Includes students who were still enrolled, but who were no longer working toward a bachelor’s degree.NOTE: Included in the total but not shown separately are American Indian/Alaska Natives and other race/ethnicities. Detail may not sum to totalsbecause of rounding.SOURCE: U.S. Department of Education, National Center for Education Statistics, 1996/01 Beginning Postsecondary Students Longitudinal Study(BPS: 96/01), unpublished data.
Status of 1995–96 freshmen by spring 2001No bachelor’s, no longer enrolled for bachelor’s
Highest degree completed
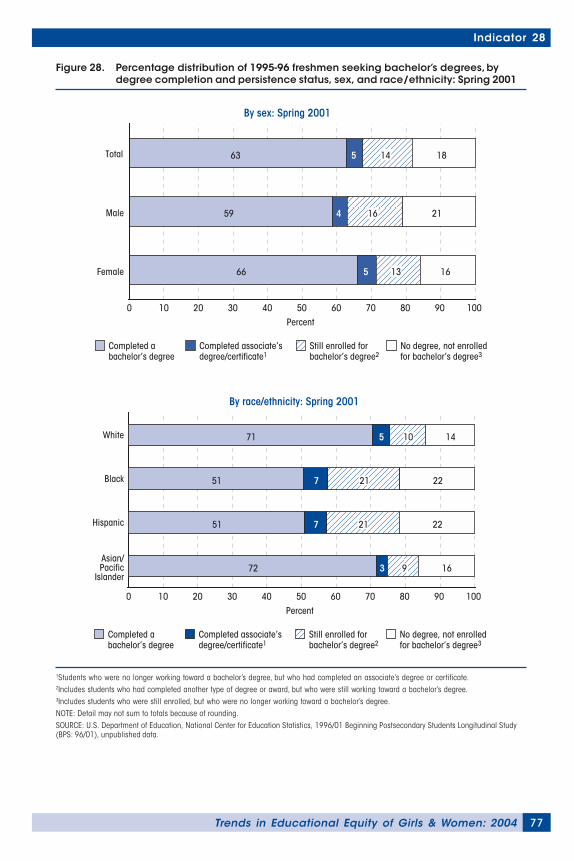
77Trends in Educational Equity of Girls & Women: 2004
Indicator 28
1Students who were no longer working toward a bachelor’s degree, but who had completed an associate’s degree or certificate.2Includes students who had completed another type of degree or award, but who were still working toward a bachelor’s degree.3Includes students who were still enrolled, but who were no longer working toward a bachelor’s degree.NOTE: Detail may not sum to totals because of rounding.SOURCE: U.S. Department of Education, National Center for Education Statistics, 1996/01 Beginning Postsecondary Students Longitudinal Study(BPS: 96/01), unpublished data.
Figure 28. Percentage distribution of 1995-96 freshmen seeking bachelor’s degrees, bydegree completion and persistence status, sex, and race/ethnicity: Spring 2001
Completed a bachelor’s degree
Still enrolled for bachelor’s degree2
Completed associate’s degree/certificate1
No degree, not enrolledfor bachelor’s degree3
0 10 30 40 50Percent
60 70 80 9020 100
Male
Female
Total
66 5 16
59 4 21
63 5 18
By sex: Spring 2001
14
13
16
Completed a bachelor’s degree
Still enrolled for bachelor’s degree2
Completed associate’s degree/certificate1
No degree, not enrolledfor bachelor’s degree3
0 10 30 40 50Percent
60 70 80 9020 100
Asian/ Pacific
Islander
Hispanic
Black
White
72 3 16
51 7 22
51 7 22
71 5 14
By race/ethnicity: Spring 2001
9
21
21
10
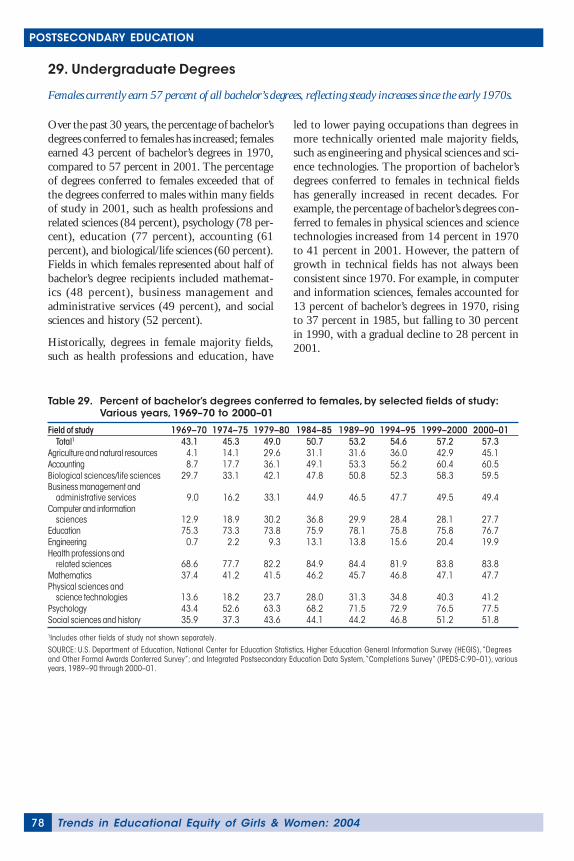
Trends in Educational Equity of Girls & Women: 200478
POSTSECONDARY EDUCATION
Table 29. Percent of bachelor’s degrees conferred to females, by selected fields of study:Various years, 1969–70 to 2000–01
Field of study 1969–70 1974–75 1979–80 1984–85 1989–90 1994–95 1999–2000 2000–01Total1 43.1 45.3 49.0 50.7 53.2 54.6 57.2 57.3
Agriculture and natural resources 4.1 14.1 29.6 31.1 31.6 36.0 42.9 45.1Accounting 8.7 17.7 36.1 49.1 53.3 56.2 60.4 60.5Biological sciences/life sciences 29.7 33.1 42.1 47.8 50.8 52.3 58.3 59.5Business management and
administrative services 9.0 16.2 33.1 44.9 46.5 47.7 49.5 49.4Computer and information
sciences 12.9 18.9 30.2 36.8 29.9 28.4 28.1 27.7Education 75.3 73.3 73.8 75.9 78.1 75.8 75.8 76.7Engineering 0.7 2.2 9.3 13.1 13.8 15.6 20.4 19.9Health professions and
related sciences 68.6 77.7 82.2 84.9 84.4 81.9 83.8 83.8Mathematics 37.4 41.2 41.5 46.2 45.7 46.8 47.1 47.7Physical sciences and
science technologies 13.6 18.2 23.7 28.0 31.3 34.8 40.3 41.2Psychology 43.4 52.6 63.3 68.2 71.5 72.9 76.5 77.5Social sciences and history 35.9 37.3 43.6 44.1 44.2 46.8 51.2 51.8
1Includes other fields of study not shown separately.SOURCE: U.S. Department of Education, National Center for Education Statistics, Higher Education General Information Survey (HEGIS), “Degreesand Other Formal Awards Conferred Survey”; and Integrated Postsecondary Education Data System, “Completions Survey” (IPEDS-C:90–01), variousyears, 1989–90 through 2000–01.
29. Undergraduate Degrees
Females currently earn 57 percent of all bachelor’s degrees, reflecting steady increases since the early 1970s.
Over the past 30 years, the percentage of bachelor’sdegrees conferred to females has increased; femalesearned 43 percent of bachelor’s degrees in 1970,compared to 57 percent in 2001. The percentageof degrees conferred to females exceeded that ofthe degrees conferred to males within many fieldsof study in 2001, such as health professions andrelated sciences (84 percent), psychology (78 per-cent), education (77 percent), accounting (61percent), and biological/life sciences (60 percent).Fields in which females represented about half ofbachelor’s degree recipients included mathemat-ics (48 percent), business management andadministrative services (49 percent), and socialsciences and history (52 percent).
Historically, degrees in female majority fields,such as health professions and education, have
led to lower paying occupations than degrees inmore technically oriented male majority fields,such as engineering and physical sciences and sci-ence technologies. The proportion of bachelor’sdegrees conferred to females in technical fieldshas generally increased in recent decades. Forexample, the percentage of bachelor’s degrees con-ferred to females in physical sciences and sciencetechnologies increased from 14 percent in 1970to 41 percent in 2001. However, the pattern ofgrowth in technical fields has not always beenconsistent since 1970. For example, in computerand information sciences, females accounted for13 percent of bachelor’s degrees in 1970, risingto 37 percent in 1985, but falling to 30 percentin 1990, with a gradual decline to 28 percent in2001.
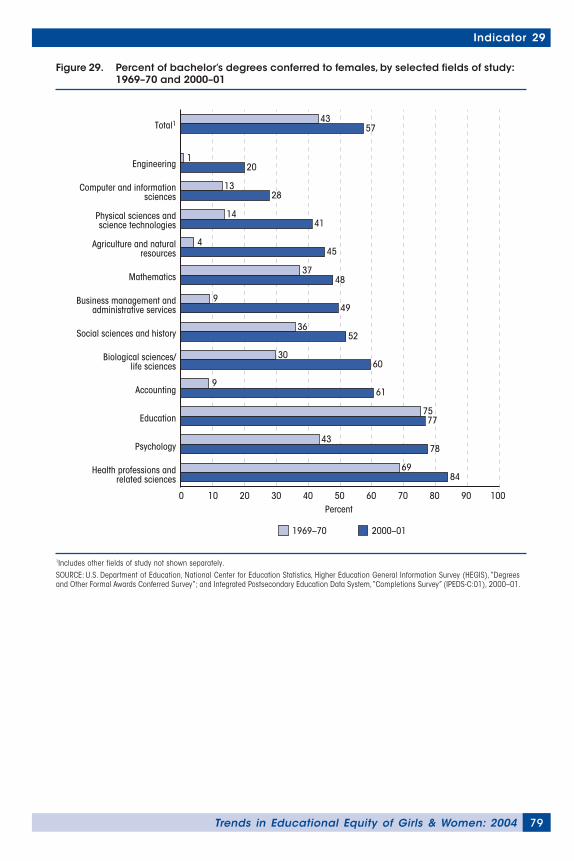
79Trends in Educational Equity of Girls & Women: 2004
Indicator 29
Figure 29. Percent of bachelor’s degrees conferred to females, by selected fields of study:1969–70 and 2000–01
1Includes other fields of study not shown separately.SOURCE: U.S. Department of Education, National Center for Education Statistics, Higher Education General Information Survey (HEGIS), “Degreesand Other Formal Awards Conferred Survey”; and Integrated Postsecondary Education Data System, “Completions Survey” (IPEDS-C:01), 2000–01.
Total1
Agriculture and natural resources
Accounting
Biological sciences/life sciences
Business management and administrative services
Computer and information sciences
Education
Engineering
Health professions and related sciences
Mathematics
Physical sciences and science technologies
Psychology
Social sciences and history
1969–70 2000–01
Percent0 10 20 30 40 50 60 70 80 90 100
4357
120
1328
1441
445
3748
949
3652
3060
961
7577
4378
6984
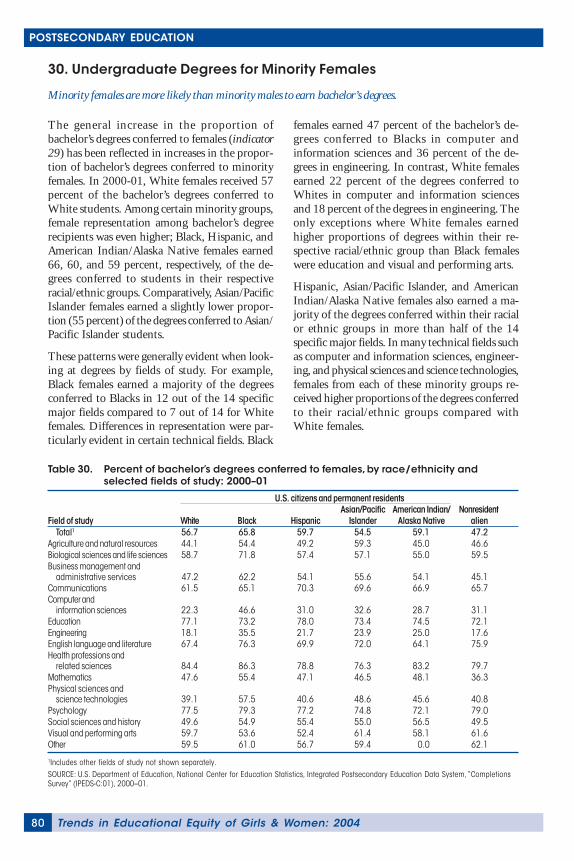
Trends in Educational Equity of Girls & Women: 200480
POSTSECONDARY EDUCATION
Table 30. Percent of bachelor’s degrees conferred to females, by race/ethnicity andselected fields of study: 2000–01
Asian/Pacific American Indian/ NonresidentField of study White Black Hispanic Islander Alaska Native alien
Total1 56.7 65.8 59.7 54.5 59.1 47.2Agriculture and natural resources 44.1 54.4 49.2 59.3 45.0 46.6Biological sciences and life sciences 58.7 71.8 57.4 57.1 55.0 59.5Business management and
administrative services 47.2 62.2 54.1 55.6 54.1 45.1Communications 61.5 65.1 70.3 69.6 66.9 65.7Computer and
information sciences 22.3 46.6 31.0 32.6 28.7 31.1Education 77.1 73.2 78.0 73.4 74.5 72.1Engineering 18.1 35.5 21.7 23.9 25.0 17.6English language and literature 67.4 76.3 69.9 72.0 64.1 75.9Health professions and
related sciences 84.4 86.3 78.8 76.3 83.2 79.7Mathematics 47.6 55.4 47.1 46.5 48.1 36.3Physical sciences and
science technologies 39.1 57.5 40.6 48.6 45.6 40.8Psychology 77.5 79.3 77.2 74.8 72.1 79.0Social sciences and history 49.6 54.9 55.4 55.0 56.5 49.5Visual and performing arts 59.7 53.6 52.4 61.4 58.1 61.6Other 59.5 61.0 56.7 59.4 0.0 62.1
1Includes other fields of study not shown separately.SOURCE: U.S. Department of Education, National Center for Education Statistics, Integrated Postsecondary Education Data System, “CompletionsSurvey” (IPEDS-C:01), 2000–01.
U.S. citizens and permanent residents
30. Undergraduate Degrees for Minority Females
Minority females are more likely than minority males to earn bachelor’s degrees.
The general increase in the proportion ofbachelor’s degrees conferred to females (indicator29) has been reflected in increases in the propor-tion of bachelor’s degrees conferred to minorityfemales. In 2000-01, White females received 57percent of the bachelor’s degrees conferred toWhite students. Among certain minority groups,female representation among bachelor’s degreerecipients was even higher; Black, Hispanic, andAmerican Indian/Alaska Native females earned66, 60, and 59 percent, respectively, of the de-grees conferred to students in their respectiveracial/ethnic groups. Comparatively, Asian/PacificIslander females earned a slightly lower propor-tion (55 percent) of the degrees conferred to Asian/Pacific Islander students.
These patterns were generally evident when look-ing at degrees by fields of study. For example,Black females earned a majority of the degreesconferred to Blacks in 12 out of the 14 specificmajor fields compared to 7 out of 14 for Whitefemales. Differences in representation were par-ticularly evident in certain technical fields. Black
females earned 47 percent of the bachelor’s de-grees conferred to Blacks in computer andinformation sciences and 36 percent of the de-grees in engineering. In contrast, White femalesearned 22 percent of the degrees conferred toWhites in computer and information sciencesand 18 percent of the degrees in engineering. Theonly exceptions where White females earnedhigher proportions of degrees within their re-spective racial/ethnic group than Black femaleswere education and visual and performing arts.
Hispanic, Asian/Pacific Islander, and AmericanIndian/Alaska Native females also earned a ma-jority of the degrees conferred within their racialor ethnic groups in more than half of the 14specific major fields. In many technical fields suchas computer and information sciences, engineer-ing, and physical sciences and science technologies,females from each of these minority groups re-ceived higher proportions of the degrees conferredto their racial/ethnic groups compared withWhite females.
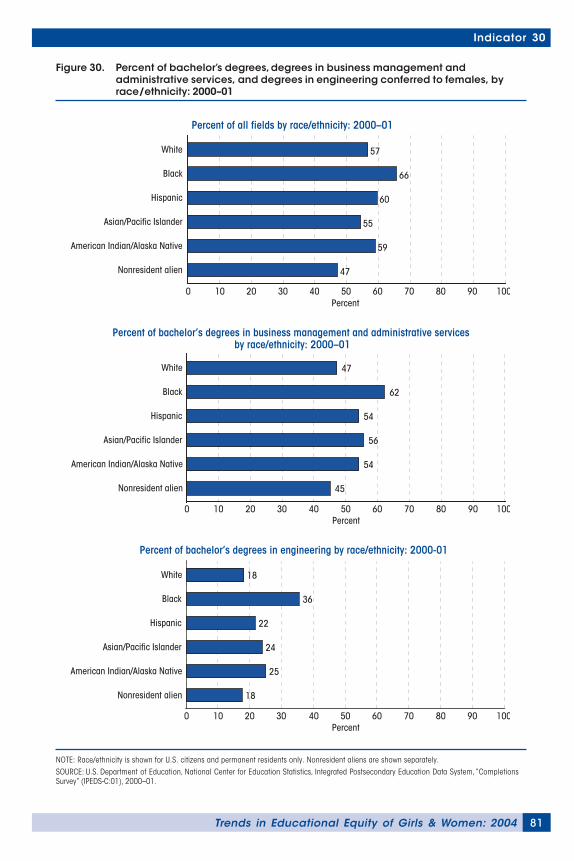
81Trends in Educational Equity of Girls & Women: 2004
Figure 30. Percent of bachelor’s degrees, degrees in business management andadministrative services, and degrees in engineering conferred to females, byrace/ethnicity: 2000–01
NOTE: Race/ethnicity is shown for U.S. citizens and permanent residents only. Nonresident aliens are shown separately.SOURCE: U.S. Department of Education, National Center for Education Statistics, Integrated Postsecondary Education Data System, “CompletionsSurvey” (IPEDS-C:01), 2000–01.
Indicator 30
Nonresident alien
American Indian/Alaska Native
Asian/Pacific Islander
Hispanic
Black
White
0 10 30 40 50Percent
60 70 80 9020 100
47
59
55
60
66
57
Percent of all fields by race/ethnicity: 2000–01
Nonresident alien
American Indian/Alaska Native
Asian/Pacific Islander
Hispanic
Black
White
0 10 30 40 50Percent
60 70 80 9020 100
45
54
56
54
62
47
Percent of bachelor’s degrees in business management and administrative services by race/ethnicity: 2000–01
Nonresident alien
American Indian/Alaska Native
Asian/Pacific Islander
Hispanic
Black
White
0 10 30 40 50Percent
60 70 80 9020 100
18
25
24
22
36
18
Percent of bachelor’s degrees in engineering by race/ethnicity: 2000-01
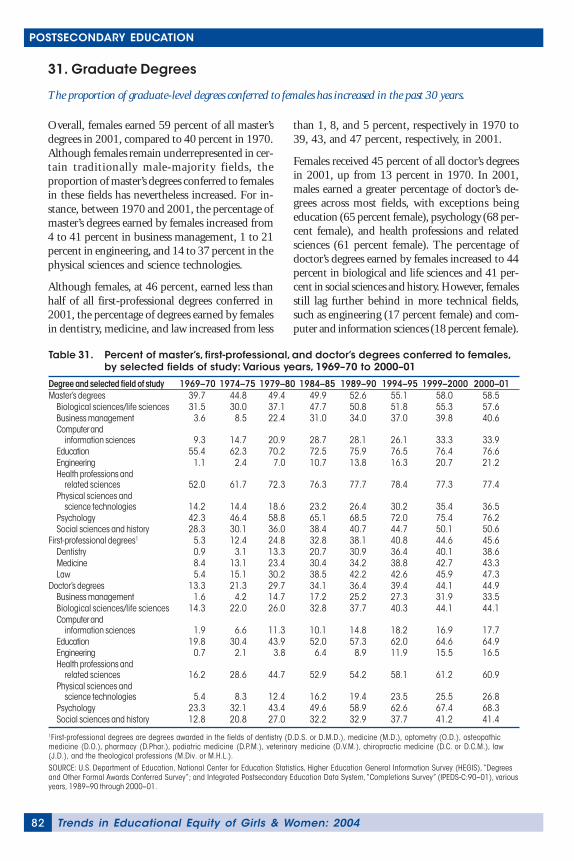
Trends in Educational Equity of Girls & Women: 200482
POSTSECONDARY EDUCATION
31. Graduate Degrees
The proportion of graduate-level degrees conferred to females has increased in the past 30 years.
Overall, females earned 59 percent of all master’sdegrees in 2001, compared to 40 percent in 1970.Although females remain underrepresented in cer-tain traditionally male-majority fields, theproportion of master’s degrees conferred to femalesin these fields has nevertheless increased. For in-stance, between 1970 and 2001, the percentage ofmaster’s degrees earned by females increased from4 to 41 percent in business management, 1 to 21percent in engineering, and 14 to 37 percent in thephysical sciences and science technologies.
Although females, at 46 percent, earned less thanhalf of all first-professional degrees conferred in2001, the percentage of degrees earned by femalesin dentistry, medicine, and law increased from less
than 1, 8, and 5 percent, respectively in 1970 to39, 43, and 47 percent, respectively, in 2001.
Females received 45 percent of all doctor’s degreesin 2001, up from 13 percent in 1970. In 2001,males earned a greater percentage of doctor’s de-grees across most fields, with exceptions beingeducation (65 percent female), psychology (68 per-cent female), and health professions and relatedsciences (61 percent female). The percentage ofdoctor’s degrees earned by females increased to 44percent in biological and life sciences and 41 per-cent in social sciences and history. However, femalesstill lag further behind in more technical fields,such as engineering (17 percent female) and com-puter and information sciences (18 percent female).
Table 31. Percent of master’s, first-professional, and doctor’s degrees conferred to females,by selected fields of study: Various years, 1969–70 to 2000–01
Degree and selected field of study 1969–70 1974–75 1979–80 1984–85 1989–90 1994–95 1999–2000 2000–01Master’s degrees 39.7 44.8 49.4 49.9 52.6 55.1 58.0 58.5
Biological sciences/life sciences 31.5 30.0 37.1 47.7 50.8 51.8 55.3 57.6Business management 3.6 8.5 22.4 31.0 34.0 37.0 39.8 40.6Computer and
information sciences 9.3 14.7 20.9 28.7 28.1 26.1 33.3 33.9Education 55.4 62.3 70.2 72.5 75.9 76.5 76.4 76.6Engineering 1.1 2.4 7.0 10.7 13.8 16.3 20.7 21.2Health professions and
related sciences 52.0 61.7 72.3 76.3 77.7 78.4 77.3 77.4Physical sciences and
science technologies 14.2 14.4 18.6 23.2 26.4 30.2 35.4 36.5Psychology 42.3 46.4 58.8 65.1 68.5 72.0 75.4 76.2Social sciences and history 28.3 30.1 36.0 38.4 40.7 44.7 50.1 50.6
First-professional degrees1 5.3 12.4 24.8 32.8 38.1 40.8 44.6 45.6Dentistry 0.9 3.1 13.3 20.7 30.9 36.4 40.1 38.6Medicine 8.4 13.1 23.4 30.4 34.2 38.8 42.7 43.3Law 5.4 15.1 30.2 38.5 42.2 42.6 45.9 47.3
Doctor’s degrees 13.3 21.3 29.7 34.1 36.4 39.4 44.1 44.9Business management 1.6 4.2 14.7 17.2 25.2 27.3 31.9 33.5Biological sciences/life sciences 14.3 22.0 26.0 32.8 37.7 40.3 44.1 44.1Computer and
information sciences 1.9 6.6 11.3 10.1 14.8 18.2 16.9 17.7Education 19.8 30.4 43.9 52.0 57.3 62.0 64.6 64.9Engineering 0.7 2.1 3.8 6.4 8.9 11.9 15.5 16.5Health professions and
related sciences 16.2 28.6 44.7 52.9 54.2 58.1 61.2 60.9Physical sciences and
science technologies 5.4 8.3 12.4 16.2 19.4 23.5 25.5 26.8Psychology 23.3 32.1 43.4 49.6 58.9 62.6 67.4 68.3Social sciences and history 12.8 20.8 27.0 32.2 32.9 37.7 41.2 41.4
1First-professional degrees are degrees awarded in the fields of dentistry (D.D.S. or D.M.D.), medicine (M.D.), optometry (O.D.), osteopathicmedicine (D.O.), pharmacy (D.Phar.), podiatric medicine (D.P.M.), veterinary medicine (D.V.M.), chiropractic medicine (D.C. or D.C.M.), law(J.D.), and the theological professions (M.Div. or M.H.L.).SOURCE: U.S. Department of Education, National Center for Education Statistics, Higher Education General Information Survey (HEGIS), “Degreesand Other Formal Awards Conferred Survey”; and Integrated Postsecondary Education Data System, “Completions Survey” (IPEDS-C:90–01), variousyears, 1989–90 through 2000–01.
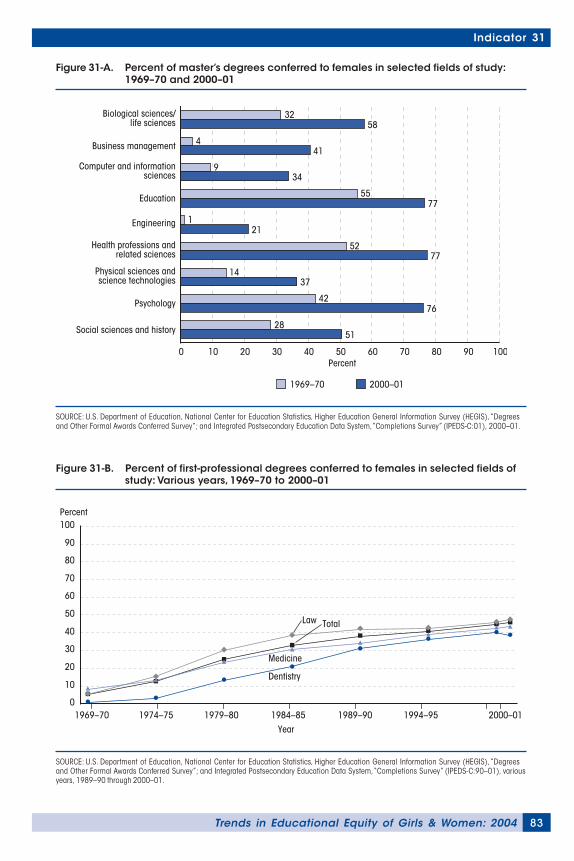
83Trends in Educational Equity of Girls & Women: 2004
Indicator 31
Figure 31-A. Percent of master’s degrees conferred to females in selected fields of study:1969–70 and 2000–01
SOURCE: U.S. Department of Education, National Center for Education Statistics, Higher Education General Information Survey (HEGIS), “Degreesand Other Formal Awards Conferred Survey”; and Integrated Postsecondary Education Data System, “Completions Survey” (IPEDS-C:01), 2000–01.
1969–70 2000–01
Percent
Social sciences and history
Psychology
Physical sciences and science technologies
Health professions and related sciences
Engineering
Education
Computer and information sciences
Business management
Biological sciences/life sciences
0 10 20 30 40 50 60 70 80 90 100
3258
441
934
5577
121
5277
1437
4276
2851
Figure 31-B. Percent of first-professional degrees conferred to females in selected fields ofstudy: Various years, 1969–70 to 2000–01
SOURCE: U.S. Department of Education, National Center for Education Statistics, Higher Education General Information Survey (HEGIS), “Degreesand Other Formal Awards Conferred Survey”; and Integrated Postsecondary Education Data System, “Completions Survey” (IPEDS-C:90–01), variousyears, 1989–90 through 2000–01.
Year
Percent
Medicine
Law
1969–70 1974–75 1979–80 1984–85 1989–90 1994–95 2000–01
Dentistry
0
10
20
30
40
50
60
70
80
90
100
Total
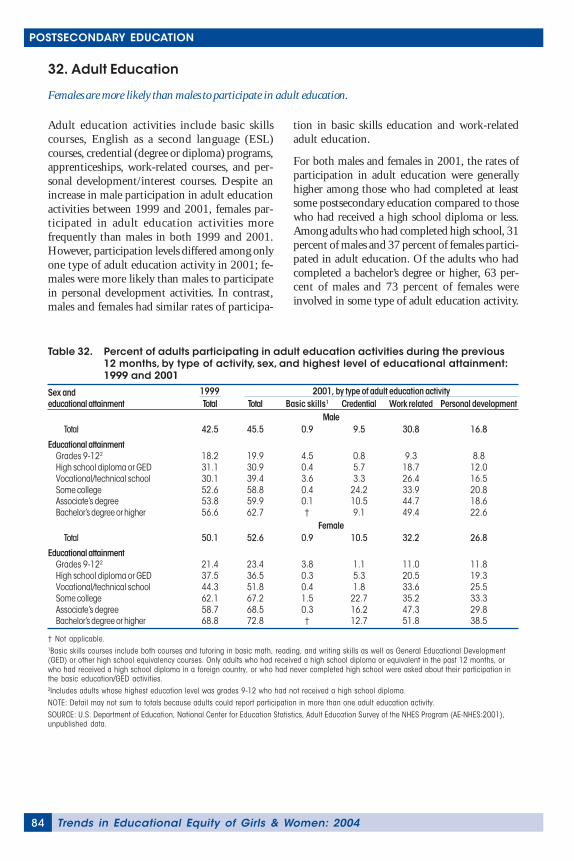
Trends in Educational Equity of Girls & Women: 200484
POSTSECONDARY EDUCATION
32. Adult Education
Females are more likely than males to participate in adult education.
Adult education activities include basic skillscourses, English as a second language (ESL)courses, credential (degree or diploma) programs,apprenticeships, work-related courses, and per-sonal development/interest courses. Despite anincrease in male participation in adult educationactivities between 1999 and 2001, females par-ticipated in adult education activities morefrequently than males in both 1999 and 2001.However, participation levels differed among onlyone type of adult education activity in 2001; fe-males were more likely than males to participatein personal development activities. In contrast,males and females had similar rates of participa-
tion in basic skills education and work-relatedadult education.
For both males and females in 2001, the rates ofparticipation in adult education were generallyhigher among those who had completed at leastsome postsecondary education compared to thosewho had received a high school diploma or less.Among adults who had completed high school, 31percent of males and 37 percent of females partici-pated in adult education. Of the adults who hadcompleted a bachelor’s degree or higher, 63 per-cent of males and 73 percent of females wereinvolved in some type of adult education activity.
Table 32. Percent of adults participating in adult education activities during the previous12 months, by type of activity, sex, and highest level of educational attainment:1999 and 2001
Sex andeducational attainment Total Total Basic skills1 Credential Work related Personal development
MaleTotal 42.5 45.5 0.9 9.5 30.8 16.8
Educational attainmentGrades 9-122 18.2 19.9 4.5 0.8 9.3 8.8High school diploma or GED 31.1 30.9 0.4 5.7 18.7 12.0Vocational/technical school 30.1 39.4 3.6 3.3 26.4 16.5Some college 52.6 58.8 0.4 24.2 33.9 20.8Associate’s degree 53.8 59.9 0.1 10.5 44.7 18.6Bachelor’s degree or higher 56.6 62.7 † 9.1 49.4 22.6
FemaleTotal 50.1 52.6 0.9 10.5 32.2 26.8
Educational attainmentGrades 9-122 21.4 23.4 3.8 1.1 11.0 11.8High school diploma or GED 37.5 36.5 0.3 5.3 20.5 19.3Vocational/technical school 44.3 51.8 0.4 1.8 33.6 25.5Some college 62.1 67.2 1.5 22.7 35.2 33.3Associate’s degree 58.7 68.5 0.3 16.2 47.3 29.8Bachelor’s degree or higher 68.8 72.8 † 12.7 51.8 38.5
† Not applicable.1Basic skills courses include both courses and tutoring in basic math, reading, and writing skills as well as General Educational Development(GED) or other high school equivalency courses. Only adults who had received a high school diploma or equivalent in the past 12 months, orwho had received a high school diploma in a foreign country, or who had never completed high school were asked about their participation inthe basic education/GED activities.2Includes adults whose highest education level was grades 9-12 who had not received a high school diploma.NOTE: Detail may not sum to totals because adults could report participation in more than one adult education activity.SOURCE: U.S. Department of Education, National Center for Education Statistics, Adult Education Survey of the NHES Program (AE-NHES:2001),unpublished data.
1999 2001, by type of adult education activity
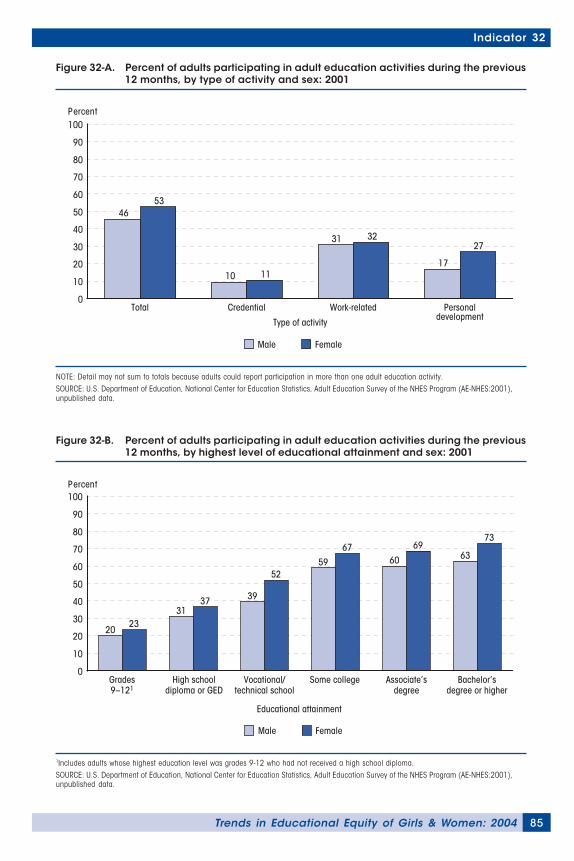
85Trends in Educational Equity of Girls & Women: 2004
Indicator 32
Figure 32-A. Percent of adults participating in adult education activities during the previous12 months, by type of activity and sex: 2001
NOTE: Detail may not sum to totals because adults could report participation in more than one adult education activity.SOURCE: U.S. Department of Education, National Center for Education Statistics, Adult Education Survey of the NHES Program (AE-NHES:2001),unpublished data.
Male Female
Percent
Type of activity
Total Credential Work-related Personal development
0
10
20
30
40
50
60
70
80
90
100
4653
10 11
31 32
17
27
1Includes adults whose highest education level was grades 9-12 who had not received a high school diploma.SOURCE: U.S. Department of Education, National Center for Education Statistics, Adult Education Survey of the NHES Program (AE-NHES:2001),unpublished data.
Figure 32-B. Percent of adults participating in adult education activities during the previous12 months, by highest level of educational attainment and sex: 2001
Percent
Male Female
Educational attainment
Grades 9–121
High school diploma or GED
Vocational/ technical school
Some college Associate’s degree
Bachelor’s degree or higher
0
10
20
30
40
50
60
70
80
90
100
2023
3137 39
5259
6760
6963
73
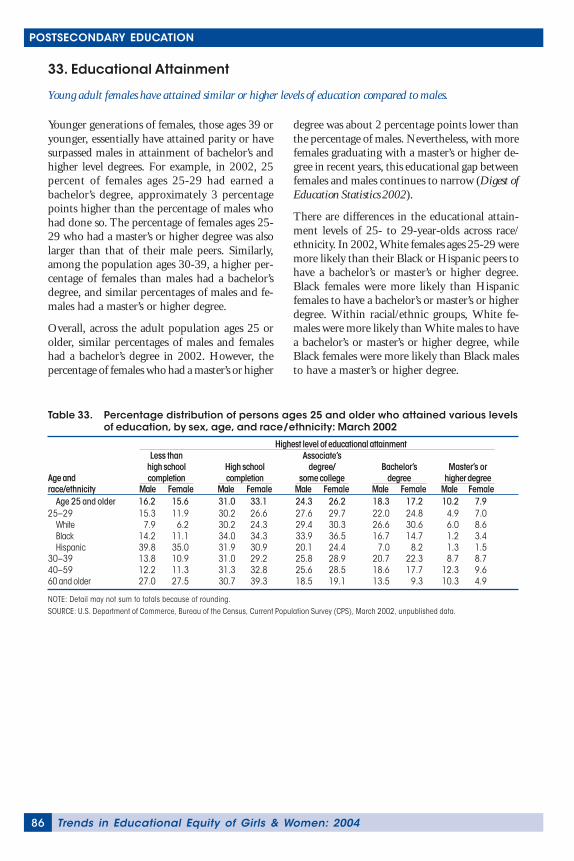
Trends in Educational Equity of Girls & Women: 200486
POSTSECONDARY EDUCATION
Table 33. Percentage distribution of persons ages 25 and older who attained various levelsof education, by sex, age, and race/ethnicity: March 2002
Age andrace/ethnicity Male Female Male Female Male Female Male Female Male Female
Age 25 and older 16.2 15.6 31.0 33.1 24.3 26.2 18.3 17.2 10.2 7.925–29 15.3 11.9 30.2 26.6 27.6 29.7 22.0 24.8 4.9 7.0
White 7.9 6.2 30.2 24.3 29.4 30.3 26.6 30.6 6.0 8.6Black 14.2 11.1 34.0 34.3 33.9 36.5 16.7 14.7 1.2 3.4Hispanic 39.8 35.0 31.9 30.9 20.1 24.4 7.0 8.2 1.3 1.5
30–39 13.8 10.9 31.0 29.2 25.8 28.9 20.7 22.3 8.7 8.740–59 12.2 11.3 31.3 32.8 25.6 28.5 18.6 17.7 12.3 9.660 and older 27.0 27.5 30.7 39.3 18.5 19.1 13.5 9.3 10.3 4.9
NOTE: Detail may not sum to totals because of rounding.SOURCE: U.S. Department of Commerce, Bureau of the Census, Current Population Survey (CPS), March 2002, unpublished data.
Highest level of educational attainment
Master’s orhigher degree
Less thanhigh schoolcompletion
High schoolcompletion
Associate’sdegree/
some collegeBachelor’s
degree
33. Educational Attainment
Young adult females have attained similar or higher levels of education compared to males.
Younger generations of females, those ages 39 oryounger, essentially have attained parity or havesurpassed males in attainment of bachelor’s andhigher level degrees. For example, in 2002, 25percent of females ages 25-29 had earned abachelor’s degree, approximately 3 percentagepoints higher than the percentage of males whohad done so. The percentage of females ages 25-29 who had a master’s or higher degree was alsolarger than that of their male peers. Similarly,among the population ages 30-39, a higher per-centage of females than males had a bachelor’sdegree, and similar percentages of males and fe-males had a master’s or higher degree.
Overall, across the adult population ages 25 orolder, similar percentages of males and femaleshad a bachelor’s degree in 2002. However, thepercentage of females who had a master’s or higher
degree was about 2 percentage points lower thanthe percentage of males. Nevertheless, with morefemales graduating with a master’s or higher de-gree in recent years, this educational gap betweenfemales and males continues to narrow (Digest ofEducation Statistics 2002).
There are differences in the educational attain-ment levels of 25- to 29-year-olds across race/ethnicity. In 2002, White females ages 25-29 weremore likely than their Black or Hispanic peers tohave a bachelor’s or master’s or higher degree.Black females were more likely than Hispanicfemales to have a bachelor’s or master’s or higherdegree. Within racial/ethnic groups, White fe-males were more likely than White males to havea bachelor’s or master’s or higher degree, whileBlack females were more likely than Black malesto have a master’s or higher degree.
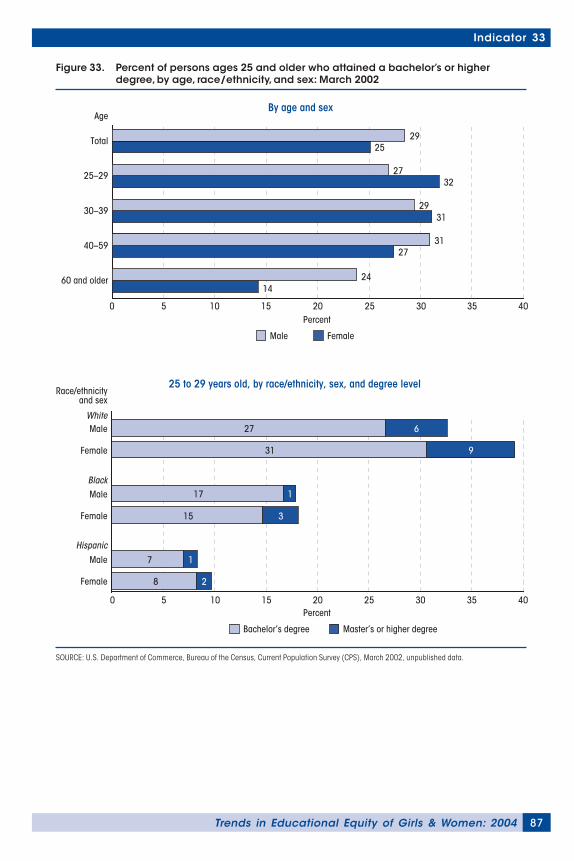
87Trends in Educational Equity of Girls & Women: 2004
Indicator 33
SOURCE: U.S. Department of Commerce, Bureau of the Census, Current Population Survey (CPS), March 2002, unpublished data.
Figure 33. Percent of persons ages 25 and older who attained a bachelor’s or higherdegree, by age, race/ethnicity, and sex: March 2002
Male Female
AgeBy age and sex
0 10 15 20 25 30 35 40
1424
2731
3129
3227
2529
60 and older
40–59
30–39
25–29
Total
5Percent
25 to 29 years old, by race/ethnicity, sex, and degree level
Bachelor’s degree Master’s or higher degree
Percent
Female
Male
Race/ethnicity and sex
White
Black
Hispanic
Female
Male
Female
Male
0 5 10 15 20 25 30 35 40
8 2
7 1
15 3
17 1
31 9
27 6
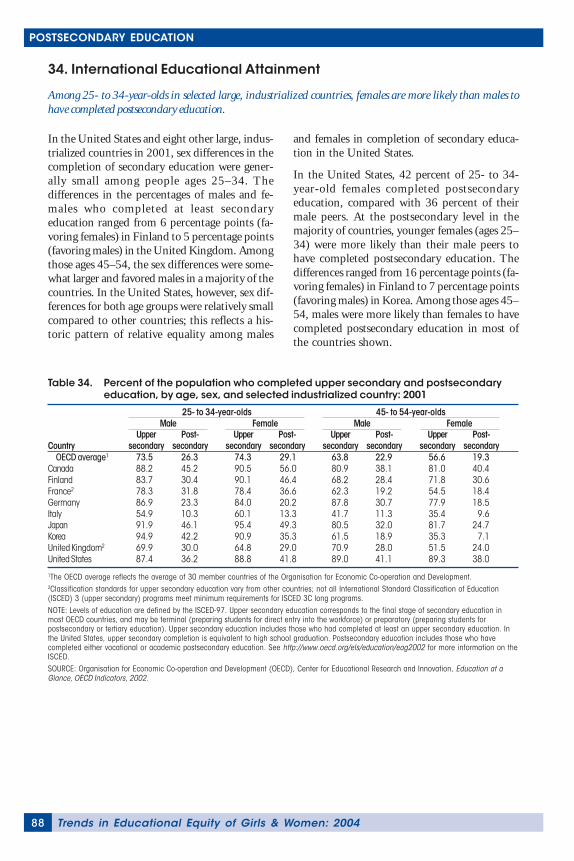
Trends in Educational Equity of Girls & Women: 200488
POSTSECONDARY EDUCATION
Table 34. Percent of the population who completed upper secondary and postsecondaryeducation, by age, sex, and selected industrialized country: 2001
Upper Post- Upper Post- Upper Post- Upper Post-Country secondary secondary secondary secondary secondary secondary secondary secondary
OECD average1 73.5 26.3 74.3 29.1 63.8 22.9 56.6 19.3Canada 88.2 45.2 90.5 56.0 80.9 38.1 81.0 40.4Finland 83.7 30.4 90.1 46.4 68.2 28.4 71.8 30.6France2 78.3 31.8 78.4 36.6 62.3 19.2 54.5 18.4Germany 86.9 23.3 84.0 20.2 87.8 30.7 77.9 18.5Italy 54.9 10.3 60.1 13.3 41.7 11.3 35.4 9.6Japan 91.9 46.1 95.4 49.3 80.5 32.0 81.7 24.7Korea 94.9 42.2 90.9 35.3 61.5 18.9 35.3 7.1United Kingdom2 69.9 30.0 64.8 29.0 70.9 28.0 51.5 24.0United States 87.4 36.2 88.8 41.8 89.0 41.1 89.3 38.0
1The OECD average reflects the average of 30 member countries of the Organisation for Economic Co-operation and Development.2Classification standards for upper secondary education vary from other countries; not all International Standard Classification of Education(ISCED) 3 (upper secondary) programs meet minimum requirements for ISCED 3C long programs.NOTE: Levels of education are defined by the ISCED-97. Upper secondary education corresponds to the final stage of secondary education inmost OECD countries, and may be terminal (preparing students for direct entry into the workforce) or preparatory (preparing students forpostsecondary or tertiary education). Upper secondary education includes those who had completed at least an upper secondary education. Inthe United States, upper secondary completion is equivalent to high school graduation. Postsecondary education includes those who havecompleted either vocational or academic postsecondary education. See http://www.oecd.org/els/education/eag2002 for more information on theISCED.SOURCE: Organisation for Economic Co-operation and Development (OECD), Center for Educational Research and Innovation, Education at aGlance, OECD Indicators, 2002.
25- to 34-year-olds 45- to 54-year-oldsMale Female Male Female
34. International Educational Attainment
Among 25- to 34-year-olds in selected large, industrialized countries, females are more likely than males tohave completed postsecondary education.
In the United States and eight other large, indus-trialized countries in 2001, sex differences in thecompletion of secondary education were gener-ally small among people ages 25–34. Thedifferences in the percentages of males and fe-males who completed at least secondaryeducation ranged from 6 percentage points (fa-voring females) in Finland to 5 percentage points(favoring males) in the United Kingdom. Amongthose ages 45–54, the sex differences were some-what larger and favored males in a majority of thecountries. In the United States, however, sex dif-ferences for both age groups were relatively smallcompared to other countries; this reflects a his-toric pattern of relative equality among males
and females in completion of secondary educa-tion in the United States.
In the United States, 42 percent of 25- to 34-year-old females completed postsecondaryeducation, compared with 36 percent of theirmale peers. At the postsecondary level in themajority of countries, younger females (ages 25–34) were more likely than their male peers tohave completed postsecondary education. Thedifferences ranged from 16 percentage points (fa-voring females) in Finland to 7 percentage points(favoring males) in Korea. Among those ages 45–54, males were more likely than females to havecompleted postsecondary education in most ofthe countries shown.
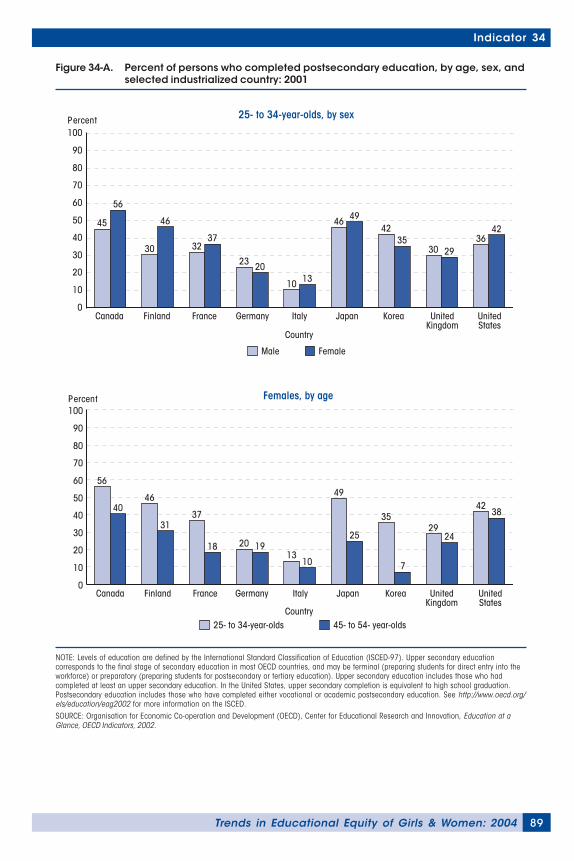
89Trends in Educational Equity of Girls & Women: 2004
Indicator 34
Figure 34-A. Percent of persons who completed postsecondary education, by age, sex, andselected industrialized country: 2001
Canada Finland France Germany Italy Japan Korea United Kingdom
UnitedStates
Male Female
Percent
Country
0
10
20
30
40
50
60
70
80
90
100
45
56
30
46
3237
23 20
10 13
46 4942
3530 29
3642
25- to 34-year-olds, by sex
NOTE: Levels of education are defined by the International Standard Classification of Education (ISCED-97). Upper secondary educationcorresponds to the final stage of secondary education in most OECD countries, and may be terminal (preparing students for direct entry into theworkforce) or preparatory (preparing students for postsecondary or tertiary education). Upper secondary education includes those who hadcompleted at least an upper secondary education. In the United States, upper secondary completion is equivalent to high school graduation.Postsecondary education includes those who have completed either vocational or academic postsecondary education. See http://www.oecd.org/els/education/eag2002 for more information on the ISCED.SOURCE: Organisation for Economic Co-operation and Development (OECD), Center for Educational Research and Innovation, Education at aGlance, OECD Indicators, 2002.
25- to 34-year-olds 45- to 54- year-oldsCountry
Percent
Canada Finland France Germany Italy Japan Korea United Kingdom
United States
0
10
20
30
40
50
60
70
80
90
100
56
4046
3137
18 20 1913
10
49
25
35
7
2924
4238
Females, by age

91Trends in Educational Equity of Girls & Women: 2004
OUTCOMES
35. Employment of Young Adults
36. Median Earnings of Young Females
37. International Labor Force Participation
38. Education and Earnings
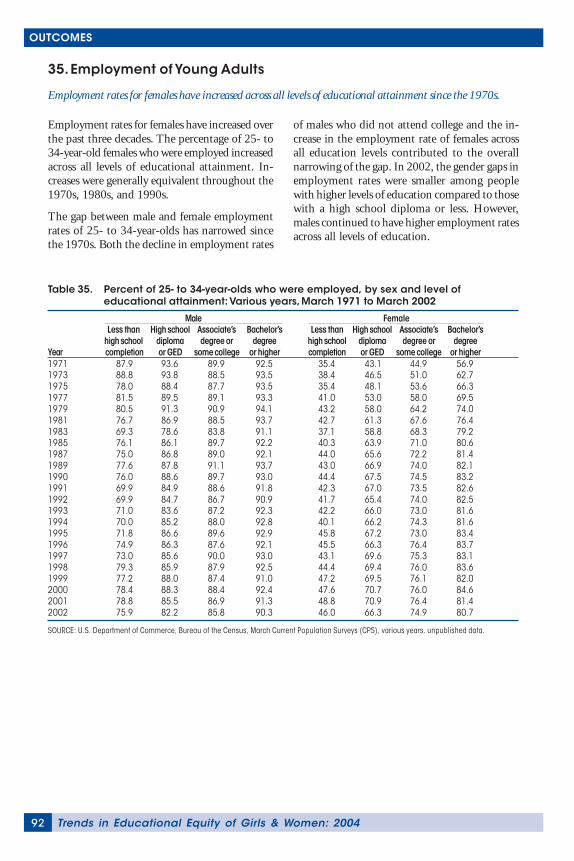
Trends in Educational Equity of Girls & Women: 200492
OUTCOMES
Table 35. Percent of 25- to 34-year-olds who were employed, by sex and level ofeducational attainment: Various years, March 1971 to March 2002
Less than High school Associate’s Bachelor’s Less than High school Associate’s Bachelor’shigh school diploma degree or degree high school diploma degree or degree
Year completion or GED some college or higher completion or GED some college or higher1971 87.9 93.6 89.9 92.5 35.4 43.1 44.9 56.91973 88.8 93.8 88.5 93.5 38.4 46.5 51.0 62.71975 78.0 88.4 87.7 93.5 35.4 48.1 53.6 66.31977 81.5 89.5 89.1 93.3 41.0 53.0 58.0 69.51979 80.5 91.3 90.9 94.1 43.2 58.0 64.2 74.01981 76.7 86.9 88.5 93.7 42.7 61.3 67.6 76.41983 69.3 78.6 83.8 91.1 37.1 58.8 68.3 79.21985 76.1 86.1 89.7 92.2 40.3 63.9 71.0 80.61987 75.0 86.8 89.0 92.1 44.0 65.6 72.2 81.41989 77.6 87.8 91.1 93.7 43.0 66.9 74.0 82.11990 76.0 88.6 89.7 93.0 44.4 67.5 74.5 83.21991 69.9 84.9 88.6 91.8 42.3 67.0 73.5 82.61992 69.9 84.7 86.7 90.9 41.7 65.4 74.0 82.51993 71.0 83.6 87.2 92.3 42.2 66.0 73.0 81.61994 70.0 85.2 88.0 92.8 40.1 66.2 74.3 81.61995 71.8 86.6 89.6 92.9 45.8 67.2 73.0 83.41996 74.9 86.3 87.6 92.1 45.5 66.3 76.4 83.71997 73.0 85.6 90.0 93.0 43.1 69.6 75.3 83.11998 79.3 85.9 87.9 92.5 44.4 69.4 76.0 83.61999 77.2 88.0 87.4 91.0 47.2 69.5 76.1 82.02000 78.4 88.3 88.4 92.4 47.6 70.7 76.0 84.62001 78.8 85.5 86.9 91.3 48.8 70.9 76.4 81.42002 75.9 82.2 85.8 90.3 46.0 66.3 74.9 80.7
SOURCE: U.S. Department of Commerce, Bureau of the Census, March Current Population Surveys (CPS), various years, unpublished data.
FemaleMale
35. Employment of Young Adults
Employment rates for females have increased across all levels of educational attainment since the 1970s.
Employment rates for females have increased overthe past three decades. The percentage of 25- to34-year-old females who were employed increasedacross all levels of educational attainment. In-creases were generally equivalent throughout the1970s, 1980s, and 1990s.
The gap between male and female employmentrates of 25- to 34-year-olds has narrowed sincethe 1970s. Both the decline in employment rates
of males who did not attend college and the in-crease in the employment rate of females acrossall education levels contributed to the overallnarrowing of the gap. In 2002, the gender gaps inemployment rates were smaller among peoplewith higher levels of education compared to thosewith a high school diploma or less. However,males continued to have higher employment ratesacross all levels of education.
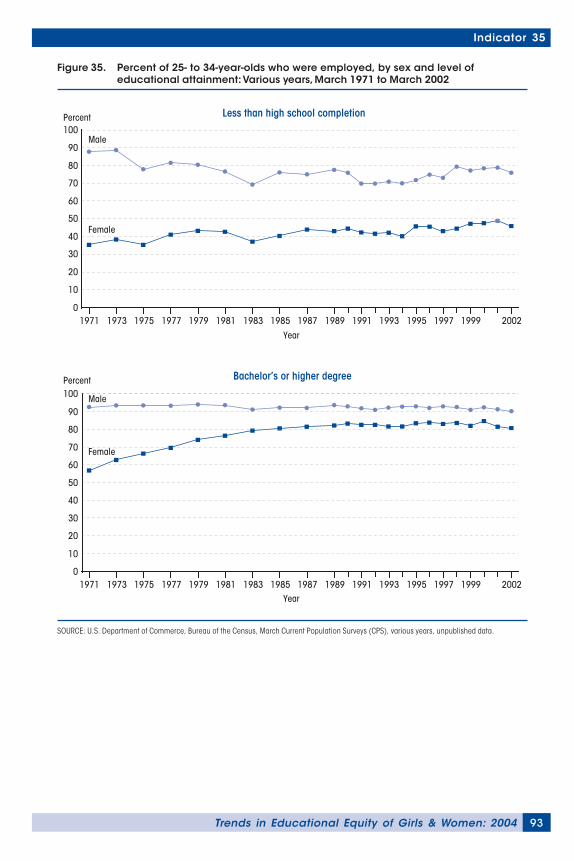
93Trends in Educational Equity of Girls & Women: 2004
Indicator 35
SOURCE: U.S. Department of Commerce, Bureau of the Census, March Current Population Surveys (CPS), various years, unpublished data.
Figure 35. Percent of 25- to 34-year-olds who were employed, by sex and level ofeducational attainment: Various years, March 1971 to March 2002
Male
Female
1971 1973 1975 1977 1979 1981 1983 1985 1987 1989 1991 1993 1995 1997 1999 20020
20
40
60
80
10
30
50
70
90
100Percent Less than high school completion
Year
Male
Female
Year1971 1973 1975 1977 1979 1981 1983 1985 1987 1989 1991 1993 1995 1997 1999 2002
0
20
40
60
80
10
30
50
70
90
100Percent Bachelor’s or higher degree
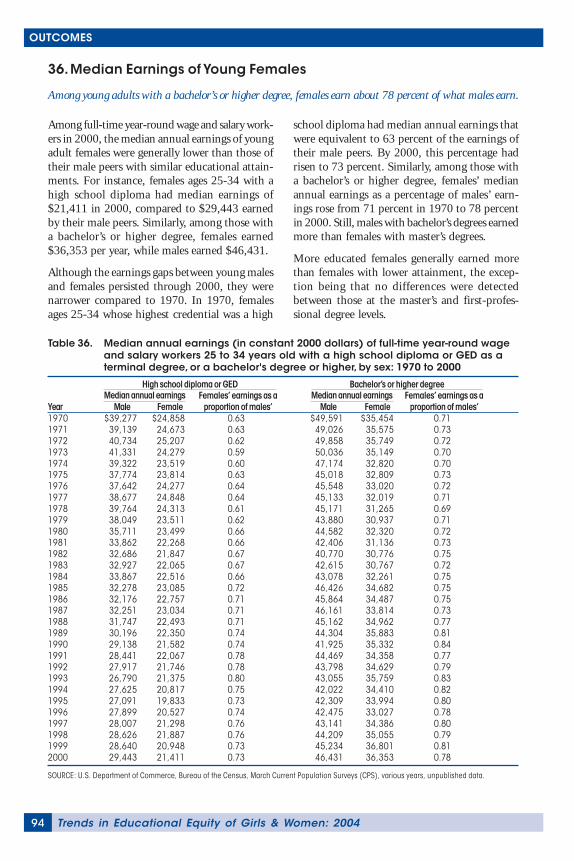
Trends in Educational Equity of Girls & Women: 200494
OUTCOMES
36. Median Earnings of Young Females
Among young adults with a bachelor’s or higher degree, females earn about 78 percent of what males earn.
Among full-time year-round wage and salary work-ers in 2000, the median annual earnings of youngadult females were generally lower than those oftheir male peers with similar educational attain-ments. For instance, females ages 25-34 with ahigh school diploma had median earnings of$21,411 in 2000, compared to $29,443 earnedby their male peers. Similarly, among those witha bachelor’s or higher degree, females earned$36,353 per year, while males earned $46,431.
Although the earnings gaps between young malesand females persisted through 2000, they werenarrower compared to 1970. In 1970, femalesages 25-34 whose highest credential was a high
school diploma had median annual earnings thatwere equivalent to 63 percent of the earnings oftheir male peers. By 2000, this percentage hadrisen to 73 percent. Similarly, among those witha bachelor’s or higher degree, females’ medianannual earnings as a percentage of males’ earn-ings rose from 71 percent in 1970 to 78 percentin 2000. Still, males with bachelor’s degrees earnedmore than females with master’s degrees.
More educated females generally earned morethan females with lower attainment, the excep-tion being that no differences were detectedbetween those at the master’s and first-profes-sional degree levels.
Table 36. Median annual earnings (in constant 2000 dollars) of full-time year-round wageand salary workers 25 to 34 years old with a high school diploma or GED as aterminal degree, or a bachelor's degree or higher, by sex: 1970 to 2000
Females’ earnings as a Females’ earnings as aYear Male Female proportion of males’ Male Female proportion of males’1970 $39,277 $24,858 0.63 $49,591 $35,454 0.711971 39,139 24,673 0.63 49,026 35,575 0.731972 40,734 25,207 0.62 49,858 35,749 0.721973 41,331 24,279 0.59 50,036 35,149 0.701974 39,322 23,519 0.60 47,174 32,820 0.701975 37,774 23,814 0.63 45,018 32,809 0.731976 37,642 24,277 0.64 45,548 33,020 0.721977 38,677 24,848 0.64 45,133 32,019 0.711978 39,764 24,313 0.61 45,171 31,265 0.691979 38,049 23,511 0.62 43,880 30,937 0.711980 35,711 23,499 0.66 44,582 32,320 0.721981 33,862 22,268 0.66 42,406 31,136 0.731982 32,686 21,847 0.67 40,770 30,776 0.751983 32,927 22,065 0.67 42,615 30,767 0.721984 33,867 22,516 0.66 43,078 32,261 0.751985 32,278 23,085 0.72 46,426 34,682 0.751986 32,176 22,757 0.71 45,864 34,487 0.751987 32,251 23,034 0.71 46,161 33,814 0.731988 31,747 22,493 0.71 45,162 34,962 0.771989 30,196 22,350 0.74 44,304 35,883 0.811990 29,138 21,582 0.74 41,925 35,332 0.841991 28,441 22,067 0.78 44,469 34,358 0.771992 27,917 21,746 0.78 43,798 34,629 0.791993 26,790 21,375 0.80 43,055 35,759 0.831994 27,625 20,817 0.75 42,022 34,410 0.821995 27,091 19,833 0.73 42,309 33,994 0.801996 27,899 20,527 0.74 42,475 33,027 0.781997 28,007 21,298 0.76 43,141 34,386 0.801998 28,626 21,887 0.76 44,209 35,055 0.791999 28,640 20,948 0.73 45,234 36,801 0.812000 29,443 21,411 0.73 46,431 36,353 0.78
SOURCE: U.S. Department of Commerce, Bureau of the Census, March Current Population Surveys (CPS), various years, unpublished data.
High school diploma or GED Bachelor’s or higher degreeMedian annual earnings Median annual earnings
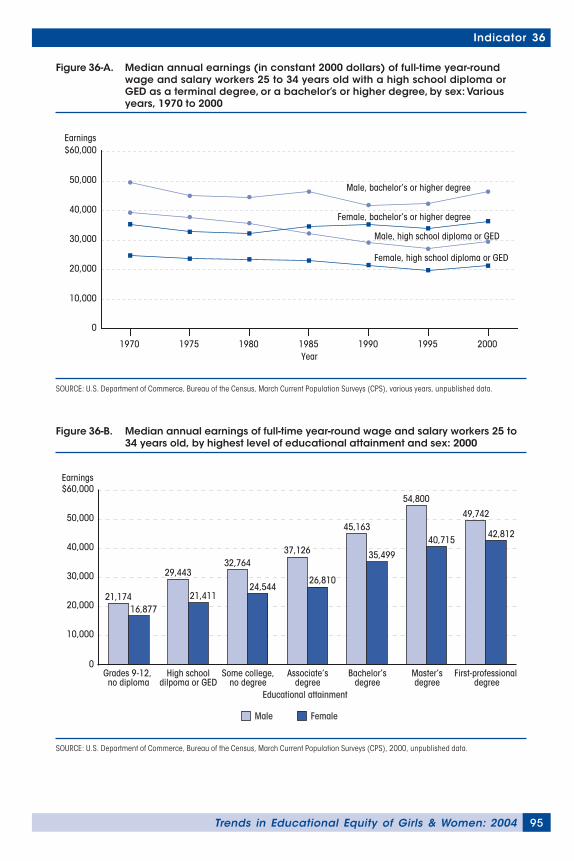
95Trends in Educational Equity of Girls & Women: 2004
Indicator 36
Figure 36-A. Median annual earnings (in constant 2000 dollars) of full-time year-roundwage and salary workers 25 to 34 years old with a high school diploma orGED as a terminal degree, or a bachelor’s or higher degree, by sex: Variousyears, 1970 to 2000
SOURCE: U.S. Department of Commerce, Bureau of the Census, March Current Population Surveys (CPS), various years, unpublished data.
Earnings
Male, bachelor’s or higher degree
Male, high school diploma or GED
Female, bachelor’s or higher degree
Female, high school diploma or GED
1970 1975 1980 1985 1990 1995 2000
0
10,000
20,000
30,000
40,000
50,000
$60,000
Year
Figure 36-B. Median annual earnings of full-time year-round wage and salary workers 25 to34 years old, by highest level of educational attainment and sex: 2000
SOURCE: U.S. Department of Commerce, Bureau of the Census, March Current Population Surveys (CPS), 2000, unpublished data.
Earnings
MaleMale FemaleFemale
Educational attainmentEducational attainment
Grades 9-12, no diploma
High school dilpoma or GED
Some college, no degree
Associate’s degree
Bachelor’s degree
Master’sdegree
First-professional degree
10,000
0
20,000
30,000
40,000
50,000
$60,000
21,17416,877
29,443
21,411
32,764
24,544
37,126
26,810
45,163
35,499
54,800
40,715
49,742
42,812
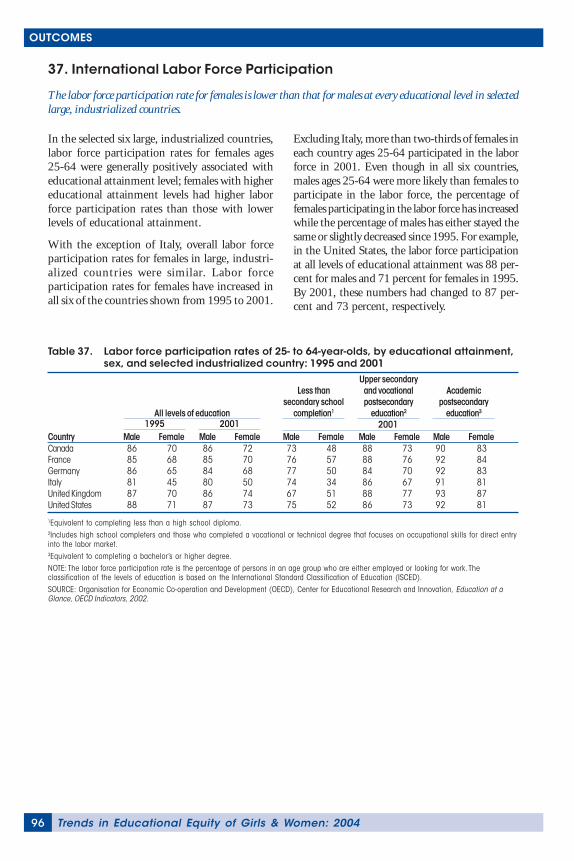
Trends in Educational Equity of Girls & Women: 200496
OUTCOMES
37. International Labor Force Participation
The labor force participation rate for females is lower than that for males at every educational level in selectedlarge, industrialized countries.
In the selected six large, industrialized countries,labor force participation rates for females ages25-64 were generally positively associated witheducational attainment level; females with highereducational attainment levels had higher laborforce participation rates than those with lowerlevels of educational attainment.
With the exception of Italy, overall labor forceparticipation rates for females in large, industri-alized countries were similar. Labor forceparticipation rates for females have increased inall six of the countries shown from 1995 to 2001.
Excluding Italy, more than two-thirds of females ineach country ages 25-64 participated in the laborforce in 2001. Even though in all six countries,males ages 25-64 were more likely than females toparticipate in the labor force, the percentage offemales participating in the labor force has increasedwhile the percentage of males has either stayed thesame or slightly decreased since 1995. For example,in the United States, the labor force participationat all levels of educational attainment was 88 per-cent for males and 71 percent for females in 1995.By 2001, these numbers had changed to 87 per-cent and 73 percent, respectively.
Table 37. Labor force participation rates of 25- to 64-year-olds, by educational attainment,sex, and selected industrialized country: 1995 and 2001
Country Male Female Male Female Male Female Male Female Male FemaleCanada 86 70 86 72 73 48 88 73 90 83France 85 68 85 70 76 57 88 76 92 84Germany 86 65 84 68 77 50 84 70 92 83Italy 81 45 80 50 74 34 86 67 91 81United Kingdom 87 70 86 74 67 51 88 77 93 87United States 88 71 87 73 75 52 86 73 92 81
1Equivalent to completing less than a high school diploma.2Includes high school completers and those who completed a vocational or technical degree that focuses on occupational skills for direct entryinto the labor market.3Equivalent to completing a bachelor’s or higher degree.NOTE: The labor force participation rate is the percentage of persons in an age group who are either employed or looking for work. Theclassification of the levels of education is based on the International Standard Classification of Education (ISCED).SOURCE: Organisation for Economic Co-operation and Development (OECD), Center for Educational Research and Innovation, Education at aGlance, OECD Indicators, 2002.
2001All levels of education
Less thansecondary school
completion1
Upper secondaryand vocationalpostsecondary
education2
Academicpostsecondary
education3
1995 2001
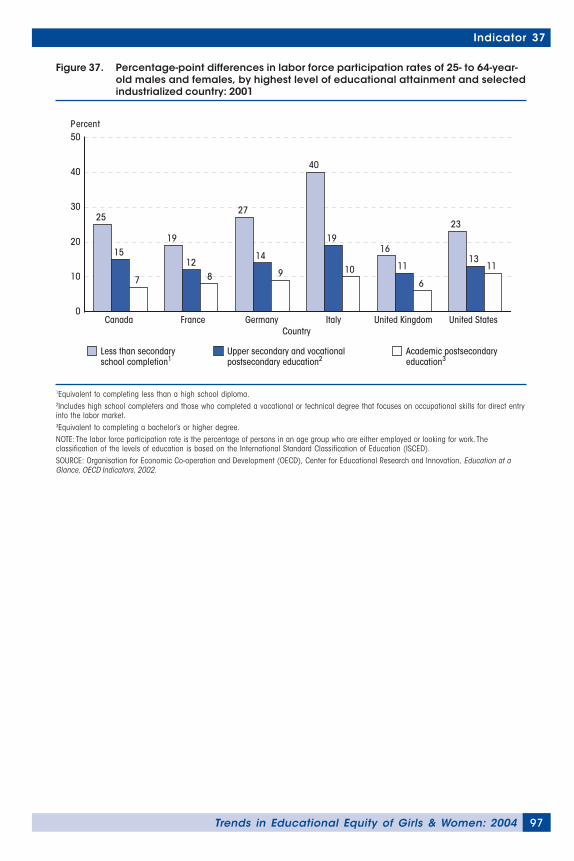
97Trends in Educational Equity of Girls & Women: 2004
Indicator 37
Figure 37. Percentage-point differences in labor force participation rates of 25- to 64-year-old males and females, by highest level of educational attainment and selectedindustrialized country: 2001
1Equivalent to completing less than a high school diploma.2Includes high school completers and those who completed a vocational or technical degree that focuses on occupational skills for direct entryinto the labor market.3Equivalent to completing a bachelor’s or higher degree.NOTE: The labor force participation rate is the percentage of persons in an age group who are either employed or looking for work. Theclassification of the levels of education is based on the International Standard Classification of Education (ISCED).SOURCE: Organisation for Economic Co-operation and Development (OECD), Center for Educational Research and Innovation, Education at aGlance, OECD Indicators, 2002.
Percent
CountryCanada France Germany Italy United States
25
15
7
19
128
27
14
9
40
19
10
16
11
6
23
1311
0
10
20
30
40
50
United Kingdom
Less than secondary school completion1
Upper secondary and vocational postsecondary education2
Academic postsecondary education3
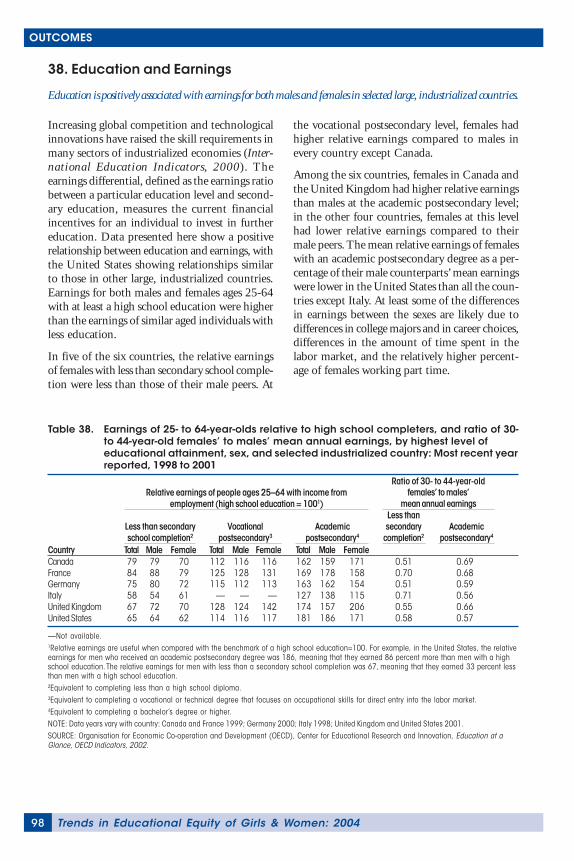
Trends in Educational Equity of Girls & Women: 200498
OUTCOMES
38. Education and Earnings
Education is positively associated with earnings for both males and females in selected large, industrialized countries.
Increasing global competition and technologicalinnovations have raised the skill requirements inmany sectors of industrialized economies (Inter-national Education Indicators, 2000). Theearnings differential, defined as the earnings ratiobetween a particular education level and second-ary education, measures the current financialincentives for an individual to invest in furthereducation. Data presented here show a positiverelationship between education and earnings, withthe United States showing relationships similarto those in other large, industrialized countries.Earnings for both males and females ages 25-64with at least a high school education were higherthan the earnings of similar aged individuals withless education.
In five of the six countries, the relative earningsof females with less than secondary school comple-tion were less than those of their male peers. At
the vocational postsecondary level, females hadhigher relative earnings compared to males inevery country except Canada.
Among the six countries, females in Canada andthe United Kingdom had higher relative earningsthan males at the academic postsecondary level;in the other four countries, females at this levelhad lower relative earnings compared to theirmale peers. The mean relative earnings of femaleswith an academic postsecondary degree as a per-centage of their male counterparts’ mean earningswere lower in the United States than all the coun-tries except Italy. At least some of the differencesin earnings between the sexes are likely due todifferences in college majors and in career choices,differences in the amount of time spent in thelabor market, and the relatively higher percent-age of females working part time.
Table 38. Earnings of 25- to 64-year-olds relative to high school completers, and ratio of 30-to 44-year-old females’ to males’ mean annual earnings, by highest level ofeducational attainment, sex, and selected industrialized country: Most recent yearreported, 1998 to 2001
Country Total Male Female Total Male Female Total Male FemaleCanada 79 79 70 112 116 116 162 159 171 0.51 0.69France 84 88 79 125 128 131 169 178 158 0.70 0.68Germany 75 80 72 115 112 113 163 162 154 0.51 0.59Italy 58 54 61 — — — 127 138 115 0.71 0.56United Kingdom 67 72 70 128 124 142 174 157 206 0.55 0.66United States 65 64 62 114 116 117 181 186 171 0.58 0.57
—Not available.1Relative earnings are useful when compared with the benchmark of a high school education=100. For example, in the United States, the relativeearnings for men who received an academic postsecondary degree was 186, meaning that they earned 86 percent more than men with a highschool education. The relative earnings for men with less than a secondary school completion was 67, meaning that they earned 33 percent lessthan men with a high school education.2Equivalent to completing less than a high school diploma.3Equivalent to completing a vocational or technical degree that focuses on occupational skills for direct entry into the labor market.4Equivalent to completing a bachelor’s degree or higher.NOTE: Data years vary with country: Canada and France 1999; Germany 2000; Italy 1998; United Kingdom and United States 2001.SOURCE: Organisation for Economic Co-operation and Development (OECD), Center for Educational Research and Innovation, Education at aGlance, OECD Indicators, 2002.
Relative earnings of people ages 25–64 with income fromemployment (high school education = 1001)
Ratio of 30- to 44-year-oldfemales’ to males’
mean annual earnings
Academicpostsecondary4
Less than secondaryschool completion2
Vocationalpostsecondary3
Academicpostsecondary4
Less thansecondary
completion2
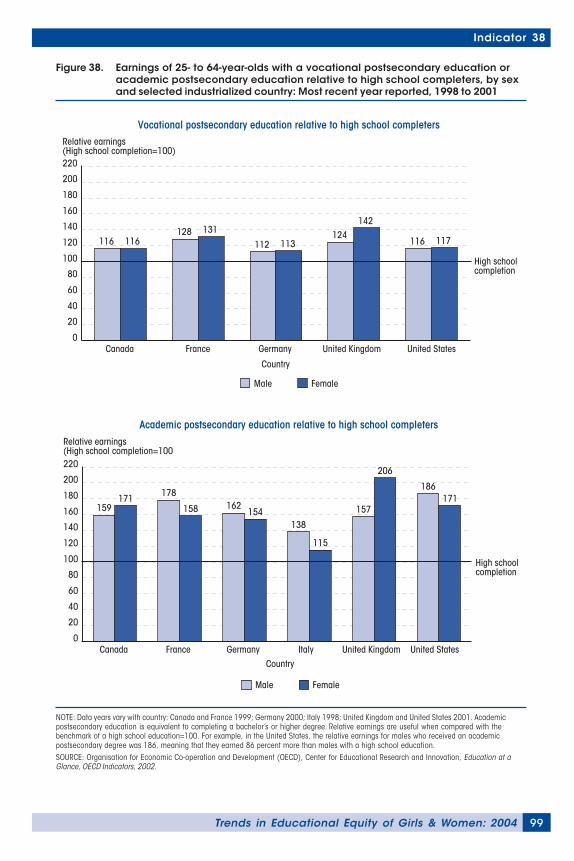
99Trends in Educational Equity of Girls & Women: 2004
Indicator 38
Figure 38. Earnings of 25- to 64-year-olds with a vocational postsecondary education oracademic postsecondary education relative to high school completers, by sexand selected industrialized country: Most recent year reported, 1998 to 2001
NOTE: Data years vary with country: Canada and France 1999; Germany 2000; Italy 1998; United Kingdom and United States 2001. Academicpostsecondary education is equivalent to completing a bachelor’s or higher degree. Relative earnings are useful when compared with thebenchmark of a high school education=100. For example, in the United States, the relative earnings for males who received an academicpostsecondary degree was 186, meaning that they earned 86 percent more than males with a high school education.SOURCE: Organisation for Economic Co-operation and Development (OECD), Center for Educational Research and Innovation, Education at aGlance, OECD Indicators, 2002.
Relative earnings (High school completion=100)
Male Female
Country
Canada France Germany United Kingdom United States
116 116128 131
112 113124
142
116 117
0
20
40
60
80
100
120
140
160
180
200
220
High school completion
Relative earnings (High school completion=100
Male Female
CountryCanada France Germany Italy United Kingdom United States
159171 178
158 162154
138
115
157
206
186171
0
20
40
60
80
100
120
140
160
180
200
220
High schoolcompletion
Vocational postsecondary education relative to high school completers
Academic postsecondary education relative to high school completers


101Trends in Educational Equity of Girls & Women: 2004
APPENDIX A: SUPPLEMENTAL TABLES
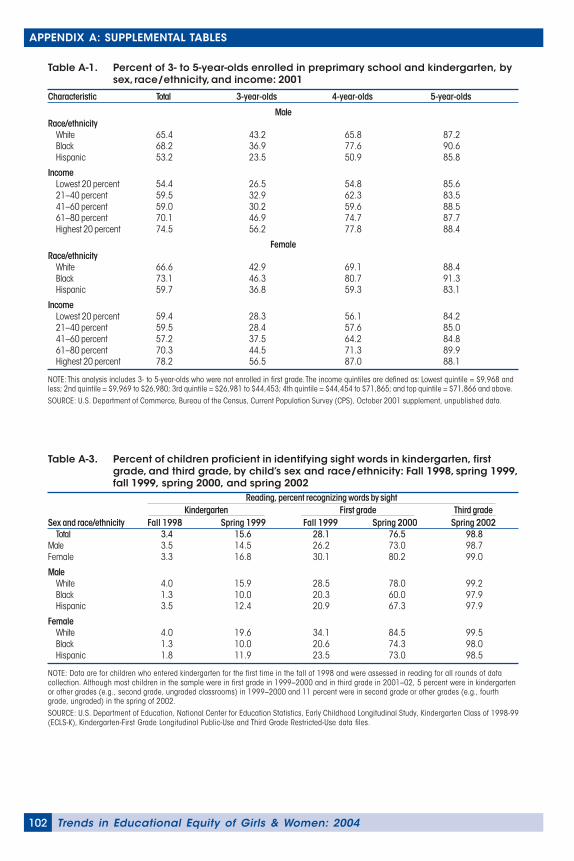
Trends in Educational Equity of Girls & Women: 2004102
APPENDIX A: SUPPLEMENTAL TABLES
Table A-1. Percent of 3- to 5-year-olds enrolled in preprimary school and kindergarten, bysex, race/ethnicity, and income: 2001
Characteristic Total 3-year-olds 4-year-olds 5-year-olds
MaleRace/ethnicity
White 65.4 43.2 65.8 87.2Black 68.2 36.9 77.6 90.6Hispanic 53.2 23.5 50.9 85.8
IncomeLowest 20 percent 54.4 26.5 54.8 85.621–40 percent 59.5 32.9 62.3 83.541–60 percent 59.0 30.2 59.6 88.561–80 percent 70.1 46.9 74.7 87.7Highest 20 percent 74.5 56.2 77.8 88.4
FemaleRace/ethnicity
White 66.6 42.9 69.1 88.4Black 73.1 46.3 80.7 91.3Hispanic 59.7 36.8 59.3 83.1
IncomeLowest 20 percent 59.4 28.3 56.1 84.221–40 percent 59.5 28.4 57.6 85.041–60 percent 57.2 37.5 64.2 84.861–80 percent 70.3 44.5 71.3 89.9Highest 20 percent 78.2 56.5 87.0 88.1
NOTE: This analysis includes 3- to 5-year-olds who were not enrolled in first grade. The income quintiles are defined as: Lowest quintile = $9,968 andless; 2nd quintile = $9,969 to $26,980; 3rd quintile = $26,981 to $44,453; 4th quintile = $44,454 to $71,865; and top quintile = $71,866 and above.SOURCE: U.S. Department of Commerce, Bureau of the Census, Current Population Survey (CPS), October 2001 supplement, unpublished data.
Reading, percent recognizing words by sightKindergarten First grade Third grade
Table A-3. Percent of children proficient in identifying sight words in kindergarten, firstgrade, and third grade, by child’s sex and race/ethnicity: Fall 1998, spring 1999,fall 1999, spring 2000, and spring 2002
Sex and race/ethnicity Fall 1998 Spring 1999 Fall 1999 Spring 2000 Spring 2002Total 3.4 15.6 28.1 76.5 98.8
Male 3.5 14.5 26.2 73.0 98.7Female 3.3 16.8 30.1 80.2 99.0
MaleWhite 4.0 15.9 28.5 78.0 99.2Black 1.3 10.0 20.3 60.0 97.9Hispanic 3.5 12.4 20.9 67.3 97.9
FemaleWhite 4.0 19.6 34.1 84.5 99.5Black 1.3 10.0 20.6 74.3 98.0Hispanic 1.8 11.9 23.5 73.0 98.5
NOTE: Data are for children who entered kindergarten for the first time in the fall of 1998 and were assessed in reading for all rounds of datacollection. Although most children in the sample were in first grade in 1999–2000 and in third grade in 2001–02, 5 percent were in kindergartenor other grades (e.g., second grade, ungraded classrooms) in 1999–2000 and 11 percent were in second grade or other grades (e.g., fourthgrade, ungraded) in the spring of 2002.SOURCE: U.S. Department of Education, National Center for Education Statistics, Early Childhood Longitudinal Study, Kindergarten Class of 1998-99(ECLS-K), Kindergarten-First Grade Longitudinal Public-Use and Third Grade Restricted-Use data files.
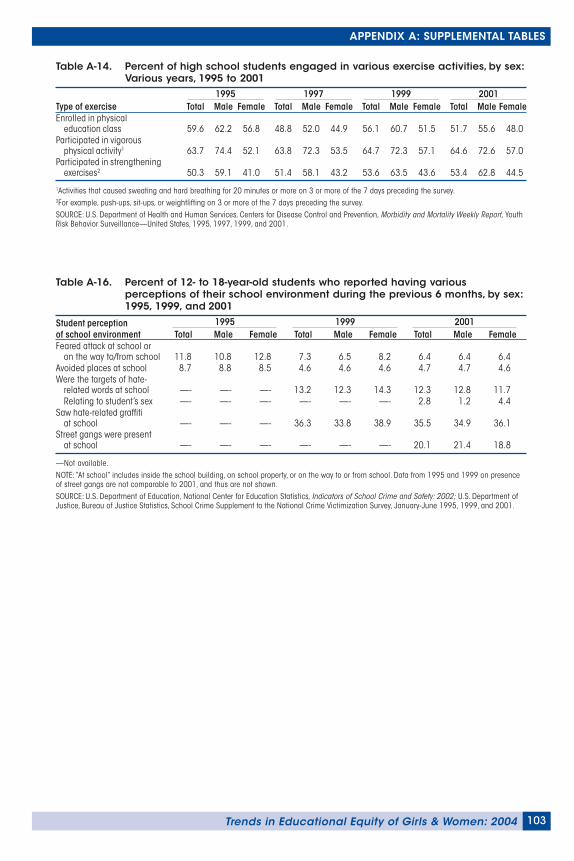
APPENDIX A: SUPPLEMENTAL TABLES
103Trends in Educational Equity of Girls & Women: 2004
Table A-14. Percent of high school students engaged in various exercise activities, by sex:Various years, 1995 to 2001
Type of exercise Total Male Female Total Male Female Total Male Female Total Male FemaleEnrolled in physical
education class 59.6 62.2 56.8 48.8 52.0 44.9 56.1 60.7 51.5 51.7 55.6 48.0Participated in vigorous
physical activity1 63.7 74.4 52.1 63.8 72.3 53.5 64.7 72.3 57.1 64.6 72.6 57.0Participated in strengthening
exercises2 50.3 59.1 41.0 51.4 58.1 43.2 53.6 63.5 43.6 53.4 62.8 44.5
1Activities that caused sweating and hard breathing for 20 minutes or more on 3 or more of the 7 days preceding the survey.2For example, push-ups, sit-ups, or weightlifting on 3 or more of the 7 days preceding the survey.SOURCE: U.S. Department of Health and Human Services, Centers for Disease Control and Prevention, Morbidity and Mortality Weekly Report, YouthRisk Behavior Surveillance—United States, 1995, 1997, 1999, and 2001.
200119971995 1999
Table A-16. Percent of 12- to 18-year-old students who reported having variousperceptions of their school environment during the previous 6 months, by sex:1995, 1999, and 2001
Student perceptionof school environment Total Male Female Total Male Female Total Male FemaleFeared attack at school or
on the way to/from school 11.8 10.8 12.8 7.3 6.5 8.2 6.4 6.4 6.4Avoided places at school 8.7 8.8 8.5 4.6 4.6 4.6 4.7 4.7 4.6Were the targets of hate-
related words at school —- —- —- 13.2 12.3 14.3 12.3 12.8 11.7Relating to student’s sex —- —- —- —- —- —- 2.8 1.2 4.4
Saw hate-related graffitiat school —- —- —- 36.3 33.8 38.9 35.5 34.9 36.1
Street gangs were presentat school —- —- —- —- —- —- 20.1 21.4 18.8
—Not available.NOTE: “At school” includes inside the school building, on school property, or on the way to or from school. Data from 1995 and 1999 on presenceof street gangs are not comparable to 2001, and thus are not shown.SOURCE: U.S. Department of Education, National Center for Education Statistics, Indicators of School Crime and Safety: 2002; U.S. Department ofJustice, Bureau of Justice Statistics, School Crime Supplement to the National Crime Victimization Survey, January-June 1995, 1999, and 2001.
1995 1999 2001
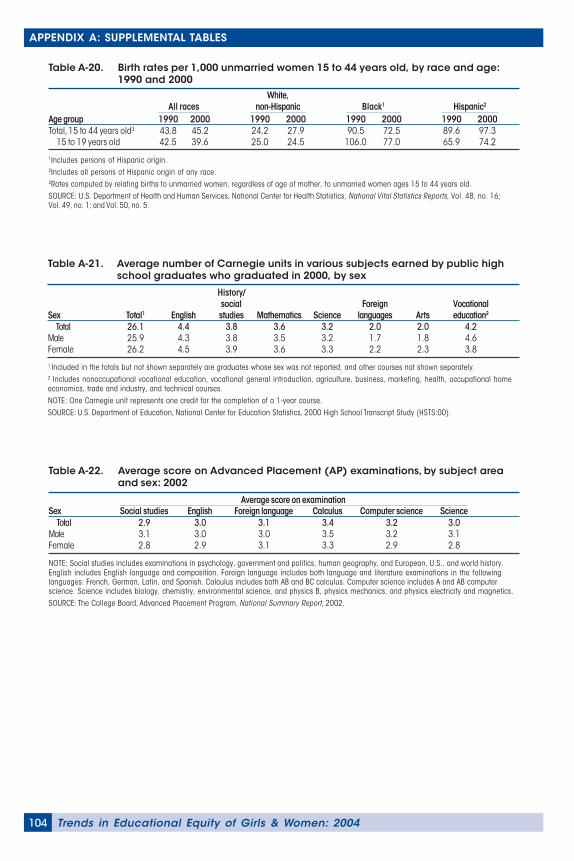
Trends in Educational Equity of Girls & Women: 2004104
APPENDIX A: SUPPLEMENTAL TABLES
Table A-22. Average score on Advanced Placement (AP) examinations, by subject areaand sex: 2002
Sex Social studies English Foreign language Calculus Computer science ScienceTotal 2.9 3.0 3.1 3.4 3.2 3.0
Male 3.1 3.0 3.0 3.5 3.2 3.1Female 2.8 2.9 3.1 3.3 2.9 2.8
NOTE: Social studies includes examinations in psychology, government and politics, human geography, and European, U.S., and world history.English includes English language and composition. Foreign language includes both language and literature examinations in the followinglanguages: French, German, Latin, and Spanish. Calculus includes both AB and BC calculus. Computer science includes A and AB computerscience. Science includes biology, chemistry, environmental science, and physics B, physics mechanics, and physics electricity and magnetics.SOURCE: The College Board, Advanced Placement Program, National Summary Report, 2002.
Average score on examination
Table A-20. Birth rates per 1,000 unmarried women 15 to 44 years old, by race and age:1990 and 2000
Age group 1990 2000 1990 2000 1990 2000 1990 2000Total, 15 to 44 years old3 43.8 45.2 24.2 27.9 90.5 72.5 89.6 97.3
15 to 19 years old 42.5 39.6 25.0 24.5 106.0 77.0 65.9 74.2
1Includes persons of Hispanic origin.2Includes all persons of Hispanic origin of any race.3Rates computed by relating births to unmarried women, regardless of age of mother, to unmarried women ages 15 to 44 years old.SOURCE: U.S. Department of Health and Human Services, National Center for Health Statistics, National Vital Statistics Reports, Vol. 48, no. 16;Vol. 49, no. 1; and Vol. 50, no. 5.
White,non-Hispanic Black1 Hispanic2All races
Table A-21. Average number of Carnegie units in various subjects earned by public highschool graduates who graduated in 2000, by sex
History/social Foreign Vocational
Sex Total1 English studies Mathematics Science languages Arts education2
Total 26.1 4.4 3.8 3.6 3.2 2.0 2.0 4.2Male 25.9 4.3 3.8 3.5 3.2 1.7 1.8 4.6Female 26.2 4.5 3.9 3.6 3.3 2.2 2.3 3.8
1 Included in the totals but not shown separately are graduates whose sex was not reported, and other courses not shown separately.2 Includes nonoccupational vocational education, vocational general introduction, agriculture, business, marketing, health, occupational homeeconomics, trade and industry, and technical courses.NOTE: One Carnegie unit represents one credit for the completion of a 1-year course.SOURCE: U.S. Department of Education, National Center for Education Statistics, 2000 High School Transcript Study (HSTS:00).
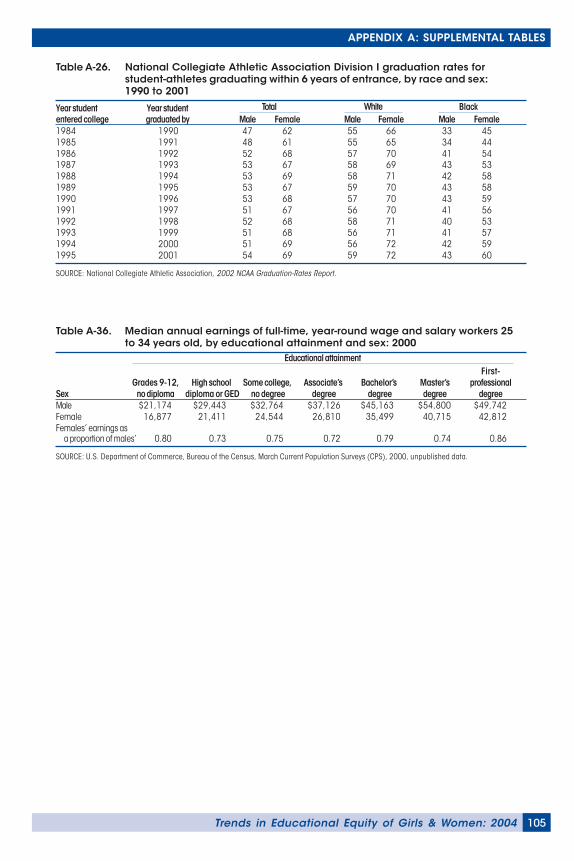
APPENDIX A: SUPPLEMENTAL TABLES
105Trends in Educational Equity of Girls & Women: 2004
Table A-36. Median annual earnings of full-time, year-round wage and salary workers 25to 34 years old, by educational attainment and sex: 2000
First-Grades 9-12, High school Some college, Associate’s Bachelor’s Master’s professional
Sex no diploma diploma or GED no degree degree degree degree degreeMale $21,174 $29,443 $32,764 $37,126 $45,163 $54,800 $49,742Female 16,877 21,411 24,544 26,810 35,499 40,715 42,812Females’ earnings as
a proportion of males’ 0.80 0.73 0.75 0.72 0.79 0.74 0.86
SOURCE: U.S. Department of Commerce, Bureau of the Census, March Current Population Surveys (CPS), 2000, unpublished data.
Educational attainment
Table A-26. National Collegiate Athletic Association Division I graduation rates forstudent-athletes graduating within 6 years of entrance, by race and sex:1990 to 2001
Year student Year studententered college graduated by Male Female Male Female Male Female1984 1990 47 62 55 66 33 451985 1991 48 61 55 65 34 441986 1992 52 68 57 70 41 541987 1993 53 67 58 69 43 531988 1994 53 69 58 71 42 581989 1995 53 67 59 70 43 581990 1996 53 68 57 70 43 591991 1997 51 67 56 70 41 561992 1998 52 68 58 71 40 531993 1999 51 68 56 71 41 571994 2000 51 69 56 72 42 591995 2001 54 69 59 72 43 60
SOURCE: National Collegiate Athletic Association, 2002 NCAA Graduation-Rates Report.
Total White Black


107Trends in Educational Equity of Girls & Women: 2004
BIBLIOGRAPHY
Trends in Educational Equity of Girls & Women: 2004108
BIBLIOGRAPHY
NCES Publications (Complete Citation)Baldi, S., Khalaf, G., Perie, M., and Sherman, J.D. (2000). International Education Indicators:
A Time Series Perspective, 1985–1995 (NCES 2000-021). U.S. Department of Education, NCES.Washington, DC: U.S. Government Printing Office.
DeBell, M., and Chapman, C. (2004). Computer and Internet Use by Children and Adolescents in 2001(NCES 2004-014). U.S. Department of Education, NCES. Washington, DC: U.S. GovernmentPrinting Office.
Kaufman, P., Alt, M.N., and Chapman, C. (2001). Dropout Rates in the United States: 2000 (NCES2002-114). U.S. Department of Education, NCES. Washington, DC: 2000: U.S. GovernmentPrinting Office.
U.S. Department of Education, NCES. (1997). The Condition of Education 1997 (NCES 97-388).Washington, DC: U.S. Government Printing Office.
U.S. Department of Education, NCES. (2001). The Condition of Education 2001 (NCES 2001-072).Washington, DC: U.S. Government Printing Office.
U.S. Department of Education, NCES. (2001). The Nation’s Report Card: Mathematics 2000 (NCES2001-517). Washington, DC: U.S. Government Printing Office.
U.S. Department of Education, NCES. (2002). The Condition of Education 2002 (NCES 2002-025).Washington, DC: U.S. Government Printing Office.
U.S. Department of Education, NCES. (2003). Digest of Education Statistics 2002 (NCES 2003-060).Washington, DC: U.S. Government Printing Office.
NCES Publications (Chronologically, by NCES Number)NCES 97-388: U.S. Department of Education, NCES. (1997). The Condition of Education 1997.
NCES 2000-021: Baldi, S., Khalaf, G., Perie, M., and Sherman, J.D. (2000). International EducationIndicators: A Time Series Perspective, 1985–1995.
NCES 2001-072: U.S. Department of Education, NCES. (2001). The Condition of Education 2001.
NCES 2001-517: U.S. Department of Education, NCES. (2001). The Nation’s Report Card: Mathematics2000.
NCES 2002-025: U.S. Department of Education, NCES. (2002). The Condition of Education 2002.
NCES 2002-114: Kaufman, P., Alt, M.N., and Chapman, C. (2001). Dropout Rates in the United States:2000.
NCES 2003-060: U.S. Department of Education, NCES. (2003). Digest of Education Statistics 2002.
NCES 2004-014: DeBell, M., and Chapman, C. (2004). Computer and Internet Use by Children andAdolescents in 2001.
Other Publications and SourcesBarnett, S. (1995). Long-Term Effects on Cognitive Development and School Success. The Future of
Children, 5 (3): 25-50.
College Entrance Examination Board. (2002). AP 2002 National Summary Report. New York, NY:College Board.
BIBLIOGRAPHY
109Trends in Educational Equity of Girls & Women: 2004
Haskins, R. (1989). Beyond Metaphor: The Efficacy of Early Childhood Education. AmericanPsychologist, 44 (2): 274-282.
Love, M., Schochet, P., Meckstroth, A. (1996). Are They in Any Real Danger? What Research Does—and Doesn’t—Tell Us About Child Care Quality and Children’s Well-Being. Princeton, NJ: MathematicaPolicy Research, Inc.
Moss, B., and Fawcett, G. (1995). Bringing the Curriculum of the World of the Home to the School.Reading & Writing Quarterly: Overcoming Learning Difficulties, 11: 247-256.
Organisation for Economic Co-operation and Development, Education at a Glance, OECD Indicators,2002. Paris: OECD.
Snow, C.E., Burns, M.S., and Griffin, P. (Eds.). (1998). Preventing Reading Difficulties in YoungChildren. Washington, DC: National Academy Press.
U.S. Departments of Health and Human Services and Education (Fall 2000). Promoting Better Healthfor Young People Through Physical Activity and Sports: A Report to the President. Washington, DC:U.S. Government Printing Office.